red hat cloudforms 4...red hat cloudforms 4.2 monitoring, alerts, and reporting creating and...
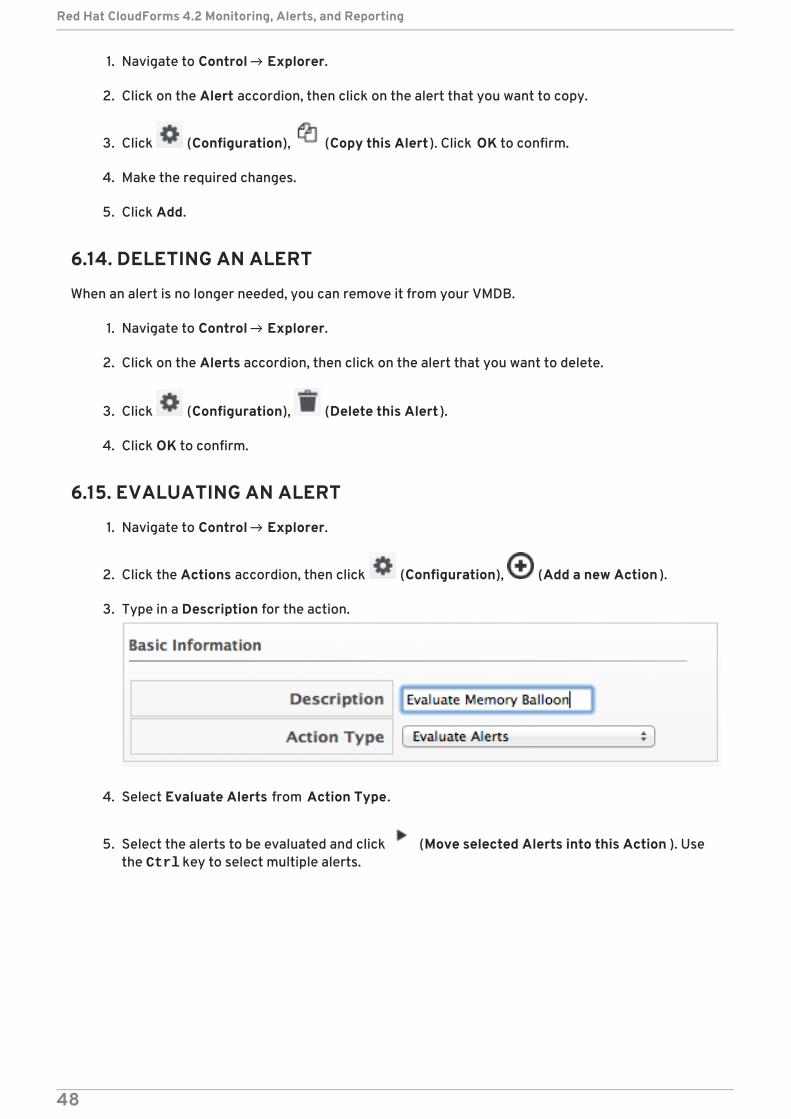
TRANSCRIPT
Red Hat CloudForms 4.2
Monitoring, Alerts, and Reporting
Creating and managing reports, feeds, and widgets in Red Hat CloudForms
Last Updated: 2017-12-18

Red Hat CloudForms 4.2 Monitoring, Alerts, and Reporting
Creating and managing reports, feeds, and widgets in Red Hat CloudForms
Red Hat CloudForms Documentation [email protected]
Legal Notice
Copyright © 2017 Red Hat, Inc.
The text of and illustrations in this document are licensed by Red Hat under a Creative CommonsAttribution–Share Alike 3.0 Unported license ("CC-BY-SA"). An explanation of CC-BY-SA isavailable athttp://creativecommons.org/licenses/by-sa/3.0/. In accordance with CC-BY-SA, if you distribute this document or an adaptation of it, you mustprovide the URL for the original version.
Red Hat, as the licensor of this document, waives the right to enforce, and agrees not to assert,Section 4d of CC-BY-SA to the fullest extent permitted by applicable law.
Red Hat, Red Hat Enterprise Linux, the Shadowman logo, JBoss, OpenShift, Fedora, the Infinitylogo, and RHCE are trademarks of Red Hat, Inc., registered in the United States and othercountries.
Linux ® is the registered trademark of Linus Torvalds in the United States and other countries.
Java ® is a registered trademark of Oracle and/or its affiliates.
XFS ® is a trademark of Silicon Graphics International Corp. or its subsidiaries in the UnitedStates and/or other countries.
MySQL ® is a registered trademark of MySQL AB in the United States, the European Union andother countries.
Node.js ® is an official trademark of Joyent. Red Hat Software Collections is not formally relatedto or endorsed by the official Joyent Node.js open source or commercial project.
The OpenStack ® Word Mark and OpenStack logo are either registered trademarks/service marksor trademarks/service marks of the OpenStack Foundation, in the United States and othercountries and are used with the OpenStack Foundation's permission. We are not affiliated with,endorsed or sponsored by the OpenStack Foundation, or the OpenStack community.
All other trademarks are the property of their respective owners.
Abstract
This guide provides instructions for creating and managing reports, feeds, and widgets in Red HatCloudForms. It also includes information on accessing usage and timeline data, and chargebackcosts. This information supports better information technology decision making and predictionsfor future virtual machine management. If you have a suggestion for improving this guide or havefound an error, please submit a Bugzilla report at http://bugzilla.redhat.com against Red Hat

CloudForms Management Engine for the Documentation component. Please provide specificdetails, such as the section number, guide name, and CloudForms version so we can easily locatethe content.
. . . . . . . . . . . . . . . . . . . . . . . . . . . . . . . . . . . . . . . . . . . . . . . . . . . . . . . . . . . . . . . . . . . . . . . . . . . . . . . . . . . . . . . . . . . . . . . . . . . . . . . . . . . . . . . . . . . . . . . . . . . . . . . . . . . . . . . . . . . . . . . . . . . . . . . . . . . . . . . . . . . . . . . . . . . . . . . . . . . . . . . . . . . . . . . . . . . . . . . . . . . . . . . . . . . . . . . . . . . . . . . . . . . . . . . . . . . . . . . . . . . . . . . . . . . . . . . . . . . . . . . . . . . . . . . . . . . . . . . .
. . . . . . . . . . . . . . . . . . . . . . . . . . . . . . . . . . . . . . . . . . . . . . . . . . . . . . . . . . . . . . . . . . . . . . . . . . . . . . . . . . . . . . . . . . . . . . . . . . . . . . . . . . . . . . . . . . . . . . . . . . . . . . . . . . . . . . . . . . . . . . . . . . . . . . . . . . . . . . . . . . . . . . . . . . . . . . . . . . . . . . . . . . . . . . . . . . . . . . . . . . . . . . . . . . . . . . . . . . . . . . . . . . . . . . . . . . . . . . . . . . . . . . . . . . . . . . . . . . . . . . . . . . . . . . . . . . . . . . . .
. . . . . . . . . . . . . . . . . . . . . . . . . . . . . . . . . . . . . . . . . . . . . . . . . . . . . . . . . . . . . . . . . . . . . . . . . . . . . . . . . . . . . . . . . . . . . . . . . . . . . . . . . . . . . . . . . . . . . . . . . . . . . . . . . . . . . . . . . . . . . . . . . . . . . . . . . . . . . . . . . . . . . . . . . . . . . . . . . . . . . . . . . . . . . . . . . . . . . . . . . . . . . . . . . . . . . . . . . . . . . . . . . . . . . . . . . . . . . . . . . . . . . . . . . . . . . . . . . . . . . . . . . . . . . . . . . . . . . . . .
. . . . . . . . . . . . . . . . . . . . . . . . . . . . . . . . . . . . . . . . . . . . . . . . . . . . . . . . . . . . . . . . . . . . . . . . . . . . . . . . . . . . . . . . . . . . . . . . . . . . . . . . . . . . . . . . . . . . . . . . . . . . . . . . . . . . . . . . . . . . . . . . . . . . . . . . . . . . . . . . . . . . . . . . . . . . . . . . . . . . . . . . . . . . . . . . . . . . . . . . . . . . . . . . . . . . . . . . . . . . . . . . . . . . . . . . . . . . . . . . . . . . . . . . . . . . . . . . . . . . . . . . . . . . . . . . . . . . . . . .
Table of Contents
CHAPTER 1. CLOUD INTELLIGENCE DASHBOARD1.1. ADDING A WIDGET1.2. RESETTING TO THE DEFAULT SET OF WIDGETS1.3. REMOVING A WIDGET1.4. ZOOMING IN TO A CHART WIDGET1.5. OPENING A CHART OR REPORT WIDGET IN FULL SCREEN VIEW1.6. MINIMIZING OR MAXIMIZING A WIDGET1.7. DOWNLOADING A REPORT WIDGET AS A FILE
CHAPTER 2. CREATING DASHBOARD WIDGETS2.1. CREATING A REPORT WIDGET2.2. CREATING A CHART WIDGET2.3. CREATING AN RSS FEED WIDGET2.4. CREATING A MENU WIDGET2.5. EDITING A WIDGET2.6. COPYING A WIDGET2.7. DELETING A WIDGET2.8. IMPORTING A WIDGET2.9. EXPORTING A WIDGET2.10. GENERATING WIDGET CONTENT IMMEDIATELY
CHAPTER 3. REPORTS3.1. RUNNING REPORTS
3.1.1. Generating a Single Report3.2. SCHEDULING A REPORT
3.2.1. Modifying a Report Schedule3.2.2. Running a Scheduled Report Immediately
3.3. VIEWING REPORTS3.3.1. Changing Report Views3.3.2. Report Download Buttons3.3.3. Downloading a Report3.3.4. Showing a Report in Full Screen
3.4. ADDING A REPORT3.5. COPYING A REPORT3.6. EDITING A REPORT3.7. DELETING A REPORT3.8. IMPORTING A REPORT3.9. EXPORTING A REPORT3.10. REPORT MENUS
3.10.1. Managing Report Menu Accordions3.11. MANAGING REPORT MENU FOLDERS3.12. ORGANIZING REPORTS IN REPORT MENUS
CHAPTER 4. CHARGEBACK4.1. CHARGEBACK RATES
4.1.1. Memory Used Cost4.1.2. CPU Total Cost4.1.3. CPU Used Cost4.1.4. Storage Allocated Cost4.1.5. Storage Total Cost4.1.6. Storage Used Cost
4.2. CREATING CHARGEBACK RATES
44444555
6678999
10101010
121212131415151515161616232324242424252627
282828292929293030
Table of Contents
1
. . . . . . . . . . . . . . . . . . . . . . . . . . . . . . . . . . . . . . . . . . . . . . . . . . . . . . . . . . . . . . . . . . . . . . . . . . . . . . . . . . . . . . . . . . . . . . . . . . . . . . . . . . . . . . . . . . . . . . . . . . . . . . . . . . . . . . . . . . . . . . . . . . . . . . . . . . . . . . . . . . . . . . . . . . . . . . . . . . . . . . . . . . . . . . . . . . . . . . . . . . . . . . . . . . . . . . . . . . . . . . . . . . . . . . . . . . . . . . . . . . . . . . . . . . . . . . . . . . . . . . . . . . . . . . . . . . . . . . . .
. . . . . . . . . . . . . . . . . . . . . . . . . . . . . . . . . . . . . . . . . . . . . . . . . . . . . . . . . . . . . . . . . . . . . . . . . . . . . . . . . . . . . . . . . . . . . . . . . . . . . . . . . . . . . . . . . . . . . . . . . . . . . . . . . . . . . . . . . . . . . . . . . . . . . . . . . . . . . . . . . . . . . . . . . . . . . . . . . . . . . . . . . . . . . . . . . . . . . . . . . . . . . . . . . . . . . . . . . . . . . . . . . . . . . . . . . . . . . . . . . . . . . . . . . . . . . . . . . . . . . . . . . . . . . . . . . . . . . . . .
. . . . . . . . . . . . . . . . . . . . . . . . . . . . . . . . . . . . . . . . . . . . . . . . . . . . . . . . . . . . . . . . . . . . . . . . . . . . . . . . . . . . . . . . . . . . . . . . . . . . . . . . . . . . . . . . . . . . . . . . . . . . . . . . . . . . . . . . . . . . . . . . . . . . . . . . . . . . . . . . . . . . . . . . . . . . . . . . . . . . . . . . . . . . . . . . . . . . . . . . . . . . . . . . . . . . . . . . . . . . . . . . . . . . . . . . . . . . . . . . . . . . . . . . . . . . . . . . . . . . . . . . . . . . . . . . . . . . . . . .
. . . . . . . . . . . . . . . . . . . . . . . . . . . . . . . . . . . . . . . . . . . . . . . . . . . . . . . . . . . . . . . . . . . . . . . . . . . . . . . . . . . . . . . . . . . . . . . . . . . . . . . . . . . . . . . . . . . . . . . . . . . . . . . . . . . . . . . . . . . . . . . . . . . . . . . . . . . . . . . . . . . . . . . . . . . . . . . . . . . . . . . . . . . . . . . . . . . . . . . . . . . . . . . . . . . . . . . . . . . . . . . . . . . . . . . . . . . . . . . . . . . . . . . . . . . . . . . . . . . . . . . . . . . . . . . . . . . . . . . .
. . . . . . . . . . . . . . . . . . . . . . . . . . . . . . . . . . . . . . . . . . . . . . . . . . . . . . . . . . . . . . . . . . . . . . . . . . . . . . . . . . . . . . . . . . . . . . . . . . . . . . . . . . . . . . . . . . . . . . . . . . . . . . . . . . . . . . . . . . . . . . . . . . . . . . . . . . . . . . . . . . . . . . . . . . . . . . . . . . . . . . . . . . . . . . . . . . . . . . . . . . . . . . . . . . . . . . . . . . . . . . . . . . . . . . . . . . . . . . . . . . . . . . . . . . . . . . . . . . . . . . . . . . . . . . . . . . . . . . . .
. . . . . . . . . . . . . . . . . . . . . . . . . . . . . . . . . . . . . . . . . . . . . . . . . . . . . . . . . . . . . . . . . . . . . . . . . . . . . . . . . . . . . . . . . . . . . . . . . . . . . . . . . . . . . . . . . . . . . . . . . . . . . . . . . . . . . . . . . . . . . . . . . . . . . . . . . . . . . . . . . . . . . . . . . . . . . . . . . . . . . . . . . . . . . . . . . . . . . . . . . . . . . . . . . . . . . . . . . . . . . . . . . . . . . . . . . . . . . . . . . . . . . . . . . . . . . . . . . . . . . . . . . . . . . . . . . . . . . . . .
. . . . . . . . . . . . . . . . . . . . . . . . . . . . . . . . . . . . . . . . . . . . . . . . . . . . . . . . . . . . . . . . . . . . . . . . . . . . . . . . . . . . . . . . . . . . . . . . . . . . . . . . . . . . . . . . . . . . . . . . . . . . . . . . . . . . . . . . . . . . . . . . . . . . . . . . . . . . . . . . . . . . . . . . . . . . . . . . . . . . . . . . . . . . . . . . . . . . . . . . . . . . . . . . . . . . . . . . . . . . . . . . . . . . . . . . . . . . . . . . . . . . . . . . . . . . . . . . . . . . . . . . . . . . . . . . . . . . . . . .
4.2.1. Editing a Chargeback Rate4.2.2. Copying a Chargeback Rate4.2.3. Adding a Chargeback Rate
4.3. ASSIGNING CHARGEBACK RATES4.3.1. Configuring Chargeback for Compute4.3.2. Configuring Chargeback for Storage
4.4. CREATING A CHARGEBACK REPORT
CHAPTER 5. TIMELINES5.1. ACCESSING AND USING A TIMELINE5.2. DOWNLOADING A TIMELINE’S DATA
CHAPTER 6. ALERTS6.1. ASSIGNING THE NOTIFIER ROLE6.2. CREATING AN ALERT6.3. CREATING A HARDWARE RECONFIGURED ALERT6.4. CREATING A NORMAL OPERATING RANGE ALERT6.5. CREATING A REAL TIME PERFORMANCE ALERT6.6. CREATING AN HOURLY PERFORMANCE ALERT6.7. CREATING A HOSTD LOG THRESHOLD ALERT6.8. CREATING A VMWARE ALARM ALERT6.9. CREATING AN EXPRESSION ALERT6.10. CREATE AN OPERATIONAL ALERT6.11. OPERATIONAL ALERT TYPES6.12. EDITING AN ALERT6.13. COPYING AN ALERT6.14. DELETING AN ALERT6.15. EVALUATING AN ALERT
CHAPTER 7. ALERT PROFILES7.1. CREATING ALERT PROFILES7.2. EDITING AN ALERT PROFILE7.3. DELETING AN ALERT PROFILE7.4. ASSIGNING AN ALERT PROFILE
CHAPTER 8. IMPORTING AND EXPORTING8.1. IMPORTING AND EXPORTING POLICIES, POLICY PROFILES, AND ALERTS8.2. EXPORTING A POLICY, POLICY PROFILE, OR AN ALERT
CHAPTER 9. RSS
APPENDIX A. REGULAR EXPRESSIONS
APPENDIX B. REPORTABLE FIELDS IN RED HAT CLOUDFORMS
30313132333333
353535
36363638393940414243444447474848
5050505051
525252
53
54
57
Red Hat CloudForms 4.2 Monitoring, Alerts, and Reporting
2

Table of Contents
3
CHAPTER 1. CLOUD INTELLIGENCE DASHBOARDCloud Intelligence shows your virtual environment’s events, reports, and configurable alerts. Thisinformation supports better information technology decision making and predictions for future virtualmachine management.
When you log in to the console, it brings you directly to the Cloud Intelligence Dashboard page bydefault. The console uses widgets to organize this page, providing you with a default set of commonlyused widgets. The configuration items on these widgets are clickable, allowing you to drill downdirectly to a referenced item.
Customize this page to include the charts, reports, and RSS feeds you specifically want to see as soonas you log in to the console. You can add, remove, move, minimize, zoom into, and maximize widgets.Only users with the proper access can create widgets.
1.1. ADDING A WIDGET
You can add widgets to the dashboard to accommodate the information you want to see upon login.
1. Navigate to Cloud Intel → Dashboard.
2. Click (Add a Widget) .
3. Select the widget you want to add from the list.
NOTE
Only widgets that are not currently showing on the dashboard will appear in this list.
1.2. RESETTING TO THE DEFAULT SET OF WIDGETS
You can reset to default set of widgets according to your needs with the following steps:
1. Navigate to Cloud Intel → Dashboard.
2. Click (Reset Dashboard Widgets to the defaults) .
1.3. REMOVING A WIDGET
You can remove a widget when you no longer need the widget to be displayed in the dashboard.
1. Navigate to Cloud Intel → Dashboard.
2. From the widget that you want to remove, click (Remove from Dashboard) in the upperright corner of the widget.
3. Click OK.
The widget is removed from the dashboard, but it is not deleted. It can be added again if needed.
1.4. ZOOMING IN TO A CHART WIDGET
Red Hat CloudForms 4.2 Monitoring, Alerts, and Reporting
4
1. Navigate to Cloud Intel → Dashboard.
2. From the chart widget that you want to enlarge, click (Zoom in) in the upper right cornerof the widget.
The enlarged chart is opened in its own pop-up window. To close this window, click (Close) in theupper right corner.
1.5. OPENING A CHART OR REPORT WIDGET IN FULL SCREEN VIEW
1. Navigate to Cloud Intelligence → Dashboard.
2. From the chart or report widget that you want to enlarge, click (Full Screen view) in theupper right corner of the widget.
3. Click OK.
1.6. MINIMIZING OR MAXIMIZING A WIDGET
1. Navigate to Cloud Intel → Dashboard.
2. From the chart or report widget that you want to maximize, click (Minimize) or (FullScreen) in the upper right corner of the widget.
1.7. DOWNLOADING A REPORT WIDGET AS A FILE
1. Navigate to Cloud Intel → Dashboard.
2. From the chart or report widget that you want to download as a PDF, click [(DownloadPDF) in the upper right corner of the widget.
3. Click OK.
CHAPTER 1. CLOUD INTELLIGENCE DASHBOARD
5
CHAPTER 2. CREATING DASHBOARD WIDGETS
2.1. CREATING A REPORT WIDGET
1. Navigate to Cloud Intel → Reports.
2. Click on the Dashboard Widgets accordion, then choose the Reports folder.
3. Click (Configuration), then click (Add a new Widget) .
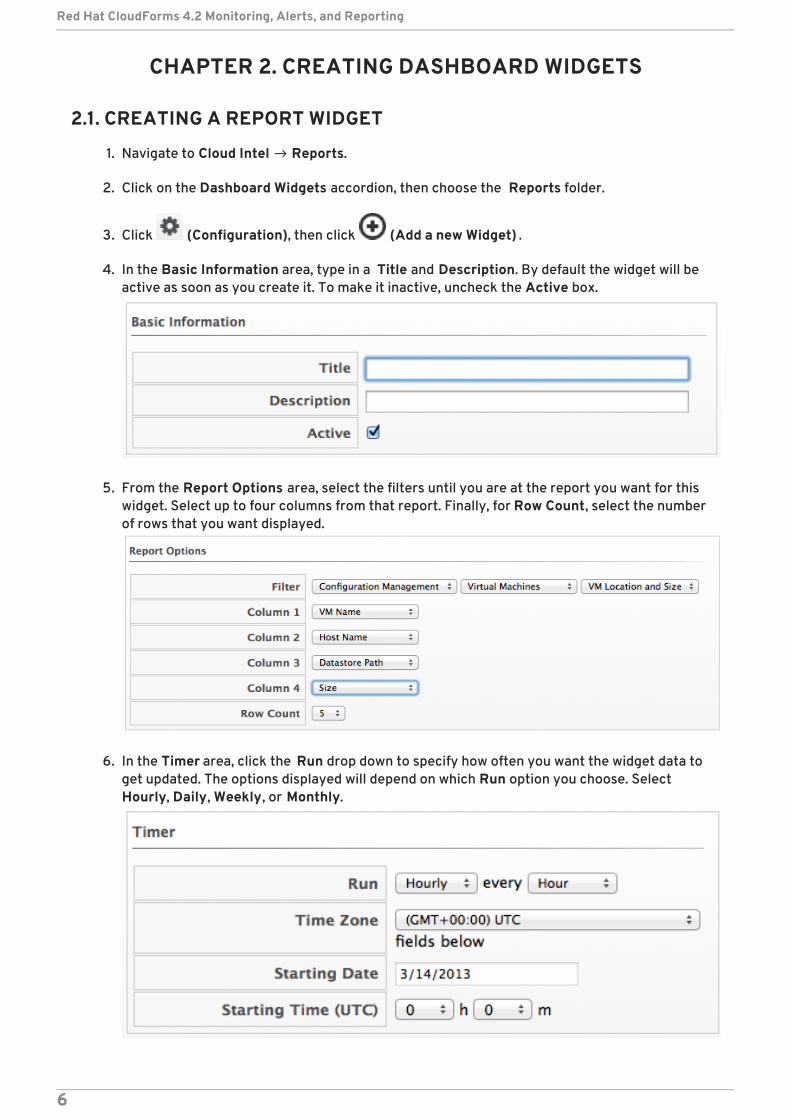
4. In the Basic Information area, type in a Title and Description. By default the widget will beactive as soon as you create it. To make it inactive, uncheck the Active box.
5. From the Report Options area, select the filters until you are at the report you want for thiswidget. Select up to four columns from that report. Finally, for Row Count, select the numberof rows that you want displayed.
6. In the Timer area, click the Run drop down to specify how often you want the widget data toget updated. The options displayed will depend on which Run option you choose. SelectHourly, Daily, Weekly, or Monthly.
Red Hat CloudForms 4.2 Monitoring, Alerts, and Reporting
6
7. Select a Time Zone. Type or select a date to begin the schedule in Starting Date. Select aStarting Time based on a 24 hour clock in the selected time zone.
NOTE
If you change the time zone, you will need to reset the starting date and time.
8. In the Visibility area, select <To All Users> , so that all users can use this widget no matterwhat user role they are assigned. Select <By Role> to assign this widget to specific user roles.Select <By Group> to assign this widget to specific groups.
9. Click Add.
2.2. CREATING A CHART WIDGET
1. Navigate to Cloud Intel → Reports.
2. Click the Dashboard Widgets accordion and click the Charts folder.
3. Click (Configuration), then click (Add a new Widget) .
4. In the Basic Information area, type in a Title and Description. By default the widget will beactive as soon as you create it. To make it inactive, uncheck the Active box.
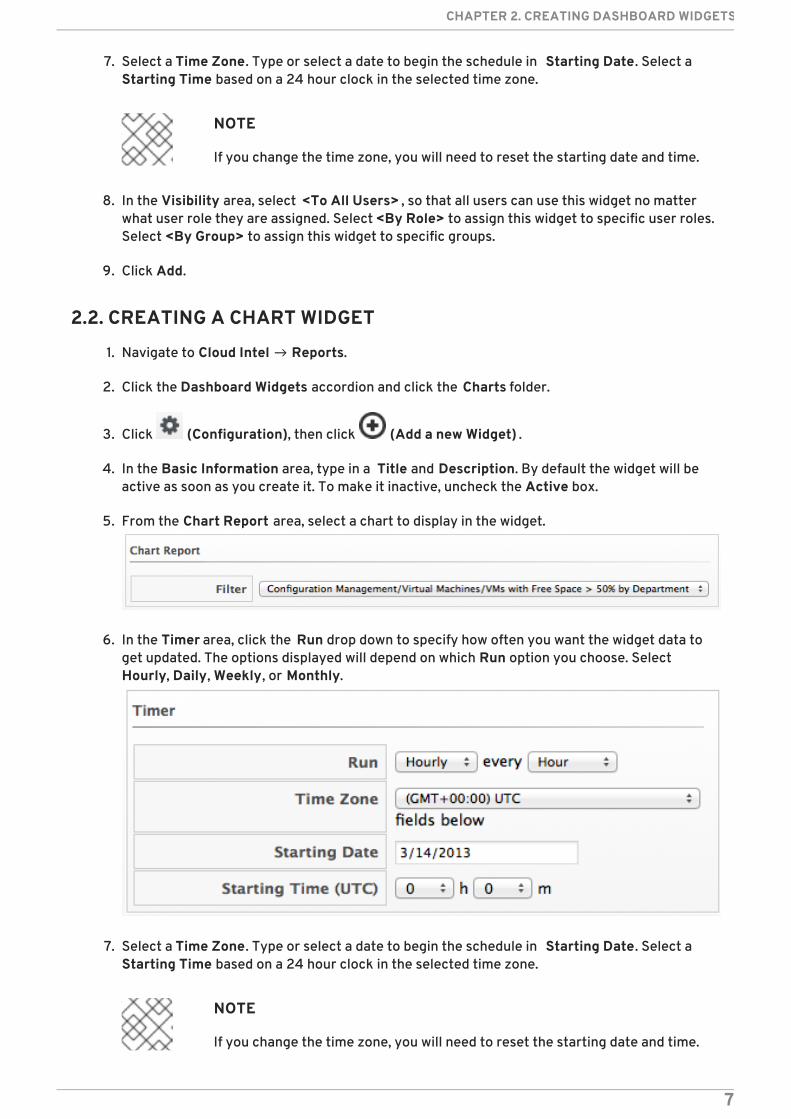
5. From the Chart Report area, select a chart to display in the widget.
6. In the Timer area, click the Run drop down to specify how often you want the widget data toget updated. The options displayed will depend on which Run option you choose. SelectHourly, Daily, Weekly, or Monthly.
7. Select a Time Zone. Type or select a date to begin the schedule in Starting Date. Select aStarting Time based on a 24 hour clock in the selected time zone.
NOTE
If you change the time zone, you will need to reset the starting date and time.
CHAPTER 2. CREATING DASHBOARD WIDGETS
7
8. In the Visibility area, select <To All Users> , so that all users can use this widget no matterwhat user role they are assigned. Select <By Role> to assign this widget to specific user roles.Select <By Group> to assign this widget to specific groups.
9. Click Add.
2.3. CREATING AN RSS FEED WIDGET
1. Navigate to Cloud Intel → Reports.
2. Click the Dashboard Widgets accordion, and click the RSS Feeds folder.
3. Click (Configuration), then click (Add a new Widget) .
4. In the Basic Information area, type in a Title and Description. By default the widget will beactive as soon as you create it. To make it inactive, uncheck the Active box.
5. In the RSS Feed Options area, you have the following choices:
From Type, select Internal to use feed from Red Hat CloudForms. Then select the RSSfeed, from the Internal RSS Feed dropdown.
From Type, select External to use a feed outside of Red Hat CloudForms. Then, eitherselect the RSS feed or type your own.
From Row Count, select the number of rows you want returned from the RSS feed.
6. Select the Filters until you are at the report you want for this widget. Select up to threecolumns from that report. Finally, for Row Count, select the number of rows that you wantdisplayed.
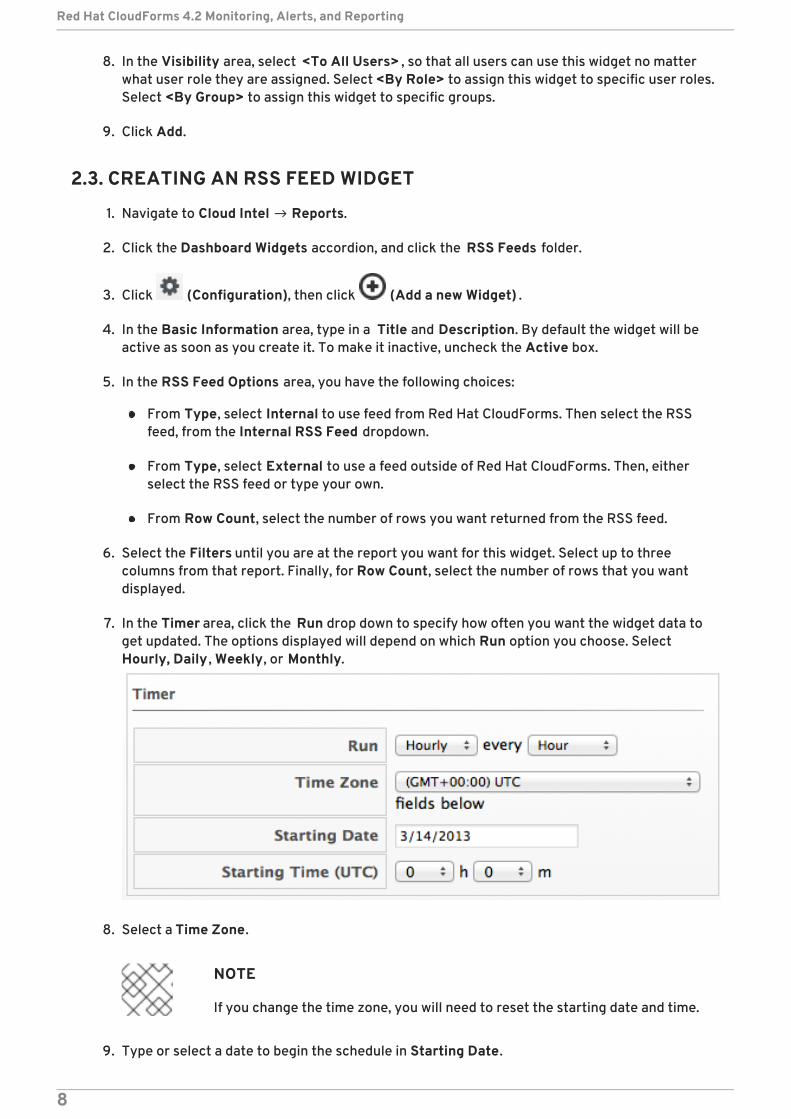
7. In the Timer area, click the Run drop down to specify how often you want the widget data toget updated. The options displayed will depend on which Run option you choose. SelectHourly, Daily , Weekly, or Monthly.
8. Select a Time Zone.
NOTE
If you change the time zone, you will need to reset the starting date and time.
9. Type or select a date to begin the schedule in Starting Date.
Red Hat CloudForms 4.2 Monitoring, Alerts, and Reporting
8
10. Select a Starting Time (UTC) based on a 24 hour clock in the selected Time Zone.
11. In the Visibility area, select <To All Users> , so that all users can use this widget no matterwhat user role they are assigned. Select <By Role> to assign this widget to specific user roles.Select <By Group> to assign this widget to specific groups.
12. Click Add.
2.4. CREATING A MENU WIDGET
1. Navigate to Cloud Intel → Reports.
2. Click the Dashboard Widgets accordion and click the Menus folder.
3. Click (Configuration), then click (Add a new Widget) .
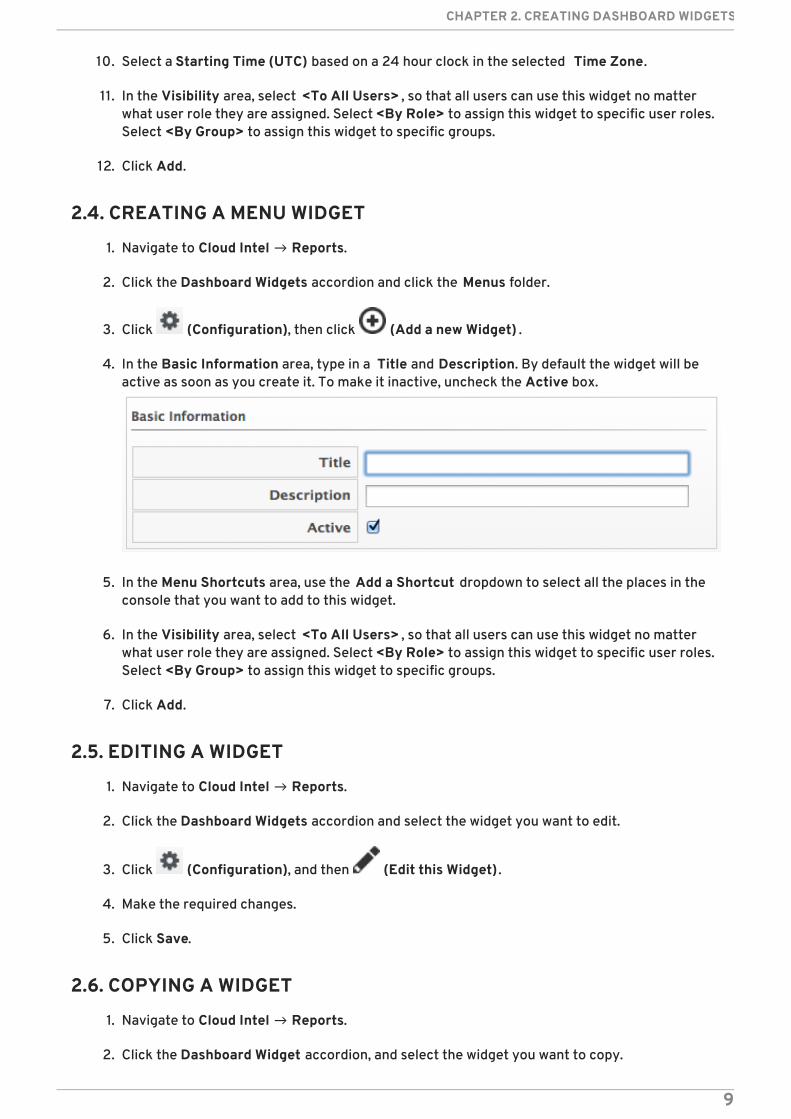
4. In the Basic Information area, type in a Title and Description. By default the widget will beactive as soon as you create it. To make it inactive, uncheck the Active box.
5. In the Menu Shortcuts area, use the Add a Shortcut dropdown to select all the places in theconsole that you want to add to this widget.
6. In the Visibility area, select <To All Users> , so that all users can use this widget no matterwhat user role they are assigned. Select <By Role> to assign this widget to specific user roles.Select <By Group> to assign this widget to specific groups.
7. Click Add.
2.5. EDITING A WIDGET
1. Navigate to Cloud Intel → Reports.
2. Click the Dashboard Widgets accordion and select the widget you want to edit.
3. Click (Configuration), and then (Edit this Widget) .
4. Make the required changes.
5. Click Save.
2.6. COPYING A WIDGET
1. Navigate to Cloud Intel → Reports.
2. Click the Dashboard Widget accordion, and select the widget you want to copy.
CHAPTER 2. CREATING DASHBOARD WIDGETS
9
3. Click (Configuration), and then (Copy this Widget).
4. Type a unique name for the widget and edit its properties.
5. Click Save.
2.7. DELETING A WIDGET
NOTE
Default widgets cannot be deleted, but they can be copied.
1. Navigate to Cloud Intel → Reports.
2. Click the Dashboard Widget accordion and select the widget you want to delete.
3. Click (Configuration), and then (Delete this Widget from the Database) .
4. Click OK.
2.8. IMPORTING A WIDGET
You can share widgets between appliances using the export and import features.
1. Navigate to Cloud Intel → Reports.
2. In the Import/Export accordion, click Widgets.
3. In the Import area, click Browse to select an import file.
4. Click Upload.
2.9. EXPORTING A WIDGET
You can share widgets between appliances using the export and import features.
1. Navigate to Cloud Intel → Reports.
2. In the Import/Export accordion, click Widgets.
3. In the Export area, select the widgets that you want to export.
4. Click Export.
2.10. GENERATING WIDGET CONTENT IMMEDIATELY
1. Navigate to Cloud Intel → Reports.
2. Click the Dashboard Widgets accordion and select the widget you want to generate.
3. Click (Configuration), and then (Generate Widget Content now) .
Red Hat CloudForms 4.2 Monitoring, Alerts, and Reporting
10

4. Click OK.
The content is generated immediately instead of waiting for the next scheduled update. Generation ofwidget content is shown under Tasks, accessed from the settings menu.
CHAPTER 2. CREATING DASHBOARD WIDGETS
11
CHAPTER 3. REPORTSClick the Reports accordion under Cloud Intelligence → Reports to see a list of reports available.These reports have been constructed to help you view the most commonly requested and significantdata. From here, you can also create reports if you have appropriate access. Red Hat CloudFormsprovides a large group of default reports organized into categories. Each category has its own set ofsubfolders.
Configuration Management: hardware, application, network, service, user account, operatingsystem, and snapshot information for all of your items.
Migration Readiness : information related to items required to migrate a virtual machine.
Operations: free space on registered and unregistered virtual machines, power states forvirtual machines, and SmartState analysis status.This category also provides reports relating to the operation of Red Hat CloudForms, such asuser IDs and snapshots taken by Red Hat CloudForms.
VM Sprawl : usage information and disk waste.
Relationships: virtual machine, folder, and cluster relationships.
Events: operations and configuration management events.
Performance by Asset Type : performance of your virtual infrastructure.You must be capturing capacity and utilization data to get this information.
Running Processes: information on processes running on a virtual machine.You must have domain credentials entered for the zone to collect the information for thesereports, and the virtual machine must have been analyzed at least once.
Trending: projections of datastore capacity, along with host CPU and memory use.
Tenants: quotas report aggregated by each tenant that shows quota name, total quota, in use,allocated, and available. The report currently lists all tenants and there is no nestinginformation available by parent and child tenants.
Provisioning: provisioning activity based on the approver, datastore, requester, and virtualmachine.
For a complete list of reportable fields in Red Hat CloudForms, see Appendix B, Reportable Fields in RedHat CloudForms.
3.1. RUNNING REPORTS
There are two different ways to generate a report: by scheduling the report, or running the reportmanually by clicking the report generation button on the Reports page. Red Hat CloudForms usesinteractive report generation so that reports are placed on a queue. A visual indicator of the reportsstatus is shown. All reports are automatically saved so that they can be downloaded and analyzed later.
3.1.1. Generating a Single Report
1. Navigate to Cloud Intelligence → Reports.
2. Click the Reports → All Reports accordion. Navigate to the report you want to view byselecting the appropriate folder.
Red Hat CloudForms 4.2 Monitoring, Alerts, and Reporting
12

3. Click (Queue).
4. The report generation is placed on the queue and its status shows in the reports page.
5. Click (Reload current display) to update the status.
6. When a report has finished generating, click on its row to view it.
3.2. SCHEDULING A REPORT
You can view historical data by creating reports on a scheduled basis. In addition, scheduled reportscan be emailed directly to users.
NOTE
You may need to disable, change the report filter, or change the frequency of aschedule. To do this, you will need to edit the schedule.
There are two ways to schedule a report:
Add a new Schedule through the Reports accordion:
1. Navigate to Cloud Intel → Reports.
2. Select a report from the Reports accordion and click Configuration.
3. Click Add a New Schedule or click the Schedules accordion and click Configuration
> Add a New Schedule .
or
Add a new Schedule through the Schedules accordion:
1. Navigate to Cloud Intel → Reports.
2. Click the Schedules accordion.
3. Click Configuration.
4. Click Add a New Schedule .
Adding new Schedule details.
1. In the Basic Information area, type in a Name and Description for the schedule.
By default, Active is checked to enable the scan.
CHAPTER 3. REPORTS
13
2. The Report Selection area is pre-populated if you added the schedule directly from the report.If you are adding from the schedule according, use the Filter drop downs to select the reportthat you want to schedule.
3. In the Timer area, click the Run drop down to specify how often you want the analysis to run.Your options after that will depend on which run option you choose.
Click Once to have the analysis run just one time.
Click Daily to run the analysis on a daily basis. You will be prompted to select how manydays you want between each analysis.
Click Hourly to run the analysis hourly. You will be prompted to select how many hoursyou want between each analysis.
Type or select a date to begin the schedule in Starting Date.
Select a Starting Time based on a 24 hour clock in the Red Hat CloudForms appliance’sTime Zone.
4. Use the E-Mail after Running feature to send an email after the report has been generated toselected users. The email will include a link to the report.
Check Send an E-mail .
In From (leave blank for default) , type in the sending email.
Use Add a User, to select a specific user. The user must have a valid email address enteredunder accounts.
Use Add (enter manually) to type in the address not registered to a User.
Then, click (Add).
5. If you are sending an email after the report runs, then you can select further options underEmail Options.
Check Send if Report is Empty if you want an email even if no records exist in the report.
Next to Attachments, check if you would like the report attached as a Text, CSV, or PDFfile.
6. Click Add.
NOTE
See https://access.redhat.com/documentation/en/red-hat-cloudforms/4.2-beta/paged/general-configuration in the General Configuration guide, to learn how toverify the address and validate outgoing email settings.
3.2.1. Modifying a Report Schedule
1. Navigate to Cloud Intel → Reports
2. Click the Schedules accordion and select the schedule you want to edit.
Red Hat CloudForms 4.2 Monitoring, Alerts, and Reporting
14
3. Click (Configuration), then click (Edit this Schedule).
4. Make the required changes.
5. Click Save.
3.2.2. Running a Scheduled Report Immediately
1. Navigate to Cloud Intel → Reports.
2. Click the Schedules accordion and select the schedule you want to run.
3. Click (Configuration), then click (Queue up this Schedule to run now ).
3.3. VIEWING REPORTS
Once you have created a schedule for a report, you can view it at any time after the first scheduledtime has occurred.
1. Navigate to Cloud Intel → Reports.
2. Click the Saved Reports accordion or the Reports accordion.
3. Click on the instance of the report you want to view.
3.3.1. Changing Report Views
NOTE
Some reports can be viewed as charts as well as lists. Note that this will depend on thetype of data and on how the report has been created. Where applicable, you will seethese additional buttons.
1. Navigate to Cloud Intel → Reports.
2. Click the report to view. Click one of the following buttons for the view you want.
Click for Graph View.
Click for Hybrid View.
Click for Tabular View.
3.3.2. Report Download Buttons
When you click on one of the supplied reports, you are presented with a group of buttons to downloadthe report in one of three formats or to view the report in a full screen.
CHAPTER 3. REPORTS
15
NOTE
Edit and delete buttons are only visible to administrators and super administrators. Editand delete functions are only available to customer-created reports. The Red HatCloudForms pre-configured reports cannot be edited or deleted, but they can be copied.
3.3.3. Downloading a Report
Download reports to analyze the data using other tools or to print the report.
1. Navigate to Cloud Intel → Reports.
2. Click the report you want to view.
3. Click on the row for the instance of the report you want to download. If the report needs to begenerated, see Section 3.1, “Running Reports”.
4. Click on the report download buttons for the type of export you want.
Click (Download this report in text format) to download as text.
Click (Download this report in csv format) to download as a comma-separated file.
Click (Download this report in PDF format) to download as PDF.
The report is automatically named with the type of report and date.
3.3.4. Showing a Report in Full Screen
View the report in full screen to examine report details. From full screen, you can also print the chartthat accompanies a report.
1. Navigate to Cloud Intelligence → Reports.
2. Click the Reports → All Reports accordion and select the report that you want to view.
3. Click the Saved Reports tab and select a report.
4. On the Saved Report detail screen, click (Configuration), and click (Show fullscreen Report).
The report will appear in full screen view. Click back on your browser to return to the reports explorer.
3.4. ADDING A REPORT
Add reports if the default reports do not include what you need or you want to narrow the scope of areport. For example, you may want a report that shows only Windows virtual machines.
1. Navigate to Cloud Intelligence → Reports.
2. Click the Reports → All Reports accordion.
Red Hat CloudForms 4.2 Monitoring, Alerts, and Reporting
16
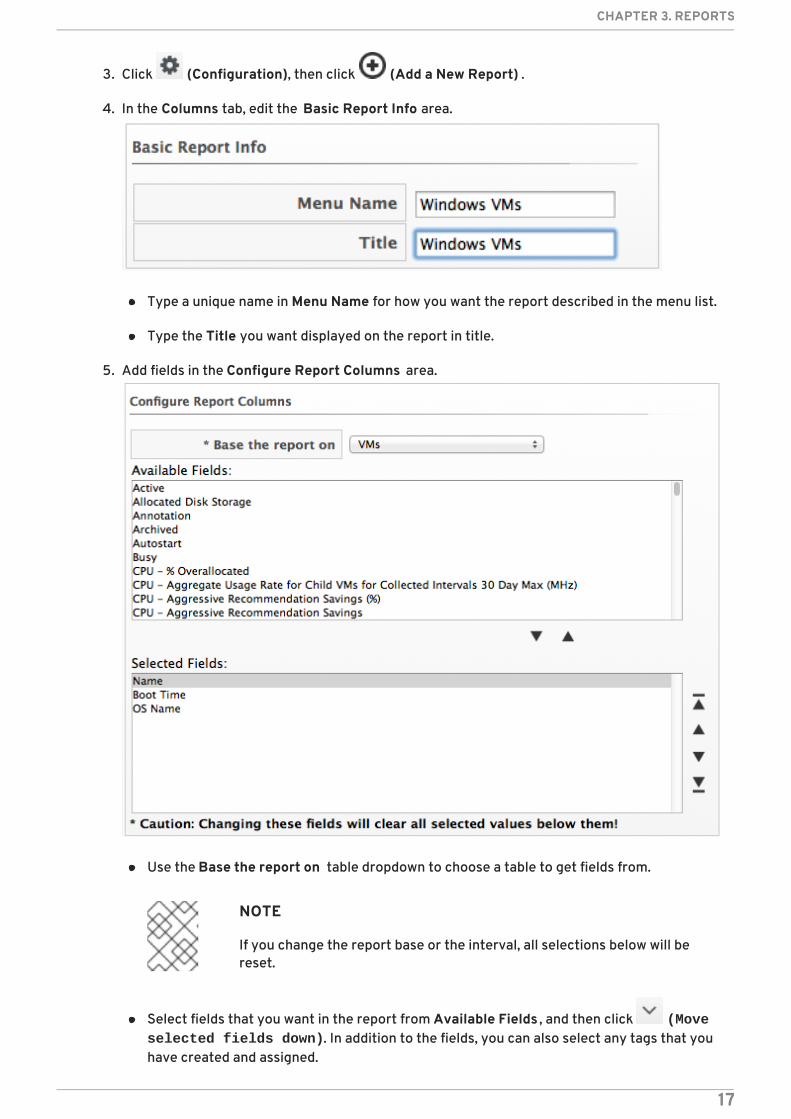
3. Click (Configuration), then click (Add a New Report) .
4. In the Columns tab, edit the Basic Report Info area.
Type a unique name in Menu Name for how you want the report described in the menu list.
Type the Title you want displayed on the report in title.
5. Add fields in the Configure Report Columns area.
Use the Base the report on table dropdown to choose a table to get fields from.
NOTE
If you change the report base or the interval, all selections below will bereset.
Select fields that you want in the report from Available Fields , and then click (Move selected fields down). In addition to the fields, you can also select any tags that youhave created and assigned.
CHAPTER 3. REPORTS
17
Change the order of the fields in the report by clicking (Move selected fields
up) or (Move selected fields down).
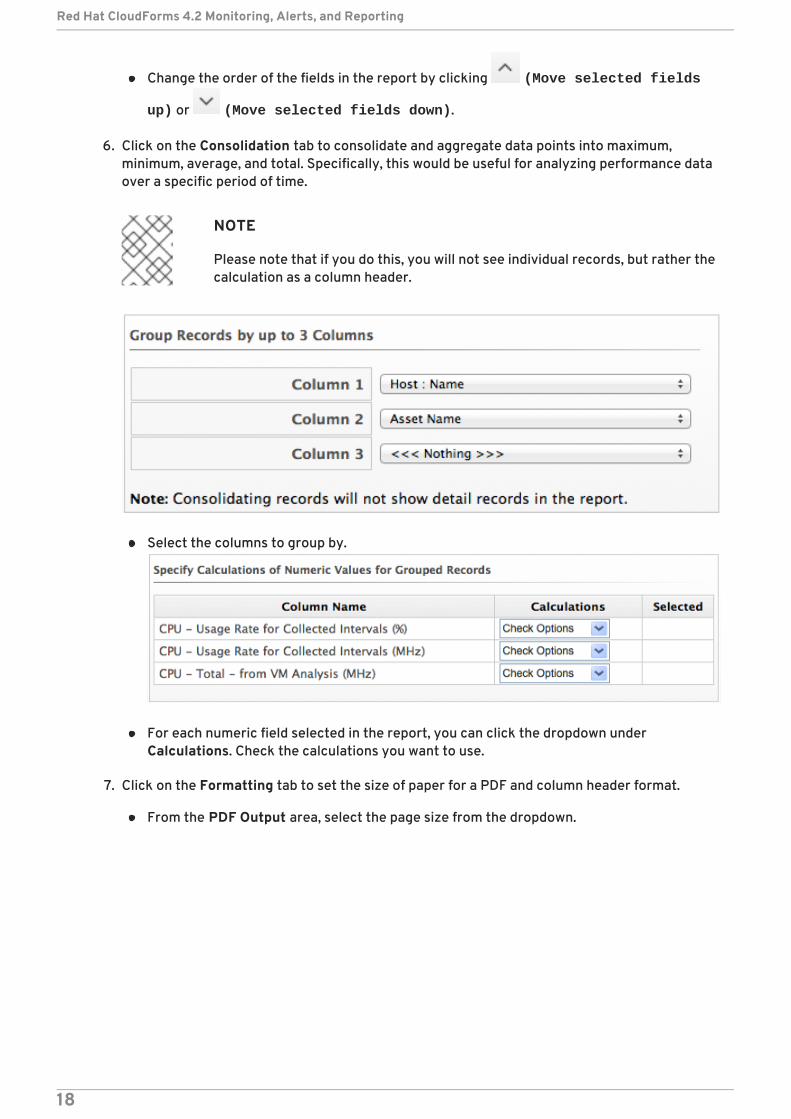
6. Click on the Consolidation tab to consolidate and aggregate data points into maximum,minimum, average, and total. Specifically, this would be useful for analyzing performance dataover a specific period of time.
NOTE
Please note that if you do this, you will not see individual records, but rather thecalculation as a column header.
Select the columns to group by.
For each numeric field selected in the report, you can click the dropdown underCalculations. Check the calculations you want to use.
7. Click on the Formatting tab to set the size of paper for a PDF and column header format.
From the PDF Output area, select the page size from the dropdown.
Red Hat CloudForms 4.2 Monitoring, Alerts, and Reporting
18
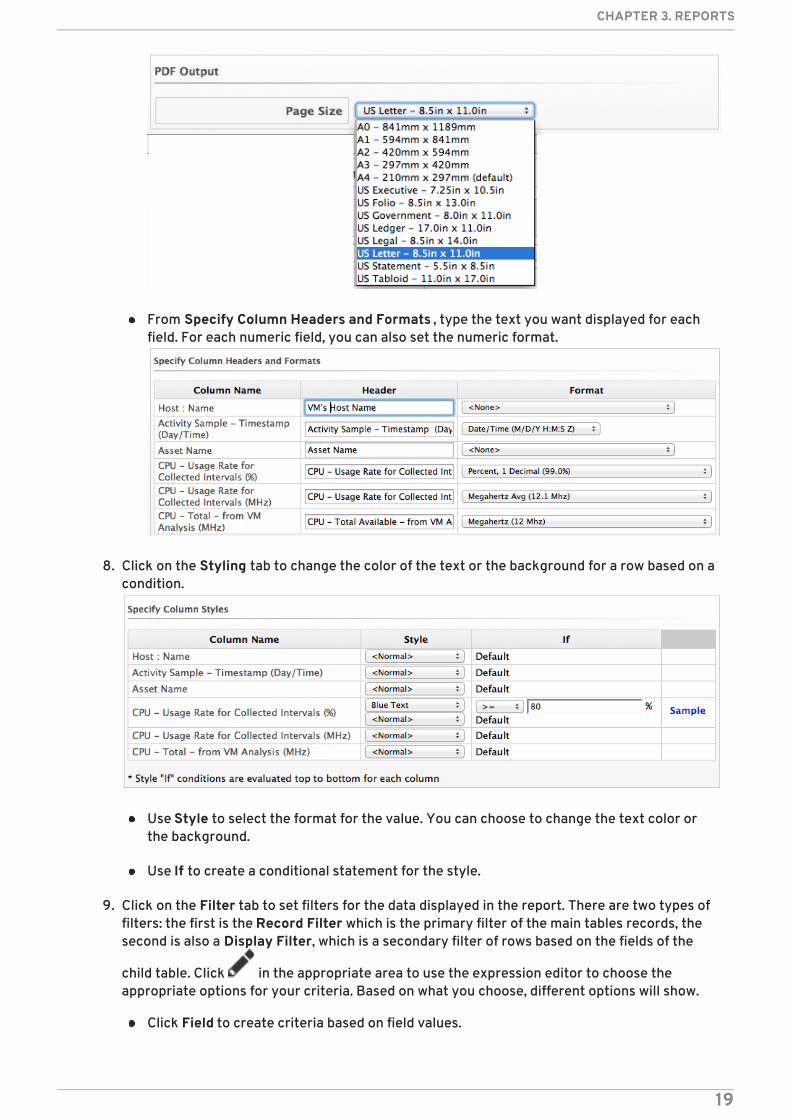
From Specify Column Headers and Formats , type the text you want displayed for eachfield. For each numeric field, you can also set the numeric format.
8. Click on the Styling tab to change the color of the text or the background for a row based on acondition.
Use Style to select the format for the value. You can choose to change the text color orthe background.
Use If to create a conditional statement for the style.
9. Click on the Filter tab to set filters for the data displayed in the report. There are two types offilters: the first is the Record Filter which is the primary filter of the main tables records, thesecond is also a Display Filter, which is a secondary filter of rows based on the fields of the
child table. Click in the appropriate area to use the expression editor to choose theappropriate options for your criteria. Based on what you choose, different options will show.
Click Field to create criteria based on field values.
CHAPTER 3. REPORTS
19
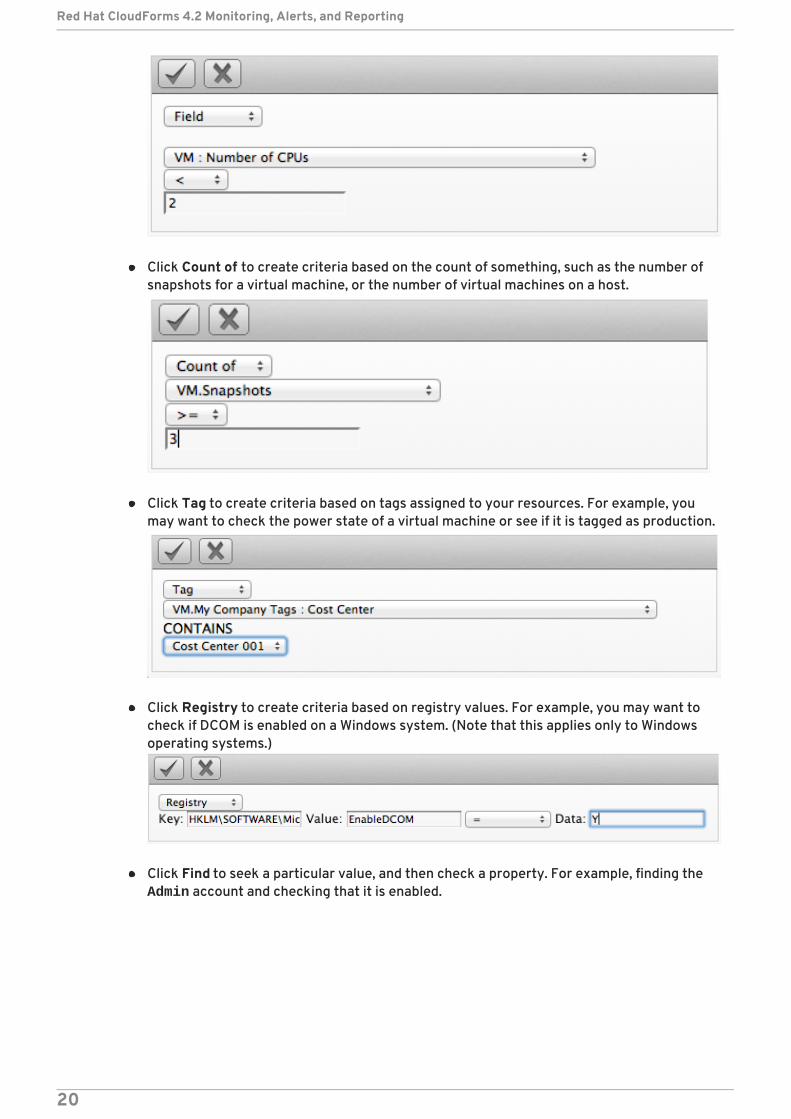
Click Count of to create criteria based on the count of something, such as the number ofsnapshots for a virtual machine, or the number of virtual machines on a host.
Click Tag to create criteria based on tags assigned to your resources. For example, youmay want to check the power state of a virtual machine or see if it is tagged as production.
Click Registry to create criteria based on registry values. For example, you may want tocheck if DCOM is enabled on a Windows system. (Note that this applies only to Windowsoperating systems.)
Click Find to seek a particular value, and then check a property. For example, finding the Admin account and checking that it is enabled.
Red Hat CloudForms 4.2 Monitoring, Alerts, and Reporting
20
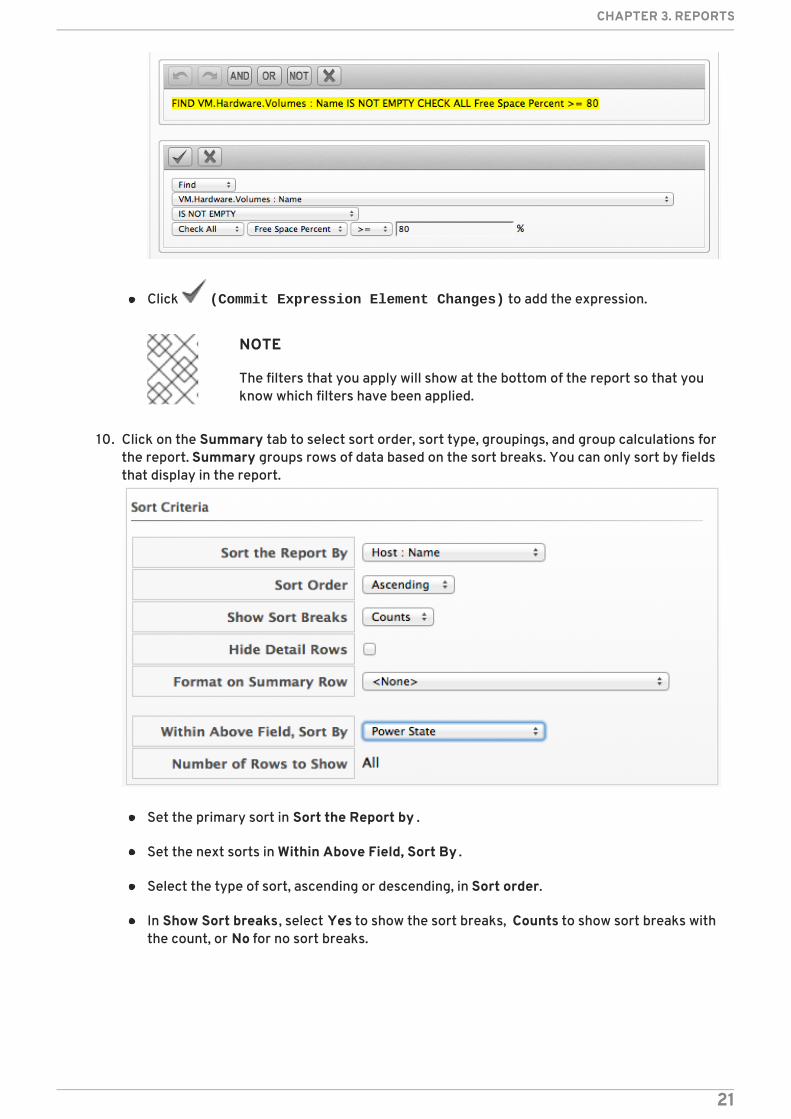
Click (Commit Expression Element Changes) to add the expression.
NOTE
The filters that you apply will show at the bottom of the report so that youknow which filters have been applied.
10. Click on the Summary tab to select sort order, sort type, groupings, and group calculations forthe report. Summary groups rows of data based on the sort breaks. You can only sort by fieldsthat display in the report.
Set the primary sort in Sort the Report by .
Set the next sorts in Within Above Field, Sort By .
Select the type of sort, ascending or descending, in Sort order.
In Show Sort breaks , select Yes to show the sort breaks, Counts to show sort breaks withthe count, or No for no sort breaks.
CHAPTER 3. REPORTS
21
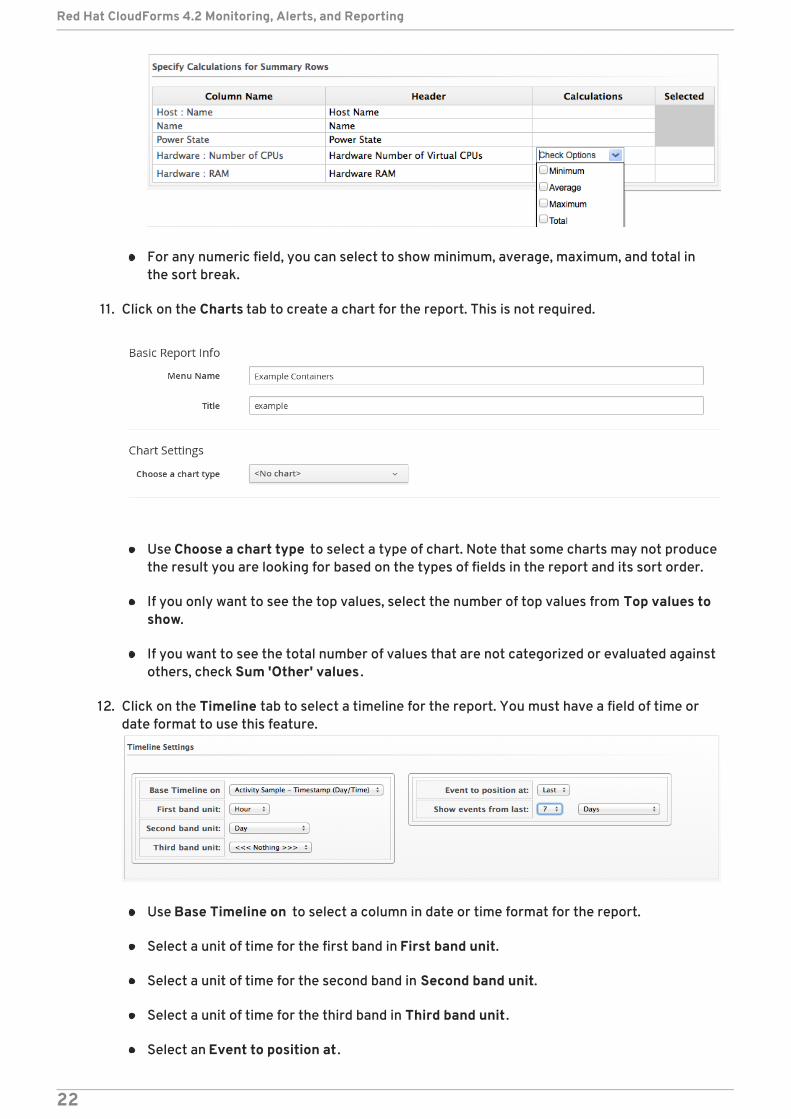
For any numeric field, you can select to show minimum, average, maximum, and total inthe sort break.
11. Click on the Charts tab to create a chart for the report. This is not required.
Use Choose a chart type to select a type of chart. Note that some charts may not producethe result you are looking for based on the types of fields in the report and its sort order.
If you only want to see the top values, select the number of top values from Top values toshow.
If you want to see the total number of values that are not categorized or evaluated againstothers, check Sum 'Other' values .
12. Click on the Timeline tab to select a timeline for the report. You must have a field of time ordate format to use this feature.
Use Base Timeline on to select a column in date or time format for the report.
Select a unit of time for the first band in First band unit.
Select a unit of time for the second band in Second band unit.
Select a unit of time for the third band in Third band unit .
Select an Event to position at .
Red Hat CloudForms 4.2 Monitoring, Alerts, and Reporting
22
Select the range for the event to position from Show events from last .
NOTE
If you select a timeline for a report, that timeline will also show on thetimelines page of Cloud Intelligence . The filters that you apply will show ona timeline report so that you know which filters have been applied.
13. Click the Previews tab to see a sample of your report.
14. When you have the report that you want, click Add to create the new report.
NOTE
After the new report is created, to make the report accessible from the report menu,you must add it to a report menu.
3.5. COPYING A REPORT
Use this feature to copy a report that is similar to one that you want to create. By copying a report, youonly need to make minor edits instead of creating an entirely new report.
1. Navigate to Cloud Intelligence → Reports.
2. Click the Reports → All Reports accordion and select the report that you want to copy.
3. Click (Configuration), then click (Copy this report).
4. On the Columns tab, edit the Basic Report Info area to include a new Menu Name. Each MenuName must be unique.
5. Make any other changes you need. See "Adding a Report" for details on the changes you canmake.
6. Click Add.
3.6. EDITING A REPORT
If you find that a report is not giving you the data that you need, you can edit it after it has beencreated. Note that only reports that you have created can be modified. Only administrators and superadministrators of Red Hat CloudForms can add, copy, edit, and delete reports.
1. Navigate to Cloud Intelligence → Reports.
2. Click the Reports → All Reports accordion and select the report you want to edit.
3. Click (Configuration), (Edit this Report ).
4. Make any changes you need.
5. Click Save.
CHAPTER 3. REPORTS
23
3.7. DELETING A REPORT
Delete reports when you find that they are no longer useful. Only administrators and superadministrators of Red Hat CloudForms can add, copy, edit, and delete reports.
NOTE
Please note that only customer-created reports can be deleted.
1. Navigate to Cloud Intelligence → Reports.
2. Click the Reports → All Reports accordion and select the report you want to delete.
3. Click (Configuration), (Delete this Report from the Database ).
NOTE
The Delete this report from the Database option will only appear on reportsyou have created. Default reports cannot be deleted.
4. Click OK.
3.8. IMPORTING A REPORT
Reports are stored in the VMDB; however, you can share customized reports among VMDBs. To do thisuse the export and import feature of reports.
1. Navigate to Cloud Intelligence → Reports.
2. Select Custom Reports from the Import/Export accordion.
3. In the Import area, click Browse to select an import file.
4. To overwrite an existing report with the same menu name, select Overwrite existing reports .
5. Click Upload to import the report to the Company-Custom folder.
3.9. EXPORTING A REPORT
Reports are stored in the VMDB. Custom reports may be shared among VMDBs. Share your customreports using the export and import features.
1. Navigate to Cloud Intelligence → Reports.
2. Select Custom Reports from the Import/Export accordion.
3. In the Export area, select the reports to export.
4. Click Export.
3.10. REPORT MENUS
Red Hat CloudForms 4.2 Monitoring, Alerts, and Reporting
24
By default, all account roles have the same reports available. If you have the super administrator oradministrator role, you can customize the accordions, the folders within them, and the locations ofyour reports.
NOTE
When you create your own report, the report is not automatically available. You mustadd it to a report menu.
The report menu is a hierarchical structure that consists of the following components:
The top level, under which the accordions are shown. (Top level is only displayed when you arein the report menu editor.)
Accordions that are general categories for the reports. The defaults supplied areConfiguration Management, Migration Readiness , Operations, VM Sprawl , Relationships,and Events.
Folders that are used to further organize reports within an accordion. For example, under theConfiguration Management, there are folders for virtual machines, hosts, and other virtualinfrastructure components.
Reports that are stored directly in the folders.
3.10.1. Managing Report Menu Accordions
1. Navigate to Cloud Intel → Reports.
2. Click the Edit Report Menus folder.
3. Click the role whose menus you want to customize.
4. Click on Top Level to organize, add, and delete folders.
Click (Move selected folder to top) to move the folder to the top of the list.
Click (Move selected folder up) to move the folder up.
Click (Move selected folder down) to move the folder down.
Click (Move selected folder to bottom) to move the folder to the bottom of the list.
Click (Delete selected folder and its contents) to delete a folder.
Click (Add folder to selected folder) to add an folder.
CHAPTER 3. REPORTS
25
NOTE
If you are creating a new folder, Top Level must be selected under Reports.Be sure to select the folder you want to create a subfolder for on the leftpane. To name the folder, double-click on New Folder , then click on TopLevel in the Reports area.
5. When you are finished adding folders, click Commit. To revert, click Discard.
6. Click Save.
The new folder is added, and you can add folders in which to store reports to it. You can also organizethe reports into folder that are meaningful to you.
3.11. MANAGING REPORT MENU FOLDERS
1. Log in to the console as a user who is assigned either the super administrator or administratoraccount role.
2. Navigate to Cloud Intel → Reports.
3. Click the Edit Report Menus accordion.
4. Click the role whose menus you want to customize.
5. Click on the accordion name you want to organize or add folders to.
Click (Move selected folder to top) to move the folder to the top of the list.
Click (Move selected folder up) to move the folder up.
Click (Move selected folder down) to move the folder down.
Click (Move selected folder to bottom) to move the folder to the bottom of the list.
Click (Delete selected folder and its contents) to delete an folder.
Click (Add subfolder to selected folder) to add a folder. When creating a subfolder,be sure to select the folder that you want the subfolder to show under. To name the folder,double-click on New Folder.
6. When you are finished making changes click Commit. To revert, click Discard.
7. Click Save.
Red Hat CloudForms 4.2 Monitoring, Alerts, and Reporting
26
NOTE
Only reports that are not already in another folder can be assigned.
3.12. ORGANIZING REPORTS IN REPORT MENUS
1. Log in to the console as a user who is assigned either the Super Administrator orAdministrator Account Role.
2. Navigate to Cloud Intel → Reports.
3. Click the Edit Report Menus accordion.
4. Click the role whose menus you want to customize.
5. Expand the Report accordion and menus using the triangles to the left of the item name untilyou are able to select the subfolder where you want to put reports.
6. Choose one of the following actions:
To add a report, select a report from the Available Reports area on the right and click
(Move selected reports left) .
To remove a report from a folder, select the report from the Selected Reports area and
click (Move selected reports right) .
To move a report to the top of the folder, select the report and click (Moveselected reports to top).
To move a report up one place in the folder, select the report and click (Moveselected reports up).
To move a report down one place in the folder, select the report and click (Moveselected reports down).
To move a report to the bottom of the folder, select the report and click (Moveselected reports to bottom).
7. When you are finished making changes click Commit.
8. Click Save.
The changes are made. The next time a user with this Account Role logs in, the new report and menustructure will be displayed.
CHAPTER 3. REPORTS
27
CHAPTER 4. CHARGEBACKThe chargeback feature allows you to calculate monetary virtual machine charges based on owner orcompany tag. To use this feature you must be collecting capacity and utilization data.
For information on server control settings and capacity & utilization collection settings, see GeneralConfiguration.
4.1. CHARGEBACK RATES
Red Hat CloudForms provides a default set of rates for calculating chargeback costs, but you cancreate your own set of computing and storage costs by navigating to Cloud Intelligence →Chargeback and clicking the Rates accordion.
You can configure chargeback rates for various resources by selecting either Compute or Storage inthe Rates accordion. Compute sets chargeback rates for CPU, disk I/O, fixed compute cost, memory,and network I/O items, while Storage sets chargeback rates for fixed storage cost and disk storage.
Chargeback costs are computed using a set formula based on hourly cost per unit and hourly usage.
Chargeback can be calculated in the following currencies:
United States Dollars (USD)
Euro (EUR)
Pound Sterling (GBP)
Japanese Yen (JPY)
Chargeback rates can be assigned at a single rate or by tiers, where rates are assigned in rangesdepending on level of usage.
Additionally, chargeback can be calculated at one fixed rate, or by a combination of fixed and variablerates per tier. Fixed rates are charged once per unit of time, and the variable rate is calculated by thelevel of usage multiplied by the number of resources used in a unit of time.
4.1.1. Memory Used Cost
Calculating the Memory Used Cost in dollars ($) for a day can be expressed in the following ways:
Memory allocation per hour (in MB) * Hourly Allocation cost per megabyte * Number ofMemory Allocation metrics available for the day
Sum of Memory allocation for the day (in MB) * Hourly Allocation cost per megabyte
Sum of Memory allocation for the day (in MB) * Daily Allocation cost per megabyte / 24
Memory costs can be measured in B, KB, MB, GB, or TB.
Example 4.1. Memory Used Cost
In a scenario where 9.29 GB of memory is used in a day with the chargeback rate set at one dollar($1) per megabyte per day, the Memory Used Cost would be $396.42.
Red Hat CloudForms 4.2 Monitoring, Alerts, and Reporting
28
9.29 GB = 9514.08 MB
9514.08 MB * $1 (per MB per day) = $9514.08
$9514.08 / 24 = $396.42 Memory Used Cost
4.1.2. CPU Total Cost
The CPU Total Cost is defined as the number of virtual CPUs over the selected interval (hour, day,week, month). CPU costs can be measured in units of Hz, KHz, MHz, GHz, or THz, as specified whencreating a chargeback rate.
Example 4.2. CPU Total Cost
In a scenario where 16 CPUs are used in a day with the chargeback rate set at one dollar per CPUper day, the CPU Total Cost would be $16.
16 CPUs * $1 (per CPU per day) = $16 CPU Total Cost
4.1.3. CPU Used Cost
The CPU Used Cost is defined as the average CPU used in MHz over the selected rate interval (hour,day, week, month). CPU Used Cost is not supported for containers providers.
Example 4.3. CPU Used Cost
In a scenario where 2.5 GHz is used in a day with the chargeback rate set at $0.01 per MHz per day,the CPU Used Cost would be $25.
2.5 GHz = 2500 MHz
2500 MHz * $0.01 (per MHz per day) = $25 CPU Used Cost
4.1.4. Storage Allocated Cost
The Storage Allocated Cost is defined as the Allocated Disk Storage in bytes over the selected rateinterval (hour, day, week, month). Storage costs can be measured in B, KB, MB, GB, or TB.
Example 4.4. Storage Allocated Cost
In a scenario where 500 GB are used in a day with the chargeback rate set at $0.10 per GB per day,the Storage Allocated Cost would be $50.
536,870,912,000 bytes = 500 GB
500 GB * $0.10 (per GB per day) = $50 Storage Allocated Cost
4.1.5. Storage Total Cost
The Storage Total Cost is defined as the Used Disk Storage in bytes over the selected rate interval(hour, day, week, month).
CHAPTER 4. CHARGEBACK
29
Example 4.5. Storage Total Cost
In a scenario where 250 GB are used in a day with the chargeback rate set at $0.10 per GB per day,the Storage Total Cost would be $25.
268,435,456,000 bytes = 250 GB
250 GB * $0.10 (per GB per day) = $25 Storage Total Cost
4.1.6. Storage Used Cost
The Storage Used Cost is defined as the Used Disk Storage in bytes over the selected rate interval(hour, day, week, month).
Example 4.6. Storage Used Cost
In a scenario where 250 GB are used in a day with the chargeback rate set at $0.10 per GB per day,the Storage Used Cost would be $25.
268,435,456,000 bytes = 250 GB
250 GB * $0.10 (per GB per day) = $25 Storage Used Cost
NOTE
The following chargeback rates are not supported for containers providers:
Allocated CPU count
Used CPU
Used disk I/O
Allocated memory
4.2. CREATING CHARGEBACK RATES
Red Hat CloudForms allows you to create your own set of computing and storage costs to use forbilling.
Chargeback rates can be configured at a single rate or in tiers, where one rate is assigned to one usagerange, and another rate is assigned to a different usage range. You can also assign fixed and variablerates per tier if desired.
There are three methods to create a chargeback rate: editing or copying an existing rate, or creating anew rate.
4.2.1. Editing a Chargeback Rate
1. Navigate to Cloud Intel → Chargeback.
2. Click the Rates accordion and select an existing rate from under Compute or Storage.
Red Hat CloudForms 4.2 Monitoring, Alerts, and Reporting
30
3. Click (Configuration) and (Edit this Chargeback Rate) .
4. Edit the rate as desired.
5. Click Save at the bottom of the screen to save the chargeback rate.
4.2.2. Copying a Chargeback Rate
1. Navigate to Cloud Intel → Chargeback.
2. Click the Rates accordion and select an existing rate from under Compute or Storage.
3. Click (Configuration) and (Copy this Chargeback Rate) .
4. Edit the rate as desired.
5. Click Add at the bottom of the screen to save the chargeback rate.
4.2.3. Adding a Chargeback Rate
The following example shows a scenario to create a new chargeback rate for allocated CPU usage inEuro per week measured by the following tiers, calculating both fixed and variable costs:
Example: Creating a tiered chargeback rate
Tier 1: 0-2 CPU = 1 Euro fixed + 0.5 Euro variable
Tier 2: 2-4 CPU = 0.8 Euro fixed + 0.4 Euro variable
Tier 3: 4 CPU and above = 0.6 Euro fixed + 0.2 Euro variable
To configure this rate:
1. Navigate to Cloud Intel → Chargeback.
2. Click the Rates accordion and select Compute to create a CPU chargeback rate.
a. Click (Configuration) and (Add a new Chargeback Rate) .
3. Type in a Description for the chargeback rate.
4. Select Euro for currency.
5. In Rate Details, select the time, and fill in the range and rates for each tier. Alternatively, asingle chargeback rate can be configured by using only one tier. For this example, in AllocatedCPU Count, configure:
a. For tier 1, set:
i. In Per Time, select Hourly.
ii. In Range, specify the CPU range: Start remains as 0.0 and Finish is 2.
iii. In Rate, specify 1 for the Fixed rate, and 0.5 for the Variable rate.
CHAPTER 4. CHARGEBACK
31
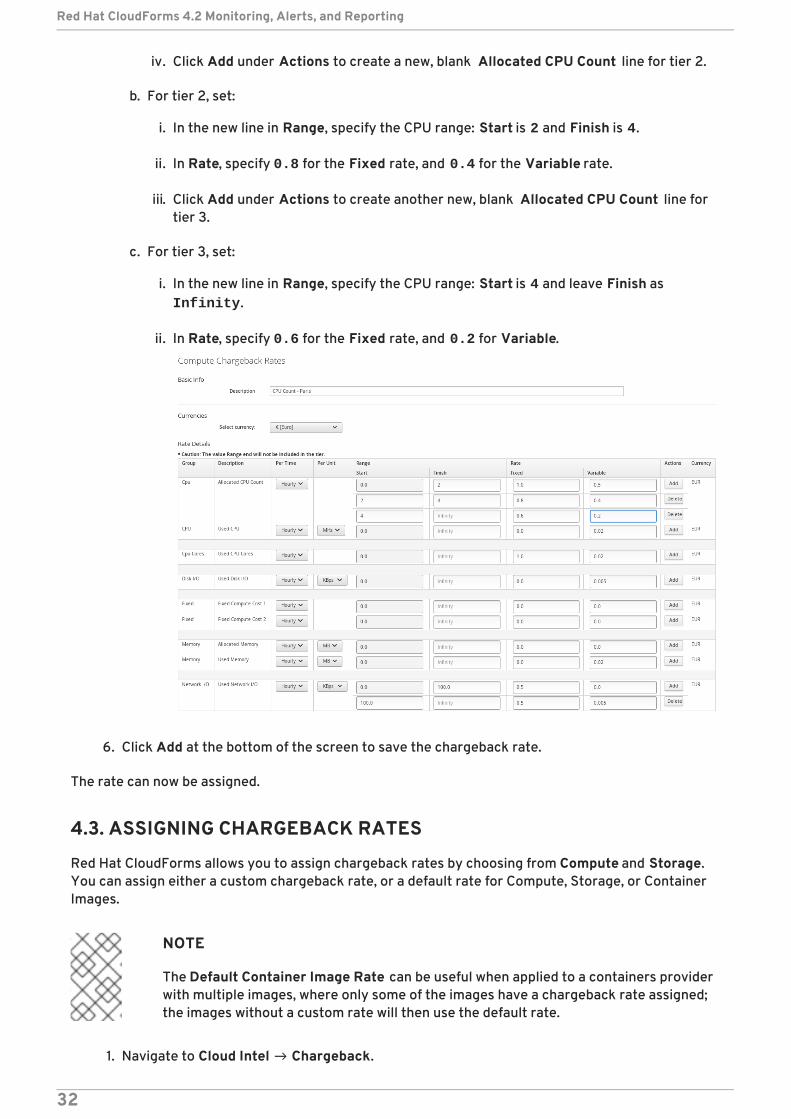
iv. Click Add under Actions to create a new, blank Allocated CPU Count line for tier 2.
b. For tier 2, set:
i. In the new line in Range, specify the CPU range: Start is 2 and Finish is 4.
ii. In Rate, specify 0.8 for the Fixed rate, and 0.4 for the Variable rate.
iii. Click Add under Actions to create another new, blank Allocated CPU Count line fortier 3.
c. For tier 3, set:
i. In the new line in Range, specify the CPU range: Start is 4 and leave Finish as Infinity.
ii. In Rate, specify 0.6 for the Fixed rate, and 0.2 for Variable.
6. Click Add at the bottom of the screen to save the chargeback rate.
The rate can now be assigned.
4.3. ASSIGNING CHARGEBACK RATES
Red Hat CloudForms allows you to assign chargeback rates by choosing from Compute and Storage.You can assign either a custom chargeback rate, or a default rate for Compute, Storage, or ContainerImages.
NOTE
The Default Container Image Rate can be useful when applied to a containers providerwith multiple images, where only some of the images have a chargeback rate assigned;the images without a custom rate will then use the default rate.
1. Navigate to Cloud Intel → Chargeback.
Red Hat CloudForms 4.2 Monitoring, Alerts, and Reporting
32
2. Click the Assignments accordion, and click either Compute or Storage.
4.3.1. Configuring Chargeback for Compute
Use Compute to assign a compute chargeback rate. You can assign chargeback rates to TheEnterprise, Selected Cloud/Infrastructure Providers , Selected Clusters/Deployment Roles,Selected Containers Providers, Tagged VMs and Instances , Tagged Images, Labeled Images, orTenants.
1. From the Basic Info area, use the Assign To list to select a type of assignee to assign the rateset to.
2. For Tagged VMs and Instances and Tagged Images select a Tag Category.
3. For each item to set, select the chargeback rate to use. The options displayed vary based onthe type you select.
4. Click Save.
4.3.2. Configuring Chargeback for Storage
Use Storage to assign a storage chargeback rate. You can assign chargeback rates to The Enterprise,Selected Datastores, Tagged Datastores, or Tenants.
1. From the Basic Info area, use the Assign To list to select a type of assignee to assign the rateset to.
2. For Tagged Datastores select a Tag Category.
3. For each item to set, select the chargeback rate to use. The options displayed vary based onthe type you select.
4. Click Save.
The rate is assigned. The next time you generate a chargeback report, these values will be used.
NOTE
When viewing chargeback, there is a rate for a virtual machine for the number of theCPUs. The chargeback for this parameter is calculated based on when the virtualmachine is running. If the virtual machine is not running, then it is not charged for CPUallocation.
4.4. CREATING A CHARGEBACK REPORT
Red Hat CloudForms allows you to create chargeback reports to monitor costs you charged.
NOTE
When creating a chargeback report please note that the Total Cost is the complete costfor the chosen workload over the selected time frame. This sum is based on all fieldsassigned to the chargeback rate. When adding cost related columns to display on yourreport, please be sure to select all rate assigned fields to present a comprehensiveaccounting of total costs.
CHAPTER 4. CHARGEBACK
33
1. Navigate to Cloud Intel → Reports.
2. Click the Reports accordion.
3. Click (Configuration), (Add a new Report) .
4. On the Columns tab, fill out the Basic Report Info area.
Type a unique name in Menu Name for how you want the report described in the menu list.
Type the Title to display on the report.
5. Add fields in the Configure Report Columns area.
From the Base the report on list, select Chargebacks.
Select the fields to include in the report from the Available Fields list, then click (Move selected fields down) . In addition to the fields, you can also select any tags that youhave created and assigned.
Change the order of the fields in the report by clicking (Move selected fields up) or
(Move selected fields down)] .
6. Click the Formatting tab to set the size of paper for a PDF and column header format.
From the PDF Output area, select the page size from the Page Size list.
From Specify Column Headers and Formats , type the text to display for each field. Foreach numeric field, you can also set the numeric format.
7. Click the Filter tab to set filters for the data displayed in the report.
From Chargeback Filters, select how you want the costs to show, the tag category, thetag, and how you want the items grouped.
From Chargeback Interval , select the time interval. You must have a full interval worth ofdata in order to select an option other than Partial in the Daily Ending With list.
8. Click the Preview tab, and then Load to see what the report will look like.
9. When you are satisfied that you have the report that you want, click Add to create the newreport.
The new report is created. To make the report accessible from the Report menu, you must add it to areport menu.
Red Hat CloudForms 4.2 Monitoring, Alerts, and Reporting
34
CHAPTER 5. TIMELINES
5.1. ACCESSING AND USING A TIMELINE
You can use timelines to view the history record for virtual machines.
NOTE
Amazon does not provide events, so Red Hat CloudForms does not support timelines forvirtual machines hosted by Amazon.
1. Navigate to Cloud Intel → Timelines.
2. From the accordion on the left, click a category of Timeline.
Select Configuration Management to see when items were brought under management.
Select Events to view timelines related to operations and changes in configuration.
3. Drag the relevant time band, such as hour, day, or month to go to the time you want to see.
NOTE
Some timelines, such as Events Operations: All Events , use minutes, hours, anddays instead of going back only 30 days.
4. To see more detail for a resource in the timeline, click on it. A balloon appears with a clickablelink to the resource.
5.2. DOWNLOADING A TIMELINE’S DATA
You can download timeline data for further analysis or printing.
1. Navigate to Cloud Intel → Timelines, and click the timeline you want to download.
2. Click on the download button for the format you want.
Click (Download this Timeline data in text format) to download as text.
Click (Download this Timeline data in csv format) to download as a commaseparated file.
Click (Download this Timeline data in PDF format) to download as PDF.
CHAPTER 5. TIMELINES
35
CHAPTER 6. ALERTS
6.1. ASSIGNING THE NOTIFIER ROLE
1. From the settings menu, select Configuration.
2. Click the Settings accordion, and select the Red Hat CloudForms server.
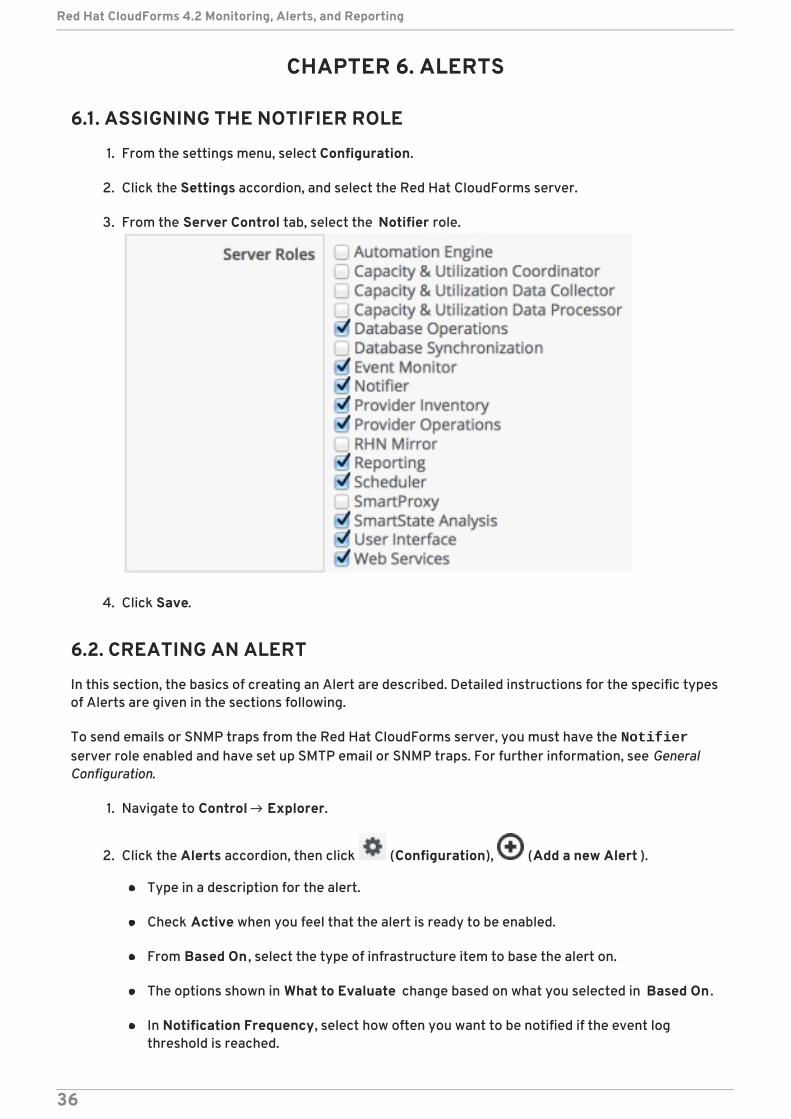
3. From the Server Control tab, select the Notifier role.
4. Click Save.
6.2. CREATING AN ALERT
In this section, the basics of creating an Alert are described. Detailed instructions for the specific typesof Alerts are given in the sections following.
To send emails or SNMP traps from the Red Hat CloudForms server, you must have the Notifierserver role enabled and have set up SMTP email or SNMP traps. For further information, see GeneralConfiguration.
1. Navigate to Control → Explorer.
2. Click the Alerts accordion, then click (Configuration), (Add a new Alert ).
Type in a description for the alert.
Check Active when you feel that the alert is ready to be enabled.
From Based On , select the type of infrastructure item to base the alert on.
The options shown in What to Evaluate change based on what you selected in Based On .
In Notification Frequency, select how often you want to be notified if the event logthreshold is reached.
Red Hat CloudForms 4.2 Monitoring, Alerts, and Reporting
36
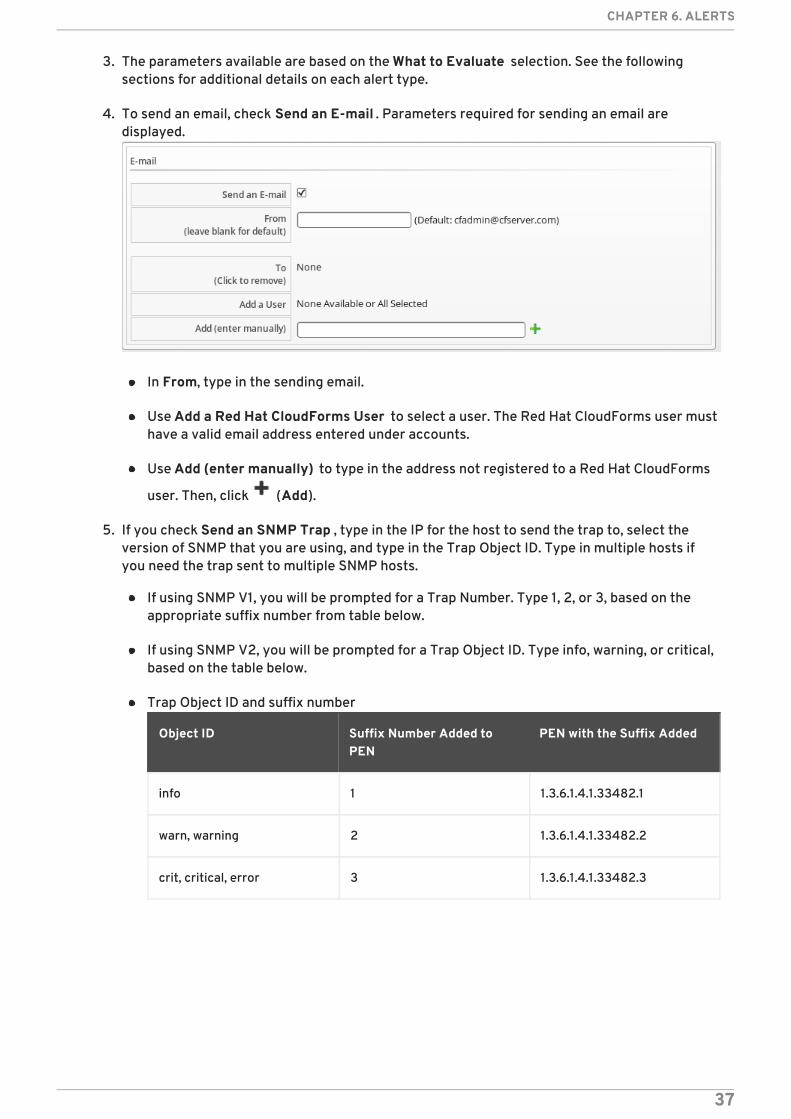
3. The parameters available are based on the What to Evaluate selection. See the followingsections for additional details on each alert type.
4. To send an email, check Send an E-mail . Parameters required for sending an email aredisplayed.
In From, type in the sending email.
Use Add a Red Hat CloudForms User to select a user. The Red Hat CloudForms user musthave a valid email address entered under accounts.
Use Add (enter manually) to type in the address not registered to a Red Hat CloudForms
user. Then, click (Add).
5. If you check Send an SNMP Trap , type in the IP for the host to send the trap to, select theversion of SNMP that you are using, and type in the Trap Object ID. Type in multiple hosts ifyou need the trap sent to multiple SNMP hosts.
If using SNMP V1, you will be prompted for a Trap Number. Type 1, 2, or 3, based on theappropriate suffix number from table below.
If using SNMP V2, you will be prompted for a Trap Object ID. Type info, warning, or critical,based on the table below.
Trap Object ID and suffix number
Object ID Suffix Number Added toPEN
PEN with the Suffix Added
info 1 1.3.6.1.4.1.33482.1
warn, warning 2 1.3.6.1.4.1.33482.2
crit, critical, error 3 1.3.6.1.4.1.33482.3
CHAPTER 6. ALERTS
37
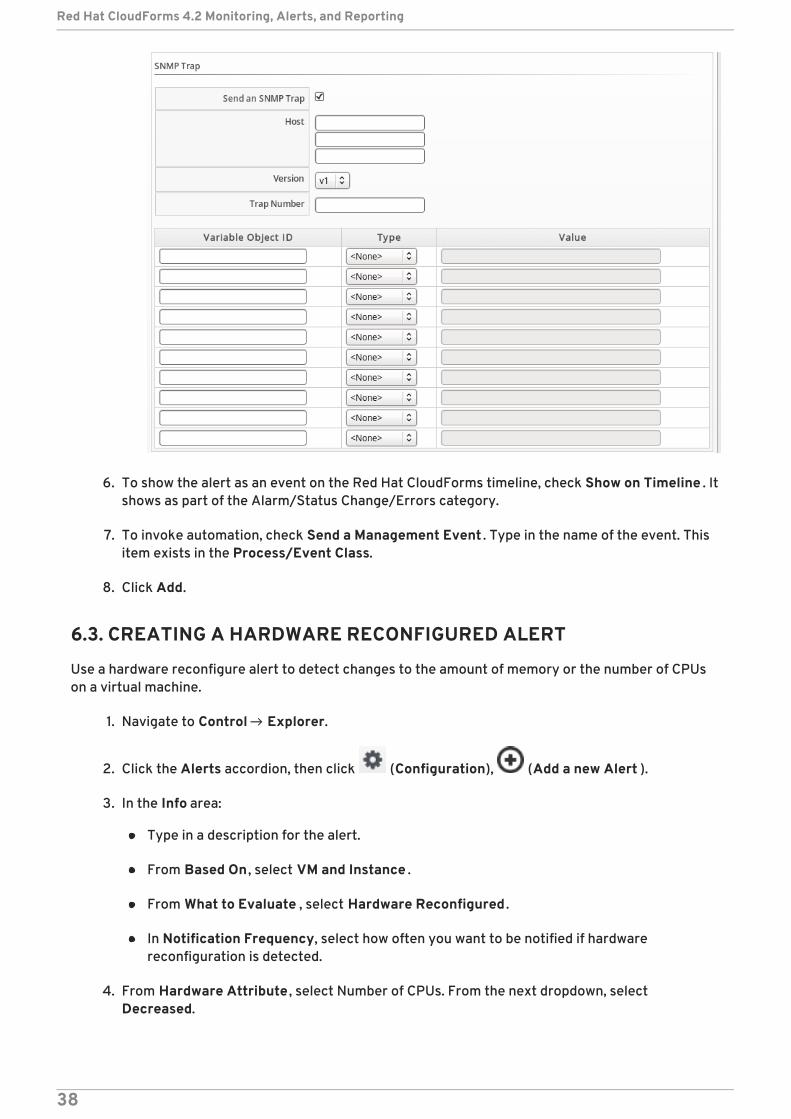
6. To show the alert as an event on the Red Hat CloudForms timeline, check Show on Timeline . Itshows as part of the Alarm/Status Change/Errors category.
7. To invoke automation, check Send a Management Event . Type in the name of the event. Thisitem exists in the Process/Event Class.
8. Click Add.
6.3. CREATING A HARDWARE RECONFIGURED ALERT
Use a hardware reconfigure alert to detect changes to the amount of memory or the number of CPUson a virtual machine.
1. Navigate to Control → Explorer.
2. Click the Alerts accordion, then click (Configuration), (Add a new Alert ).
3. In the Info area:
Type in a description for the alert.
From Based On , select VM and Instance .
From What to Evaluate , select Hardware Reconfigured .
In Notification Frequency, select how often you want to be notified if hardwarereconfiguration is detected.
4. From Hardware Attribute , select Number of CPUs. From the next dropdown, selectDecreased.
Red Hat CloudForms 4.2 Monitoring, Alerts, and Reporting
38
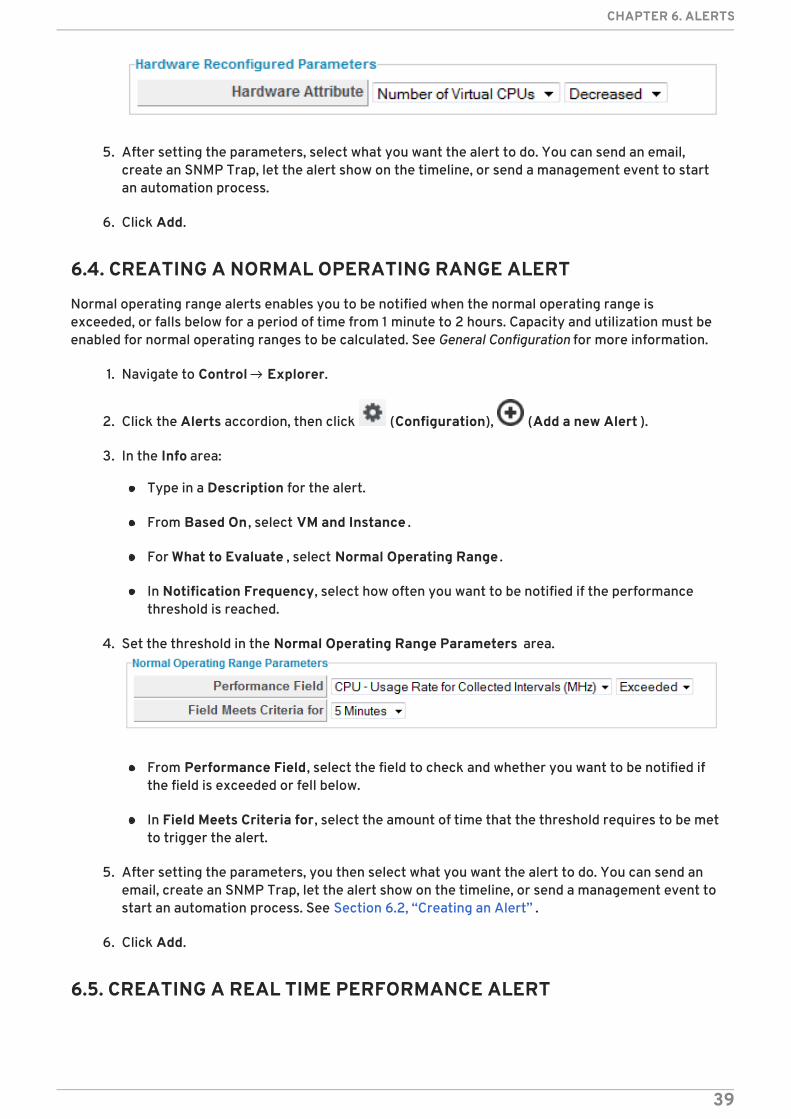
5. After setting the parameters, select what you want the alert to do. You can send an email,create an SNMP Trap, let the alert show on the timeline, or send a management event to startan automation process.
6. Click Add.
6.4. CREATING A NORMAL OPERATING RANGE ALERT
Normal operating range alerts enables you to be notified when the normal operating range isexceeded, or falls below for a period of time from 1 minute to 2 hours. Capacity and utilization must beenabled for normal operating ranges to be calculated. See General Configuration for more information.
1. Navigate to Control → Explorer.
2. Click the Alerts accordion, then click (Configuration), (Add a new Alert ).
3. In the Info area:
Type in a Description for the alert.
From Based On , select VM and Instance .
For What to Evaluate , select Normal Operating Range .
In Notification Frequency, select how often you want to be notified if the performancethreshold is reached.
4. Set the threshold in the Normal Operating Range Parameters area.
From Performance Field, select the field to check and whether you want to be notified ifthe field is exceeded or fell below.
In Field Meets Criteria for, select the amount of time that the threshold requires to be metto trigger the alert.
5. After setting the parameters, you then select what you want the alert to do. You can send anemail, create an SNMP Trap, let the alert show on the timeline, or send a management event tostart an automation process. See Section 6.2, “Creating an Alert” .
6. Click Add.
6.5. CREATING A REAL TIME PERFORMANCE ALERT
CHAPTER 6. ALERTS
39

Real Time Performance alerts enables you to be notified immediately when a performance thresholdhas been met for a virtual machine, host, or cluster. Capacity and Utilization must be enabled forperformance thresholds to be detected. See General Configuration for more information.
1. Navigate to Control → Explorer.
2. Click the Alert accordion, then click (Configuration), (Add a new Alert ).
3. In the Info area:
Type in a Description for the alert.
From Based On , select VM and Instance .
For What to Evaluate , select Real Time Performance .
In Notification Frequency, select how often you want to be notified if the performancethreshold is reached.
4. Set the threshold in the Real Time Performance Parameters area.
From Performance Field, select the field to check and any other parameters required forthat field.
In And is Trending , select Don’t Care if it does not matter how the performance metric istrending. Otherwise, choose from the possible trending options.
In Field Meets Criteria for, select the amount of time that the threshold requires to be metto trigger the alert.
Set Debug Tracing to true only when directed to do so by Red Hat Support. This providesan extremely detailed level of logging and can result in many more log lines being written.
5. After setting the parameters, you then select what you want the alert to do. You can send anemail, create an SNMP Trap, let the alert show on the timeline, or send a management event tostart an automation process.
6. Click Add.
6.6. CREATING AN HOURLY PERFORMANCE ALERT
Hourly performance alerts enable you to be notified immediately when an hourly performancethreshold has been met for a cluster. Capacity and Utilization must be enabled for performancethresholds to be detected. See General Configuration for instructions.
1. Navigate to Control → Explorer.
2. Click the Alerts accordion.
Red Hat CloudForms 4.2 Monitoring, Alerts, and Reporting
40
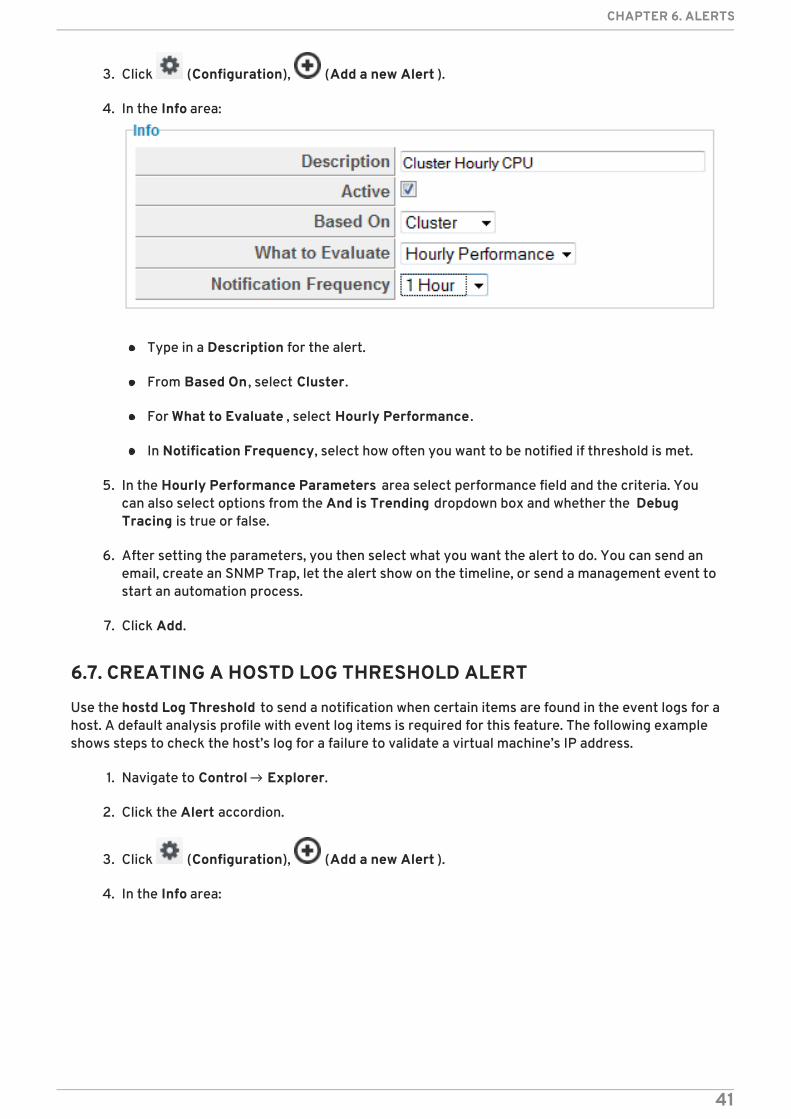
3. Click (Configuration), (Add a new Alert ).
4. In the Info area:
Type in a Description for the alert.
From Based On , select Cluster.
For What to Evaluate , select Hourly Performance .
In Notification Frequency, select how often you want to be notified if threshold is met.
5. In the Hourly Performance Parameters area select performance field and the criteria. Youcan also select options from the And is Trending dropdown box and whether the DebugTracing is true or false.
6. After setting the parameters, you then select what you want the alert to do. You can send anemail, create an SNMP Trap, let the alert show on the timeline, or send a management event tostart an automation process.
7. Click Add.
6.7. CREATING A HOSTD LOG THRESHOLD ALERT
Use the hostd Log Threshold to send a notification when certain items are found in the event logs for ahost. A default analysis profile with event log items is required for this feature. The following exampleshows steps to check the host’s log for a failure to validate a virtual machine’s IP address.
1. Navigate to Control → Explorer.
2. Click the Alert accordion.
3. Click (Configuration), (Add a new Alert ).
4. In the Info area:
CHAPTER 6. ALERTS
41
Type in a Description for the alert.
From Based On , select Host/Node.
For What to Evaluate , select Hostd Log Threshold .
In Notification Frequency, select how often you want to be notified if the log item isdetected.
5. In the Hostd Log Threshold Parameters area, select the parameters for the event logmessage. You can set a threshold for a filter, level, or message source.
Use Message Filter to look for specific text in a message. Use Message Level to filterbased on message level. Red Hat CloudForms reports on the specified level and above. UseMessage Source to filter log messages based on its source.
Set How Far Back to Check in days you want to look for this message.
If you only want an alert triggered when the log message has occurred a certain number oftimes, type the number in Event Count Threshold .
6. After setting the parameters, select what you want the alert to do. You can send an email,create an SNMP Trap, let the alert show on the timeline, or send a management event to startan automation process.
7. Click Add.
6.8. CREATING A VMWARE ALARM ALERT
Red Hat CloudForms can use VMware alarms as a trigger for an alert. This type of alert can be createdfor a cluster, host, or virtual machine.
1. Navigate to Control → Explorer.
2. Click the Alerts accordion, then click (Configuration), (Add a new Alert ).
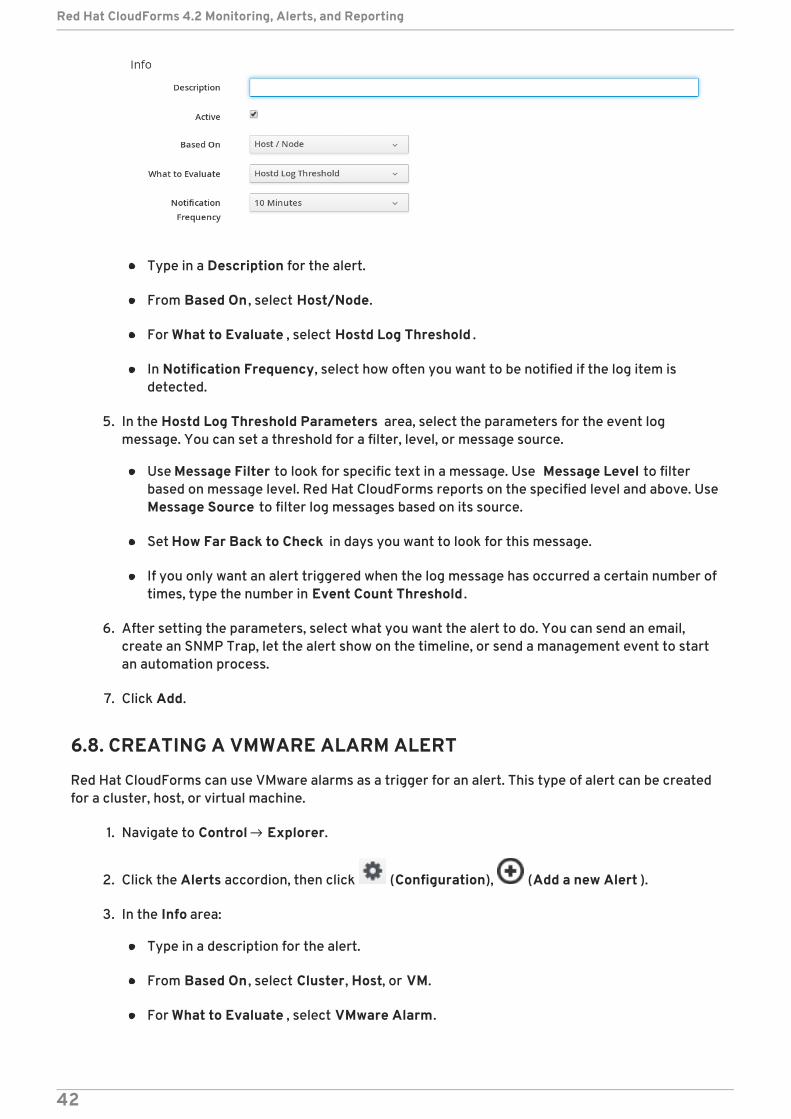
3. In the Info area:
Type in a description for the alert.
From Based On , select Cluster, Host, or VM.
For What to Evaluate , select VMware Alarm.
Red Hat CloudForms 4.2 Monitoring, Alerts, and Reporting
42
In Notification Frequency, select how often you want to be notified if the log item isdetected.
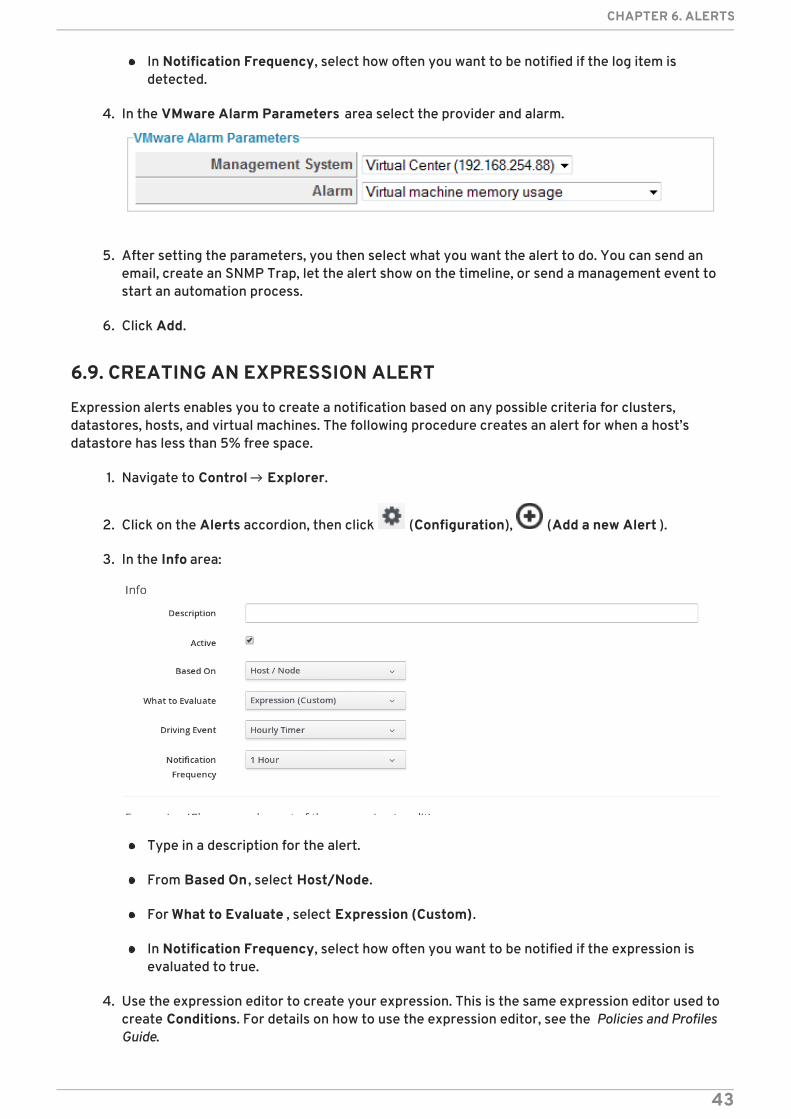
4. In the VMware Alarm Parameters area select the provider and alarm.
5. After setting the parameters, you then select what you want the alert to do. You can send anemail, create an SNMP Trap, let the alert show on the timeline, or send a management event tostart an automation process.
6. Click Add.
6.9. CREATING AN EXPRESSION ALERT
Expression alerts enables you to create a notification based on any possible criteria for clusters,datastores, hosts, and virtual machines. The following procedure creates an alert for when a host’sdatastore has less than 5% free space.
1. Navigate to Control → Explorer.
2. Click on the Alerts accordion, then click (Configuration), (Add a new Alert ).
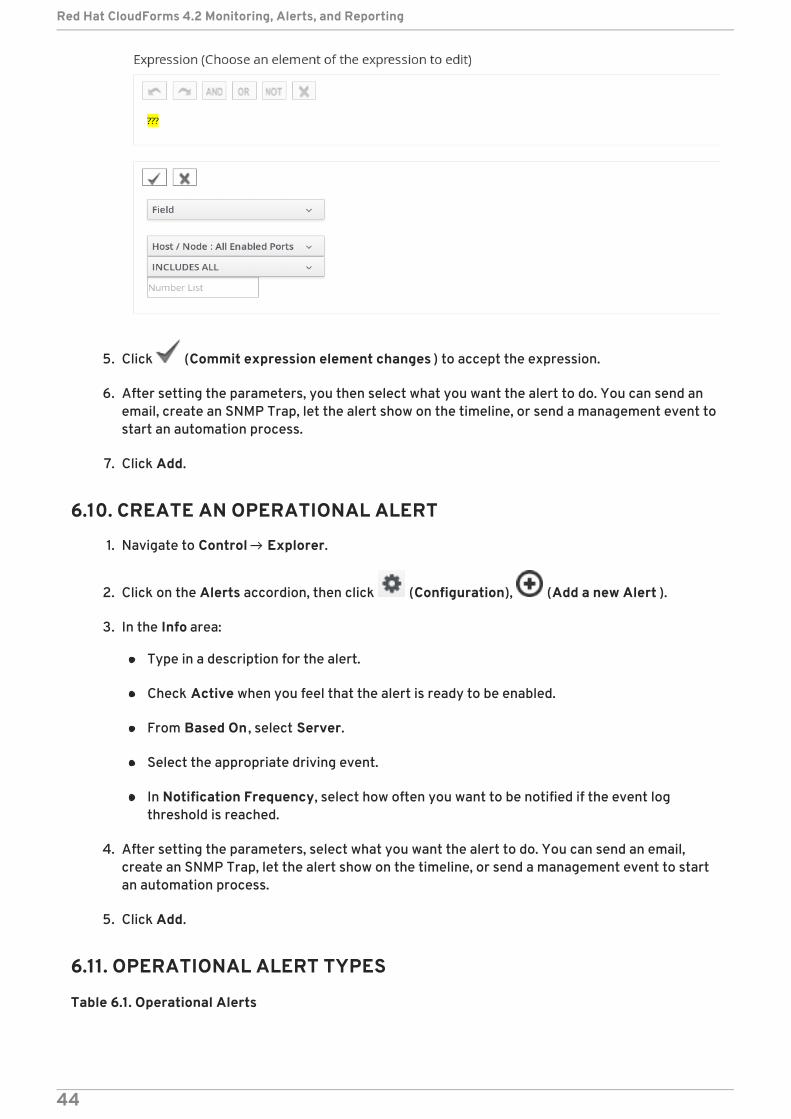
3. In the Info area:
Type in a description for the alert.
From Based On , select Host/Node.
For What to Evaluate , select Expression (Custom).
In Notification Frequency, select how often you want to be notified if the expression isevaluated to true.
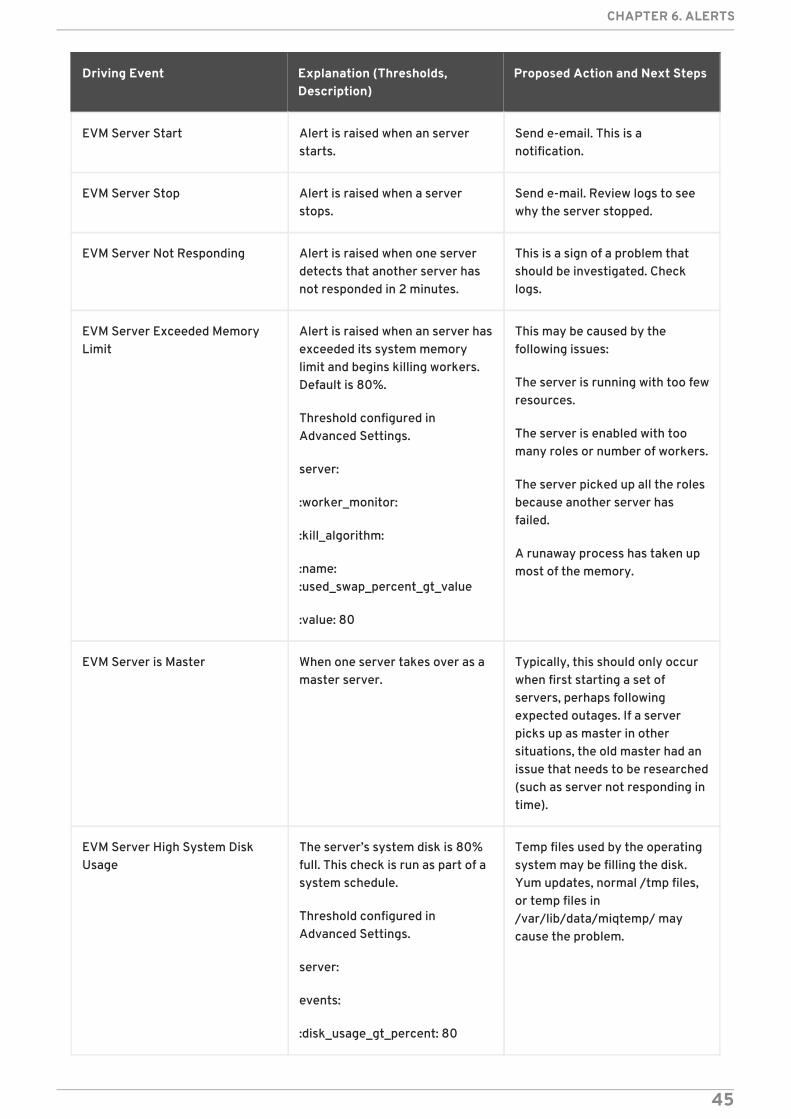
4. Use the expression editor to create your expression. This is the same expression editor used tocreate Conditions. For details on how to use the expression editor, see the Policies and ProfilesGuide.
CHAPTER 6. ALERTS
43
5. Click (Commit expression element changes ) to accept the expression.
6. After setting the parameters, you then select what you want the alert to do. You can send anemail, create an SNMP Trap, let the alert show on the timeline, or send a management event tostart an automation process.
7. Click Add.
6.10. CREATE AN OPERATIONAL ALERT
1. Navigate to Control → Explorer.
2. Click on the Alerts accordion, then click (Configuration), (Add a new Alert ).
3. In the Info area:
Type in a description for the alert.
Check Active when you feel that the alert is ready to be enabled.
From Based On , select Server.
Select the appropriate driving event.
In Notification Frequency, select how often you want to be notified if the event logthreshold is reached.
4. After setting the parameters, select what you want the alert to do. You can send an email,create an SNMP Trap, let the alert show on the timeline, or send a management event to startan automation process.
5. Click Add.
6.11. OPERATIONAL ALERT TYPES
Table 6.1. Operational Alerts
Red Hat CloudForms 4.2 Monitoring, Alerts, and Reporting
44
Driving Event Explanation (Thresholds,Description)
Proposed Action and Next Steps
EVM Server Start Alert is raised when an serverstarts.
Send e-email. This is anotification.
EVM Server Stop Alert is raised when a serverstops.
Send e-mail. Review logs to seewhy the server stopped.
EVM Server Not Responding Alert is raised when one serverdetects that another server hasnot responded in 2 minutes.
This is a sign of a problem thatshould be investigated. Checklogs.
EVM Server Exceeded MemoryLimit
Alert is raised when an server hasexceeded its system memorylimit and begins killing workers.Default is 80%.
Threshold configured inAdvanced Settings.
server:
:worker_monitor:
:kill_algorithm:
:name::used_swap_percent_gt_value
:value: 80
This may be caused by thefollowing issues:
The server is running with too fewresources.
The server is enabled with toomany roles or number of workers.
The server picked up all the rolesbecause another server hasfailed.
A runaway process has taken upmost of the memory.
EVM Server is Master When one server takes over as amaster server.
Typically, this should only occurwhen first starting a set ofservers, perhaps followingexpected outages. If a serverpicks up as master in othersituations, the old master had anissue that needs to be researched(such as server not responding intime).
EVM Server High System DiskUsage
The server’s system disk is 80%full. This check is run as part of asystem schedule.
Threshold configured inAdvanced Settings.
server:
events:
:disk_usage_gt_percent: 80
Temp files used by the operatingsystem may be filling the disk.Yum updates, normal /tmp files,or temp files in/var/lib/data/miqtemp/ maycause the problem.
CHAPTER 6. ALERTS
45
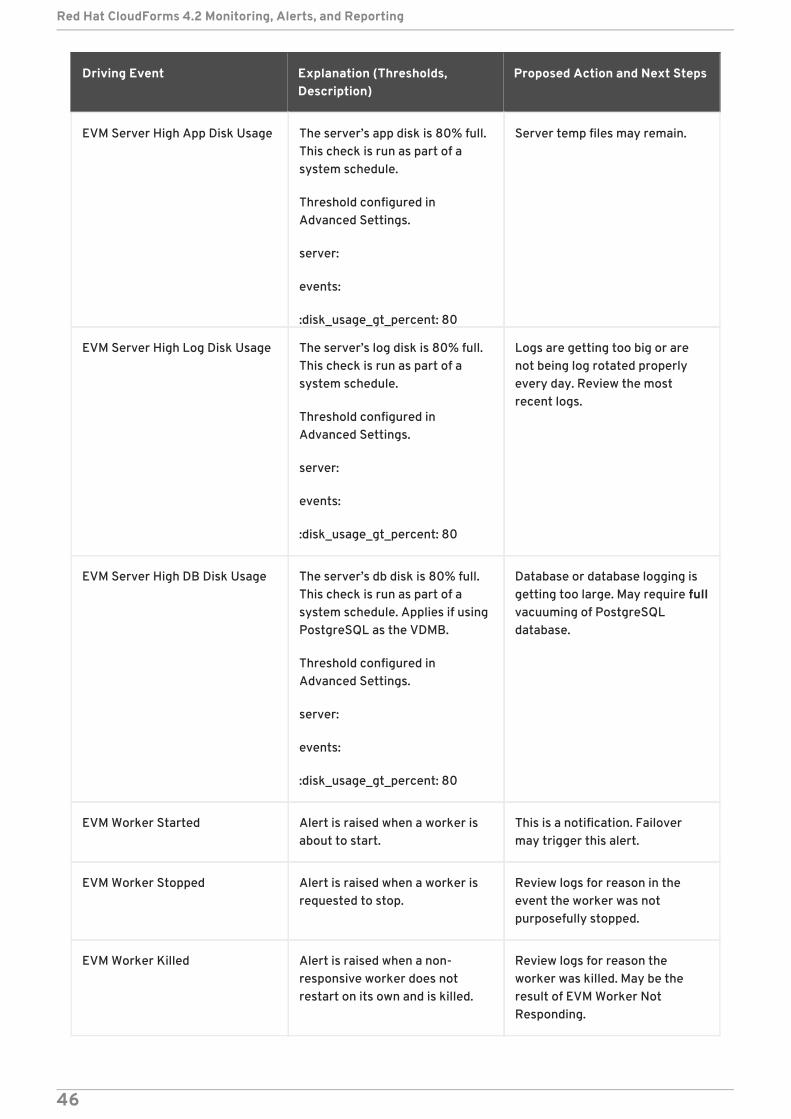
EVM Server High App Disk Usage The server’s app disk is 80% full.This check is run as part of asystem schedule.
Threshold configured inAdvanced Settings.
server:
events:
:disk_usage_gt_percent: 80
Server temp files may remain.
EVM Server High Log Disk Usage The server’s log disk is 80% full.This check is run as part of asystem schedule.
Threshold configured inAdvanced Settings.
server:
events:
:disk_usage_gt_percent: 80
Logs are getting too big or arenot being log rotated properlyevery day. Review the mostrecent logs.
EVM Server High DB Disk Usage The server’s db disk is 80% full.This check is run as part of asystem schedule. Applies if usingPostgreSQL as the VDMB.
Threshold configured inAdvanced Settings.
server:
events:
:disk_usage_gt_percent: 80
Database or database logging isgetting too large. May require fullvacuuming of PostgreSQLdatabase.
EVM Worker Started Alert is raised when a worker isabout to start.
This is a notification. Failovermay trigger this alert.
EVM Worker Stopped Alert is raised when a worker isrequested to stop.
Review logs for reason in theevent the worker was notpurposefully stopped.
EVM Worker Killed Alert is raised when a non-responsive worker does notrestart on its own and is killed.
Review logs for reason theworker was killed. May be theresult of EVM Worker NotResponding.
Driving Event Explanation (Thresholds,Description)
Proposed Action and Next Steps
Red Hat CloudForms 4.2 Monitoring, Alerts, and Reporting
46
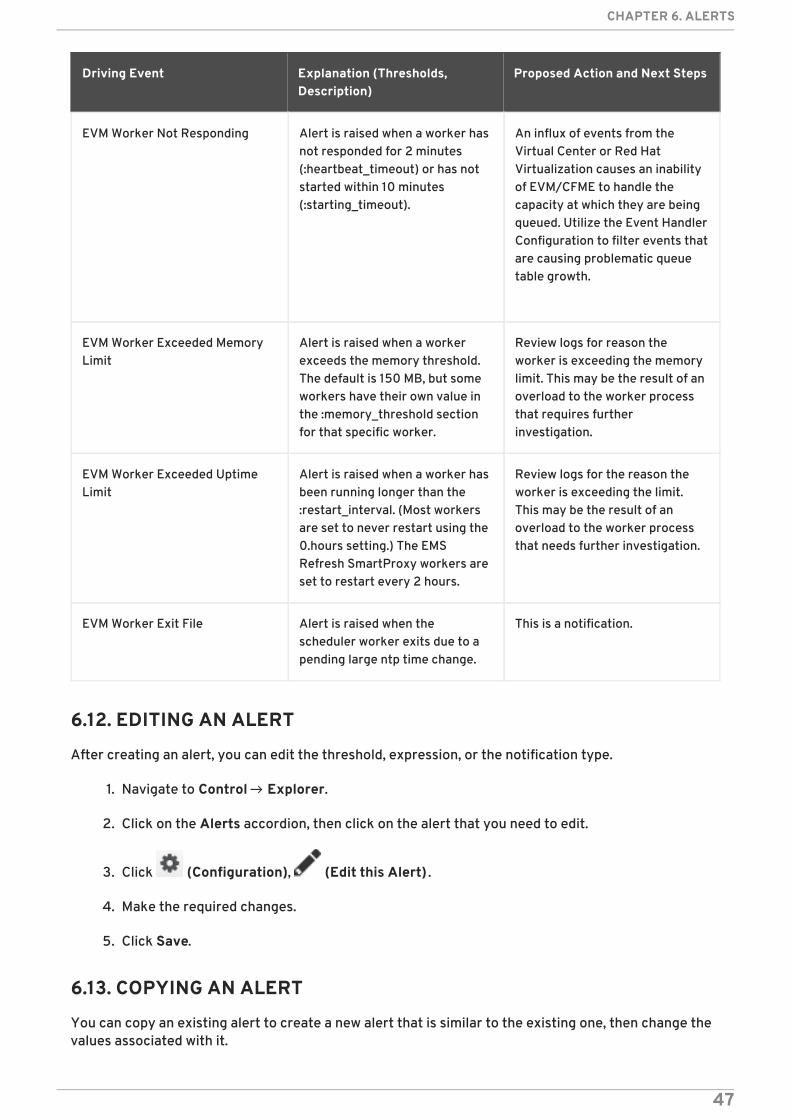
EVM Worker Not Responding Alert is raised when a worker hasnot responded for 2 minutes(:heartbeat_timeout) or has notstarted within 10 minutes(:starting_timeout).
An influx of events from theVirtual Center or Red HatVirtualization causes an inabilityof EVM/CFME to handle thecapacity at which they are beingqueued. Utilize the Event HandlerConfiguration to filter events thatare causing problematic queuetable growth.
EVM Worker Exceeded MemoryLimit
Alert is raised when a workerexceeds the memory threshold.The default is 150 MB, but someworkers have their own value inthe :memory_threshold sectionfor that specific worker.
Review logs for reason theworker is exceeding the memorylimit. This may be the result of anoverload to the worker processthat requires furtherinvestigation.
EVM Worker Exceeded UptimeLimit
Alert is raised when a worker hasbeen running longer than the:restart_interval. (Most workersare set to never restart using the0.hours setting.) The EMSRefresh SmartProxy workers areset to restart every 2 hours.
Review logs for the reason theworker is exceeding the limit.This may be the result of anoverload to the worker processthat needs further investigation.
EVM Worker Exit File Alert is raised when thescheduler worker exits due to apending large ntp time change.
This is a notification.
Driving Event Explanation (Thresholds,Description)
Proposed Action and Next Steps
6.12. EDITING AN ALERT
After creating an alert, you can edit the threshold, expression, or the notification type.
1. Navigate to Control → Explorer.
2. Click on the Alerts accordion, then click on the alert that you need to edit.
3. Click (Configuration), (Edit this Alert) .
4. Make the required changes.
5. Click Save.
6.13. COPYING AN ALERT
You can copy an existing alert to create a new alert that is similar to the existing one, then change thevalues associated with it.
CHAPTER 6. ALERTS
47
1. Navigate to Control → Explorer.
2. Click on the Alert accordion, then click on the alert that you want to copy.
3. Click (Configuration), (Copy this Alert). Click OK to confirm.
4. Make the required changes.
5. Click Add.
6.14. DELETING AN ALERT
When an alert is no longer needed, you can remove it from your VMDB.
1. Navigate to Control → Explorer.
2. Click on the Alerts accordion, then click on the alert that you want to delete.
3. Click (Configuration), (Delete this Alert ).
4. Click OK to confirm.
6.15. EVALUATING AN ALERT
1. Navigate to Control → Explorer.
2. Click the Actions accordion, then click (Configuration), (Add a new Action ).
3. Type in a Description for the action.
4. Select Evaluate Alerts from Action Type.
5. Select the alerts to be evaluated and click (Move selected Alerts into this Action ). Usethe Ctrl key to select multiple alerts.
Red Hat CloudForms 4.2 Monitoring, Alerts, and Reporting
48
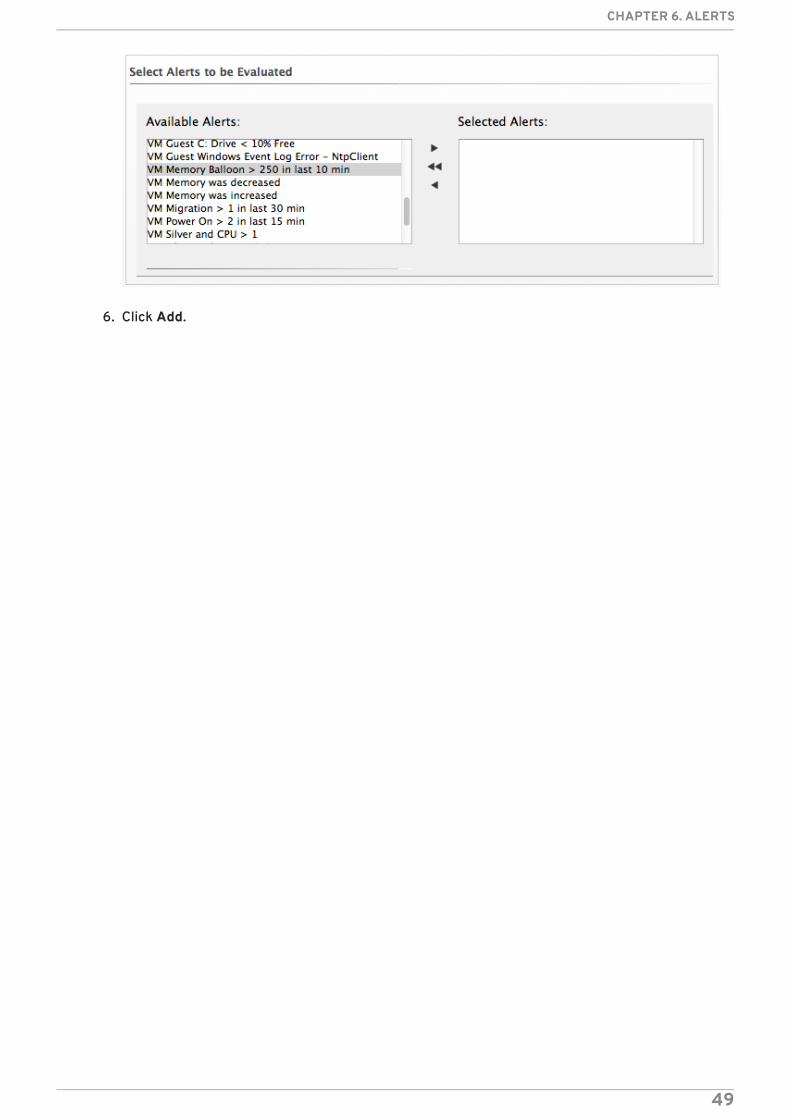
6. Click Add.
CHAPTER 6. ALERTS
49
CHAPTER 7. ALERT PROFILES
7.1. CREATING ALERT PROFILES
Alert profiles enable you to create groups of standard alerts. An alert profile can have as many alertsassigned as you need, and can be assigned to clusters, datastores, hosts, and virtual machines.
NOTE
Each profile type under the Alert Profile accordion menu will have its own AlertSelections and subsequent Assignments choices.
1. Navigate to Control → Explorer.
2. Click on the Alert Profiles accordion, then click on the type of profile that you want to create.
3. Click (Configuration), (Add a new Profile ).
4. In the Basic Information box, type in a unique Description for the alert profile.
5. Select the desired alerts from the Alert Selection area. Use the Ctrl key to select multiplealerts.
6. Click to add the Alerts.
7. Type in any additional description in the Notes area.
8. Click Add.
7.2. EDITING AN ALERT PROFILE
You can edit an alert profile as your enterprise’s needs change.
1. Navigate to Control → Explorer.
2. Click on the Alert Profiles accordion, then click the alert profile you want to edit.
3. Click (Configuration), (Edit this Alert Profile ).
4. Make the required changes.
5. Click Save.
7.3. DELETING AN ALERT PROFILE
Remove alert profiles that you no longer need. This does not remove the alerts associated with thealert profile.
1. Navigate to Control → Explorer.
2. Click on the Alert Profiles accordion, then click the alert profile you want to remove.
Red Hat CloudForms 4.2 Monitoring, Alerts, and Reporting
50
3. Click (Configuration), (Delete this Alert Profile ).
4. Click OK to confirm.
7.4. ASSIGNING AN ALERT PROFILE
After an alert profile is created and verified, you can assign it directly to a resource.
1. Navigate to Control → Explorer.
2. Click on the Alert Profiles accordion, then click on the alert profile that you want to assign.
3. Click (Configuration), (Edit Assignments for this Alert Profile ).
4. The options presented change based on if the alert is for a cluster, datastore, Red HatCloudForms server, host, or virtual machine and instance. You can assign to the enterprise, tospecific hosts, cluster, resource pools, and providers, or based on assign tags. For a Red HatCloudForms server alert profile, you can only assign to Red Hat CloudForms servers in thecurrent Region.
5. Click Save.
CHAPTER 7. ALERT PROFILES
51
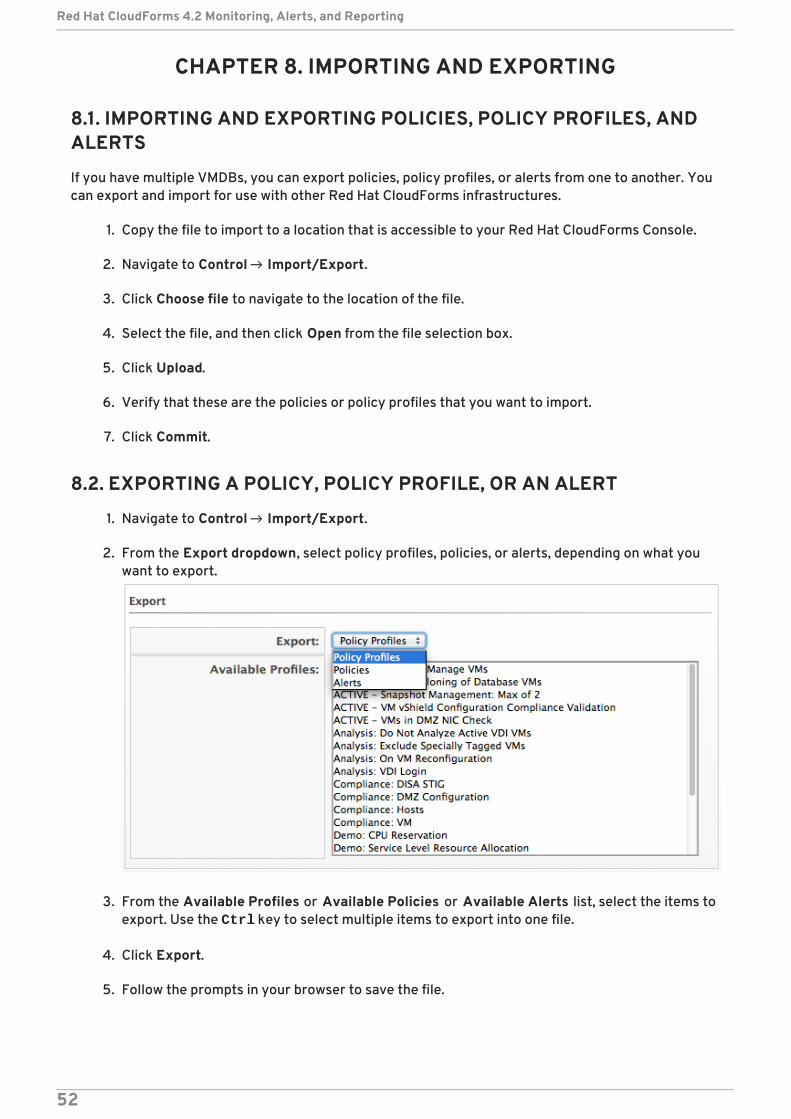
CHAPTER 8. IMPORTING AND EXPORTING
8.1. IMPORTING AND EXPORTING POLICIES, POLICY PROFILES, ANDALERTS
If you have multiple VMDBs, you can export policies, policy profiles, or alerts from one to another. Youcan export and import for use with other Red Hat CloudForms infrastructures.
1. Copy the file to import to a location that is accessible to your Red Hat CloudForms Console.
2. Navigate to Control → Import/Export.
3. Click Choose file to navigate to the location of the file.
4. Select the file, and then click Open from the file selection box.
5. Click Upload.
6. Verify that these are the policies or policy profiles that you want to import.
7. Click Commit.
8.2. EXPORTING A POLICY, POLICY PROFILE, OR AN ALERT
1. Navigate to Control → Import/Export.
2. From the Export dropdown, select policy profiles, policies, or alerts, depending on what youwant to export.
3. From the Available Profiles or Available Policies or Available Alerts list, select the items toexport. Use the Ctrl key to select multiple items to export into one file.
4. Click Export.
5. Follow the prompts in your browser to save the file.
Red Hat CloudForms 4.2 Monitoring, Alerts, and Reporting
52
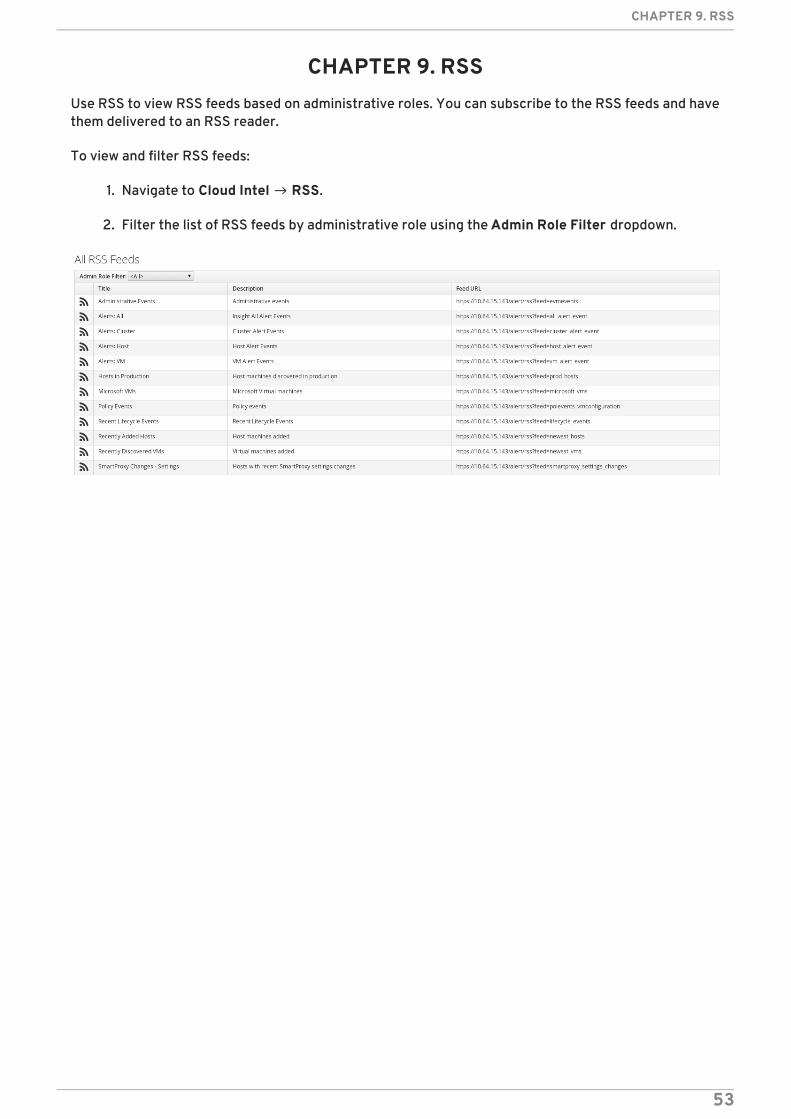
CHAPTER 9. RSSUse RSS to view RSS feeds based on administrative roles. You can subscribe to the RSS feeds and havethem delivered to an RSS reader.
To view and filter RSS feeds:
1. Navigate to Cloud Intel → RSS.
2. Filter the list of RSS feeds by administrative role using the Admin Role Filter dropdown.
CHAPTER 9. RSS
53
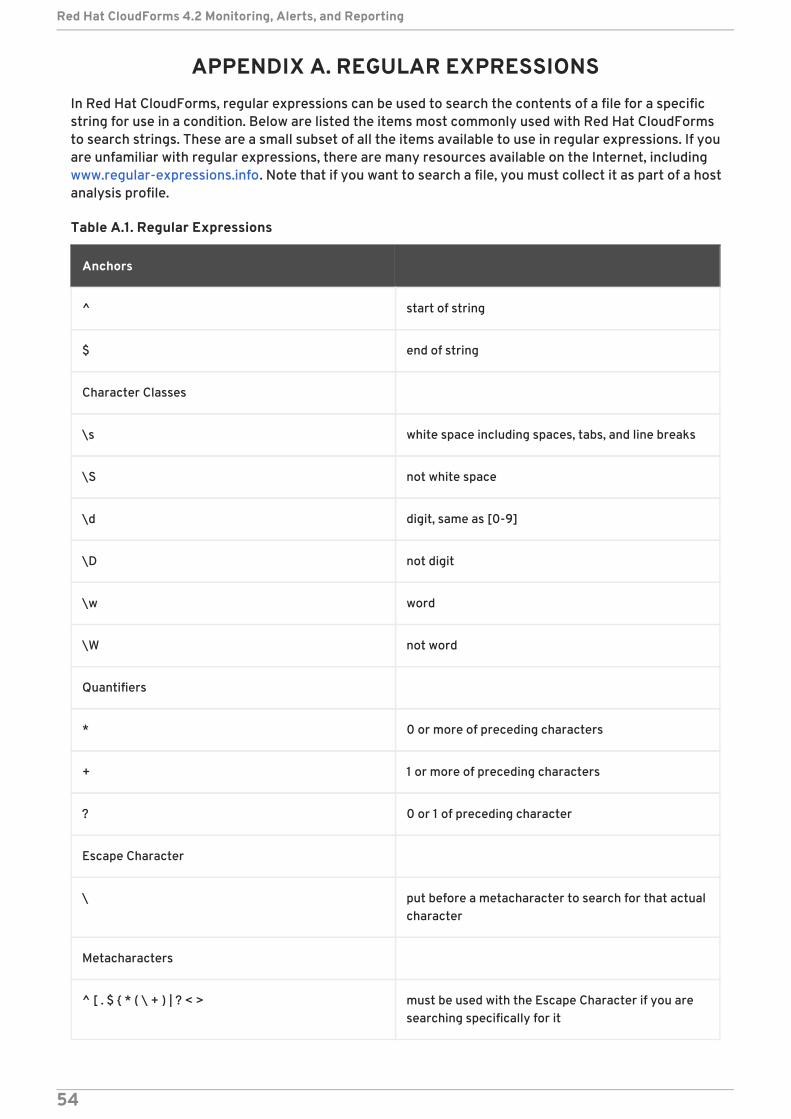
APPENDIX A. REGULAR EXPRESSIONSIn Red Hat CloudForms, regular expressions can be used to search the contents of a file for a specificstring for use in a condition. Below are listed the items most commonly used with Red Hat CloudFormsto search strings. These are a small subset of all the items available to use in regular expressions. If youare unfamiliar with regular expressions, there are many resources available on the Internet, includingwww.regular-expressions.info. Note that if you want to search a file, you must collect it as part of a hostanalysis profile.
Table A.1. Regular Expressions
Anchors
^ start of string
$ end of string
Character Classes
\s white space including spaces, tabs, and line breaks
\S not white space
\d digit, same as [0-9]
\D not digit
\w word
\W not word
Quantifiers
* 0 or more of preceding characters
+ 1 or more of preceding characters
? 0 or 1 of preceding character
Escape Character
\ put before a metacharacter to search for that actualcharacter
Metacharacters
^ [ . $ { * ( \ + ) | ? < > must be used with the Escape Character if you aresearching specifically for it
Red Hat CloudForms 4.2 Monitoring, Alerts, and Reporting
54
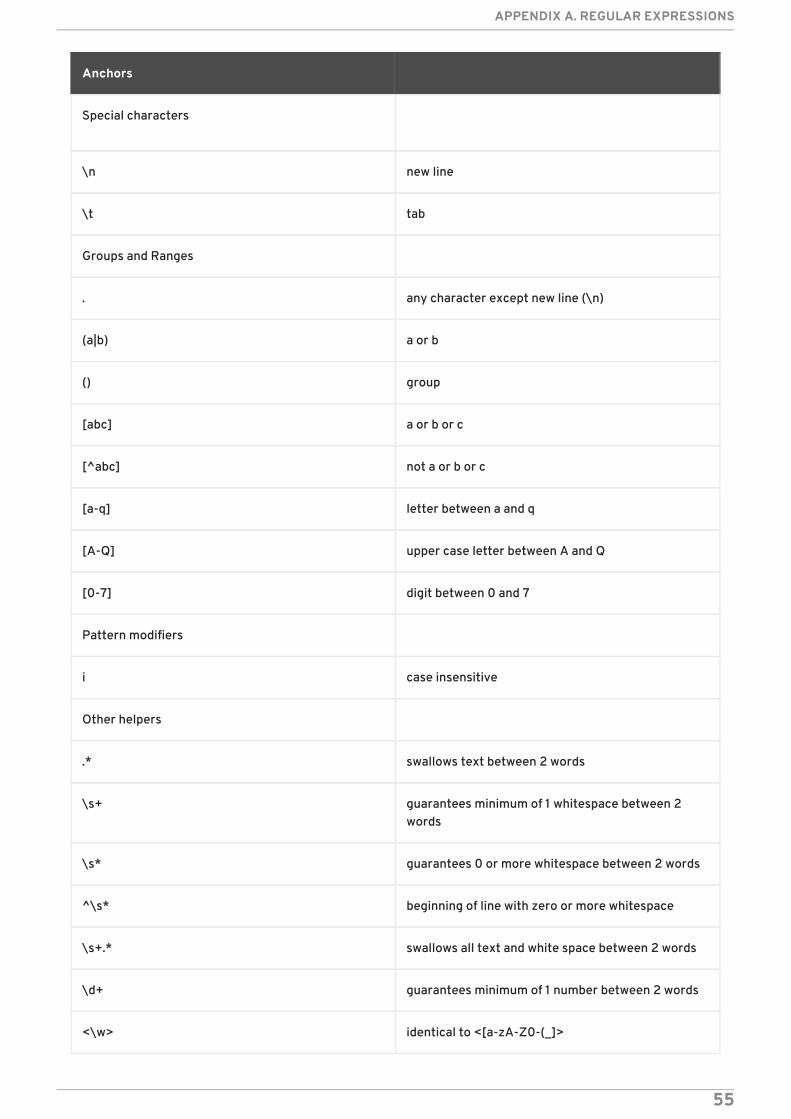
Special characters
\n new line
\t tab
Groups and Ranges
. any character except new line (\n)
(a|b) a or b
() group
[abc] a or b or c
[^abc] not a or b or c
[a-q] letter between a and q
[A-Q] upper case letter between A and Q
[0-7] digit between 0 and 7
Pattern modifiers
i case insensitive
Other helpers
.* swallows text between 2 words
\s+ guarantees minimum of 1 whitespace between 2words
\s* guarantees 0 or more whitespace between 2 words
^\s* beginning of line with zero or more whitespace
\s+.* swallows all text and white space between 2 words
\d+ guarantees minimum of 1 number between 2 words
<\w> identical to <[a-zA-Z0-(_]>
Anchors
APPENDIX A. REGULAR EXPRESSIONS
55
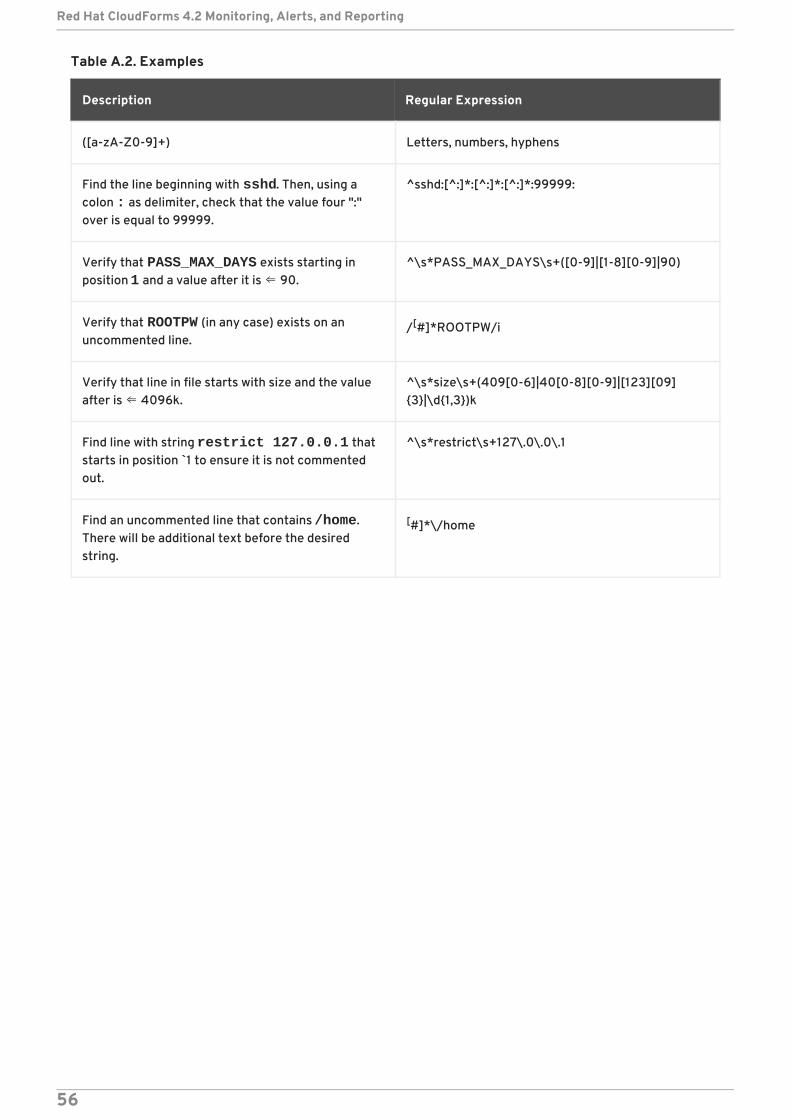
Table A.2. Examples
Description Regular Expression
([a-zA-Z0-9]+) Letters, numbers, hyphens
Find the line beginning with sshd. Then, using acolon : as delimiter, check that the value four ":"over is equal to 99999.
^sshd:[^:]*:[^:]*:[^:]*:99999:
Verify that PASS_MAX_DAYS exists starting inposition 1 and a value after it is ⇐ 90.
^\s*PASS_MAX_DAYS\s+([0-9]|[1-8][0-9]|90)
Verify that ROOTPW (in any case) exists on anuncommented line.
/[#]*ROOTPW/i
Verify that line in file starts with size and the valueafter is ⇐ 4096k.
^\s*size\s+(409[0-6]|40[0-8][0-9]|[123][09]{3}|\d{1,3})k
Find line with string restrict 127.0.0.1 thatstarts in position `1 to ensure it is not commentedout.
^\s*restrict\s+127\.0\.0\.1
Find an uncommented line that contains /home.There will be additional text before the desiredstring.
[#]*\/home
Red Hat CloudForms 4.2 Monitoring, Alerts, and Reporting
56
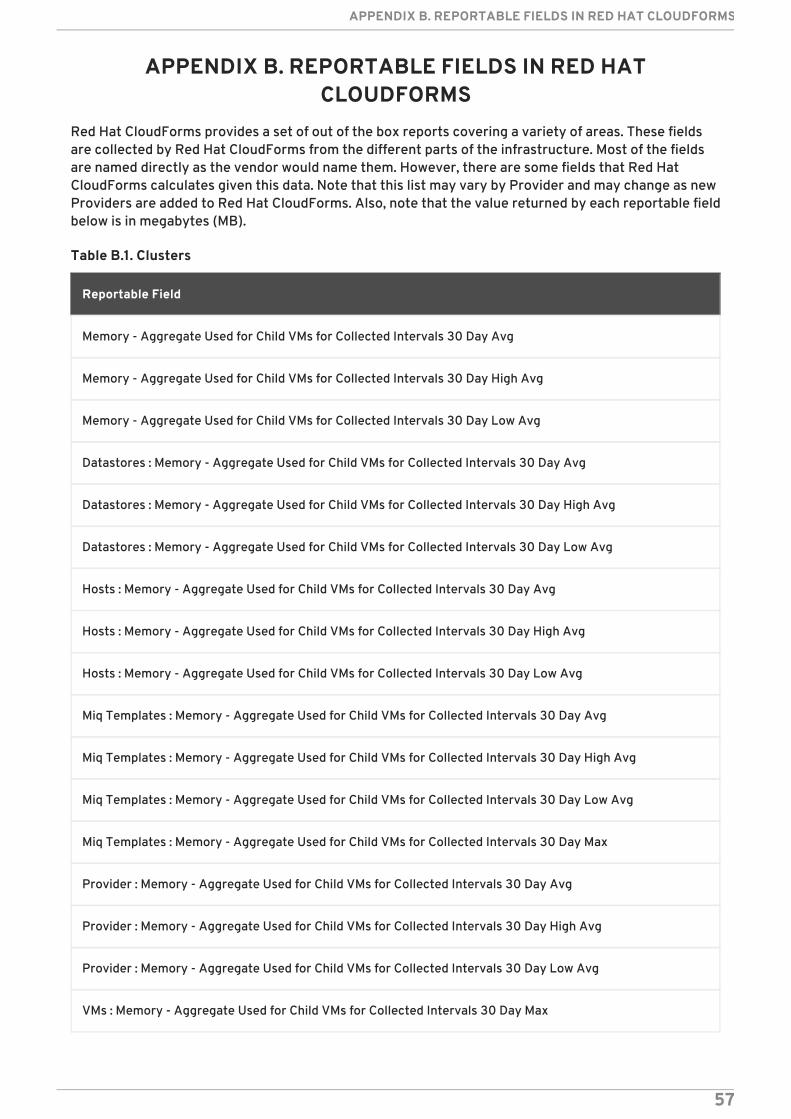
APPENDIX B. REPORTABLE FIELDS IN RED HATCLOUDFORMS
Red Hat CloudForms provides a set of out of the box reports covering a variety of areas. These fieldsare collected by Red Hat CloudForms from the different parts of the infrastructure. Most of the fieldsare named directly as the vendor would name them. However, there are some fields that Red HatCloudForms calculates given this data. Note that this list may vary by Provider and may change as newProviders are added to Red Hat CloudForms. Also, note that the value returned by each reportable fieldbelow is in megabytes (MB).
Table B.1. Clusters
Reportable Field
Memory - Aggregate Used for Child VMs for Collected Intervals 30 Day Avg
Memory - Aggregate Used for Child VMs for Collected Intervals 30 Day High Avg
Memory - Aggregate Used for Child VMs for Collected Intervals 30 Day Low Avg
Datastores : Memory - Aggregate Used for Child VMs for Collected Intervals 30 Day Avg
Datastores : Memory - Aggregate Used for Child VMs for Collected Intervals 30 Day High Avg
Datastores : Memory - Aggregate Used for Child VMs for Collected Intervals 30 Day Low Avg
Hosts : Memory - Aggregate Used for Child VMs for Collected Intervals 30 Day Avg
Hosts : Memory - Aggregate Used for Child VMs for Collected Intervals 30 Day High Avg
Hosts : Memory - Aggregate Used for Child VMs for Collected Intervals 30 Day Low Avg
Miq Templates : Memory - Aggregate Used for Child VMs for Collected Intervals 30 Day Avg
Miq Templates : Memory - Aggregate Used for Child VMs for Collected Intervals 30 Day High Avg
Miq Templates : Memory - Aggregate Used for Child VMs for Collected Intervals 30 Day Low Avg
Miq Templates : Memory - Aggregate Used for Child VMs for Collected Intervals 30 Day Max
Provider : Memory - Aggregate Used for Child VMs for Collected Intervals 30 Day Avg
Provider : Memory - Aggregate Used for Child VMs for Collected Intervals 30 Day High Avg
Provider : Memory - Aggregate Used for Child VMs for Collected Intervals 30 Day Low Avg
VMs : Memory - Aggregate Used for Child VMs for Collected Intervals 30 Day Max
APPENDIX B. REPORTABLE FIELDS IN RED HAT CLOUDFORMS
57
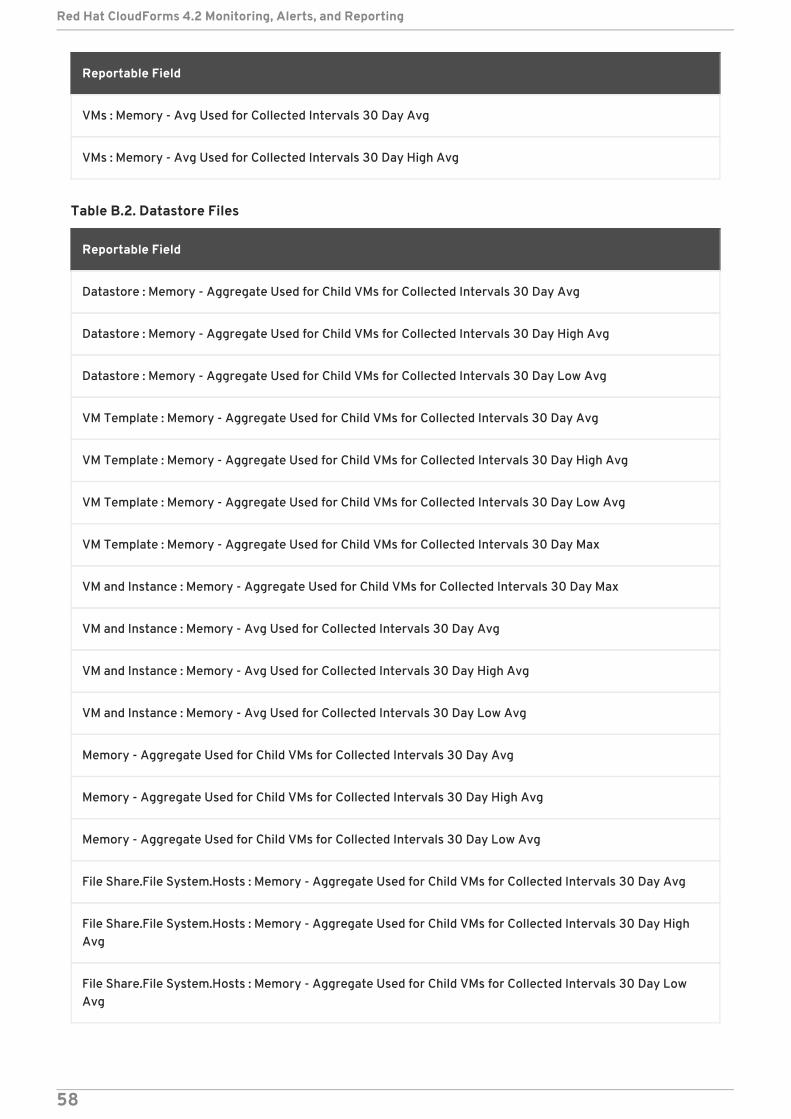
VMs : Memory - Avg Used for Collected Intervals 30 Day Avg
VMs : Memory - Avg Used for Collected Intervals 30 Day High Avg
Reportable Field
Table B.2. Datastore Files
Reportable Field
Datastore : Memory - Aggregate Used for Child VMs for Collected Intervals 30 Day Avg
Datastore : Memory - Aggregate Used for Child VMs for Collected Intervals 30 Day High Avg
Datastore : Memory - Aggregate Used for Child VMs for Collected Intervals 30 Day Low Avg
VM Template : Memory - Aggregate Used for Child VMs for Collected Intervals 30 Day Avg
VM Template : Memory - Aggregate Used for Child VMs for Collected Intervals 30 Day High Avg
VM Template : Memory - Aggregate Used for Child VMs for Collected Intervals 30 Day Low Avg
VM Template : Memory - Aggregate Used for Child VMs for Collected Intervals 30 Day Max
VM and Instance : Memory - Aggregate Used for Child VMs for Collected Intervals 30 Day Max
VM and Instance : Memory - Avg Used for Collected Intervals 30 Day Avg
VM and Instance : Memory - Avg Used for Collected Intervals 30 Day High Avg
VM and Instance : Memory - Avg Used for Collected Intervals 30 Day Low Avg
Memory - Aggregate Used for Child VMs for Collected Intervals 30 Day Avg
Memory - Aggregate Used for Child VMs for Collected Intervals 30 Day High Avg
Memory - Aggregate Used for Child VMs for Collected Intervals 30 Day Low Avg
File Share.File System.Hosts : Memory - Aggregate Used for Child VMs for Collected Intervals 30 Day Avg
File Share.File System.Hosts : Memory - Aggregate Used for Child VMs for Collected Intervals 30 Day HighAvg
File Share.File System.Hosts : Memory - Aggregate Used for Child VMs for Collected Intervals 30 Day LowAvg
Red Hat CloudForms 4.2 Monitoring, Alerts, and Reporting
58
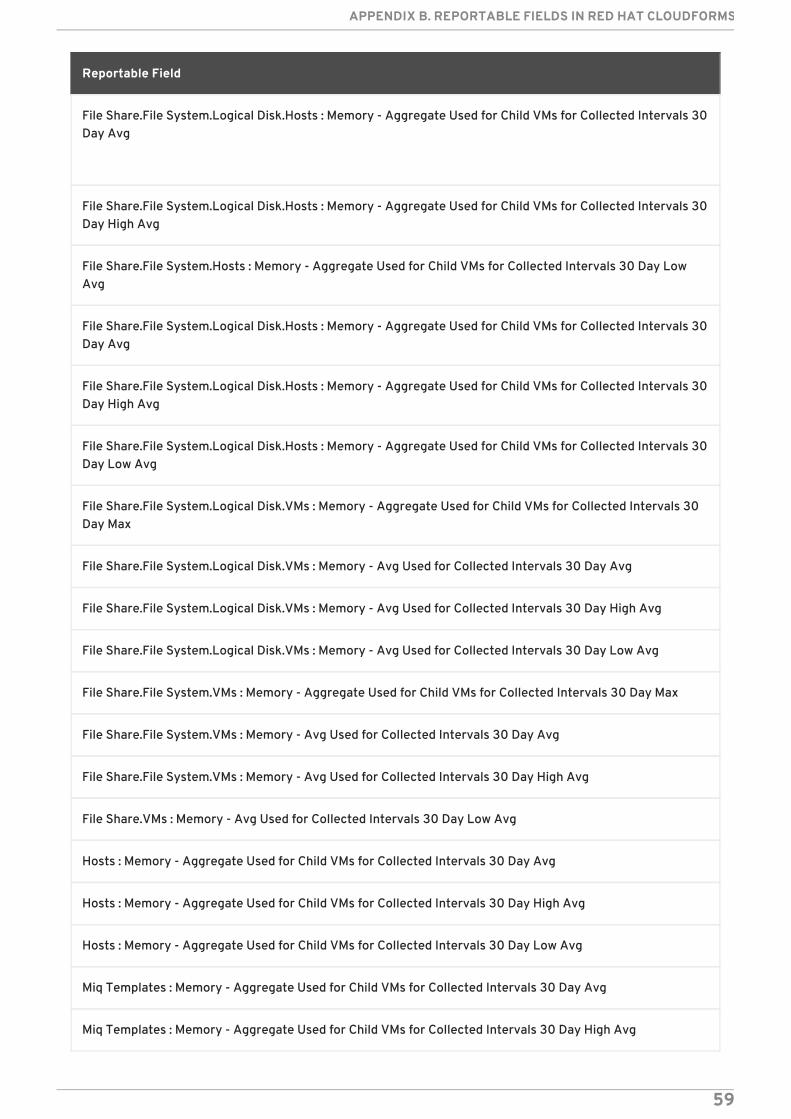
File Share.File System.Logical Disk.Hosts : Memory - Aggregate Used for Child VMs for Collected Intervals 30Day Avg
File Share.File System.Logical Disk.Hosts : Memory - Aggregate Used for Child VMs for Collected Intervals 30Day High Avg
File Share.File System.Hosts : Memory - Aggregate Used for Child VMs for Collected Intervals 30 Day LowAvg
File Share.File System.Logical Disk.Hosts : Memory - Aggregate Used for Child VMs for Collected Intervals 30Day Avg
File Share.File System.Logical Disk.Hosts : Memory - Aggregate Used for Child VMs for Collected Intervals 30Day High Avg
File Share.File System.Logical Disk.Hosts : Memory - Aggregate Used for Child VMs for Collected Intervals 30Day Low Avg
File Share.File System.Logical Disk.VMs : Memory - Aggregate Used for Child VMs for Collected Intervals 30Day Max
File Share.File System.Logical Disk.VMs : Memory - Avg Used for Collected Intervals 30 Day Avg
File Share.File System.Logical Disk.VMs : Memory - Avg Used for Collected Intervals 30 Day High Avg
File Share.File System.Logical Disk.VMs : Memory - Avg Used for Collected Intervals 30 Day Low Avg
File Share.File System.VMs : Memory - Aggregate Used for Child VMs for Collected Intervals 30 Day Max
File Share.File System.VMs : Memory - Avg Used for Collected Intervals 30 Day Avg
File Share.File System.VMs : Memory - Avg Used for Collected Intervals 30 Day High Avg
File Share.VMs : Memory - Avg Used for Collected Intervals 30 Day Low Avg
Hosts : Memory - Aggregate Used for Child VMs for Collected Intervals 30 Day Avg
Hosts : Memory - Aggregate Used for Child VMs for Collected Intervals 30 Day High Avg
Hosts : Memory - Aggregate Used for Child VMs for Collected Intervals 30 Day Low Avg
Miq Templates : Memory - Aggregate Used for Child VMs for Collected Intervals 30 Day Avg
Miq Templates : Memory - Aggregate Used for Child VMs for Collected Intervals 30 Day High Avg
Reportable Field
APPENDIX B. REPORTABLE FIELDS IN RED HAT CLOUDFORMS
59
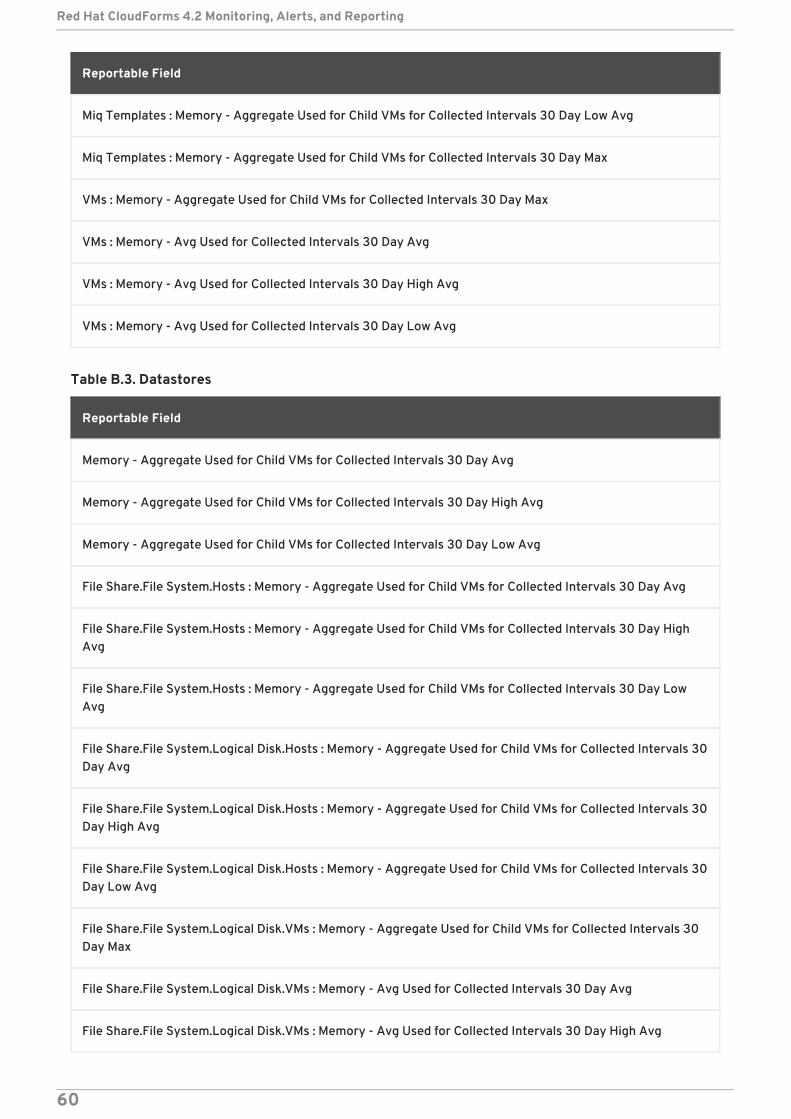
Miq Templates : Memory - Aggregate Used for Child VMs for Collected Intervals 30 Day Low Avg
Miq Templates : Memory - Aggregate Used for Child VMs for Collected Intervals 30 Day Max
VMs : Memory - Aggregate Used for Child VMs for Collected Intervals 30 Day Max
VMs : Memory - Avg Used for Collected Intervals 30 Day Avg
VMs : Memory - Avg Used for Collected Intervals 30 Day High Avg
VMs : Memory - Avg Used for Collected Intervals 30 Day Low Avg
Reportable Field
Table B.3. Datastores
Reportable Field
Memory - Aggregate Used for Child VMs for Collected Intervals 30 Day Avg
Memory - Aggregate Used for Child VMs for Collected Intervals 30 Day High Avg
Memory - Aggregate Used for Child VMs for Collected Intervals 30 Day Low Avg
File Share.File System.Hosts : Memory - Aggregate Used for Child VMs for Collected Intervals 30 Day Avg
File Share.File System.Hosts : Memory - Aggregate Used for Child VMs for Collected Intervals 30 Day HighAvg
File Share.File System.Hosts : Memory - Aggregate Used for Child VMs for Collected Intervals 30 Day LowAvg
File Share.File System.Logical Disk.Hosts : Memory - Aggregate Used for Child VMs for Collected Intervals 30Day Avg
File Share.File System.Logical Disk.Hosts : Memory - Aggregate Used for Child VMs for Collected Intervals 30Day High Avg
File Share.File System.Logical Disk.Hosts : Memory - Aggregate Used for Child VMs for Collected Intervals 30Day Low Avg
File Share.File System.Logical Disk.VMs : Memory - Aggregate Used for Child VMs for Collected Intervals 30Day Max
File Share.File System.Logical Disk.VMs : Memory - Avg Used for Collected Intervals 30 Day Avg
File Share.File System.Logical Disk.VMs : Memory - Avg Used for Collected Intervals 30 Day High Avg
Red Hat CloudForms 4.2 Monitoring, Alerts, and Reporting
60
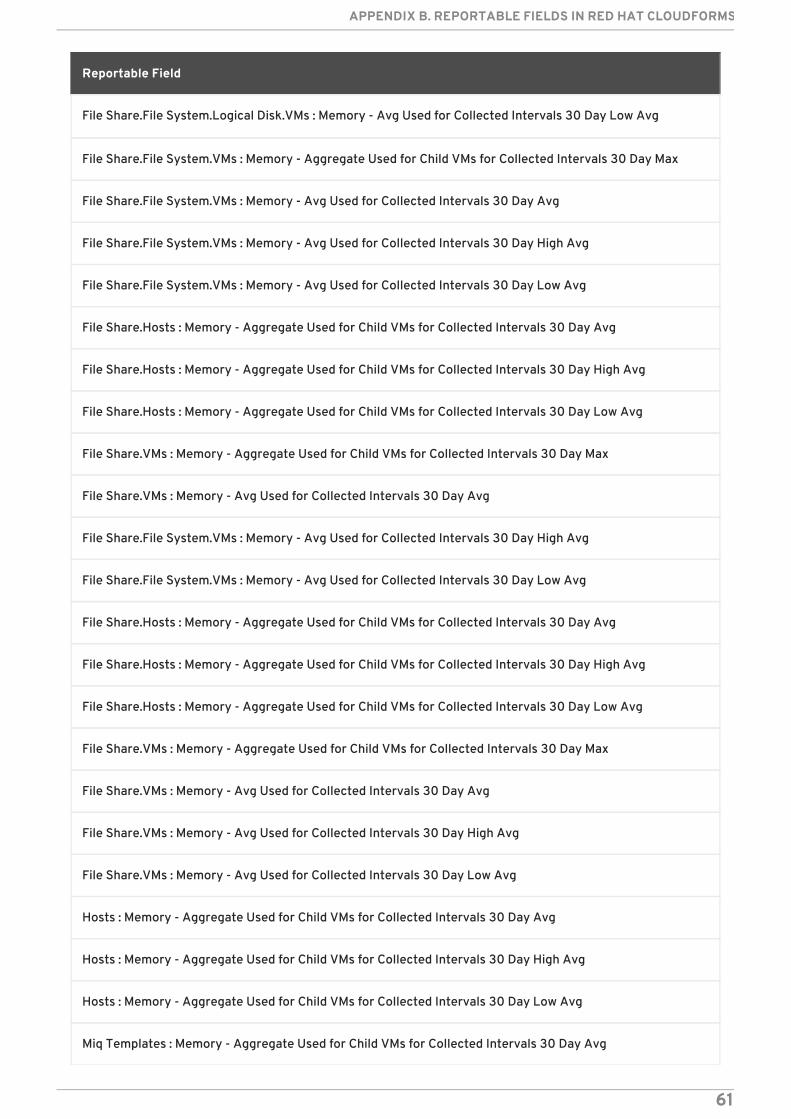
File Share.File System.Logical Disk.VMs : Memory - Avg Used for Collected Intervals 30 Day Low Avg
File Share.File System.VMs : Memory - Aggregate Used for Child VMs for Collected Intervals 30 Day Max
File Share.File System.VMs : Memory - Avg Used for Collected Intervals 30 Day Avg
File Share.File System.VMs : Memory - Avg Used for Collected Intervals 30 Day High Avg
File Share.File System.VMs : Memory - Avg Used for Collected Intervals 30 Day Low Avg
File Share.Hosts : Memory - Aggregate Used for Child VMs for Collected Intervals 30 Day Avg
File Share.Hosts : Memory - Aggregate Used for Child VMs for Collected Intervals 30 Day High Avg
File Share.Hosts : Memory - Aggregate Used for Child VMs for Collected Intervals 30 Day Low Avg
File Share.VMs : Memory - Aggregate Used for Child VMs for Collected Intervals 30 Day Max
File Share.VMs : Memory - Avg Used for Collected Intervals 30 Day Avg
File Share.VMs : Memory - Avg Used for Collected Intervals 30 Day High Avg
File Share.VMs : Memory - Avg Used for Collected Intervals 30 Day Low Avg
Hosts : Memory - Aggregate Used for Child VMs for Collected Intervals 30 Day Avg
Hosts : Memory - Aggregate Used for Child VMs for Collected Intervals 30 Day High Avg
Hosts : Memory - Aggregate Used for Child VMs for Collected Intervals 30 Day Low Avg
Miq Templates : Memory - Aggregate Used for Child VMs for Collected Intervals 30 Day Avg
Reportable Field
APPENDIX B. REPORTABLE FIELDS IN RED HAT CLOUDFORMS
61
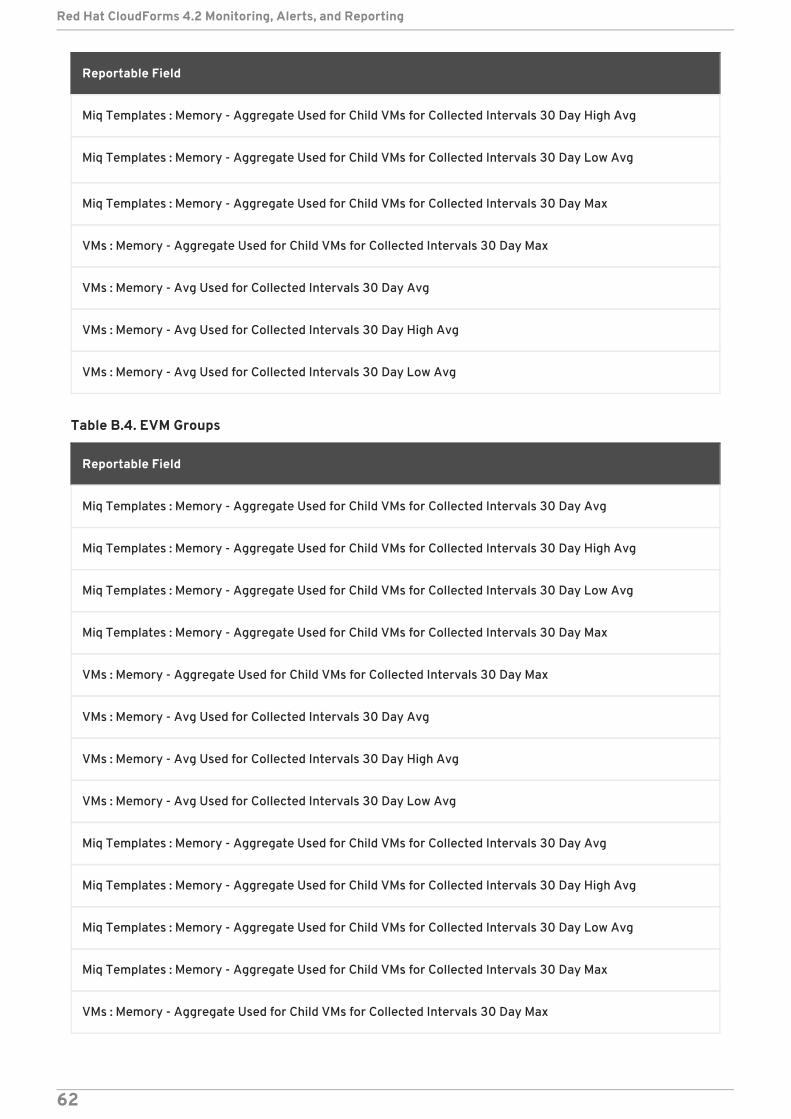
Miq Templates : Memory - Aggregate Used for Child VMs for Collected Intervals 30 Day High Avg
Miq Templates : Memory - Aggregate Used for Child VMs for Collected Intervals 30 Day Low Avg
Miq Templates : Memory - Aggregate Used for Child VMs for Collected Intervals 30 Day Max
VMs : Memory - Aggregate Used for Child VMs for Collected Intervals 30 Day Max
VMs : Memory - Avg Used for Collected Intervals 30 Day Avg
VMs : Memory - Avg Used for Collected Intervals 30 Day High Avg
VMs : Memory - Avg Used for Collected Intervals 30 Day Low Avg
Reportable Field
Table B.4. EVM Groups
Reportable Field
Miq Templates : Memory - Aggregate Used for Child VMs for Collected Intervals 30 Day Avg
Miq Templates : Memory - Aggregate Used for Child VMs for Collected Intervals 30 Day High Avg
Miq Templates : Memory - Aggregate Used for Child VMs for Collected Intervals 30 Day Low Avg
Miq Templates : Memory - Aggregate Used for Child VMs for Collected Intervals 30 Day Max
VMs : Memory - Aggregate Used for Child VMs for Collected Intervals 30 Day Max
VMs : Memory - Avg Used for Collected Intervals 30 Day Avg
VMs : Memory - Avg Used for Collected Intervals 30 Day High Avg
VMs : Memory - Avg Used for Collected Intervals 30 Day Low Avg
Miq Templates : Memory - Aggregate Used for Child VMs for Collected Intervals 30 Day Avg
Miq Templates : Memory - Aggregate Used for Child VMs for Collected Intervals 30 Day High Avg
Miq Templates : Memory - Aggregate Used for Child VMs for Collected Intervals 30 Day Low Avg
Miq Templates : Memory - Aggregate Used for Child VMs for Collected Intervals 30 Day Max
VMs : Memory - Aggregate Used for Child VMs for Collected Intervals 30 Day Max
Red Hat CloudForms 4.2 Monitoring, Alerts, and Reporting
62
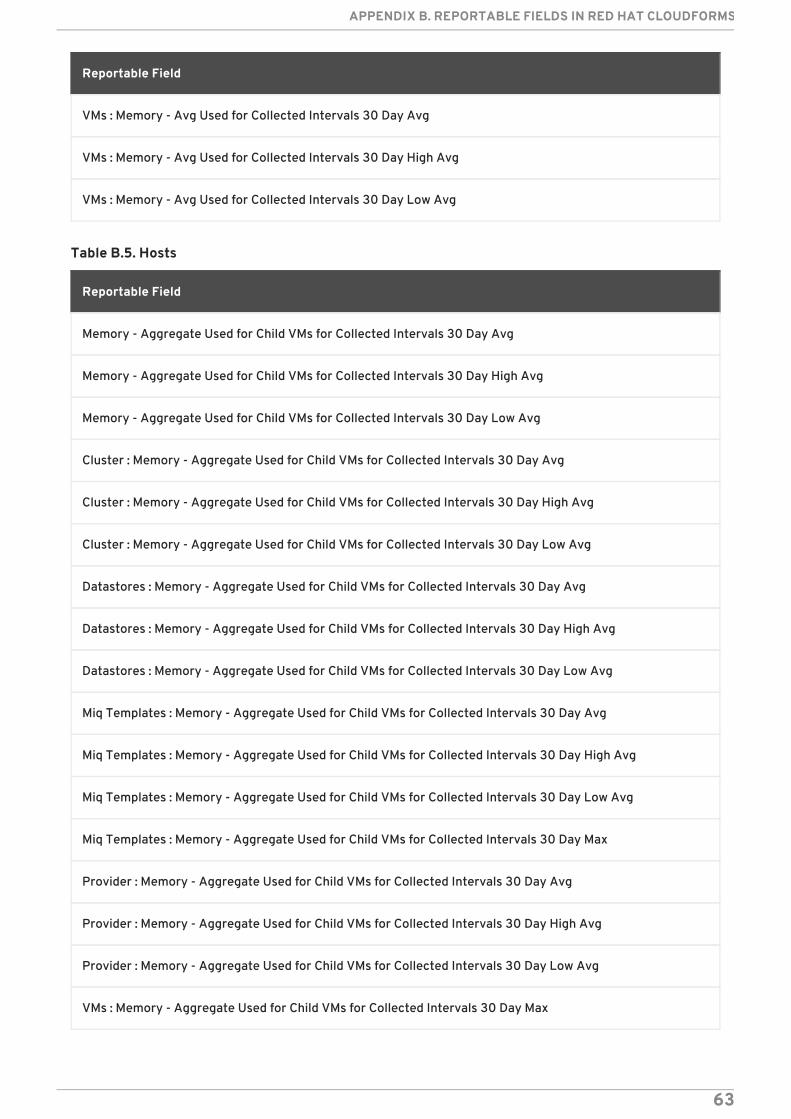
VMs : Memory - Avg Used for Collected Intervals 30 Day Avg
VMs : Memory - Avg Used for Collected Intervals 30 Day High Avg
VMs : Memory - Avg Used for Collected Intervals 30 Day Low Avg
Reportable Field
Table B.5. Hosts
Reportable Field
Memory - Aggregate Used for Child VMs for Collected Intervals 30 Day Avg
Memory - Aggregate Used for Child VMs for Collected Intervals 30 Day High Avg
Memory - Aggregate Used for Child VMs for Collected Intervals 30 Day Low Avg
Cluster : Memory - Aggregate Used for Child VMs for Collected Intervals 30 Day Avg
Cluster : Memory - Aggregate Used for Child VMs for Collected Intervals 30 Day High Avg
Cluster : Memory - Aggregate Used for Child VMs for Collected Intervals 30 Day Low Avg
Datastores : Memory - Aggregate Used for Child VMs for Collected Intervals 30 Day Avg
Datastores : Memory - Aggregate Used for Child VMs for Collected Intervals 30 Day High Avg
Datastores : Memory - Aggregate Used for Child VMs for Collected Intervals 30 Day Low Avg
Miq Templates : Memory - Aggregate Used for Child VMs for Collected Intervals 30 Day Avg
Miq Templates : Memory - Aggregate Used for Child VMs for Collected Intervals 30 Day High Avg
Miq Templates : Memory - Aggregate Used for Child VMs for Collected Intervals 30 Day Low Avg
Miq Templates : Memory - Aggregate Used for Child VMs for Collected Intervals 30 Day Max
Provider : Memory - Aggregate Used for Child VMs for Collected Intervals 30 Day Avg
Provider : Memory - Aggregate Used for Child VMs for Collected Intervals 30 Day High Avg
Provider : Memory - Aggregate Used for Child VMs for Collected Intervals 30 Day Low Avg
VMs : Memory - Aggregate Used for Child VMs for Collected Intervals 30 Day Max
APPENDIX B. REPORTABLE FIELDS IN RED HAT CLOUDFORMS
63
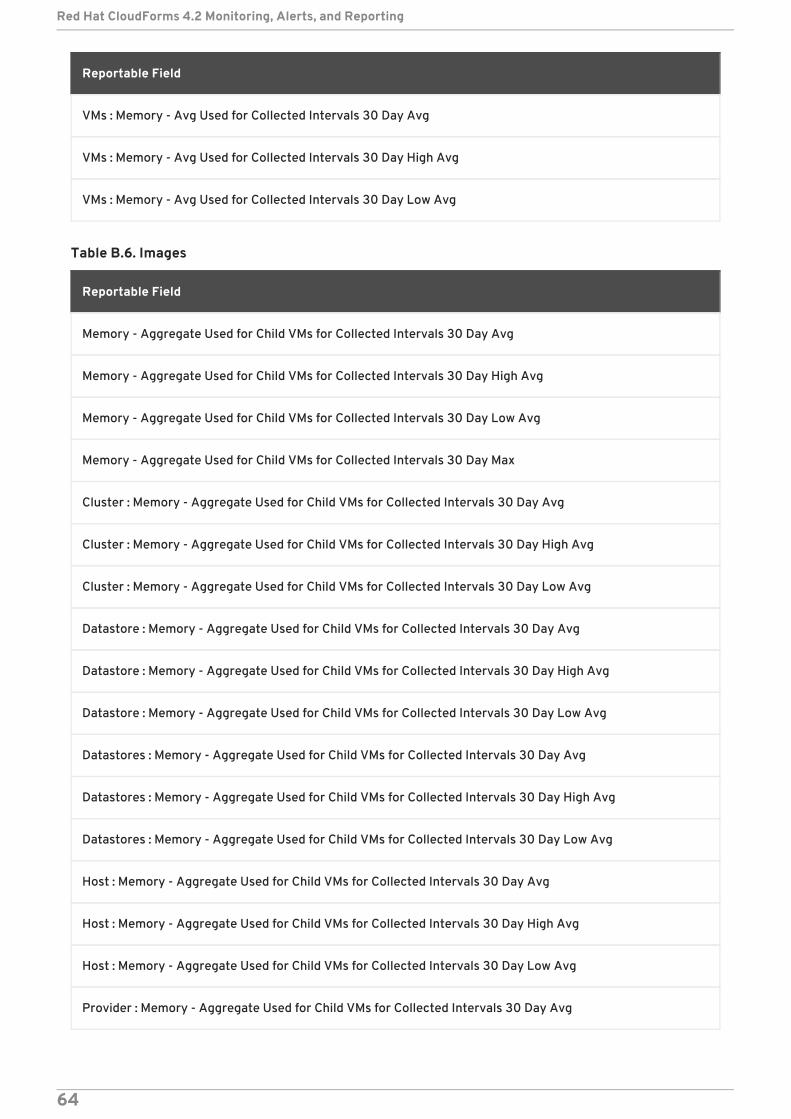
VMs : Memory - Avg Used for Collected Intervals 30 Day Avg
VMs : Memory - Avg Used for Collected Intervals 30 Day High Avg
VMs : Memory - Avg Used for Collected Intervals 30 Day Low Avg
Reportable Field
Table B.6. Images
Reportable Field
Memory - Aggregate Used for Child VMs for Collected Intervals 30 Day Avg
Memory - Aggregate Used for Child VMs for Collected Intervals 30 Day High Avg
Memory - Aggregate Used for Child VMs for Collected Intervals 30 Day Low Avg
Memory - Aggregate Used for Child VMs for Collected Intervals 30 Day Max
Cluster : Memory - Aggregate Used for Child VMs for Collected Intervals 30 Day Avg
Cluster : Memory - Aggregate Used for Child VMs for Collected Intervals 30 Day High Avg
Cluster : Memory - Aggregate Used for Child VMs for Collected Intervals 30 Day Low Avg
Datastore : Memory - Aggregate Used for Child VMs for Collected Intervals 30 Day Avg
Datastore : Memory - Aggregate Used for Child VMs for Collected Intervals 30 Day High Avg
Datastore : Memory - Aggregate Used for Child VMs for Collected Intervals 30 Day Low Avg
Datastores : Memory - Aggregate Used for Child VMs for Collected Intervals 30 Day Avg
Datastores : Memory - Aggregate Used for Child VMs for Collected Intervals 30 Day High Avg
Datastores : Memory - Aggregate Used for Child VMs for Collected Intervals 30 Day Low Avg
Host : Memory - Aggregate Used for Child VMs for Collected Intervals 30 Day Avg
Host : Memory - Aggregate Used for Child VMs for Collected Intervals 30 Day High Avg
Host : Memory - Aggregate Used for Child VMs for Collected Intervals 30 Day Low Avg
Provider : Memory - Aggregate Used for Child VMs for Collected Intervals 30 Day Avg
Red Hat CloudForms 4.2 Monitoring, Alerts, and Reporting
64
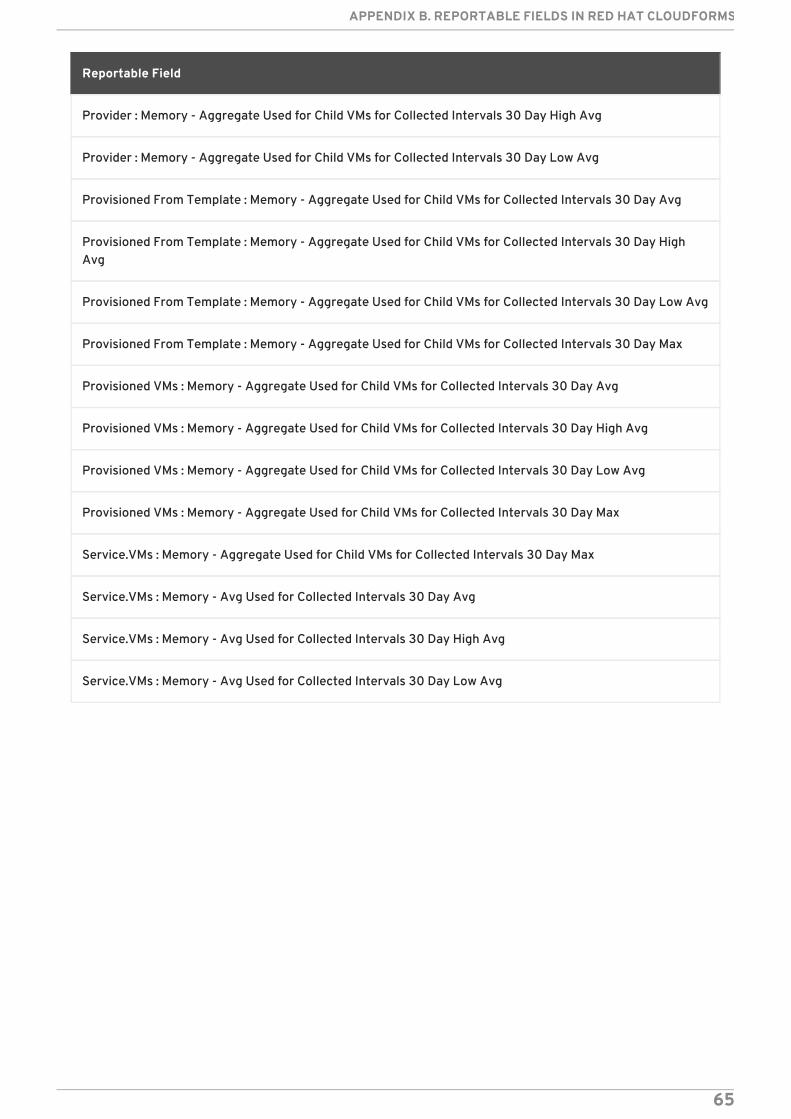
Provider : Memory - Aggregate Used for Child VMs for Collected Intervals 30 Day High Avg
Provider : Memory - Aggregate Used for Child VMs for Collected Intervals 30 Day Low Avg
Provisioned From Template : Memory - Aggregate Used for Child VMs for Collected Intervals 30 Day Avg
Provisioned From Template : Memory - Aggregate Used for Child VMs for Collected Intervals 30 Day HighAvg
Provisioned From Template : Memory - Aggregate Used for Child VMs for Collected Intervals 30 Day Low Avg
Provisioned From Template : Memory - Aggregate Used for Child VMs for Collected Intervals 30 Day Max
Provisioned VMs : Memory - Aggregate Used for Child VMs for Collected Intervals 30 Day Avg
Provisioned VMs : Memory - Aggregate Used for Child VMs for Collected Intervals 30 Day High Avg
Provisioned VMs : Memory - Aggregate Used for Child VMs for Collected Intervals 30 Day Low Avg
Provisioned VMs : Memory - Aggregate Used for Child VMs for Collected Intervals 30 Day Max
Service.VMs : Memory - Aggregate Used for Child VMs for Collected Intervals 30 Day Max
Service.VMs : Memory - Avg Used for Collected Intervals 30 Day Avg
Service.VMs : Memory - Avg Used for Collected Intervals 30 Day High Avg
Service.VMs : Memory - Avg Used for Collected Intervals 30 Day Low Avg
Reportable Field
APPENDIX B. REPORTABLE FIELDS IN RED HAT CLOUDFORMS
65