red queen dynamics in a predator-prey ecosystem - rugmwiering/group/articles/redqueen.pdf · red...
TRANSCRIPT
Red Queen dynamics in a predator-prey ecosystem
Walter de BackCognitieve Kunstmatige Intelligentie
Utrecht UniversityHeidelberglaan 6
3584 CS Utrecht, The Netherlands
Edwin D. de JongInstitute of Information and
Computing SciencesUtrecht UniversityPO Box 80.089
3508 TB Utrecht, The Netherlands
Marco WieringInstitute of Information and
Computing SciencesUtrecht UniversityPO Box 80.089
3508 TB Utrecht, The Netherlands
Categories and Subject DescriptorsF.0 [General]
General TermsAlgorithms, Experimentation, Performance
KeywordsCoevolution, Red-Queen dynamics
1. INTRODUCTIONCoevolution between predators and prey can lead to situ-
ations in which neither antagonist improves its fitness, sinceboth populations continually co-adapt to each other. Here,we take an eco-evolutionary approach to this ’red queen’ phe-nomenon (van Valen, 1973) to explain it as an interaction be-tween population dynamics and evolutionary dynamics.
2. METHODSWe use models of predator-prey coevolution based on
(van der Laan & Hogeweg, 1995) and (Savill & Hogeweg,1997): an individual-based simulation model and its mean-field approximation (ODE model). The simulation modelshows complex population dynamics and evolutionary redqueen dynamics. These results are interpreted analyticallyin terms of the ODE model.
2.1 SimulationWe use a spatially explicit individual-based model, imple-
mented in Framsticks (Komosinski, 2003). This model simu-lates an environment which is inhabited by a population ofprey and a population of predators.
Individuals and interaction.Prey are static plant-like entities that reproduce periodi-
cally (logistically) and can be consumed by predators. Preda-tors are modelled as situated agents that perform chemotaxicbehavior towards prey. Predators loose energy every timestep, and can gain energy by predation. A predator repro-duces when its energy exceeds a certain threshold. Predation(or consumption) of a prey by a predator is handled by trans-ferring the energy of the prey to the predator, which causes
Copyright is held by the author/owner(s).GECCO’06, July 8–12, 2006, Seattle, Washington, USA.ACM 1-59593-186-4/06/0007.
0
20
40
60
80
100
0 50000 100000
phen
otyp
estime
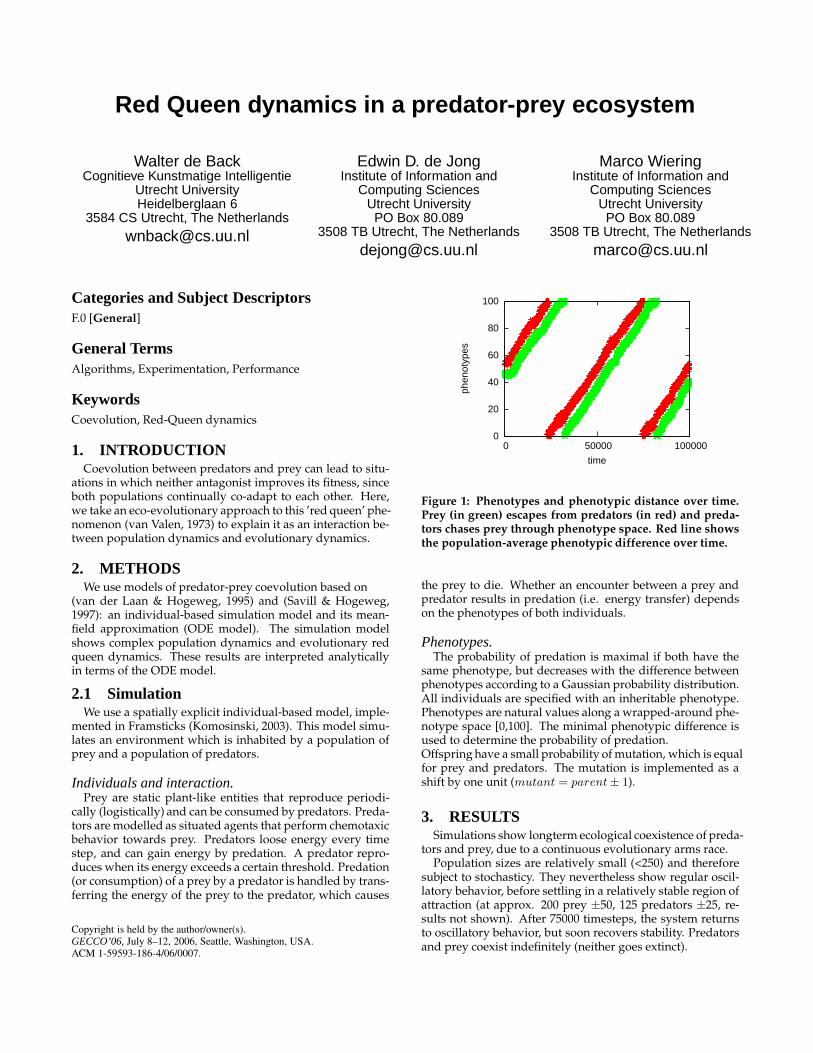
Figure 1: Phenotypes and phenotypic distance over time.Prey (in green) escapes from predators (in red) and preda-tors chases prey through phenotype space. Red line showsthe population-average phenotypic difference over time.
the prey to die. Whether an encounter between a prey andpredator results in predation (i.e. energy transfer) dependson the phenotypes of both individuals.
Phenotypes.The probability of predation is maximal if both have the
same phenotype, but decreases with the difference betweenphenotypes according to a Gaussian probability distribution.All individuals are specified with an inheritable phenotype.Phenotypes are natural values along a wrapped-around phe-notype space [0,100]. The minimal phenotypic difference isused to determine the probability of predation.Offspring have a small probability of mutation, which is equalfor prey and predators. The mutation is implemented as ashift by one unit (mutant = parent ± 1).
3. RESULTSSimulations show longterm ecological coexistence of preda-
tors and prey, due to a continuous evolutionary arms race.Population sizes are relatively small (<250) and therefore
subject to stochasticy. They nevertheless show regular oscil-latory behavior, before settling in a relatively stable region ofattraction (at approx. 200 prey ±50, 125 predators ±25, re-sults not shown). After 75000 timesteps, the system returnsto oscillatory behavior, but soon recovers stability. Predatorsand prey coexist indefinitely (neither goes extinct).
Evolutionary dynamics.The evolution of phenotypes, plotted in figure 1, shows an
evolutionary arms race through (wrapped) phenotype space.After an initial increase, the phenotypic difference (red line)remains relatively stable at values (12 − 15). A temporarydecrease is observed after 75000 timesteps, coinciding with apopulation dynamical change.The evolutionary dynamics seem to be constrained to a re-gion in which coexistence (hence coevolution) is possible.
4. THEORETICAL ANALYSISTo understand these constraints, we construct an analyti-
cal ODE model of the population dynamics, and relate theevolutionary dynamics to the change of a parameter in thismodel. A formal concept of fitness is also derived.
Ecological model.The mean-field approximation of the simulated ecologi-
cal interactions turns out to be equivalent to a well-studiedmodel described by Beddington (1975):
dR
dt= rR(1 −
R
K) −
aRC
h + R + eCdC
dt=
caRC
h + R + eC− dC (1)
where R (resources) is used to denote prey density andC (consumers) is used for predators. Further, r is intrin-sic growth rate, K is prey carrying capacity, a is maximumpredation rate, h represents handling time, c is biomass con-version rate, e is predator interference, and d is the predatordeath rate.
Evolutionary dynamics.In this ecological model, evolution can be understood sim-
ply as changes of the model parameters. In this case, we fo-cus on changes of the maximum predation rate a, which isproportional to the phenotypic difference between predatorand prey (determining the predation probability). Predationrates are low for individuals or populations that are phe-notypically very different, and high for those that are simi-lar. As the predation rate a increases above a certain criticalvalue, a qualitative change occurs, as the system moves froma region of stable steady states (fixed point attractors) to un-stable equilibria (causing oscillations). Such occurred after75000 time steps.
Fitness.A formal concept of predator fitness helps us to under-
stand this qualitative change and the constraints, and is ob-tained from the model above: R0 = (caR/(h + R + eC))/d.
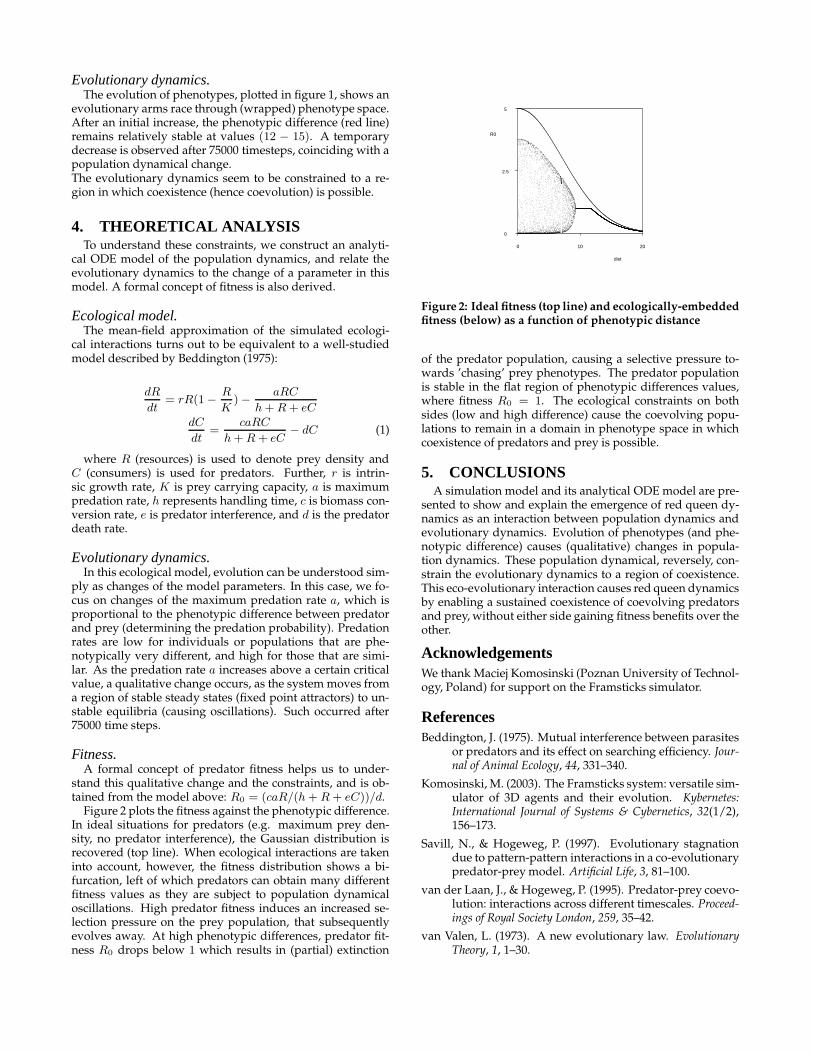
Figure 2 plots the fitness against the phenotypic difference.In ideal situations for predators (e.g. maximum prey den-sity, no predator interference), the Gaussian distribution isrecovered (top line). When ecological interactions are takeninto account, however, the fitness distribution shows a bi-furcation, left of which predators can obtain many differentfitness values as they are subject to population dynamicaloscillations. High predator fitness induces an increased se-lection pressure on the prey population, that subsequentlyevolves away. At high phenotypic differences, predator fit-ness R0 drops below 1 which results in (partial) extinction
2.5
0
R0
20100
dist
5
Figure 2: Ideal fitness (top line) and ecologically-embeddedfitness (below) as a function of phenotypic distance
of the predator population, causing a selective pressure to-wards ’chasing’ prey phenotypes. The predator populationis stable in the flat region of phenotypic differences values,where fitness R0 = 1. The ecological constraints on bothsides (low and high difference) cause the coevolving popu-lations to remain in a domain in phenotype space in whichcoexistence of predators and prey is possible.
5. CONCLUSIONSA simulation model and its analytical ODE model are pre-
sented to show and explain the emergence of red queen dy-namics as an interaction between population dynamics andevolutionary dynamics. Evolution of phenotypes (and phe-notypic difference) causes (qualitative) changes in popula-tion dynamics. These population dynamical, reversely, con-strain the evolutionary dynamics to a region of coexistence.This eco-evolutionary interaction causes red queen dynamicsby enabling a sustained coexistence of coevolving predatorsand prey, without either side gaining fitness benefits over theother.
AcknowledgementsWe thank Maciej Komosinski (Poznan University of Technol-ogy, Poland) for support on the Framsticks simulator.
ReferencesBeddington, J. (1975). Mutual interference between parasites
or predators and its effect on searching efficiency. Jour-nal of Animal Ecology, 44, 331–340.
Komosinski, M. (2003). The Framsticks system: versatile sim-ulator of 3D agents and their evolution. Kybernetes:International Journal of Systems & Cybernetics, 32(1/2),156–173.
Savill, N., & Hogeweg, P. (1997). Evolutionary stagnationdue to pattern-pattern interactions in a co-evolutionarypredator-prey model. Artificial Life, 3, 81–100.
van der Laan, J., & Hogeweg, P. (1995). Predator-prey coevo-lution: interactions across different timescales. Proceed-ings of Royal Society London, 259, 35–42.
van Valen, L. (1973). A new evolutionary law. EvolutionaryTheory, 1, 1–30.