red tape reduction as a key productivity · pdf file · 2015-03-19red tape...
TRANSCRIPT

Christian Porter MP
Parliamentary Secretary to
the Prime Minister
Red tape reduction as a key productivity driver

Pages of new Federal Parliament legislation by decade
1
Source: Institute of Public Affairs, Deloitte Access Economics found in Deloitte: Building the Lucky Country #4

The rise and rise of Australia’s compliance culture – and workers
2
Source: Australian Bureau of Statistics found in Deloitte: Building the Lucky Country #4

0
20
40
60
80
100
120
140
160
0
20
40
60
80
100
120
140
160
($ billiions) ($ billiions)
Public sector Self-imposed regulations
Public sector vs self-imposed regulations
3
Source: Deloitte Access Economics found in Deloitte: Building the Lucky Country #4

3.6% of GDP
2.0% of GDP 2.0% of GDP
4.2% of GDP
3.2% - 1.6% of GDP
Untied Kingdom Netherlands Denmark Belgium Australia
Estimates of Regulatory Stock
4
Source: Deloitte: Building the Lucky Country #4 Note: Different costing methodologies were employed throughout these separate costing exercises.

5 7 10 14
10
19 19 18 15 16 20 20 21 22
54
68
85
66 60
75
96
128 124
0
20
40
60
80
100
120
140
0
20
40
60
80
100
120
140
2001-02 2005-06 2009-10 2013-14
Rank Rank
GCI Rank* Burden of Govt Regulation Rank*
Australia’s Global Competitiveness
5
Source: World Economic Forum – Competitiveness Rankings

Labour productivity
Labour Productivity = Total Output (GDP) / Total Productive Hours
Total factor productivity
Y = A x Kα x Lβ
The TFP equation above in Cobb-Douglas form shows total output (Y) as a function of:
• total-factor productivity (A),
• capital input (K),
• labour input (L),
where:
• K and L’s respective shares of output (α and β) are the capital input share of contribution for K and L respectively.1
Productivity
6
1 An increase in either A, K or L will lead to an increase in output. Capital (K) and labor (L) are relatively tangible BUT total-factor productivity (A) is more intangible including things such as technology to knowledge/health of worker (human capital).
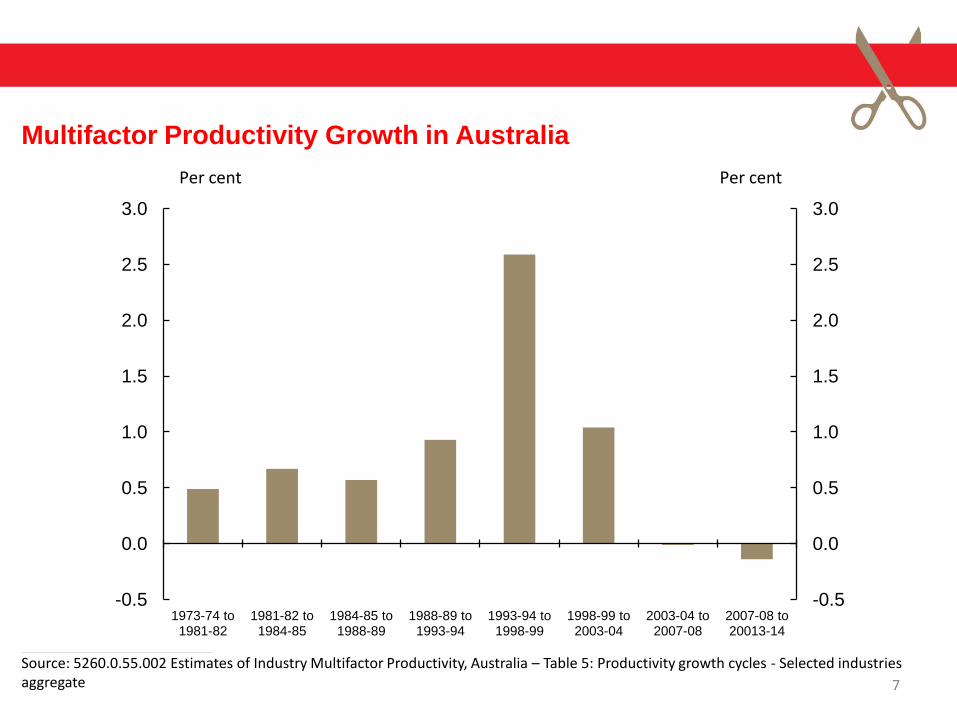
-0.5
0.0
0.5
1.0
1.5
2.0
2.5
3.0
-0.5
0.0
0.5
1.0
1.5
2.0
2.5
3.0
1973-74 to 1981-82
1981-82 to 1984-85
1984-85 to 1988-89
1988-89 to 1993-94
1993-94 to 1998-99
1998-99 to 2003-04
2003-04 to 2007-08
2007-08 to 20013-14
Per cent Per cent
Multifactor Productivity Growth in Australia
7
Source: 5260.0.55.002 Estimates of Industry Multifactor Productivity, Australia – Table 5: Productivity growth cycles - Selected industries aggregate
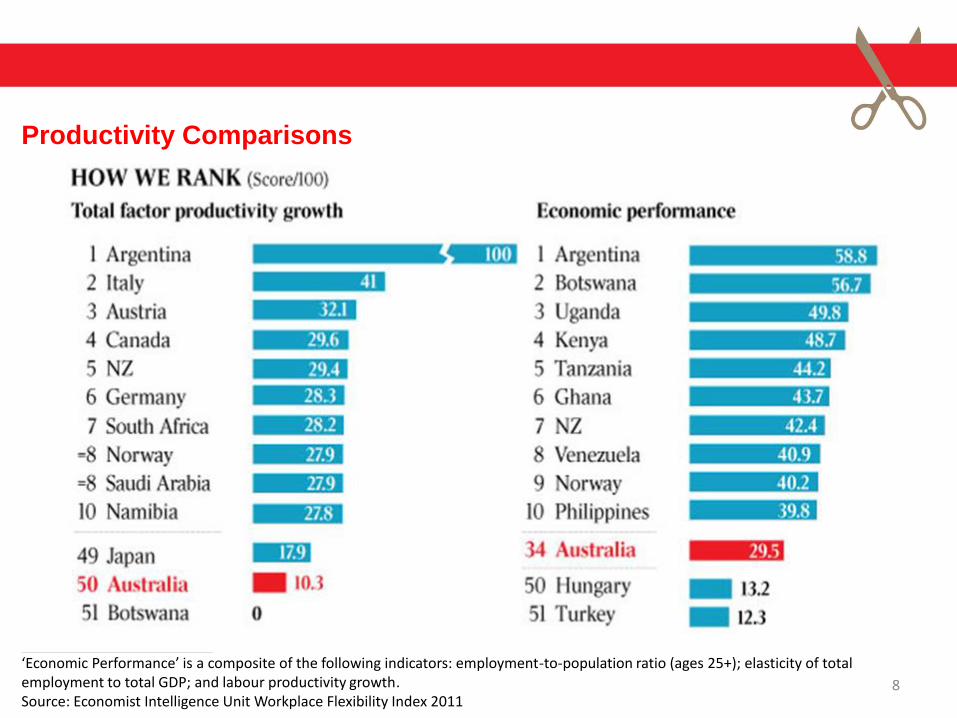
Productivity Comparisons
8
‘Economic Performance’ is a composite of the following indicators: employment-to-population ratio (ages 25+); elasticity of total employment to total GDP; and labour productivity growth. Source: Economist Intelligence Unit Workplace Flexibility Index 2011

Is a RIS required? 1. Agencies contact the OBPR for all Cabinet Submissions and non-Cabinet
proposals with regulatory impacts. 2. OBPR advises whether a RIS is required and if so, the appropriate RIS type.
Early Assessment Agency provides OBPR with at least the first four RIS questions, regulatory costs
and offsets, and consultation plan for assessment.
Final Assessment Agency provides OBPR with all seven RIS questions and regulatory costs and
offsets for final assessment.
Transparency Following a final decision, RIS and OBPR assessment of the RIS published.
Regulation Impact Statement Process
9

12
16
9
2 1
0 60%
70%
80%
90%
100%
0
3
6
9
12
15
18
2009-10 2010-11 2011-12 2012-13 2013-14 2014-15 (YTD)
Non-compliant RISs (LHS) Compliance ratio (RHS)
No. Per cent
Non-compliant RISs and Compliance Ratio 2009-10 to 2013-14
10

4
14
5
8
1 0
0
3
6
9
12
15
2009-10 2010-11 2011-12 2012-13 2013-14 2014-15 (YTD)
Prime Minister's exemptions
No.
Prime Minister’s Exemptions from the RIS process 2009-10 to 2013-14
11

Impacts as assessed by the Regulatory
Burden Measurement (RBM) framework
Regulatory Impacts
Opportunity Costs
Broader Economic Impacts
Delay Costs
Compliance Costs
Substantive Compliance
Costs
Administrative Costs
Financial Costs
Charging / Cost
Recovery
Total regulatory impact per
interaction
Number of interactions per
year
Estimated contribution to the Government’s red tape objective per annum
New reform proposal
$P Q
Regulatory
Costing Process
12
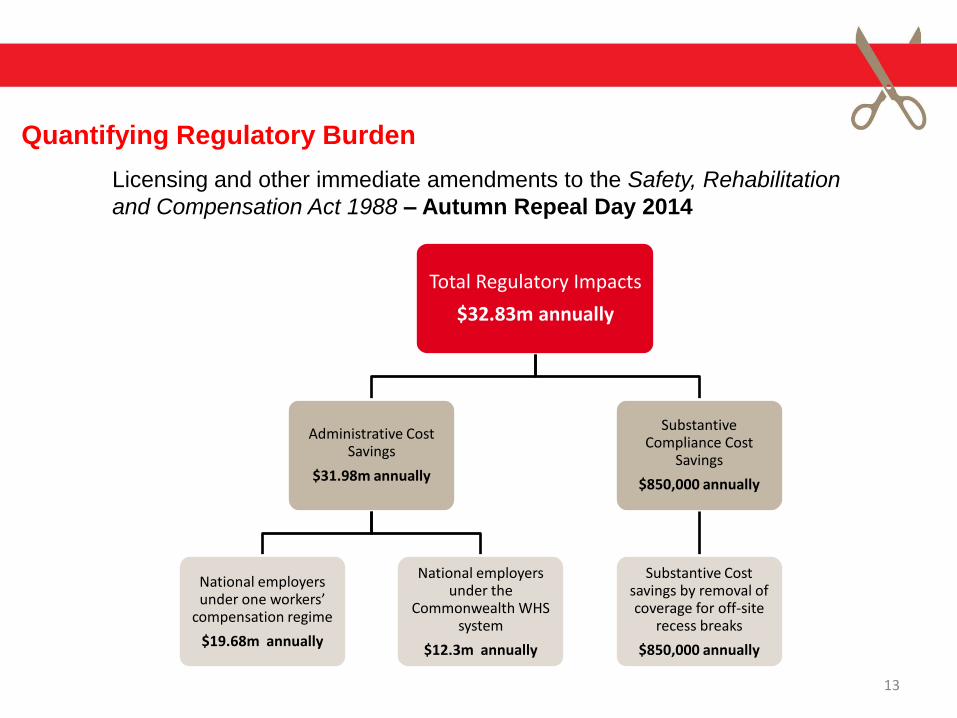
Licensing and other immediate amendments to the Safety, Rehabilitation
and Compensation Act 1988 – Autumn Repeal Day 2014
Total Regulatory Impacts
$32.83m annually
Administrative Cost Savings
$31.98m annually
National employers under one workers’
compensation regime
$19.68m annually
National employers under the
Commonwealth WHS system
$12.3m annually
Substantive Compliance Cost
Savings
$850,000 annually
Substantive Cost savings by removal of coverage for off-site
recess breaks
$850,000 annually
Quantifying Regulatory Burden
13

Project Life description
Original project net present value
($m)
Delay that would have been avoided
for this project (days)
Change in net present value ($m)
Short term 23 382 2
Example 1: Redbank Copper Exide Leach Extension 2010-11
Example 3: Cape Lambert Port B Development 2010-11
Example 2: Warkworth Mine Extension 2012-13
Project Life description
Original project net present value
($m)
Delay that would have been avoided
for this project (days)
Change in net present value ($m)
Medium term 1,426 186 56
Project Life description
Original project net present value
($m)
Delay that would have been avoided
for this project (days)
Change in net present value ($m)
Long term 2,810 175 104
$417.6m delay cost
savings
Example projects underpinning the One-stop Shop for
environmental approvals delay cost savings of $417.6 million
14

35 reform decisions each
delivering savings worth
more than $10m per year - $1,957.5m
approx. 350 reform
decisions worth less
than $10m per year
- $374.7m
A. 2014 Regulatory decreases by value ($2,332m)
three decisions delivering regulatory
cost increases of more than $10m per
year - $150.1m
approx. 83 reform
decisions worth less than $10m per year - $30.6m
38 decisions each with
an impact of more than $10m per
year - $1,807.4m
over 400 decisions with an
impact of less than $10m per
year - $344.1m
B. 2014 Regulatory increases by value
($180.7m)
C. 2014 Net deregulatory decisions ($2,151m)
Regulatory reform as of Spring Repeal Day 2014
MINUS
EQUALS

Cumulative Effect of Deregulation
16
$2,151.5 million $2,151.5 million
2014 2015
2014
$1 billion
Target
Total Net
Progress
as of
Spring
Repeal
Day 2014
2015
$1 billion
Target
2015
$1 billion Target

1. Reducing duplication through a One-Stop Shop for
environmental approvals – $426.3m
2. Streamlining Income Tax Returns using MyTax – $156m
3. National offshore petroleum safety and environmental
management authority – $120m
4. Making it easier for Australians to access government services –
$88m
5. Repealing the Carbon Tax – $85.3m
6. Implementing reforms to support responsible gambling – $81m
7. Improving the Fair Work Laws – $70.1m
8. Increasing Pay As You Go entry thresholds to reduce burdens
on taxpayers – $67.3m
Significant achievements – as of Spring Repeal Day 2014
17

1. The Biosecurity Bill – $6.9 million a year in reduced regulatory compliance
costs for businesses
2. Implementation of a cargo online management system – $5 million
3. Improved guidelines for timber importers and processors –$2 million
4. Improved the operation of the Farm Management Deposit Scheme – $1.9
million
5. Removed the expiry of agvet chemicals approvals and registrations and the
need for businesses to apply for re-approval or re-registration – $0.7 million
6. Mandatory port access code of conduct for grain export terminals – $0.6 million
7. Removed the requirement for tail tags for cattle destined for the European
Union – $0.5 million
8. Signed the Korean Free Trade Agreement and the Japan-Australia Economic
Partnership Agreement – combined $0.4 million
Select achievements for Agriculture
18