redalyc.feature reduction using a rbf network for classification of
TRANSCRIPT

Ingeniare. Revista Chilena de Ingeniería
ISSN: 0718-3291
Universidad de Tarapacá
Chile
Velez-Langs, Oswaldo
Feature reduction using a RBF network for classification of learning styles in first year engineering
students
Ingeniare. Revista Chilena de Ingeniería, vol. 22, núm. 1, enero, 2014, pp. 140-151
Universidad de Tarapacá
Arica, Chile
Available in: http://www.redalyc.org/articulo.oa?id=77229676013
How to cite
Complete issue
More information about this article
Journal's homepage in redalyc.org
Scientific Information System
Network of Scientific Journals from Latin America, the Caribbean, Spain and Portugal
Non-profit academic project, developed under the open access initiative

Ingeniare. Revista chilena de ingeniería, vol. 22 Nº 1, 2014, pp. 140-151
Feature reduction using a RBF network for classification of learning styles in first year engineering students
Reducción de características usando una red tipo RBF para clasificar estilos de aprendizaje en estudiantes de primer año de ingeniería
Oswaldo Velez-Langs1
Recibido 28 de junio de 2011, aceptado 19 de agosto de 2013Received: June 28, 2011 Accepted: August 19, 2013
RESUMEN
Cuando se tiene una gran cantidad de variables en la entrada de una Red de Neuronas Artificiales (RNA) se presentan inconvenientes en el diseño, la estructura y el desempeño mismo de la red. La reducción (y con ello selección) de características es una técnica que permite seleccionar un subconjunto de características que son consideradas relevantes en el proceso de construir un modelo robusto de aprendizaje como lo es una red neuronal. En este artículo se aplica el conocido enfoque del Análisis de Componentes Principales (ACP) para atacar este fenómeno en el diseño de una RNA tipo Función de Base Radial (RBF) aplicada a la clasificación de usuarios vía modelos de aprendizaje. Para la definición de este modelo se ha compilado una serie de datos, resultados de someter a 183 usuarios (estudiantes) de una interfaz de ordenador a una serie de 80 preguntas (que se corresponden a características de usuarios relacionadas con su estilo de aprendizaje), y se relacionan con una de las 4 posibles clasificaciones/estilos previamente definidas. Estos datos son usados para entrenar una RBF, que clasifique a los usuarios, inicialmente con los datos obtenidos sin ningún tipo de preproceso, y posteriormente con un preprocesamiento en la entrada de los datos, en el cual se reduce, aplicando el ACP, la cantidad de dimensiones (las 80 características medidas) que son las entradas a la RBF. El objeto principal es ver la pertinencia que puede llegar a tener una RNA como elemento clasificador dentro de los denominados Sistemas Adaptativos de Usuario (SAU).
Palabras clave: Selección de características, adaptación de interfaces, análisis de componentes principales, redes de neuronas de funciones de base radial, modelamiento de usuario
ABSTRACT
When having a large number of variables in the input of an Artificial Neural Network (ANN), there are different problems in the design, structure and performance of the network itself. Feature reduction is the technique of selecting a subset of ‘relevant’ features for building robust learning models as in an artificial neural network. In this paper, the well-known Principal Component Analysis (PCA) approach is applied in order to tackle this phenomenon in the design of an ANN with Radial Basis Functions (RBF) to be applied to classify users according to predefined learning styles. The model is developed upon a data set built from answers provided by 183 users of a computer interface to a series of 80 questions (that correspond to characteristics related to users learning style), associated to one of four (4) possible classifications/styles. This data set, without pre processing, is initially used for training an ANN with a Radial Basis Function type (RBF). Then, the Principal Component Analysis (PCA) is used for pre-processing the data set, the quantity of dimensions is reduced (80 measured characteristics) which are the input to the ANN. The main objective is to see the relevance that an ANN could have as classifier element in the User Adaptive Systems (UAS).
Keywords: Feature selection, interface adaptation, principal component analysis, radial basis function neural networks, user modeling.
1 Departamento de Ingeniería. Universidad de Bogotá Jorge Tadeo Lozano. Carrera 4 N° 22-61. Bogotá, Colombia. E-mail: [email protected]

Velez-Langs: Feature reduction using a RBF network for classification of learning styles in first year engineering students
141
INTRODUCTION
A user model is a representation of the knowledge and preferences that a system “believes” its user has. They are representations of features and decisions of the user which are accessible for the software system. A system using this type of model can adapt its behavior to the needs of the user and is capable of dynamically constructing a representation of the interests of the user and his/her characteristics. For our purposes a series of users learning styles have been compiled, following the scheme of Alonso [1] and using a specific tool [27]. The idea is that data initially gathered by this tool, could be used as feedback for the inference process of a classifier system can follow the user’s behavior in the system. Hereby the adaptation of the system to the behavior and preferences that the user develops during a teaching-learning process will be obtained.
Since one of the crucial aspects of the adaptation scheme previously described is the proper use of the classifier and having a lot of variables (or attributes) on the input of an Artificial Neural Network (ANN) generates problems in the design, structure and performance of the network itself (which is the case of the data gathered from the users) the predictive precision of a classifier can degenerate, especially when it faces irrelevant attributes. The explanation to this phenomenon is described in the Curse of the Dimensionality [5] which refers to the exponential growth of the number of necessary instances to describe the data depending on the dimensionality (number of attributes). A selection of attributes attempts to obtain a subset of the original attributes of a data set, in such a way that if a learning algorithm is executed over this subset, it achieves the largest precision possible. When obtaining patterns to describe people (for example their learning style) it is normal to handle a great amount of related variables, pre-processing these variables can lead us to extract a subset that contains variables or attributes in terms of the classifier.
This paper is organized as follows: the following section briefly introduces the ANN of the RBF type and the PCA, here, the paper continue with the work related to the dimensionality reduction by using Artificial Neural Networks (ANN) and using Principal Component Analysis (PCA), then the use of ANN in the proposed Adaptive Systems
is showed; next section develops the approach of the work done; then to continuation some obtained results are presented, and finally the conclusions and future work are enunciated.
RELATED WORK
In this section both the RFB networks approach and the PCA technique are described. It also showed how they have been used in an extensive way. This section only presents some examples of both techniques, in an application level, and the interesting synergy between them. Finally, the applicability ANNs have as an adaptation technique (classifying users) inside an Adaptive System, which is the field of study, is also shown.
RBF Networks and Principal Component AnalysisRBF networks are proper for solving pattern classification problems due to their simplicity, their topological structure and their ability to outline the learning process [19].
The performance of a RBF depends on the number of positions of the functions of radial base, its form and the method used for learning. The strategies for learning in RBFs can be classified in three aspects:
– First, randomly selecting the centroids when training with data [7].
– Second, using methods that relay in not supervised procedures to select the centers ([19, 14]).
– Third, using methods that relay in supervised procedures to choose the centers ([11, 15]).
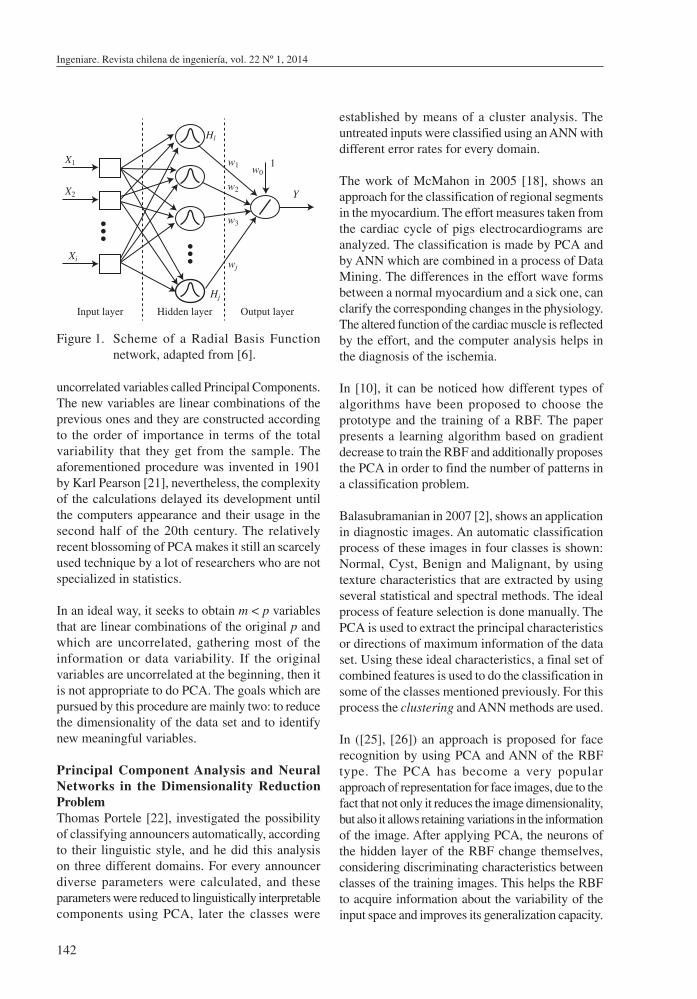
A RBF consists of an i-dimensional input that passes directly into a hidden layer (see Figure 1). It is supposed that there are j neurons in the hidden layer. Each one of the j neurons in the hidden layer applies an activation function, which is a function of the Euclidean distance between the input and a prototype j-dimensional vector. Each hidden neuron consists of its own prototype vector as a parameter. The output of each hidden neuron is measured and sent to the output. The output of the network consists of the sums of the values of the hidden neurons.
Principal Component Analysis (PCA) is a mathematical procedure that transforms a number of (possibly) correlated variables into a (small) number of
Ingeniare. Revista chilena de ingeniería, vol. 22 Nº 1, 2014
142
uncorrelated variables called Principal Components. The new variables are linear combinations of the previous ones and they are constructed according to the order of importance in terms of the total variability that they get from the sample. The aforementioned procedure was invented in 1901 by Karl Pearson [21], nevertheless, the complexity of the calculations delayed its development until the computers appearance and their usage in the second half of the 20th century. The relatively recent blossoming of PCA makes it still an scarcely used technique by a lot of researchers who are not specialized in statistics.
In an ideal way, it seeks to obtain m < p variables that are linear combinations of the original p and which are uncorrelated, gathering most of the information or data variability. If the original variables are uncorrelated at the beginning, then it is not appropriate to do PCA. The goals which are pursued by this procedure are mainly two: to reduce the dimensionality of the data set and to identify new meaningful variables.
Principal Component Analysis and Neural Networks in the Dimensionality Reduction ProblemThomas Portele [22], investigated the possibility of classifying announcers automatically, according to their linguistic style, and he did this analysis on three different domains. For every announcer diverse parameters were calculated, and these parameters were reduced to linguistically interpretable components using PCA, later the classes were
established by means of a cluster analysis. The untreated inputs were classified using an ANN with different error rates for every domain.
The work of McMahon in 2005 [18], shows an approach for the classification of regional segments in the myocardium. The effort measures taken from the cardiac cycle of pigs electrocardiograms are analyzed. The classification is made by PCA and by ANN which are combined in a process of Data Mining. The differences in the effort wave forms between a normal myocardium and a sick one, can clarify the corresponding changes in the physiology. The altered function of the cardiac muscle is reflected by the effort, and the computer analysis helps in the diagnosis of the ischemia.
In [10], it can be noticed how different types of algorithms have been proposed to choose the prototype and the training of a RBF. The paper presents a learning algorithm based on gradient decrease to train the RBF and additionally proposes the PCA in order to find the number of patterns in a classification problem.
Balasubramanian in 2007 [2], shows an application in diagnostic images. An automatic classification process of these images in four classes is shown: Normal, Cyst, Benign and Malignant, by using texture characteristics that are extracted by using several statistical and spectral methods. The ideal process of feature selection is done manually. The PCA is used to extract the principal characteristics or directions of maximum information of the data set. Using these ideal characteristics, a final set of combined features is used to do the classification in some of the classes mentioned previously. For this process the clustering and ANN methods are used.
In ([25], [26]) an approach is proposed for face recognition by using PCA and ANN of the RBF type. The PCA has become a very popular approach of representation for face images, due to the fact that not only it reduces the image dimensionality, but also it allows retaining variations in the information of the image. After applying PCA, the neurons of the hidden layer of the RBF change themselves, considering discriminating characteristics between classes of the training images. This helps the RBF to acquire information about the variability of the input space and improves its generalization capacity.
Input layer Hidden layer Output layer
X1
X2
Xi
Hj
Hl
w1 w0
w2
w3
wj
Y
1
Figure 1. Scheme of a Radial Basis Function network, adapted from [6].

Velez-Langs: Feature reduction using a RBF network for classification of learning styles in first year engineering students
143
In [13], a new multivariate non-linear technique is proposed to model and predict chaotic time series. This method makes an analysis of the relationships between spaces and states, with this process an inverse-predictability and time lapses are introduced to discover fundamental relationships. Then, the time series are predicted by a multivariate prediction. Although the multivariate time series can give a lot of information about complex systems. They also come with a big number of input variables, which gives as a result, an over training and poor generalization capacities. In order to overcome these obstacles, PCA is used to extract the principal characteristics of the time series and to reduce the input to the model. Later a four layered ANN is used as a predictive model.
Finally, it is to note that an ANN can be used by itself as a tool to do a PCA [20]; although this it is not the objective of this work, it has been thought of as a future approach (see Conclusions), that allows to increase our criteria of model comparison to the problem treated.
Neural Networks in User ModelingThe identification of the adaptation tasks and its later accomplishment, are fundamental phases in the development of Adaptive User Systems (AUS) that is the reason because is possible to find many references about this in the user modeling, adaptive user interfaces or in the human-computer interaction fields ([12, 17], [18, 9]). Most of the reviews done until now are oriented to objectives and techniques; this means that the tasks and systems that apply them are classified depending on the goals that it wants to achieve. Nevertheless, the three aspects that influence the design of the adaptation tasks are rarely described, these are:
– First, adaptation types.– Second, objectives and techniques.– Third, usability criteria.
In general, an User Model contains some adaptive and adaptable elements. Ideally, the adaptable elements must be reduced to the fewest (age, gender, favorite color, etc.), while the other elements (favorite topics, behavior patterns, etc.) should be obtained in the learning process. These concepts have been presented as implicit acquisition models [23].
The user modeling problem can be focused through automatic learning, the reason for this is because a user exhibits a typical behavior when it accesses an Adaptive User System, and the interactions set that contains these patterns, can be stored in a database or log. In this context, the Automatic Learning and the Data Mining techniques can be applied to known regularities in the user patterns and to integrate them, as part of the user model. A learning technique output is a structural description of what has been learned and this can be used to explain the original data in order to be able to do predictions. According to this perspective, Data Mining and other learning techniques make possible to create user models in AUSs.
It is said in [8], that an AUS can be divided into two stages (see Figure 2). The first process models the user, while the second one takes the generated model and provides the basis of the adaptation. This work is related to the first type of process.
Data about
Designer
User Model
Adaptation
Process
Process
User
Collect
System
Figure 2. Processes in an AUS, adapted from [8].
M. Kayama and T. Okamoto, [16], have worked with a model in which the user explores activities in the cyberspace with a mechanism based on a sub-symbolic approach, which helps to decide navigation strategies. This model does not interfere with the student learning system; it only helps to navigate on the Internet to acquire knowledge. The idea is to use Hypermedia Systems as a learning environment, in such a way that the student can be the one who explores the network by himself.
Beck in [3] & [4], builds user models in an Intelligent Tutor System, the information is gathered by this Tutor System, which uses an ANN, to give individualized recommendations according to its level of knowledge.

Ingeniare. Revista chilena de ingeniería, vol. 22 Nº 1, 2014
144
Wilson, [28], develops a study by means of an experiment that measures the performance while using a physiologically controlled assistance in real time. To do that, they used six channels, among which are: EEG, ECG, EOG and a breathing channel, likewise they used an ANN for tasks location, taking into account the assigned work for the user.
IMMEX research [24], describes a probabilistic approach to develop predictive models about how a student learns solving problems skills in qualitative general chemistry. The intention is to use these models to apply, in an active way, interventions in real time when it is detected that the learning is not optimum. First, an auto-organized neuronal networks approach is used to identify the most common strategies in the online tasks, and then Hidden Markov Models are applied to the sequences of the aforementioned strategies as ways of learning.
PROPOSED APPROACH
In the following section, the performed work will be shown. Initially, how the information is obtained and what type of characteristics this information has will be explained in order to apply the PCA approach on this data, and have an original set and a pre-processed set to load into the RBF that is expected to be used as a classifier model.
Data CollectionThe information is initially gathered through a web application that automates the Honey-Alonso’s Learning Styles Test [1], this test consists of 80 affirmations, each of which has 2 options to be marked: more (+) or less (-); they are selected depending on the degree of acceptance of the individual (the one who takes the test) related to the corresponding affirmation. This test generates a numerical and graphical result for each style, rating it with a scale of 5 preference levels: Very low, Low, Moderate, High and Very high. The test that is applied is also based on the Spanish translated version, by Catalina Alonso, adding some modifications that help clarify at the moment of answering it, for example a scale of relative weights for the rating of each affirmation has been established and is based on Kolb’s learning cycle. This test considers 80 questions (that in our scheme are associated to user attributes). The total number of users on whom this test was applied was 183 all of them were in a course
of the area of Basic Sciences in the Engineering School of the Universidad del Sinú - Elías Bechara Zainum during two consecutive semesters. It can be easily noticed that it is a data series where there are more attributes that sample data, which takes part in this type of analysis.
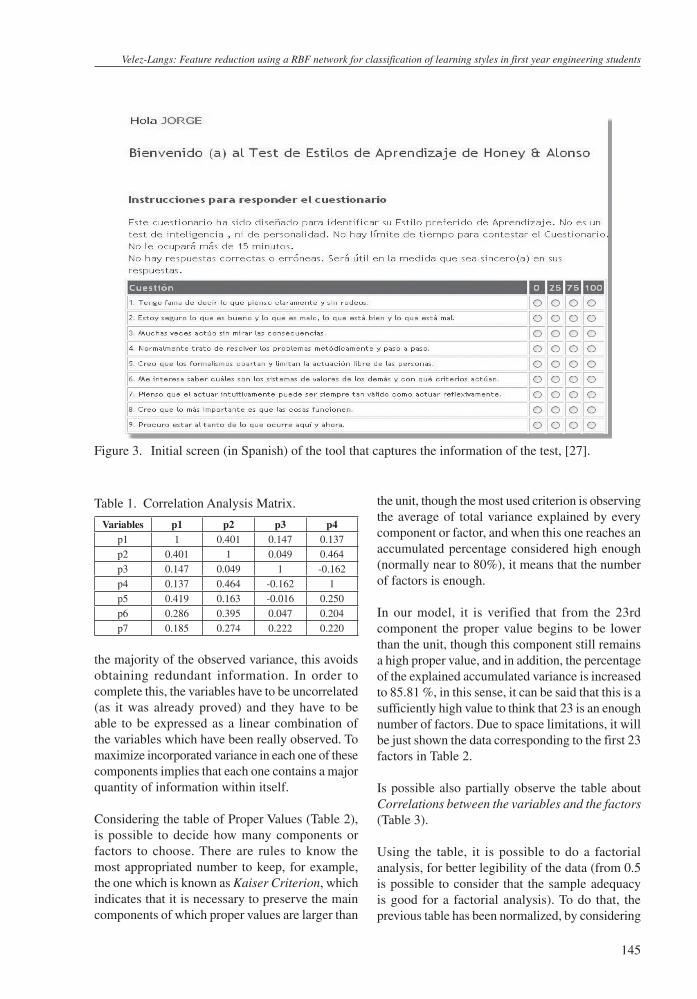
Once the student logs in to the test index, which means, the questionnaire, the user is faced with the questions to be answered, which are 80, divided in groups of 20; each group of questions is related to a learning style and defines it. Each question has 4 scores or different values, which the user can choose in order to give an answer to each question depending on the level of acceptance that he has for every question. These are: (0 - 25 - 75 - 100) where zero (0) is totally in disagreement and hundred (100) totally in agreement. It is necessary to highlight that there is no average or half rate in any answer; this is in order to eliminate ambiguities and be able to determine in a clearer form, the style the user belongs to (Reflective, Theoretic, Active, and Pragmatist). Figure 3 shows an interface of the test.
Once the information is collected, the system proceeds to construct the files that will serve as input and output to our neuronal network, the output has been changed to numerical values as follows: REFLECTIVE = 0, THEORETIC = 1, ACTIVE = 2, PRAGMATIST = 3.
Is necessary to remember that, the correlation coefficient indicates the relationship between two variables, if the rest of the model variables effect is eliminated. When these variables share a lot of information among them, but not with the rest, the partial correlation is high, this affects the analysis. The matrix obtained in the correlations analysis, which is partially reproduced in Table 1 due to its length, presents the coefficients of sample adequacy for every variable. It can be observed that the correlation coefficients are low, so it can be affirmed that PCA is appropriate for the studied variables.
Application of the Principal Component Analysis (PCA)The principal components are obtained after a process of square roots and vectors calculation presented in a symmetrical matrix. These components, as it was already mentioned, have as a goal to gather
Velez-Langs: Feature reduction using a RBF network for classification of learning styles in first year engineering students
145
the majority of the observed variance, this avoids obtaining redundant information. In order to complete this, the variables have to be uncorrelated (as it was already proved) and they have to be able to be expressed as a linear combination of the variables which have been really observed. To maximize incorporated variance in each one of these components implies that each one contains a major quantity of information within itself.
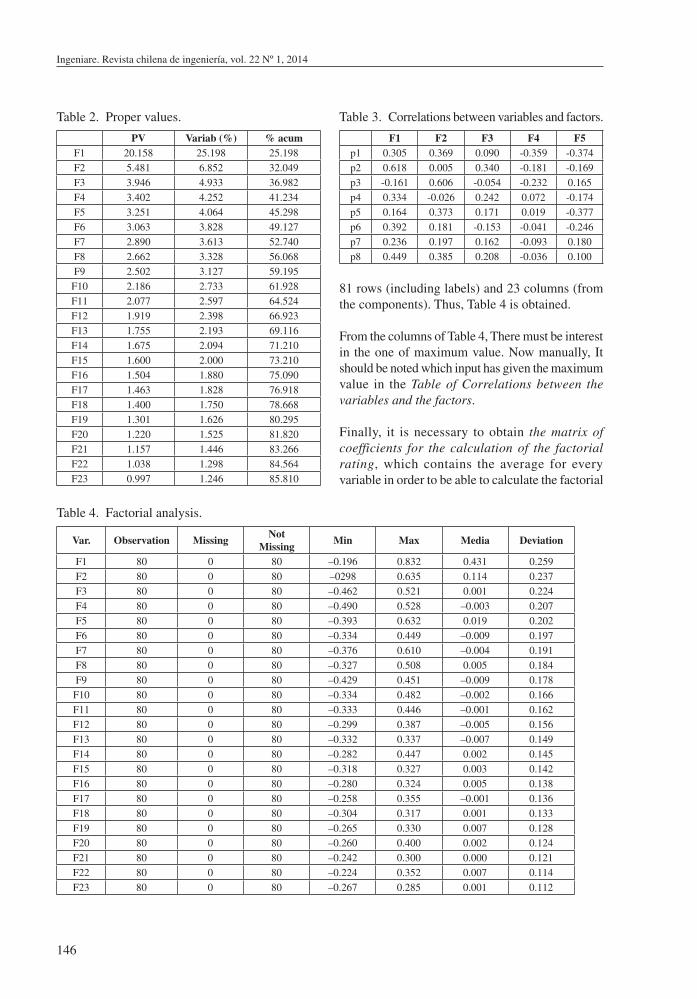
Considering the table of Proper Values (Table 2), is possible to decide how many components or factors to choose. There are rules to know the most appropriated number to keep, for example, the one which is known as Kaiser Criterion, which indicates that it is necessary to preserve the main components of which proper values are larger than
the unit, though the most used criterion is observing the average of total variance explained by every component or factor, and when this one reaches an accumulated percentage considered high enough (normally near to 80%), it means that the number of factors is enough.
In our model, it is verified that from the 23rd component the proper value begins to be lower than the unit, though this component still remains a high proper value, and in addition, the percentage of the explained accumulated variance is increased to 85.81 %, in this sense, it can be said that this is a sufficiently high value to think that 23 is an enough number of factors. Due to space limitations, it will be just shown the data corresponding to the first 23 factors in Table 2.
Is possible also partially observe the table about Correlations between the variables and the factors (Table 3).
Using the table, it is possible to do a factorial analysis, for better legibility of the data (from 0.5 is possible to consider that the sample adequacy is good for a factorial analysis). To do that, the previous table has been normalized, by considering
Figure 3. Initial screen (in Spanish) of the tool that captures the information of the test, [27].
Table 1. Correlation Analysis Matrix.
Variables p1 p2 p3 p4p1 1 0.401 0.147 0.137p2 0.401 1 0.049 0.464p3 0.147 0.049 1 -0.162p4 0.137 0.464 -0.162 1p5 0.419 0.163 -0.016 0.250p6 0.286 0.395 0.047 0.204p7 0.185 0.274 0.222 0.220
Ingeniare. Revista chilena de ingeniería, vol. 22 Nº 1, 2014
146
Table 2. Proper values.
PV Variab (%) % acumF1 20.158 25.198 25.198F2 5.481 6.852 32.049F3 3.946 4.933 36.982F4 3.402 4.252 41.234F5 3.251 4.064 45.298F6 3.063 3.828 49.127F7 2.890 3.613 52.740F8 2.662 3.328 56.068F9 2.502 3.127 59.195F10 2.186 2.733 61.928F11 2.077 2.597 64.524F12 1.919 2.398 66.923F13 1.755 2.193 69.116F14 1.675 2.094 71.210F15 1.600 2.000 73.210F16 1.504 1.880 75.090F17 1.463 1.828 76.918F18 1.400 1.750 78.668F19 1.301 1.626 80.295F20 1.220 1.525 81.820F21 1.157 1.446 83.266F22 1.038 1.298 84.564F23 0.997 1.246 85.810
Table 4. Factorial analysis.
Var. Observation MissingNot
MissingMin Max Media Deviation
F1 80 0 80 –0.196 0.832 0.431 0.259F2 80 0 80 –0298 0.635 0.114 0.237F3 80 0 80 –0.462 0.521 0.001 0.224F4 80 0 80 –0.490 0.528 –0.003 0.207F5 80 0 80 –0.393 0.632 0.019 0.202F6 80 0 80 –0.334 0.449 –0.009 0.197F7 80 0 80 –0.376 0.610 –0.004 0.191F8 80 0 80 –0.327 0.508 0.005 0.184F9 80 0 80 –0.429 0.451 –0.009 0.178
F10 80 0 80 –0.334 0.482 –0.002 0.166F11 80 0 80 –0.333 0.446 –0.001 0.162F12 80 0 80 –0.299 0.387 –0.005 0.156F13 80 0 80 –0.332 0.337 –0.007 0.149F14 80 0 80 –0.282 0.447 0.002 0.145F15 80 0 80 –0.318 0.327 0.003 0.142F16 80 0 80 –0.280 0.324 0.005 0.138F17 80 0 80 –0.258 0.355 –0.001 0.136F18 80 0 80 –0.304 0.317 0.001 0.133F19 80 0 80 –0.265 0.330 0.007 0.128F20 80 0 80 –0.260 0.400 0.002 0.124F21 80 0 80 –0.242 0.300 0.000 0.121F22 80 0 80 –0.224 0.352 0.007 0.114F23 80 0 80 –0.267 0.285 0.001 0.112
Table 3. Correlations between variables and factors.
F1 F2 F3 F4 F5p1 0.305 0.369 0.090 -0.359 -0.374p2 0.618 0.005 0.340 -0.181 -0.169p3 -0.161 0.606 -0.054 -0.232 0.165p4 0.334 -0.026 0.242 0.072 -0.174p5 0.164 0.373 0.171 0.019 -0.377p6 0.392 0.181 -0.153 -0.041 -0.246p7 0.236 0.197 0.162 -0.093 0.180p8 0.449 0.385 0.208 -0.036 0.100
81 rows (including labels) and 23 columns (from the components). Thus, Table 4 is obtained.
From the columns of Table 4, There must be interest in the one of maximum value. Now manually, It should be noted which input has given the maximum value in the Table of Correlations between the variables and the factors.
Finally, it is necessary to obtain the matrix of coefficients for the calculation of the factorial rating, which contains the average for every variable in order to be able to calculate the factorial

Velez-Langs: Feature reduction using a RBF network for classification of learning styles in first year engineering students
147
rating. By means of these estimated coefficients, a linear equation can be constructed for each of the extracted components, based on the variables and the factorial rating.
Sending Data to the Model of Radial Base Functions NetworkIn this approach, the PCA is used to reduce an initial set of 183 samples, with 80 characteristics each, to a new one which contains the same 183 samples with a lower number of characteristics, 23. The RBF model is proved by each one of these data sets and this is what will be shown in the following section.
RESULTS
Initially, the RBF was trained with the original data. For this case, a network of architecture 80-3-1 was used, this RBF was iterated during 400 Epoch (an Epoch is given for every completed run of the data set) and it had a minimal error (training) reflected on the performance indicators (MSE – Mean Square Error) showed in Table 5; also, in Figure 4, the convergence of the error is shown.
Once the training was finished, the RBF is proven, using a cross-validation approach, this error is reflected also in Table 5, the Cross-validation scheme offers a Confusion Matrix shown in Table 6, where it is possible to see that, with this data set, the Active and Pragmatist types are correctly recognized (though they are the least present in the data set) and some error is presented for the Reflective and Theoretical types, being the last one, bigger.
From the previous one, the following indicators (Table 7) for our classifier scheme were obtained:
As can be seen in Figure 4, the error (on validation) converges quickly from the Epoch 10 approximately, and becomes stable short before the Epoch 200.
Then, the RBF is trained by the second data set obtained through the PCA. In conformity with the previous network scheme, the new architecture of this RBF is 23-3-1, the RBF was also iterated during 400 Epoch; and it had a minimal error reflected in the performance indicators shown in Table 8; the convergence of the error in Figure 5 is also shown.Similar to the process below, once the training was over, the RBF has to be proven, using again the
cross-validation scheme (this error is in Table 8); the Confusion Matrix shown in Table 9 was generated.
From the previous one, the following indicators (Table 10) for our classifier scheme were obtained:
As can be seen in Figure 5, in this approach, the error descends from the Epoch 118 and in other Epochs, and is stable and minimum, at the end of the Epoch. Here the error (training and validation) is smaller than in the scheme which considers the original data, about 33% less.
CONCLUSIONS AND FUTURE WORK
As it has been verified, the PCA allows to discover and to prioritize the attributes that a neural network scheme has to take into account in the classification process, applied in the architecture of an UAS, by reducing the redundant information which can exist among them. The identification of these components allows us to know the most important aspects, in order to get the individual learning style.
By means of the principal component analysis, it has been verified that, in fact, the proposed attributes can be summarized, in 23 factors (approximately, a quarter of the 80 original ones), which eliminate the redundant information according to the characteristics
Table 5. Performance of the network for the original approach.
Best Net Training Cross ValidationEpoch# 399 399
MSE Min 0.1901 0.1247MSE Final 0.1901 0.1247
Table 6. Confusion matrix for the network results with the original approach (Validation).
Reflexive Active Prag. Theor.Reflexive 81 10 0 0Active 0 42 0 0Pragmatic 0 0 26 0Theoretical 4 0 0 20
Table 7. Confusion matrix analysis for the network results with original approach.
Classification Error 0.0765Accuracy 0.9234Recall 0.93Precision 0.94

Ingeniare. Revista chilena de ingeniería, vol. 22 Nº 1, 2014
148
presented, obtaining linear equations for each one of them, which provides the rate that an individual would get in each component if he is confronted with such questions.
Nevertheless, it can be noticed that the average when approaching data with PCA is sensitively less than when all the data is considered, the classification error extracted from the confusion matrix (test
mode) is approximately the double. In this way, the middle squared error is also smaller. In the same way, the correct percentage of each type is lower. This was expected, since it has been worked with a filtered set of the original data. Nonetheless, the processes of convergence of the RBF in training and validation are some what similar, a little more faster in the PCA approach than with the original data, this is because the error is stable at Epoch 118
MSE versus Epoch
Training MSE
Cross Validation MSE
Epoch
MSE
1 40 79 118 157 196 235 274 313 352 391
1
0,9
0,8
0,7
0,6
0,5
0,4
0,3
0,2
0,1
0
Figure 4. Error convergence in training and validation for the original approach.
MSE versus Epoch
Training MSE
Cross Validation MSE
Epoch
MSE
1 40 79 118 157 196 235 274 313 352 391
1
0,9
0,8
0,7
0,6
0,5
0,4
0,3
0,2
0,1
0
Figure 5. Error convergence in training and validation for the PCA approach.

Velez-Langs: Feature reduction using a RBF network for classification of learning styles in first year engineering students
149
Table 8. Performance of the network with PCA approach.
Best Net Training Cross ValidationEpoch# 930 399MSE Min 0.0301 0.0041MSE Final 0.0301 0.0041
Table 9. Confusion matrix for the network with PCA approach (Validation).
Reflexive Active Prag TheorReflexive 68 23 0 0Active 0 42 0 0Pragmatic 0 3 23 0Theoretical 6 0 0 18
Table 10. Confusion matrix analysis for the network whit PCA approach.
Classification Error 0.1748Accuracy 0.8252Recall 0.87Precision 0.88
vs Epoch 200, additionally this new approach can learn all the data, in contrast with the first, due to the reduction in the complexity of the input, which is an advantage if it is considered this as a real time adaptation approach, likewise, it can be said that if another type of pre-process is provided together with the PCA, this type of error can reduce itself in an acceptable way, or with the application of several approaches which combine RBF with PCA, such as proposed here.
All these results indicate that the RBF performance is worse with few inputs, which was also expected, but if is required solving the dimensionality problem, it should be to lose some information. Ideally, it wants to choose controls with exactly the same observable variables for every treated unit, but then, it has been that there is a very big sample of characteristics, which comes from the type of application for the classification process.
A next step is to consider different comparative approaches, based on this work: one where the PCA is used to support the architecture and design of the hidden layer neurons of the RBF and another approach where the RBF is used itself in order to
do the PCA and once the summary set is found, a neuronal scheme is used as classifier.
On the other hand, for generalization purposes, it is necessary to use additional characteristic vectors for the analysis and, for validation purposes, another feature reduction method like Singular Value decomposition (SVD) for example.
ACKNOWLEDGMENT
The author thanks for Jorge Aguado and Jorge David Aldana for the development of the web application that automates Honey-Alonso’s Learning Styles Test. Also thanks to Universidad del Sinú –Elias Bechara Zainum for facilitating the data collection.
REFERENCES
[1] C.M. Alonso, D.J. Gallego y D.J. Honey. “Recursos e instrumentos Psicopedagógicos. Los estilos de aprendizaje y Procedimientos de diagnóstico y mejora”. Universidad de Deusto. Tercera Edición. Ediciones Mensajero. España. 1997.
[2] D. Balasubramanian, P. Srinivasan and R. Gurupatham. “Automatic Classification of Focal Lesions in Ultrasound Liver Images using Principal Component Analysis and Neural Networks”. 29th Annual International Conference of the IEEE Engineering in Medicine and Biology Society, EMBS 2007, Lyon, pp. 2134-2137. 2007.
[3] J.E. Beck, B.P. Woolf and C.R. Beal, Advisor: “A machine learning architecture for intelligent tutor construction”. In Proceedings of the Seventeenth National Conference On Artificial Intelligence, pp. 552-557. Austin, Texas, EE.UU. 2000.
[4] J. Beck, P. Jia, J. Sison and J. Mostow. “Predicting student help-request behavior in an intelligent tutor for reading”. Proc. 9th Int. Conf. User Model. Lecture Notes in Artificial Intelligence. Vol. 2702, pp. 303-312. Springer-Verlag. Berlin, Germany. 2003.
[5] R. Bellman. “Adaptive Control Processes”. A Guided Tour. University Press. Princeton, EE.UU. 1961.
[6] A. Bianconi, C.J. VonZuben, A.B. Serapião and J.S. Govone. “Artificial neural networks:
Ingeniare. Revista chilena de ingeniería, vol. 22 Nº 1, 2014
150
A novel approach to analyzing the nutritional ecology of a blowfly species, Chrysomya megacephaly”. Journal of Insect Science. Vol. 10, Article 58. ISSN: 1536-2442. 2010. Date of visit: June 17, 2013. URL: insectscience.org/10.58
[7] D. Broomhead and D. Lowe. “Multivariable functional interpolation and adaptive networks”. Complex Systems. Vol. 2, pp. 321-355. 1998.
[8] P. Brusilovsky. “Methods and techniques of adaptive hypermedia”. Journal of User Modeling and User-Adapted Interaction. Vol. 6, Issue 2-3, pp. 87-129. 1996.
[9] P. Brusilovsky and E. Millán. “User Models for Adaptive Hypermedia and Adaptive Educational Systems”. En P. Brusilovsky, A. Kobsa and W. Nejdl (Eds.): The Adaptive Web, LNCS 4321, pp. 3-53. 2007.
[10] M. George. “Radial Basis Function Neural Networks and Principal Component Analysis for Pattern Classification”. International Conference on Computational Intelligence and Multimedia Applications, pp. 200-106. Sivakasi, India. 2007.
[11] F. Girosi and T. Poggio. “Networks and the best approximation property”. Biol. Cybern., Vol. 63, Issue 3, pp. 169-176. 1990.
[12] F.L. Gutierrez, M. Gea, J.L. Garrido and N. Padilla. “Desarrollo de sistemas interactivos en base a modelos de usuario”. Special issue on Human-Computer Interaction. Revista Iberoamericana de Inteligencia Artificial. Vol. 6, Issue 16, pp. 71-82. 2002.
[13] M. Han and Y. Wang. “Analysis and modeling of multivariate chaotic time series based on neural network”. Expert Systems with Applications. Vol. 36, Issue 2, Part 1, pp. 1280-1290. 2009.
[14] N.B. Karayiannis and G.W. Mi. “Growing radial basis neural networks: Merging supervised and unsupervised learning with network growth techniques”. IEEE Transactions on Neural networks. Vol. 8, Issue 6, pp. 1492-1506. 1997.
[15] N.B. Karayiannis. “Learning algorithms for reformulated radial basis neural networks”. Iin Proceedings of IEEE International Joint Conference on Neural Networks, Anchorage, pp. 2230-2235. 1998.
[16] M.Y. Kayama and T.A. Okamoto. “Mechanism for Knowledge-Navigation in Hyperspace with Neural Networks to Support Exploring activities”. Proceedings of the Workshop on Current Trends and Artificial Intelligence in Education, 4 World Congress on Expert Systems. México. 1998.
[17] A. Kobsa. “Generic User Modeling Systems”. User Modeling and User-Adapted Interaction. Vol. 11, Issue 1-2, pp. 49-63. 2001.
[18] E.M. McMahon, J. Korinek, H. Zhang, M. Sonka, A. Manduca and M. Belohlavek. “Neural network and principal component analyses of highly variable myocardial mechanical waveforms derived from echocardiographic ultrasound images”. In Proceedings of the IEEE International Joint Conference on Neural Networks. Montreal, Canadá. pp. 3017-3022. 2005.
[19] J. Moody and C.J. Darken. “Fast learning in networks of locally tuned processing units”. Neural Computation. Vol. 1, Issue 2, pp. 281-294. 1989.
[20] E. Oja. “Neural networks, Principal components and Subspaces”. Int. Journal of Neural Systems. Vol. 1, Issue 1, pp. 61-68. 1989.
[21] K. Pearson. “On Lines and Planes of Closest Fit to Systems of Points in Space”. Philosophical Magazine. Vol. 2, Issue 6, pp. 559-572. 1901.
[22] T. Portele. “Data-driven classification of linguistic styles in spoken dialogues”. Proceedings of the 19th International Conference on Computational Linguistics. Taipei, pp. 1-7. 2002.
[23] L.M. Quiroga and J. Mostafa. “Empirical evaluation of explicit versus implicit acquisition of user profiles”. In Proceedings of 4th ACM Conf. Digital Libraries, Tucson, pp. 238-239.1999.
[24] R. Stevens, A. Soller, M. Cooper and M. Sprang. “Modeling the Development of Problem Solving Skills in Chemistry with a Web-Based Tutor”. In Lester, Vicari, & Paraguaca (Eds), Proceedings of the 7th International Conference in Intelligent Tutoring Systems, Alagoas-Brazil, pp. 580-591. 2004.
[25] S. Thakur, J.K. Sing, D.K. Basu, M, Nasipuri and M. Kundu. “Face Recognition Using

Velez-Langs: Feature reduction using a RBF network for classification of learning styles in first year engineering students
151
Principal Component Analysis and RBF Neural Networks”. First International Conference on Emerging Trends in Engineering and Technology, ICETET ’08, Nagpur-India, pp. 695-700. 2008.
[26] S. Thakur, J.K. Sing, D.K. Basu, M. Nasipuri, M. Kundu. “Face Recognition using Principal Component Analysis and RBF Neural Networks”. International Journal of Simulation Systems, Science & Technology, Vol. 13, Issue 3. May, 2002. ISSN: 14737-804x Online: 1473-8031.
[27] O. Velez-Langs, D. Solano and J. Aldana. “Sistema Inteligente De Tutoría: Estilos De Aprendizaje Y Modelado De Usuario”. Memoria del VI Congreso Nacional de Electrónica, Telecomunicaciones e Informática. Medellín, Colombia. 20-21 de octubre de 2006.
[28] G.F. Wilson, J.D. Lambert and C. Rusell. “Performance enhancement with real-time physiologically controlled adaptive aiding”. Proceedings of the IEA 2000/HFES 2000 Congress, San Diego, CA, USA, pp. 61-64. 2000.