redesigning emergency department patient flows: application of lean thinking to health care
TRANSCRIPT
doi: 10.1111/j.1742-6723.2006.00872.x
Emergency Medicine Australasia
(2006)
18
, 391–397
© 2006 The AuthorsJournal compilation © 2006 Australasian College for Emergency Medicine and Australasian Society for Emergency Medicine
et al
.
Correspondence: Dr Diane King, Emergency Department, Flinders Medical Centre, Flinders Drive, Bedford Park, SA 5042, Australia. Email: [email protected]
Diane L King, MB BS, FACEM, Director Emergency Department; David I Ben-Tovim, PhD, MB BS, MRC Psych, FRANZCP, Director RedesigningCare and Clinical Epidemiology Unit; Jane Bassham, RN, BNg, Clinical Facilitator Redesigning Care.
M
ANAGEMENT
AND
Q
UALITY
Redesigning emergency department patient flows: Application of Lean Thinking to health care
Diane L King, David I Ben-Tovim and Jane Bassham
Emergency Department, Flinders Medical Centre, Bedford Park, South Australia, Australia
Abstract
Objective:
To describe in some detail the methods used and outcome of an application of conceptsfrom Lean Thinking in establishing streams for patient flows in a teaching general hospitalED.
Methods:
Detailed understanding was gained through process mapping with staff followed by theidentification of value streams (those patients likely to be discharged from the ED, thosewho were likely to be admitted) and the implementation of a process of seeing thosepatients that minimized complex queuing in the ED.
Results:
Streaming had a significant impact on waiting times and total durations of stay in theED. There was a general flattening of the waiting time across all groups. A slight increasein wait for Triage categories 2 and 3 patients was offset by reductions in wait for Triagecategory 4 patients. All groups of patients spent significantly less overall time in thedepartment and the average number of patients in the ED at any time decreased. Therewas a significant reduction in number of patients who do not wait and a slight decreasein access block.
Conclusions:
The streaming of patients into groups of patients cared for by a specific team of doctorsand nurses, and the minimizing of complex queues in this ED by altering the practices inrelation to the function of the Australasian Triage Scale improved patient flow, therebydecreasing potential for overcrowding.
Key words:
access block
,
emergency department overcrowding
,
Lean Thinking
,
patient flow
,
queuing theory
,
streaming patient care
.
Introduction
The Flinders Medical Centre provides a comprehensiverange of hospital services to a community of over
350 000 people in the southern suburbs of Adelaide,South Australia. The ED of the hospital is the majorportal through which that community accesses timeurgent, complex care, as evidenced by the fact that of
DL King
et al.
392
© 2006 The AuthorsJournal compilation © 2006 Australasian College for Emergency Medicine and Australasian Society for Emergency Medicine
the 50 000 who patients present to the department peryear, 43% require admission to hospital.
By the winter of 2003, the Flinders Medical CentreED had become so severely overcrowded that theRecovery Area of the Operating Theatre suite had beenpressed into use as an ED extension. This disrupted thework of both the ED and the surgical services providedby the hospital. The level of overcrowding also resultedin serious concerns about the safety of the care withinthe ED.
The problems within the ED had grown over a periodof years. They had commonly been attributed to anincreasing problem of access block consequent uponhigh levels of occupancy within the body of the hospi-tal.
1
Many of the accepted methods for responding toaccess block had been tried,
2
including opening addi-tional beds,
3
improved discharge planning, adoption ofcentralized bed management practices and ED rapidassessment teams. None of those strategies had pro-vided sustained relief and the depth of the crisis thedepartment was facing prompted the hospital to seek adifferent way to improve the functioning of the depart-ment. Thus, the present article has two main aims: todescribe an approach to redesigning ED processes, andto describe the method of streaming of patient care thatresulted from the redesign strategy. An analysis of theimpacts of streaming in the first 12 months of operationis provided.
The redesign strategy that was used was an applica-tion of Lean Thinking to health care.
4
Lean Thinking isan approach to the organization of complex processesthat derives from industrial manufacturing experience.
5
A key element in Lean Thinking is the practice of start-ing, not with a potential solution, but with the develop-ment of a detailed understanding of how a complexprocess (such as the provision of care within an ED) isactually undertaken. In this case, the aim was to createa detailed schematic representation of how the FlindersMedical Centre ED actually functioned, emphasizingreal life operations rather than intended modes of func-tioning. That was accomplished by creating a processmap for ED processes that detailed both the movementof patients through the department, and the communi-cation processes that facilitated or impeded thosemovements.
6
Three sessions were required to create an overviewof department processes. Session participants weredrawn from the full range of staff working within theED, from patient care assistants and clerical staffthrough to junior and senior nursing and medical staff.There were between 15–20 people at each session. The
mapping demonstrated that care processes had becomehard to follow and dependent on the extraordinaryefforts of individuals rather than following designedprocesses and procedures. Our sense is that the prob-lems that emerged were not particular to the FlindersMedical Centre ED, but could be repeated in many otherlarge EDs in Australia and elsewhere.
Following the mapping, the flows of patients wererestructured concentrating initially on a high volumepatient group, namely those patients who were likely tobe ultimately discharged directly from the ED. Thetriage nurses, who are a skilled and experienced groupof staff, were asked to make their initial assessments,record a brief description of the presenting complaint,allocate an Australasian Triage Scale (ATS) score ashad always been their practice, and they were thenasked to predict whether in their judgement the patientwas likely to be able to return home from the ED aftertreatment, or was more likely to require admissionto hospital. A previous unpublished study withinthe department had identified that the triage nurseswere accurate in these predictions in at least 80% ofpresentations.
Patients were then streamed in relation to their pre-dicted outcome. Patients predicted as being likely to beable to return home directly from the ED (the discharge-able stream) were allocated to the ‘B-side’ team. Thiswas a functional team of nurses and doctors locatedshift by shift in an allocated group of cubicles in thedepartment. Patients predicted as being likely to requireadmission were allocated to the ‘A-side’ team, a separateteam of nurses and doctors located in the A-sidecubicles.
Triage category 1 patients continued to be takenstraight into the designated resuscitation area of theED.
Patients could be moved from the B-side to the A-side if the need for admission arose, with clinical han-dover occurring. Patients continued to be dischargedfrom the A-side if admission to hospital was not con-sidered needed after full clinical assessment. There hasbeen no emphasis on the importance of ‘getting it abso-lutely right’ from the triage nurse perspective, as it isbelieved that the value in streaming is in the subse-quent processes rather than the accuracy of the initialallocation.
The B-side team was instructed that in the absenceof a threat to life or limb, need for time critical interven-tion or severe pain (as may be found in Triage category1 or 2 patients) they were to see patients in order ofarrival, rather than to prioritize in relation to triage
Redesigning patient flows
© 2006 The AuthorsJournal compilation © 2006 Australasian College for Emergency Medicine and Australasian Society for Emergency Medicine
393
category. The staff were further encouraged to attemptas far as possible to complete one patient’s journeybefore bringing the next patient out of the waiting roominto a cubicle. The A-side staff were asked to continueto use the triage categories as a means of prioritizingwhich patients assigned to their area to see next.
The changes were supported at the most senior levelsin the department. They were introduced on one specificday and have continued 24 h per day, 7 days per week,since then. The nursing and medical staff were givenvery brief training on the concepts underlying LeanThinking and streaming prior to its introduction. Noextra nursing or medical staff were provided for theadoption of the changed patient flows.
A quantitative analysis of the impact of the restruc-turing of patient flows in the first 12 months afterstreaming has been undertaken.
Methods
De-identified hospital administrative and clinical datasystems were accessed and comparisons made betweenthe 12 months before (from December 2002 to Novem-ber 2003) and 12 months after (from December 2003 toNovember 2004) the changes described above.
χ
2
-testswere used to test the significance of difference in; thedistribution of cases across triage categories; the num-bers of cases seen within triage target times, and; thenumbers of patients not waiting to be seen after book-ing in at triage. Differences in total time spent in EDwere tested by means of
t
-tests. Differences in the num-ber of deaths occurring within the ED (excluding thosepatients who were deemed to have been dead on arrivalin the department) were tested using multivariate Pois-son regression, with time period and triage categoriesbeing the independent variables.
For some years, compliance with triage times at theFlinders Medical Centre had been determined by thetime of the initial medical consultation. Since streaminghas been commenced, the functioning of the departmentis such that compliance with triage waiting times isdetermined by initiation of meaningful treatment by adoctor or a nurse, and this time is computed from theearlier of the existing doctor seen or nurse seen timeson the ED computer system. Both assessment points arereported in the
Results
section. ‘Meaningful treatment’is taken to mean the time of commencement of adetailed history and a clinical guideline, protocolor procedure. The taking of observations only isexcluded. Nurse initiated procedures such as X Ray and
administration of opioid pain relief occurred in bothpatient streamed areas and have been commonly prac-tised both before and after the intervention.
Results
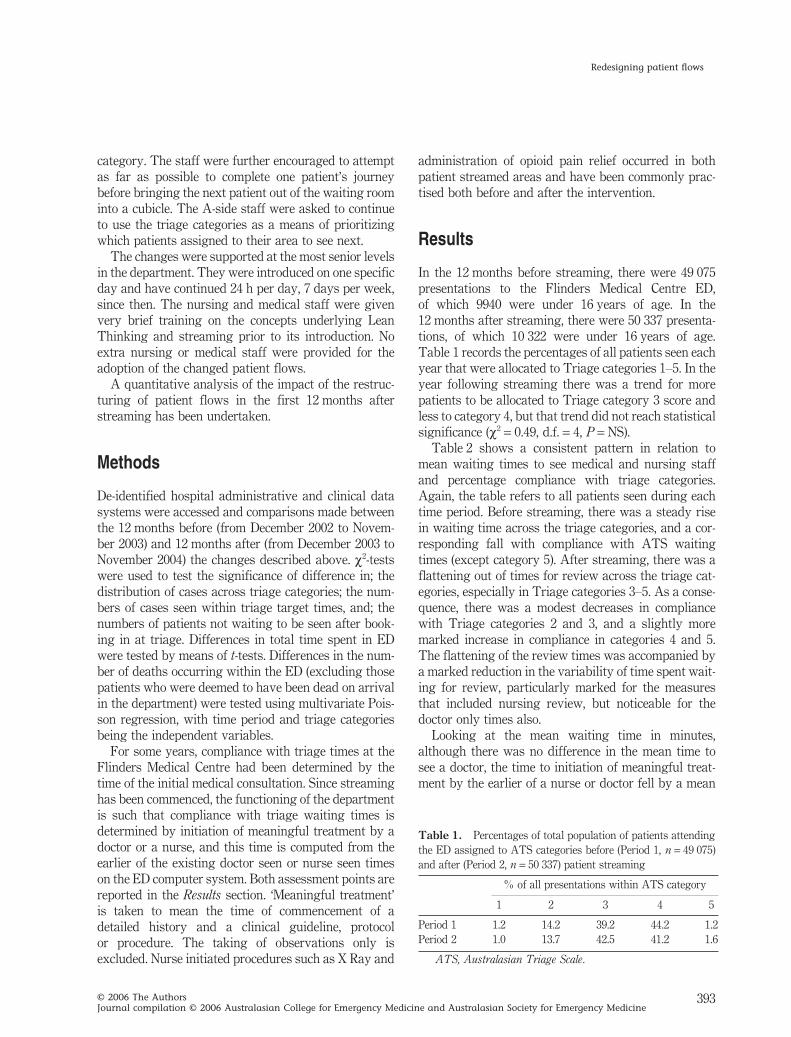
In the 12 months before streaming, there were 49 075presentations to the Flinders Medical Centre ED,of which 9940 were under 16 years of age. In the12 months after streaming, there were 50 337 presenta-tions, of which 10 322 were under 16 years of age.Table 1 records the percentages of all patients seen eachyear that were allocated to Triage categories 1–5. In theyear following streaming there was a trend for morepatients to be allocated to Triage category 3 score andless to category 4, but that trend did not reach statisticalsignificance (
χ
2
=
0.49, d.f.
=
4,
P
=
NS).Table 2 shows a consistent pattern in relation to
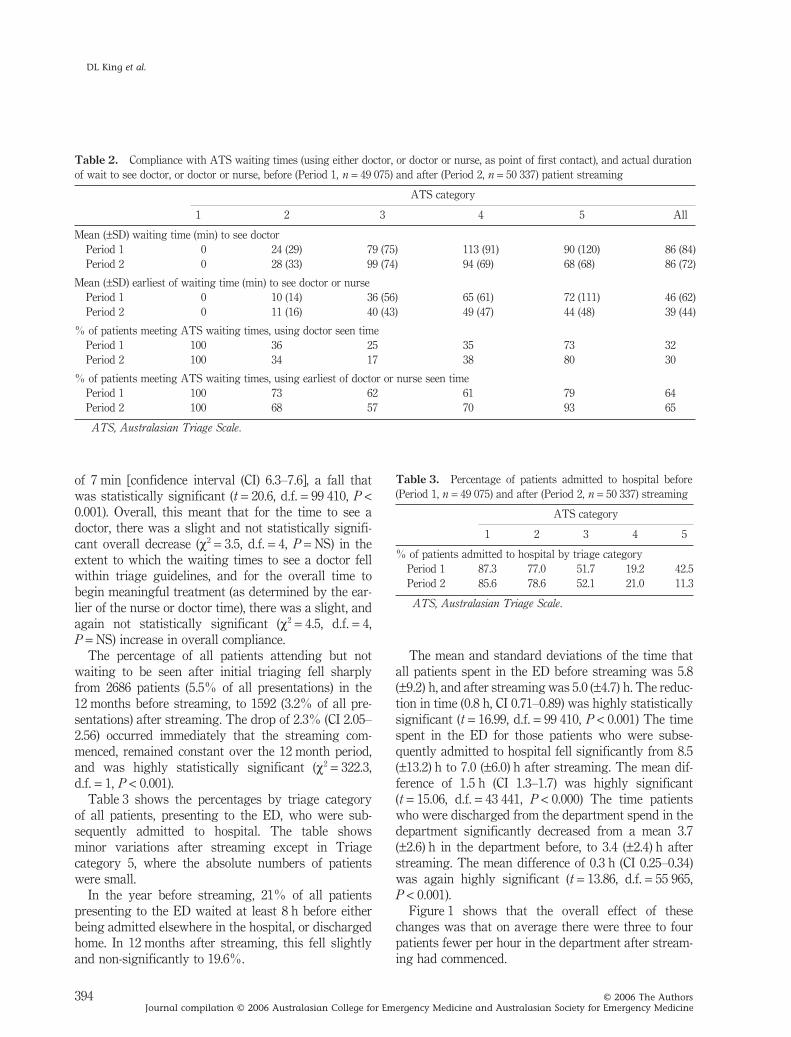
mean waiting times to see medical and nursing staffand percentage compliance with triage categories.Again, the table refers to all patients seen during eachtime period. Before streaming, there was a steady risein waiting time across the triage categories, and a cor-responding fall with compliance with ATS waitingtimes (except category 5). After streaming, there was aflattening out of times for review across the triage cat-egories, especially in Triage categories 3–5. As a conse-quence, there was a modest decreases in compliancewith Triage categories 2 and 3, and a slightly moremarked increase in compliance in categories 4 and 5.The flattening of the review times was accompanied bya marked reduction in the variability of time spent wait-ing for review, particularly marked for the measuresthat included nursing review, but noticeable for thedoctor only times also.
Looking at the mean waiting time in minutes,although there was no difference in the mean time tosee a doctor, the time to initiation of meaningful treat-ment by the earlier of a nurse or doctor fell by a mean
Table 1.
Percentages of total population of patients attendingthe ED assigned to ATS categories before (Period 1,
n
=
49 075)and after (Period 2,
n
=
50 337) patient streaming
% of all presentations within ATS category
1 2 3 4 5
Period 1 1.2 14.2 39.2 44.2 1.2Period 2 1.0 13.7 42.5 41.2 1.6
ATS, Australasian Triage Scale.
DL King
et al.
394
© 2006 The AuthorsJournal compilation © 2006 Australasian College for Emergency Medicine and Australasian Society for Emergency Medicine
of 7 min [confidence interval (CI) 6.3–7.6], a fall thatwas statistically significant (
t
=
20.6, d.f.
=
99 410,
P
<
0.001). Overall, this meant that for the time to see adoctor, there was a slight and not statistically signifi-cant overall decrease (
χ
2
=
3.5, d.f.
=
4,
P
=
NS) in theextent to which the waiting times to see a doctor fellwithin triage guidelines, and for the overall time tobegin meaningful treatment (as determined by the ear-lier of the nurse or doctor time), there was a slight, andagain not statistically significant (
χ
2
=
4.5, d.f.
=
4,
P
=
NS) increase in overall compliance.The percentage of all patients attending but not
waiting to be seen after initial triaging fell sharplyfrom 2686 patients (5.5% of all presentations) in the12 months before streaming, to 1592 (3.2% of all pre-sentations) after streaming. The drop of 2.3% (CI 2.05–2.56) occurred immediately that the streaming com-menced, remained constant over the 12 month period,and was highly statistically significant (
χ
2
=
322.3,d.f.
=
1,
P
<
0.001).Table 3 shows the percentages by triage category
of all patients, presenting to the ED, who were sub-sequently admitted to hospital. The table showsminor variations after streaming except in Triagecategory 5, where the absolute numbers of patientswere small.
In the year before streaming, 21% of all patientspresenting to the ED waited at least 8 h before eitherbeing admitted elsewhere in the hospital, or dischargedhome. In 12 months after streaming, this fell slightlyand non-significantly to 19.6%.
The mean and standard deviations of the time thatall patients spent in the ED before streaming was 5.8(
±
9.2) h, and after streaming was 5.0 (
±
4.7) h. The reduc-tion in time (0.8 h, CI 0.71–0.89) was highly statisticallysignificant (
t
=
16.99, d.f.
=
99 410,
P
<
0.001) The timespent in the ED for those patients who were subse-quently admitted to hospital fell significantly from 8.5(
±
13.2) h to 7.0 (
±
6.0) h after streaming. The mean dif-ference of 1.5 h (CI 1.3–1.7) was highly significant(
t
=
15.06, d.f.
=
43 441,
P
<
0.000) The time patientswho were discharged from the department spend in thedepartment significantly decreased from a mean 3.7(
±
2.6) h in the department before, to 3.4 (
±
2.4) h afterstreaming. The mean difference of 0.3 h (CI 0.25–0.34)was again highly significant (
t
=
13.86, d.f.
=
55 965,
P
<
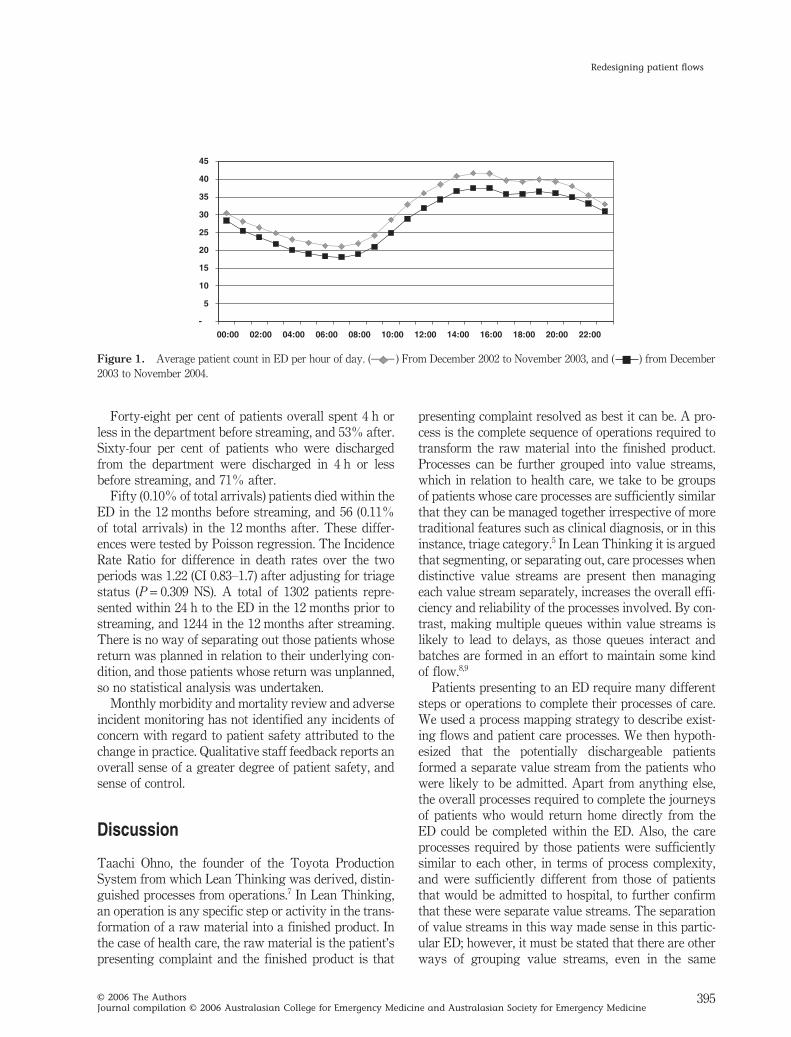
0.001).Figure 1 shows that the overall effect of these
changes was that on average there were three to fourpatients fewer per hour in the department after stream-ing had commenced.
Table 2.
Compliance with ATS waiting times (using either doctor, or doctor or nurse, as point of first contact), and actual durationof wait to see doctor, or doctor or nurse, before (Period 1,
n
=
49 075) and after (Period 2,
n
=
50 337) patient streaming
ATS category
1 2 3 4 5 All
Mean (
±
SD) waiting time (min) to see doctorPeriod 1 0 24 (29) 79 (75) 113 (91) 90 (120) 86 (84)Period 2 0 28 (33) 99 (74) 94 (69) 68 (68) 86 (72)
Mean (
±
SD) earliest of waiting time (min) to see doctor or nursePeriod 1 0 10 (14) 36 (56) 65 (61) 72 (111) 46 (62)Period 2 0 11 (16) 40 (43) 49 (47) 44 (48) 39 (44)
% of patients meeting ATS waiting times, using doctor seen timePeriod 1 100 36 25 35 73 32Period 2 100 34 17 38 80 30
% of patients meeting ATS waiting times, using earliest of doctor or nurse seen timePeriod 1 100 73 62 61 79 64Period 2 100 68 57 70 93 65
ATS, Australasian Triage Scale.
Table 3.
Percentage of patients admitted to hospital before(Period 1,
n
=
49 075) and after (Period 2,
n
=
50 337) streaming
ATS category
1 2 3 4 5
% of patients admitted to hospital by triage categoryPeriod 1 87.3 77.0 51.7 19.2 42.5Period 2 85.6 78.6 52.1 21.0 11.3
ATS, Australasian Triage Scale.
Redesigning patient flows
© 2006 The AuthorsJournal compilation © 2006 Australasian College for Emergency Medicine and Australasian Society for Emergency Medicine
395
Forty-eight per cent of patients overall spent 4 h orless in the department before streaming, and 53% after.Sixty-four per cent of patients who were dischargedfrom the department were discharged in 4 h or lessbefore streaming, and 71% after.
Fifty (0.10% of total arrivals) patients died within theED in the 12 months before streaming, and 56 (0.11%of total arrivals) in the 12 months after. These differ-ences were tested by Poisson regression. The IncidenceRate Ratio for difference in death rates over the twoperiods was 1.22 (CI 0.83–1.7) after adjusting for triagestatus (
P
=
0.309 NS). A total of 1302 patients repre-sented within 24 h to the ED in the 12 months prior tostreaming, and 1244 in the 12 months after streaming.There is no way of separating out those patients whosereturn was planned in relation to their underlying con-dition, and those patients whose return was unplanned,so no statistical analysis was undertaken.
Monthly morbidity and mortality review and adverseincident monitoring has not identified any incidents ofconcern with regard to patient safety attributed to thechange in practice. Qualitative staff feedback reports anoverall sense of a greater degree of patient safety, andsense of control.
Discussion
Taachi Ohno, the founder of the Toyota ProductionSystem from which Lean Thinking was derived, distin-guished processes from operations.
7
In Lean Thinking,an operation is any specific step or activity in the trans-formation of a raw material into a finished product. Inthe case of health care, the raw material is the patient’spresenting complaint and the finished product is that
presenting complaint resolved as best it can be. A pro-cess is the complete sequence of operations required totransform the raw material into the finished product.Processes can be further grouped into value streams,which in relation to health care, we take to be groupsof patients whose care processes are sufficiently similarthat they can be managed together irrespective of moretraditional features such as clinical diagnosis, or in thisinstance, triage category.
5
In Lean Thinking it is arguedthat segmenting, or separating out, care processes whendistinctive value streams are present then managingeach value stream separately, increases the overall effi-ciency and reliability of the processes involved. By con-trast, making multiple queues within value streams islikely to lead to delays, as those queues interact andbatches are formed in an effort to maintain some kindof flow.
8,9
Patients presenting to an ED require many differentsteps or operations to complete their processes of care.We used a process mapping strategy to describe exist-ing flows and patient care processes. We then hypoth-esized that the potentially dischargeable patientsformed a separate value stream from the patients whowere likely to be admitted. Apart from anything else,the overall processes required to complete the journeysof patients who would return home directly from theED could be completed within the ED. Also, the careprocesses required by those patients were sufficientlysimilar to each other, in terms of process complexity,and were sufficiently different from those of patientsthat would be admitted to hospital, to further confirmthat these were separate value streams. The separationof value streams in this way made sense in this partic-ular ED; however, it must be stated that there are otherways of grouping value streams, even in the same
Figure 1.
Average patient count in ED per hour of day. ( ) From December 2002 to November 2003, and ( ) from December2003 to November 2004.
5
-
10
15
20
25
30
35
40
45
00:00 02:00 04:00 06:00 08:00 10:00 12:00 14:00 16:00 18:00 20:00 22:00

DL King
et al.
396
© 2006 The AuthorsJournal compilation © 2006 Australasian College for Emergency Medicine and Australasian Society for Emergency Medicine
department (e.g. subsequent changes have resulted inthe addition of a separate paediatric value stream,because processes for that group can also be thought ofas being similar enough to logically group together).
The process mapping made it clear that the conges-tion within the ED at Flinders Medical Centre was aconsequence of at least two interacting forces.
First, large numbers of patients identified as requir-ing inpatient care were boarded in the ED while a bedwas being located in an overcrowded hospital. Becausethat process often took many hours, caring for thosepatients absorbed substantial amounts of the availableclinical capacity so that delays in seeing new arrivalswere commonplace. Thus, there was often a queue ofnew patients waiting to be seen and assessed.
Second, the use of the ATS as a method of prioritizingthe order in which waiting patients were seen andassessed meant the overall length of time patients spentwithin the department was frequently extended. Apatient’s nominal place in the queue for assessment andtreatment was always at risk of being pre-empted bythe arrival of a patient (or patients) in a higher triagecategory. As waits extended, pre-emption could occuron a number of occasions. Staff used various ways ofgetting around this pre-emption, such as fast trackingwhen they could, rapidly assessing a patient and start-ing tests and then moving on to another patient, nursingstaff advocating on behalf of a patient to move thepatient up in the queue, and various other methods. Itbecame evident that many of these increased the overallsense of chaos and lack of control, despite undoubtedlygood intentions.
We moved away from complex queuing processes forthe potentially dischargeable group of patients. Staffwere instructed that, in the absence of threat to life orlimb, they were to see B-side patients in order of arrivalrather than by triage category. Initially, we were reluc-tant to take that step for patients likely to be admittedto hospital. However, since September 2004, A-sidepatients assigned a Triage category 3, 4 or 5 have alsobeen seen in order of arrival.
The quantitative information provided in the
Results
section demonstrates that our streaming processes hada clear impact on aspects of the assessment and totaltime patients spent in the ED. Seeing patients in orderof arrival, led, as expected, to a flattening out of thewaiting time for initial assessment across the triagecategories. This did not influence the adherence to tri-age times, but it significantly, diminished the actualmean time to initiation of meaningful treatment. Accessblock decreased slightly, but the total time spent in the
ED decreased significantly both for those patients whowent home from the department, and those admitted tohospital. This was despite a slight overall increase inthe numbers of arrivals, and no increase in medicalstaff. As a result, the average number of patients in theED at any time decreased for the first time in manyyears.
There was no evidence of a decline in the safety ofthe care provided, and the acceptability of the systemto the patients was evidenced by the immediate, sus-tained and highly significant reduction in number of‘did not wait’ patients, despite the overall increase inthe number of presentations to the department.
The impact of the streaming was felt in other ways.From the first day that the new flows were instituted,the ED regained a feeling of control, and the newstreams were readily accepted by the staff. Discussionwith patients indicated that although they disliked wait-ing, they could accept it if they had a clear idea of wherethey were ‘in the queue’. Seeing potentially discharge-able patients in order of arrival reduced the sense offrustration among patients. Anecdotally, levels of ver-bal and physical aggression fell within the departmentas soon as the new flows were instituted. This wasparticularly noticeable at the triage desk.
The authors believe that these findings have impor-tant implications for the way triage is applied. Thedemonstrable benefits over the traditional use of thetriage scale means that patients presenting to this EDare functionally seen in two groups – those that requirean immediate, or ‘time critical’ intervention (such asresuscitation, investigation to exclude the need for amedical intervention or urgent pain relief), and thosepatients that are safely seen in order of presentation.This system, by reducing the complexity of the queuingprocess, leads to reduction in total treatment times andreduced total patient numbers in the ED, it is moreacceptable to patients, and in an environment that is indanger of becoming overcrowded and chaotic is, webelieve, safer, because chaos is reduced enabling staffto concentrate on the task at hand.
The Flinders Medical Centre team were introduced tothe notion of applying Lean Thinking to health careduring a visit to hospitals in the UK National HealthService. However, the model developed at the FlindersMedical Centre is somewhat different to the modelsused in the National Health Service. Strategies such as‘see-and-treat’ where patients are seen by senior deci-sion making staff at the point of arrival, with the inten-tion of immediately discharging a substantial numberof patients were deemed as unlikely to be helpful in an

Redesigning patient flows
© 2006 The AuthorsJournal compilation © 2006 Australasian College for Emergency Medicine and Australasian Society for Emergency Medicine
397
ED where the acuity of patients was high, as indicatedby the admission rate of over 40%.
10,11
Similarly, thelarge numbers of patients of all types with complexconditions meant that rapid assessment teams
12
or fast-track areas
13,14
that took out only the manifestly wellED attendees would not see a large enough group ofpatients to justify themselves.
Limitations
This is a descriptive study of changes within onedepartment where a consensus had been reached that aradical change was necessary, although the nature ofthat change was not evident before the redesign processbegan. Caution should be exercised before generalizingto departments whose situation is different from thatdescribed here.
Conclusions
Patient flows within a busy ED have been substantiallyredesigned. Incoming patients have been separated intothose who are identified as likely to be able to returnhome, and those who are likely to be admitted to hos-pital. Patients within each stream are directed to differ-ent areas of the ED where they are cared for bydifferent groups of staff. The key role of triage in mak-ing initial assessments then seeing and sorting patientsaccording to clinical urgency, remains. However, theuse of a triage score to create a complex queue has beensuperseded. Triage now functions as a means of identi-fying patients requiring a time critical intervention,with all other patients streamed by likely disposition inrelation to admission to hospital or discharge home,each stream of patients then being seen in order ofarrival. Streaming of patients in this way improves theflow of patients through the department and is wellaccepted by staff and patients alike. It deserves furtherstudy.
Acknowledgements
We are grateful for the assistance of Paul Hakendorfand Chris Horwood for data extraction and analysis,and for the continuing support Michael Szwarcbord,General Manager of the Flinders Medical Centre, hasprovided to the redesign process. Our colleagues in theRedesigning care team have been a continuous sourceof enlightenment and support. Funding for the redesign
process was initially supplied by the Board of theFlinders Medical Centre, and has been continued by theBoard of the Southern Adelaide Health Service.
Author contributions
All authors contributed actively to the original work inthe planning and implementation of the patient flowchanges. Manuscript authorship provided primarily byDavid Ben-Tovim and Diane King. Data collection andcollation by David Ben-Tovim.
Competing interests
None declared.
Accepted 4 April 2006
References
1. Cameron P, Cameron D. Access block: problems and progress.MJA 2003; 178: 99–100.
2. Bartlett J, Cameron P, Cisera M. The Victorian emergencydepartment collaboration. J. Qual. Clin. Pract. 2002; 14: 463–70.
3. Bagust A, Place M, Posnett JW. Dynamics of bed use in accom-modating emergency admissions: stochastic simulation model.BMJ 1999; 319: 155–8.
4. Womack J, Jones D. Lean Thinking. Banish Waste and CreateWealth in Your Organisation. London: Simon and Schuster, 1996.
5. Walley P. Designing the accident and emergency system: lessonsfrom manufacturing. Emerg. Med. J. 2003; 20: 126–30.
6. Rother M, Shook J. Learning to See. Brookline, Mass: Lean Enter-prise Institute, 1998.
7. Ohno T. The Toyota Production System: Beyond Large-scaleProduction. Portland, OR: Productivity Press, 1988.
8. Jones C, Medien N, Robertson M et al. The lean enterprise. BTTechnol. J. 1999; 17: 15–22.
9. Hauswald M. Triage: better tools but the wrong problem. Acad.Emerg. Med. 2005; 12: 533–5.
10. Leaman AM. See and treat: a management driven method ofachieving targets or a tool for better patient care? One size doesnot fit all. Emerg. Med. J. 2003; 20: 118.
11. Catille K, Cooke M. One size does not fit all. View 2. Emerg. Med.J. 2003; 20: 12–12.
12. Grant S, Spain D, Green D. Rapid Assessment team reduceswaiting time. Emerg. Med. Australas. 1999; 11: 72–6.
13. Taylor DmCD, Bennet D, Cameron PA. paradigm shift in thenature of care provision in emergency departments. Emerg Med.J. 2004; 21: 681–4.
14. Meislin H, Coates S, Cyr J et al. Fast Track: urgent care withina teaching hospital emergency department: can it work? Ann.Emerg. Med. 1988; 17: 453–6.