redland trails shopping center - cre … · marcus & millichap is proud to present redland...
TRANSCRIPT

SAN ANTONIO, TX
OFFERING MEMORANDUM
REDLAND TRAILS SHOPPINGCENTER

The information contained in the following Marketing Brochure is proprietary and strictly confidential. It is intended
to be reviewed only by the party receiving it from Marcus & Millichap and should not be made available to any other
person or entity without the written consent of Marcus & Millichap. This Marketing Brochure has been prepared to
provide summary, unverified information to prospective purchasers, and to establish only a preliminary level of
interest in the subject property. The information contained herein is not a substitute for a thorough due diligence
investigation. Marcus & Millichap has not made any investigation, and makes no warranty or representation, with
respect to the income or expenses for the subject property, the future projected financial performance of the property,
the size and square footage of the property and improvements, the presence or absence of contaminating substances,
PCB's or asbestos, the compliance with State and Federal regulations, the physical condition of the improvements
thereon, or the financial condition or business prospects of any tenant, or any tenant’s plans or intentions to continue
its occupancy of the subject property. The information contained in this Marketing Brochure has been obtained from
sources we believe to be reliable; however, Marcus & Millichap has not verified, and will not verify, any of the
information contained herein, nor has Marcus & Millichap conducted any investigation regarding these matters and
makes no warranty or representation whatsoever regarding the accuracy or completeness of the information provided.
All potential buyers must take appropriate measures to verify all of the information set forth herein.
ALL PROPERTY SHOWINGS ARE BY APPOINTMENT ONLY. PLEASE CONSULT YOUR MARCUS & MILLICHAP
AGENT FOR MORE DETAILS.
REDLAND TRAILS SHOPPING CENTERSAN ANTONIO, TX
This information has been secured from sources we believe to be reliable, but we make no representations or warranties, expressed orimplied, as to the accuracy of the information. References to square footage or age are approximate. Buyer must verify theinformation and bears all risk for any inaccuracies. Marcus & Millichap Real Estate Investment Services is a service mark of Marcus& Millichap Real Estate Investment Services, Inc. © 2011 Marcus & Millichap R0490011
CON
FIDEN
TIALITYA
GREEM
ENT
CON
FIDEN
TIALITY A
ND
DISCLA
IMER

SECTION ONE........................................................PROPERTY DESCRIPTION
SECTION TWO
.........................................PRICING & FINANCIAL ANALYSIS
SECTION THREE......................................DEMOGRAPHIC ANALYSIS
SECTION FOUR......................................MARKET OVERVIEW
REDLAND TRAILS SHOPPING CENTERSAN ANTONIO, TX
This information has been secured from sources we believe to be reliable, but we make no representations or warranties, expressed orimplied, as to the accuracy of the information. References to square footage or age are approximate. Buyer must verify theinformation and bears all risk for any inaccuracies. Marcus & Millichap Real Estate Investment Services is a service mark of Marcus& Millichap Real Estate Investment Services, Inc. © 2011 Marcus & Millichap R0490011
TABLE O
F CON
TENTS

REDLAND TRAILSSHOPPING CENTERSAN ANTONIO, TX
PROPERTY D
ESCRIPTION

Marcus & Millichap is proud to present Redland Trails, a 32,623-square foot neighborhood shopping center located in the rapidly growing North Loop 1604 Corridor in San Antonio, Texas. Situated on a hard corner, the center is currently 88 percent leased with NNN leases.
Located east of US Highway 281, the property is positioned in a growing residential and commercial corridor of San Antonio. Tenant patrons have access to the center from Redland Road and Loop 1604. The subject is ideally situated on the main access point along Loop 1604 to the Tesoro Corporation's newly constructed Headquarters. It is also near the JW Marriott San Antonio Hill Country Resort, and the TPC San Antonio PGA Village, home of the 2010 Valero Texas Open. Average Household income in the surrounding five mile radius is greater than $85,000.
At the current occupancy, an investor may achieve a nearly 9 percent capitalization rate and an 11 percent cash-on-cash return. Additionally for qualified investors, non-recourse debt is available through Marcus & Millichap Capital Corp.
REDLAND TRAILS SHOPPING CENTERSAN ANTONIO, TX
This information has been secured from sources we believe to be reliable, but we make no representations or warranties, expressed orimplied, as to the accuracy of the information. References to square footage or age are approximate. Buyer must verify theinformation and bears all risk for any inaccuracies. Marcus & Millichap Real Estate Investment Services is a service mark of Marcus& Millichap Real Estate Investment Services, Inc. © 2011 Marcus & Millichap R0490011
PROPERTY D
ESCRIPTION
INVESTMENT HIGHLIGHTS
1
Investment Overview
Visibility and Access from Loop1604 with Approximately 90,000Vehicles Per Day
Over 11 Percent Cash-on-CashReturn with Non-Recourse Debt
Near H.E.B Grocery, Costco,Walmart Supercenter
Strong Growth Area - 31 PercentPopulation Growth Since 2000
Attractive 2007 Construction
Convenient Access to NewRidgewood Office Development -Home of Tesoro Headquarters
PROPERTY D
ESCRIPTION
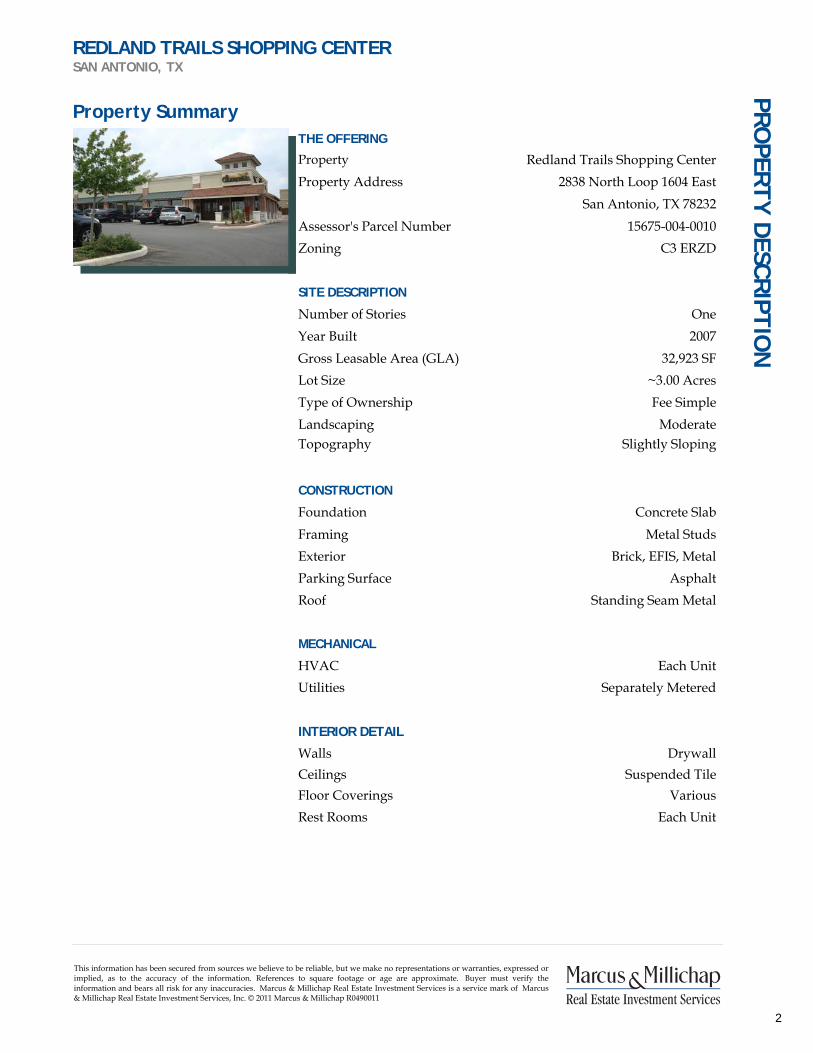
THE OFFERING
Property Redland Trails Shopping CenterProperty Address 2838 North Loop 1604 East
San Antonio, TX 78232Assessor's Parcel Number 15675-004-0010Zoning C3 ERZD
SITE DESCRIPTION
Number of Stories OneYear Built 2007Gross Leasable Area (GLA) 32,923 SFLot Size ~3.00 AcresType of Ownership Fee SimpleLandscaping ModerateTopography Slightly Sloping
CONSTRUCTION
Foundation Concrete SlabFraming Metal StudsExterior Brick, EFIS, MetalParking Surface AsphaltRoof Standing Seam Metal
MECHANICAL
HVAC Each UnitUtilities Separately Metered
INTERIOR DETAIL
Walls DrywallCeilings Suspended TileFloor Coverings VariousRest Rooms Each Unit
REDLAND TRAILS SHOPPING CENTERSAN ANTONIO, TX
This information has been secured from sources we believe to be reliable, but we make no representations or warranties, expressed orimplied, as to the accuracy of the information. References to square footage or age are approximate. Buyer must verify theinformation and bears all risk for any inaccuracies. Marcus & Millichap Real Estate Investment Services is a service mark of Marcus& Millichap Real Estate Investment Services, Inc. © 2011 Marcus & Millichap R0490011
PROPERTY D
ESCRIPTION
2
Property Summary

PROPERTY D
ESCRIPTION
CONSTRUCTION
FEATURES
Aluminum and Tiled Awnings
Curbed Asphalt Parking Lot with Ample Parking
Attractive Construction with Tower Feature
Glass Store Fronts with Aluminum Frames
Ingress/Egress from Loop 1604 Access Road andRedland Road
Outdoor Restaurant Seating Under Covered Patio
Irrigated Landscaping with Newly Planted Oaksand Cypress Trees
Close Proximity to New and Well EstablishedNeighborhoods
REDLAND TRAILS SHOPPING CENTERSAN ANTONIO, TX
This information has been secured from sources we believe to be reliable, but we make no representations or warranties, expressed orimplied, as to the accuracy of the information. References to square footage or age are approximate. Buyer must verify theinformation and bears all risk for any inaccuracies. Marcus & Millichap Real Estate Investment Services is a service mark of Marcus& Millichap Real Estate Investment Services, Inc. © 2011 Marcus & Millichap R0490011
PROPERTY D
ESCRIPTION
3
Property Features

REDLAND TRAILS SHOPPING CENTERSAN ANTONIO, TX
This information has been secured from sources we believe to be reliable, but we make no representations or warranties, expressed orimplied, as to the accuracy of the information. References to square footage or age are approximate. Buyer must verify theinformation and bears all risk for any inaccuracies. Marcus & Millichap Real Estate Investment Services is a service mark of Marcus& Millichap Real Estate Investment Services, Inc. © 2011 Marcus & Millichap R0490011
PROPERTY D
ESCRIPTION
4
Property Photos

REDLAND TRAILS SHOPPING CENTERSAN ANTONIO, TX
This information has been secured from sources we believe to be reliable, but we make no representations or warranties, expressed orimplied, as to the accuracy of the information. References to square footage or age are approximate. Buyer must verify theinformation and bears all risk for any inaccuracies. Marcus & Millichap Real Estate Investment Services is a service mark of Marcus& Millichap Real Estate Investment Services, Inc. © 2011 Marcus & Millichap R0490011
PROPERTY D
ESCRIPTION
5
Property Photos

LOCAL MAP
REGIONAL MAP
REDLAND TRAILS SHOPPING CENTERSAN ANTONIO, TX
This information has been secured from sources we believe to be reliable, but we make no representations or warranties, expressed orimplied, as to the accuracy of the information. References to square footage or age are approximate. Buyer must verify theinformation and bears all risk for any inaccuracies. Marcus & Millichap Real Estate Investment Services is a service mark of Marcus& Millichap Real Estate Investment Services, Inc. © 2011 Marcus & Millichap R0490011
PROPERTY D
ESCRIPTION
6
Area Maps

REDLAND TRAILS SHOPPING CENTERSAN ANTONIO, TX
This information has been secured from sources we believe to be reliable, but we make no representations or warranties, expressed orimplied, as to the accuracy of the information. References to square footage or age are approximate. Buyer must verify theinformation and bears all risk for any inaccuracies. Marcus & Millichap Real Estate Investment Services is a service mark of Marcus& Millichap Real Estate Investment Services, Inc. © 2011 Marcus & Millichap R0490011
PROPERTY D
ESCRIPTION
7
Site Plan

PROPERTY DESCRIPTION
Aer
ial P
hoto
RED
LAN
D T
RAIL
S SH
OPP
ING
CEN
TER
SAN
AN
TON
IO,
TX
This
info
rmat
ion
has b
een
secu
red
from
sour
ces w
e be
lieve
to b
e re
liabl
e, b
ut w
e m
ake
no re
pres
enta
tions
or w
arra
ntie
s, e
xpre
ssed
or i
mpl
ied,
as
to th
e ac
cura
cy o
f the
info
rmat
ion.
Ref
eren
ces t
o sq
uare
foot
age
or a
ge a
re a
ppro
xim
ate.
Buy
er m
ust v
erify
the
info
rmat
ion
and
bear
s al
l ris
k fo
r any
inac
cura
cies
. M
arcu
s & M
illic
hap
Real
Est
ate
Inve
stm
ent S
ervi
ces i
s a se
rvic
e m
ark
of M
arcu
s &
Mill
icha
p Re
al E
stat
e In
vest
men
t Ser
vice
s, In
c. ©
201
1 M
arcu
s &
Mill
icha
p R0
4900
118

REDLAND TRAILSSHOPPING CENTERSAN ANTONIO, TX
PRICING
& FIN
AN
CIAL A
NA
LYSIS

REDLAND TRAILS SHOPPING CENTERSAN ANTONIO, TX
This information has been secured from sources we believe to be reliable, but we make no representations or warranties, expressed orimplied, as to the accuracy of the information. References to square footage or age are approximate. Buyer must verify theinformation and bears all risk for any inaccuracies. Marcus & Millichap Real Estate Investment Services is a service mark of Marcus& Millichap Real Estate Investment Services, Inc. © 2011 Marcus & Millichap R0490011
PRICING
& FIN
AN
CIAL A
NA
LYSIS
10
Price $6,200,000
Down Payment 35% $2,170,000
Price per Square Foot (GLA) $188.32
Gross Leasable Area (GLA) 32,923
Year Built 2007
Lot Size ~3.00 Acres
VITAL DATA
CAP Rate - Yr 1 Scheduled Income 9.56%
Net Operating Income - Yr 1 Scheduled $592,922
Net Cash Flow After Debt Service - Yr 1 $278,046Total Return - Yr 1 Scheduled Income 16.28% $353,171
CAP Rate - Yr 1 w/Pending LOI 10.04%
Net Operating Income - Yr 1 w/Pending LOI $622,331
Net Cash Flow After Debt Service - Yr 1 $307,455Total Return - Yr 1 w/Pending LOI 17.63% $382,580
Offering Summary
PROPOSED FINANCING
FIRST TRUST DEED
Loan Amount $4,030,000
Loan Type Proposed New
Interest Rate 6.5%
Amortization 25 Years
Loan to Value 65%
Debt Coverage Ratio 1.83
* Non Recourse for Qualified Buyers
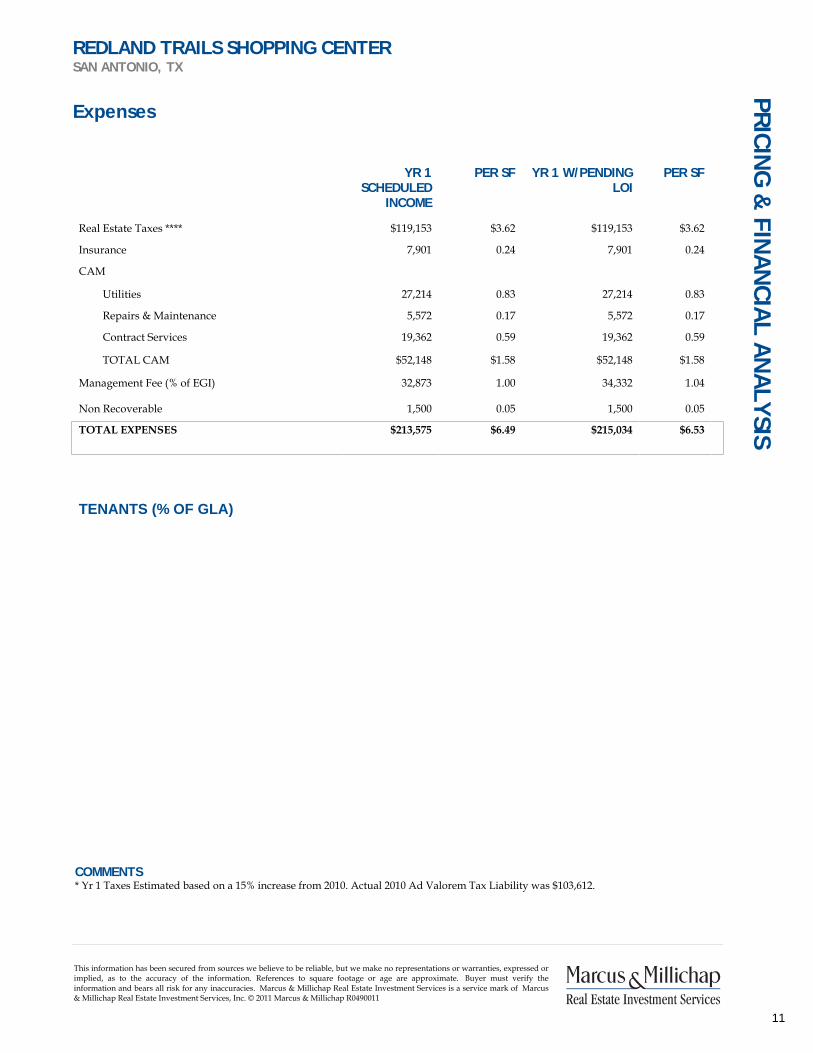
COMMENTS* Yr 1 Taxes Estimated based on a 15% increase from 2010. Actual 2010 Ad Valorem Tax Liability was $103,612.
REDLAND TRAILS SHOPPING CENTERSAN ANTONIO, TX
YR 1SCHEDULED
INCOME
PER SF YR 1 W/PENDINGLOI
PER SF
Real Estate Taxes **** $119,153 $3.62 $119,153 $3.62
Insurance 7,901 0.24 7,901 0.24
CAM
Utilities 27,214 0.83 27,214 0.83
Repairs & Maintenance 5,572 0.17 5,572 0.17
Contract Services 19,362 0.59 19,362 0.59
TOTAL CAM $52,148 $1.58 $52,148 $1.58
Management Fee (% of EGI) 32,873 1.00 34,332 1.04
Non Recoverable 1,500 0.05 1,500 0.05
TOTAL EXPENSES $213,575 $6.49 $215,034 $6.53
This information has been secured from sources we believe to be reliable, but we make no representations or warranties, expressed orimplied, as to the accuracy of the information. References to square footage or age are approximate. Buyer must verify theinformation and bears all risk for any inaccuracies. Marcus & Millichap Real Estate Investment Services is a service mark of Marcus& Millichap Real Estate Investment Services, Inc. © 2011 Marcus & Millichap R0490011
PRICING
& FIN
AN
CIAL A
NA
LYSIS
11
Expenses
TENANTS (% OF GLA)

REDLAND TRAILS SHOPPING CENTERSAN ANTONIO, TX
This information has been secured from sources we believe to be reliable, but we make no representations or warranties, expressed orimplied, as to the accuracy of the information. References to square footage or age are approximate. Buyer must verify theinformation and bears all risk for any inaccuracies. Marcus & Millichap Real Estate Investment Services is a service mark of Marcus& Millichap Real Estate Investment Services, Inc. © 2011 Marcus & Millichap R0490011
PRICING
& FIN
AN
CIAL A
NA
LYSIS
COMMENTS* Year 1 Scheduled Income includes contract rent beginning May 2011.** 2011 Expense Reimbursements estimated based on increase in Real Estate Tax liability.*** Rental Income from Pylon Sign includes projected rent from Hair Glow Salon.**** Yr 1 Taxes Estimated based on a 15% increase from 2010. Actual 2010 Ad Valorem Tax Liability was $103,612.
12
YR 1SCHEDULED
INCOME
PER SF YR 1 W/PENDINGLOI
PER SF
Base Rent
Occupied Space * $609,499 $20.88 $631,367 $21.63
Vacant Space at Market Rents (3,731 SF) 73,420 19.68 50,620 13.57
GROSS POTENTIAL RENT $682,919 $20.74 $681,987 $20.71
Expense Reimbursements ** 187,098 5.68 194,898 5.92Rental Income from Pylon Sign *** 11,100 0.34 11,100 0.34
GROSS POTENTIAL INCOME $881,117 $26.76 $887,985 $26.97
Vacancy/Collection Allowance (% of GPR) (10.9%) 74,620 2.27 (7.4%) 50,620 1.54EFFECTIVE GROSS INCOME $806,497 $24.50 $837,365 $25.43
Total Expenses $213,575 6.49 $215,034 6.53
NET OPERATING INCOME $592,922 $18.01 $622,331 $18.90
Reserves / Replacements 3,292 0.10 3,292 0.10NET CASH FLOW BEFORE DEBT SERVICE $589,630 $17.91 $619,039 $18.80
Gross Leasable Area (GLA) 32,923 SF
Income & Expenses
Income

REDLAND TRAILS SHOPPING CENTERSAN ANTONIO, TX
This information has been secured from sources we believe to be reliable, but we make no representations or warranties, expressed orimplied, as to the accuracy of the information. References to square footage or age are approximate. Buyer must verify theinformation and bears all risk for any inaccuracies. Marcus & Millichap Real Estate Investment Services is a service mark of Marcus& Millichap Real Estate Investment Services, Inc. © 2011 Marcus & Millichap R0490011
PRICING
& FIN
AN
CIAL A
NA
LYSIS
13
COMMENTS
- First Community Bank paid reduced rent for first two years of occupancy.- Rent for RideAway Bicycles reflects increase in July 2011.- Should Hair Glow decide to occupy the premises prior to May 1, 2011, they shall only pay the NNN expenses associated with theirpremises
Tenant SummaryTenant GLA % of
GLALease
CommenceLeaseExpire
AnnualRent
Rent/SF
ChangesOn
ChangesTo
Other:Options/% Rent
LeaseType
El Chaparral 8,042 24.43% 6/16/2008 6/30/2015 $156,819.00 $19.50 7/11/20117/1/2013
$20.43$19.50
Two-5Yr
NNN
Ride Away Bicycles 5,185 15.75% 6/15/2008 6/30/2013 $103,700.00 $20.00 7/1/2011 $20.25 Two - 5 NNN
New York Bar 2,611 7.93% 4/1/2008 3/13/2013 $56,789.16 $21.75 N/A N/A Two-5Yr
NNN
Pinky's Nail & Spa 1,500 4.56% 4/1/2008 3/31/2013 $36,000.00 $24.00 N/A N/A Two-5Yr
NNN
Super Cleaners 1,200 3.64% 10/5/2008 10/31/2013 $25,200.00 $21.00 11/1/2011 $23.00 Two-5Yr
NNN
Vacant 1,450 4.40% $0.00 NNN
Pending LOI 1,200 3.64% $22,800.00 $19.00 NNN
Mica Jewelry 1,200 3.64% 4/24/2008 4/30/2013 $25,344.00 $21.12 N/A N/A Two - 5Yr
NNN
First Community Bank 3,070 9.32% 4/11/2008 4/30/2018 $70,610.00 $23.00 N/A N/A Two - 5Yr
NNN
Doggie Dooz 1,344 4.08% 7/1/2009 12/31/2014 $25,725.00 $19.14 N/A N/A One - 5Yr
NNN
Monfrey Music 1,840 5.59% 7/1/2009 12/31/2014 $36,800.00 $20.00 N/A N/A One - 5Yr
NNN
Hair Glow 3,200 9.72% 5/1/2011 4/30/2018 $64,000.00 $20.00 5/1/2012 $21.00 N/A NNN
5/1/2013 $21.50
5/1/2016 $22.00
5/1/2017 $22.50
Vacant 1,081 3.28% N/A N/A $0.00 N/A N/A N/A N/A
TOTAL VACANT 2,531 7.69%
TOTAL OCCUPIED 30,392 92.31% $623,787.16 $150.68
TOTAL 32,923 100.00% $623,787.16 $150.68

PRICING
& FIN
AN
CIAL A
NA
LYSISREDLAND TRAILS SHOPPING CENTERSAN ANTONIO, TX
This information has been secured from sources we believe to be reliable, but we make no representations or warranties, expressed orimplied, as to the accuracy of the information. References to square footage or age are approximate. Buyer must verify theinformation and bears all risk for any inaccuracies. Marcus & Millichap Real Estate Investment Services is a service mark of Marcus& Millichap Real Estate Investment Services, Inc. © 2011 Marcus & Millichap R0490011
PRICING
& FIN
AN
CIAL A
NA
LYSIS
14
Lease Expiration Summary
Percentage of SF Expiring Number of Tenants Expiring Cumulative % of SF Expiring
0%
10%
20%
30%
40%
50%
60%
70%
80%
90%
Tota
l Pro
ject
Squ
are
Foot
age
0
1
2
3
Num
ber o
f Ten
ants
May 20110%
May 201216%
May 201319%
May 201410%
May 201524%
May 20160%
May 201719%
May 20180%
May 20190%
May 20200%
Any projections, opinions, assumptions or estimates used here within are for example purposes only and do not represent the current or future performance of the property.
For The Year Beginning Year 1May 2011
Year 2May 2012
Year 3May 2013
Year 4May 2014
Year 5May 2015
Year 6May 2016
Year 7May 2017
Year 8May 2018
Year 9May 2019
Year 10May 2020
Tenant(s) Name New YorkBar
Pinky's Nail& SpaMica
Jewelry
Ride AwayBicyclesSuper
Cleaners
Doggie DoozMonfreyMusic
El Chaparral FirstCommunity
BankHair Glow
Total Number of Tenants 3 2 2 1 2
Total Square Feet 5,311 6,385 3,184 8,042 6,270
Total Percentage 16.1% 19.4% 9.7% 24.4% 19.0%
Cumulative Percentage 16.1% 35.5% 45.2% 69.6% 88.7%

PRICING
& FIN
AN
CIAL A
NA
LYSIS
Tenant Name: El Chaparral Mexican Restaurant
Lease Commencement: 6/16/2008
Lease Expiration: 6/30/2015
Gross Leasable Area 8,042
Original Term: Two-5 Year
Option Term: 5 Years
Pro Rata Share of Project: 24%
Headquartered: San Antonio, TX
No. of Locations: 3 Restaurants
Web Site: www.elchaparral.com
El Chaparral Mexican Restaurant is a family owned and operatedrestaurant that has been in business for over 30 years. El Chaparral firstopened in the San Antonio suburb of Helotes in 1972 and has sinceopened two other successful locations, including their newest restaurantin the Redland Trails Shopping Center.
LEASE SUMMARY
REDLAND TRAILS SHOPPING CENTERSAN ANTONIO, TX
This information has been secured from sources we believe to be reliable, but we make no representations or warranties, expressed orimplied, as to the accuracy of the information. References to square footage or age are approximate. Buyer must verify theinformation and bears all risk for any inaccuracies. Marcus & Millichap Real Estate Investment Services is a service mark of Marcus& Millichap Real Estate Investment Services, Inc. © 2011 Marcus & Millichap R0490011
Lease Years Annual Rent Monthly Rent Monthly Rent/SF1-3 $156,816.00 $13,068 $1.62
4-5 $164,304.00 $13,692 $1.70
6-7 $156,816.00 $13,068 $1.62
PRICING
& FIN
AN
CIAL A
NA
LYSIS
BASE RENT
15
OPTION RENT
Tenant & Lease Summary
Lease Years Annual Rent Monthly Rent Monthly Rent/SF8-12 $177,663.84 $14,805.32 $1.84
13-17 $195,903.12 $16,325.26 $2.03

PRICING
& FIN
AN
CIAL A
NA
LYSIS
Tenant Name: Ride Away BicyclesLease Commencement: 6/15/2008Lease Expiration: 6/30/2013Gross Leasable Area 5,185Original Term: Two-5 Year
Option Term: 5 YearsPro Rata Share of Project: 15.89%Headquartered: San Antonio, TXNo. of Locations: 3 StoresWeb Site: www.rideawaybicycles.com
Ride Away Bicycles is a bicycle sales and service store located in SanAntonio, Texas. Since 1996, Ride Away is known locally for experiencedand knowledgeable staff, good customer service and product selection.Currently, Ride Away Bicycles has three locations in San Antonio: 8509Culebra, 11075 IH-10, and 2838 N. Loop 1604 East.
LEASE SUMMARY
REDLAND TRAILS SHOPPING CENTERSAN ANTONIO, TX
This information has been secured from sources we believe to be reliable, but we make no representations or warranties, expressed orimplied, as to the accuracy of the information. References to square footage or age are approximate. Buyer must verify theinformation and bears all risk for any inaccuracies. Marcus & Millichap Real Estate Investment Services is a service mark of Marcus& Millichap Real Estate Investment Services, Inc. © 2011 Marcus & Millichap R0490011
Lease Years Annual Rent Monthly Rent Monthly Rent/SF
1 $93,330.00 $7,778 $1.502 $98,520.00 $8,210 $1.583 $103,692.00 $8,641 $1.67
4-5 $104,988.00 $8,749 $1.69
PRICING
& FIN
AN
CIAL A
NA
LYSIS
BASE RENT
16
OPTION RENT
Tenant & Lease Summary
Lease Years Annual Rent Monthly Rent Monthly Rent/SF6-10 $111,480.00 $9,290.00 $1.79
11-15 $121,848.00 $10,154.00 $1.96

PRICING
& FIN
AN
CIAL A
NA
LYSIS
Tenant Name: First Community BankLease Commencement: 4/11/2008Lease Expiration: 4/30/2018Gross Leasable Area 3,070Original Term: Two-5 Year
Option Term: 5 YearsPro Rata Share of Project: 9.41%Headquartered: San Antonio, TXNo. of Locations: 34 LocationsWeb Site: www.firstcommunitybank.net
First Community Bank was founded in 1995 and has 34 locations statewide including seven in San Antonio, and there are plans to expand intothe Austin market. The bank's target market is small to medium sizebusinesses with loan requirements between $50,000 to $6 million.
LEASE SUMMARY
Lease Years Annual Rent Monthly Rent Monthly Rent/SF
1-2 $41,199.36 $3,433 $1.12
3-10 $70,610.04 $5,884 $1.92
REDLAND TRAILS SHOPPING CENTERSAN ANTONIO, TX
This information has been secured from sources we believe to be reliable, but we make no representations or warranties, expressed orimplied, as to the accuracy of the information. References to square footage or age are approximate. Buyer must verify theinformation and bears all risk for any inaccuracies. Marcus & Millichap Real Estate Investment Services is a service mark of Marcus& Millichap Real Estate Investment Services, Inc. © 2011 Marcus & Millichap R0490011
BASE RENT
PRICING
& FIN
AN
CIAL A
NA
LYSIS
17
OPTION RENT
Tenant & Lease Summary
Lease Years Annual Rent Monthly Rent Monthly Rent/SF
11-15 $79,820.04 $6,651.67 $2.17
16-20 $85,959.96 $7,163.33 $2.33

FIRST TRUST DEED
Loan Amount $4,030,000
Loan Type Proposed New
Interest Rate 6.5%
Amortization 25 Years
Loan to Value 65%
2838 North Loop 1604 East
San Antonio, TX 78232
Price $6,200,000
Down Payment 35% $2,170,000
Gross Leasable Area (GLA) 32,923
Price/SF $188.32
CAP Rate - Yr 1 Scheduled 9.56%
CAP Rate - Yr 1 w/Pending LOI 10.04%
Year Built 2007
Lot Size ~3.00 Acres
Type of Ownership Fee Simple
ANNUALIZED OPERATING DATAINCOME YR 1
SCHEDULEDINCOME
YR 1W/PENDING
LOIBase Rent
Occupied Space * $609,499 $631,367
Vacant Space at Market Rents 73,420 50,620
Gross Potential Rent $682,919 $681,987
Expense Reimbursements ** 187,098 194,898
Rental Income from Pylon Sign *** 11,100 11,100Gross Potential Income $881,117 $887,985
Vacancy/Collection Allowance 10.9% 74,620 7.4% 50,620
Effective Gross Income $806,497 $837,365
Total Expenses 213,575 215,034
Net Operating Income $592,922 $622,331
Reserves / Replacements 3,292 3,292
Net Cash Flow Before Debt Service $589,630 $619,039
Debt Service 311,584 311,584
Debt Coverage Ratio 1.90 2.00
Net Cash Flow After Debt Service 12.81% $278,046 14.17% $307,455
Principal Reduction 75,125 75,125
Total Return 16.28% $353,171 17.63% $382,580
LOCATION
REDLAND TRAILS SHOPPING CENTERSAN ANTONIO, TX
This information has been secured from sources we believe to be reliable, but we make no representations or warranties, expressed orimplied, as to the accuracy of the information. References to square footage or age are approximate. Buyer must verify theinformation and bears all risk for any inaccuracies. Marcus & Millichap Real Estate Investment Services is a service mark of Marcus& Millichap Real Estate Investment Services, Inc. © 2011 Marcus & Millichap R0490011
FINANCING
PRICING
& FIN
AN
CIAL A
NA
LYSIS
EXPENSESReal Estate Taxes **** $119,153 $119,153
Insurance 7,901 7,901
CAM
Utilities 27,214 27,214
Repairs & Maintenance 5,572 5,572
Contract Services 19,362 19,362
TOTAL CAM $52,148 $52,148
Management Fee (% of EGI) 4.1% 32,873 4.1% 34,332
Non Recoverable $1,500 $1,500TOTAL EXPENSES $213,575 $215,034
EXPENSES/SF $6.49 $6.53
18
Loan information is time sensitive and subject tochange. Contact Michael Laurencelle (512) 338-7849 forupdated financing.
Financial Overview
Non Recourse Financing available for qualified buyers.

REDLAND TRAILSSHOPPING CENTERSAN ANTONIO, TX
DEM
OG
RAPH
IC AN
ALYSIS

1 Miles: 3 Miles: 5 Miles:
1990 Population 3,702 37,286 92,5802000 Population 7,247 57,439 139,1932008 Population 9,941 70,392 183,9392013 Population 11,810 78,347 207,652
1990 Households 1,435 13,651 34,9952000 Households 2,747 21,457 53,1912008 Households 3,504 25,449 67,0702013 Households 4,058 27,879 74,3222008 Average Household Size 2.82 2.75 2.73
2008 Daytime Population 4,411 28,583 78,806
1990 Median Housing Value $111,263 $99,598 $90,2132000 Median Housing Value $134,608 $118,876 $116,160
2000 Owner Occupied Housing Units 61.7% 73.8% 65.7%2000 Renter Occupied Housing Units 33.1% 22.3% 29.3%2000 Vacant 5.18% 3.88% 5.00%
2008 Owner Occupied Housing Units 66.0% 72.8% 66.4%2008 Renter Occupied Housing Units 24.6% 18.7% 23.9%2008 Vacant 9.40% 8.52% 9.71%
2013 Owner Occupied Housing Units 66.9% 72.4% 66.4%2013 Renter Occupied Housing Units 21.6% 16.9% 21.7%2013 Vacant 11.53% 10.71% 11.89%
$ 0 - $ 14,999 3.3% 3.2% 3.6%$ 15,000 - $24,999 3.3% 4.1% 4.5%$ 25,000 - $34,999 5.3% 5.8% 6.2%$ 35,000 - $49,999 10.7% 10.2% 11.6%$ 50,000 - $74,999 14.3% 18.1% 19.2%$ 75,000 - $99,999 20.2% 18.0% 16.4%$100,000 - $124,999 12.0% 13.7% 12.0%$125,000 - $149,999 9.7% 9.3% 8.7%$150,000 - $200,000 13.5% 9.7% 8.9%$200,000 to $249,999 4.4% 3.5% 3.5%$250,000 + 3.3% 4.6% 5.5%
Median Household Income $89,671 $86,384 $81,854Per Capita Income $30,773 $31,362 $31,970Average Household Income $85,157 $86,263 $86,639
Demographic data © 2008 by Experian/Applied Geographic Solutions.
REDLAND TRAILS SHOPPING CENTERSAN ANTONIO, TX
This information has been secured from sources we believe to be reliable, but we make no representations or warranties, expressed orimplied, as to the accuracy of the information. References to square footage or age are approximate. Buyer must verify theinformation and bears all risk for any inaccuracies. Marcus & Millichap Real Estate Investment Services is a service mark of Marcus& Millichap Real Estate Investment Services, Inc. © 2011 Marcus & Millichap R0490011
DEM
OG
RAPH
IC AN
ALYSIS
20
Demographic Report

Geography: 5 Miles
PopulationIn 2008, the population in your selected geography is 183,939. The population has changed by 32.15% since 2000. It isestimated that the population in your area will be 207,652 five years from now, which represents a change of 12.89%from the current year. The current population is 48.53% male and 51.47% female. The median age of the population inyour area is 35.7, compare this to the US average which is 36.9. The population density in your area is 2,341.99 peopleper square mile.
HouseholdsThere are currently 67,070 households in your selected geography. The number of households has changed by 26.09%since 2000. It is estimated that the number of households in your area will be 74,322 five years from now, whichrepresents a change of 10.81% from the current year. The average household size in your area is 2.73 persons.
Income
In 2008, the median household income for your selected geography is $81,854, compare this to the $US average whichis currently $52,599. The median household income for your area has changed by 33.38% since 2000. It is estimated thatthe median household income in your area will be $93,307 five years from now, which represents a change of 13.99%from the current year.
The current year per capita income in your area is $31,970, compare this to the $US average, which is $26,464. Thecurrent year average household income in your area is $86,639, compare this to the $US average which is $68,953.
Race & Ethnicity
The current year racial makeup of your selected area is as follows: 80.44% White, 4.53% Black, 0.23% Native Americanand 2.97% Asian/Pacific Islander. Compare these to US% averages which are: 73.52% White, 12.40% Black, 0.77%Native American and 4.60% Asian/Pacific Islander.
People of Hispanic origin are counted independently of race. People of Hispanic origin make up 33.20% of the currentyear population in your selected area. Compare this to the US% average of 15.50%.
HousingThe median housing value in your area was $116,160 in 2000, compare this to the $US average of $115,194 for the sameyear. In 2000, there were 36,787 owner occupied housing units in your area and there were 16,405 renter occupiedhousing units in your area. The median rent at the time was $656.
EmploymentIn 2008, there are 78,806 employees in your selected area, this is also known as the daytime population. The 2000Census revealed that 79.0% of employees are employed in white-collar occupations in this geography, and 21.0% areemployed in blue-collar occupations. In 2008, unemployment in this area is 2.82%. In 2000, the median time traveled towork was 23.0 minutes.
Demographic data © 2008 by Experian/Applied Geographic Solutions.
REDLAND TRAILS SHOPPING CENTERSAN ANTONIO, TX
This information has been secured from sources we believe to be reliable, but we make no representations or warranties, expressed orimplied, as to the accuracy of the information. References to square footage or age are approximate. Buyer must verify theinformation and bears all risk for any inaccuracies. Marcus & Millichap Real Estate Investment Services is a service mark of Marcus& Millichap Real Estate Investment Services, Inc. © 2011 Marcus & Millichap R0490011
DEM
OG
RAPH
IC AN
ALYSIS
21
Summary Report

Number of people living in a given area per square mile.
Demographic data © 2008 by Experian/Applied Geographic Solutions.
REDLAND TRAILS SHOPPING CENTERSAN ANTONIO, TX
This information has been secured from sources we believe to be reliable, but we make no representations or warranties, expressed orimplied, as to the accuracy of the information. References to square footage or age are approximate. Buyer must verify theinformation and bears all risk for any inaccuracies. Marcus & Millichap Real Estate Investment Services is a service mark of Marcus& Millichap Real Estate Investment Services, Inc. © 2011 Marcus & Millichap R0490011
DEM
OG
RAPH
IC AN
ALYSIS
Theme Low HighHigh 170 or moreAbove Average 107 170Average 67 107Below Average 42 67Low less than 42
22
Population Density
Population Density

The number of people employed in a given area per square mile.
Demographic data © 2008 by Experian/Applied Geographic Solutions.
REDLAND TRAILS SHOPPING CENTERSAN ANTONIO, TX
This information has been secured from sources we believe to be reliable, but we make no representations or warranties, expressed orimplied, as to the accuracy of the information. References to square footage or age are approximate. Buyer must verify theinformation and bears all risk for any inaccuracies. Marcus & Millichap Real Estate Investment Services is a service mark of Marcus& Millichap Real Estate Investment Services, Inc. © 2011 Marcus & Millichap R0490011
DEM
OG
RAPH
IC AN
ALYSIS
Theme Low HighHigh 80 or moreAbove Average 50 80Average 32 50Below Average 20 32Low less than 20
23
Employment Density
Employment Density

Average income of all the people 15 years and older occupying a single housing unit.
Demographic data © 2008 by Experian/Applied Geographic Solutions.
REDLAND TRAILS SHOPPING CENTERSAN ANTONIO, TX
This information has been secured from sources we believe to be reliable, but we make no representations or warranties, expressed orimplied, as to the accuracy of the information. References to square footage or age are approximate. Buyer must verify theinformation and bears all risk for any inaccuracies. Marcus & Millichap Real Estate Investment Services is a service mark of Marcus& Millichap Real Estate Investment Services, Inc. © 2011 Marcus & Millichap R0490011
DEM
OG
RAPH
IC AN
ALYSIS
Theme Low HighHigh $137,906 or moreAbove Average $86,875 $137,906Average $54,728 $86,875Below Average $34,477 $54,728Low less than $34,477
24
Average Household Income
Average Household Income

REDLAND TRAILS SHOPPING CENTERSAN ANTONIO, TX
This information has been secured from sources we believe to be reliable, but we make no representations or warranties, expressed orimplied, as to the accuracy of the information. References to square footage or age are approximate. Buyer must verify theinformation and bears all risk for any inaccuracies. Marcus & Millichap Real Estate Investment Services is a service mark of Marcus& Millichap Real Estate Investment Services, Inc. © 2011 Marcus & Millichap R0490011
DEM
OG
RAPH
IC AN
ALYSIS
25
Traffic Counts
Traffic counts are provided by the Texas Department of Transportations 2007 survey.

REDLAND TRAILSSHOPPING CENTERSAN ANTONIO, TX
MA
RKET OVERVIEW

REDLAND TRAILS SHOPPING CENTERSAN ANTONIO, TX
This information has been secured from sources we believe to be reliable, but we make no representations or warranties, expressed orimplied, as to the accuracy of the information. References to square footage or age are approximate. Buyer must verify theinformation and bears all risk for any inaccuracies. Marcus & Millichap Real Estate Investment Services is a service mark of Marcus& Millichap Real Estate Investment Services, Inc. © 2011 Marcus & Millichap R0490011
MARKET HIGHLIGHTS
Strong population growth
• San Antonio’s population is projected to
grow by approximately 10 percent over the
next five years.Consistent job creation
• Job growth in San Antonio is expected to
average 2.4 percent per year through 2012.
Low cost of living
• San Antonio residents enjoy a cost of living
that is 5.9 percent below the national average
and no state personal income taxes.
MA
RKET OVERVIEW
27
GEOGRAPHY
The San Antonio MSA spans an eight-county area in south central Texas. The bulk of the population resides
within Bexar County, however, Comal, Guadalupe and Wilson counties have been major areas of growth for
the MSA. The area covers 412 square miles and is strategically located along the I-35 corridor, the fastest-
growing region in the state. San Antonio’s location provides for easy access to other major population centers
in Texas and to Mexico.
San Antonio

CITIES
The San Antonio MSA spans eight counties – Atascosa,
Bandera, Bexar, Comal, Guadalupe, Kendall, Medina
and Wilson. There are six incorporated cities and
towns within the MSA that have populations greater
than 10,000 residents. In absolute numbers, San
Antonio eclipses all other local cities in terms of
population. Over the next decade, strong growth is
anticipated in Schertz, Boerne, Helotes and the area
parallel to Highway 281, north of FM 1604.
Largest Cities: San Antonio MSA
REDLAND TRAILS SHOPPING CENTERSAN ANTONIO, TX
This information has been secured from sources we believe to be reliable, but we make no representations or warranties, expressed orimplied, as to the accuracy of the information. References to square footage or age are approximate. Buyer must verify theinformation and bears all risk for any inaccuracies. Marcus & Millichap Real Estate Investment Services is a service mark of Marcus& Millichap Real Estate Investment Services, Inc. © 2011 Marcus & Millichap R0490011
MA
RKET OVERVIEW
INFRASTRUCTURE
Located in south central Texas, San Antonio serves as a
major gateway between the United States and Mexico.
Situated only 145 miles from Laredo, San Antonio is an
easy drive along Interstate 35 from the border. The
area is further enhanced by a transportation network
that provides a myriad of shipping options to
domestic and international businesses.
Further bolstering San Antonio’s trade is the air cargo
component of the international airport, which consists
of two Foreign Trade Zones (FTZ). Air Cargo East
features 104,000 square feet of warehouse space with
1.1 million square feet of aircraft apron. Air Cargo
West provides an additional 65,300 square feet of
warehouse space and 248,140 square feet of aircraft
apron.
28
San Antonio 1,252,000 Schertz 23,000
New Braunfels 45,000 Universal 16,000
Seguin 24,000 Converse 13,000
San Antonio
One international airport
• Two Foreign Trade Zones for air cargo
• 260 commercial flights per day
• 21 commercial and 8 cargo service
Four interstate freeways
• I-10, I-410, I-37 and I-35
• U.S. Highways 281 and 90
• State Highways 151 and Loop 1604
Three railroads
• Burlington Northern Santa Fe, Union
Pacific and Amtrak
San Antonio is:
• 75 miles from Austin
• 145 miles from Laredo
• 190 miles from Houston
• 250 miles from Dallas

ECONOMY
San Antonio’s economy is anchored by three main
industries – heath care, tourism and national defense.
Despite the importance of these industries, SanAntonio continues to make great strides toward the
diversification of its economic base.San Antonio is the clear leader in Texas when it comes
to benefiting from military spending. In fact, the area
attracts significantly more defense wage dollars thanany other metro in the state. Accordingly, the
government sector is projected to expand payrolls 1.9percent through 2012.
Education and health care play a vital role in the
prosperity of the local economy. An importantcomponent of the health care industry is the South
Texas Medical Center, a conglomerate of hospitals,
clinics, and research and higher education facilities.The center employs over 24,000, has a budget of $2.8
billion, and is directly responsible for the $14 billionbiomedical industry. This has helped place San
Antonio on the cutting edge of research and
development.As the most-visited city in Texas, San Antonio's travel
and tourism industry remains a key economiccomponent. The MSA attracts over 21 million visitors
per year. Popular destinations like The Alamo and
Riverwalk make the city highly identifiable andpopular. San Antonio's tourism and hospitality
industry carries an annual economic impact of $8.7
billion. Over the next five years, the leisure andhospitality sector is forecast to expand employment at
a rate of over 4,000 positions annually.
REDLAND TRAILS SHOPPING CENTERSAN ANTONIO, TX
This information has been secured from sources we believe to be reliable, but we make no representations or warranties, expressed orimplied, as to the accuracy of the information. References to square footage or age are approximate. Buyer must verify theinformation and bears all risk for any inaccuracies. Marcus & Millichap Real Estate Investment Services is a service mark of Marcus& Millichap Real Estate Investment Services, Inc. © 2011 Marcus & Millichap R0490011
MA
RKET OVERVIEW
29
San Antonio

REDLAND TRAILS SHOPPING CENTERSAN ANTONIO, TX
This information has been secured from sources we believe to be reliable, but we make no representations or warranties, expressed orimplied, as to the accuracy of the information. References to square footage or age are approximate. Buyer must verify theinformation and bears all risk for any inaccuracies. Marcus & Millichap Real Estate Investment Services is a service mark of Marcus& Millichap Real Estate Investment Services, Inc. © 2011 Marcus & Millichap R0490011
MA
RKET OVERVIEW
LABOR
The San Antonio MSA is attractive to businesses seeking to take advantage of an expanding labor pool and
lower costs of living and business. Over the long-term, San Antonio stands to benefit greatly from its lower
cost structure in addition to migration within the United States from northern metro areas. As a result, the
professional and business services sector will see the largest percentage growth in employment through 2013.
San Antonio’s labor force is well balanced across a variety of industries. The leading sector is government
with an emphasis on military employment through active duty and civilian defense contractors. Overall,
more than 150,000 people, or 18 percent of the labor force, is employed in this sector.
Education and health services account for the third largest share of San Antonio workers. This sector is
heavily influenced by the South Texas Medical Center, the largest medical research and care provider in
South Texas. However, a large number of employment is found outside of higher education. The private
health care sector contributes substantially to the local economy and this sector is forecast to be one of the
leading sources of job creation over the next several years
The leisure and hospitality sector plays a crucial role in the employment of over 97,000 residents. Tourism in
San Antonio is related not only to the larger national economy but also to the Mexican economy. In fact, San
Antonio is the only nonborder town in the United States to have such a correlation.
The long-term prospects for the San Antonio labor force call for sustained growth that will continue to attract
employers due to the area's favorable cost structure and abundance of skilled workers.
30
San Antonio

EMPLOYERS
With a concentration of military, government and
health care organizations, it stands to reason that these
would represent the largest employers in the area.
However, this should not overshadow the strong,
diverse private sector that fosters the local economy.
Major corporate headquarters call San Antonio home.
United Service Automobile Association (USAA),
which provides insurance products, employs 14,300.
Regional grocery giant H.E.B. Food Stores also
provides a stable source of thousands of jobs in the
area. Southwest Research Institute fills an important
niche in San Antonio. With total employment of 3,000,
this firm brings a host of upper- and middle-income
jobs that enhance the prosperity and stability of the
region. Fortune 500 powerhouse AT&T Inc. employs
6,500 in San Antonio.
The health care industry rounds out the bulk of the top
20 employers in San Antonio. The leader in total
employment and health care employment is South
Texas Medical Center with over 24,000.
San Antonio is seeing a lot of interest from
manufacturing companies that make large items that
would cost too much to ship from overseas, such as
China. The U.S. manufacturing industry has been
shrinking over recent years, however, San Antonio's
manufacturing base has been growing. Helping to
increase San Antonio's manufacturing base is Toyota
Motor Manufacturing of Texas's plant, which began
building Tundra trucks in 2006. To date, San Antonio
has landed 39 Toyota-related companies.
Top 10 Employers
South Texas Medical Center 24,000
H.E.B Food Stores 14,600
USAA 14,300
AT&T 6,500
Southwest Research Institute 3,000
Valero Energy 3,000
Cardell Kitchen & Bath Cabinetry 2,500
Frost National Bank 2,000
Toyota Motor MFG, Texas 2,000
Kinetic Concepts, Inc. 1,800
REDLAND TRAILS SHOPPING CENTERSAN ANTONIO, TX
This information has been secured from sources we believe to be reliable, but we make no representations or warranties, expressed orimplied, as to the accuracy of the information. References to square footage or age are approximate. Buyer must verify theinformation and bears all risk for any inaccuracies. Marcus & Millichap Real Estate Investment Services is a service mark of Marcus& Millichap Real Estate Investment Services, Inc. © 2011 Marcus & Millichap R0490011
MA
RKET OVERVIEW
31
San Antonio

DEMOGRAPHICS
San Antonio’s population will continue to record
sizable gains over the next several years. In absolute
numbers, the MSA over the next five years will see the
addition of over 200,000 residents through a
combination of migration and natural increases.
During the forecast period, San Antonio is expected to
net an average of 22,000 residents per year through
migration. The city of San Antonio will continue to
experience the greatest total increase, while New
Braunfels will be the leader in percentage growth.
Area residents are relatively young with a median age
of 33.5 years. This is due, in large part, to the area's
strong military presence, as well as, its large student
population attracted to the metro's higher education
institutions. Over the next 5 years, households are
expected to increase 2.3 percent annually while the
local population will increase 2 percent per year.
Median household income in the San Antonio MSA is
$47,500, compared to $51,000 nationally. Additionally,
household incomes are forecast to average an annual
growth of 2 percent through 2012, illustrating healthy
growth which will support consumer expenditures in
San Antonio.
REDLAND TRAILS SHOPPING CENTERSAN ANTONIO, TX
This information has been secured from sources we believe to be reliable, but we make no representations or warranties, expressed orimplied, as to the accuracy of the information. References to square footage or age are approximate. Buyer must verify theinformation and bears all risk for any inaccuracies. Marcus & Millichap Real Estate Investment Services is a service mark of Marcus& Millichap Real Estate Investment Services, Inc. © 2011 Marcus & Millichap R0490011
MA
RKET OVERVIEW
32
San Antonio

REDLAND TRAILS SHOPPING CENTERSAN ANTONIO, TX
QUALITY OF LIFE
With over 300 days of sunshine annually and anaverage temperature of 68.8 degrees, San Antonio’smild climate makes it easy to enjoy the numerousoutdoor activities available in the region, whichinclude golf at over 50 courses and spending time inone of several city-owned parks, such as BreckenridgePark (343 acres) or Friedrich Wilderness Park (232acres).Hispanic culture and history abounds in such places asLa Villita, the Spanish Governor’s Palace, SanFernando Cathedral, Jose Antonio Navarro StateHistorical Park and Mission San Antonio de Valero,more commonly known as The Alamo. Traditionblends with more modern attractions such as the Paseodel Rio, better known as the River Walk. This urbanoasis stretches 2.5 miles, providing secluded areas aswell as cafes, nightclubs and hotels.Locals and tourists alike enjoy the theme parks in SanAntonio, which include SeaWorld San Antonio, theworld’s largest marine life park, and Six Flags FiestaTexas. In addition, the city is home to numeroussporting events. Local teams include the NBA's SanAntonio Spurs, WNBA's San Antonio Silver Stars andthe Missions, a AA baseball team.Artistic appreciation abounds in San Antonio’smuseums and cultural centers. McNay Art Museumand the San Antonio Museum of Art display a widevariety of works.Nearby Texas Hill Country provides a limitless arrayof outdoor opportunities including hunting, fishing,horseback riding, canoeing, tubing, rafting, waterskiing and sailing.The broad mix of recreational activities, together witha low cost of living and consistent job growth, willcontinue to attract residents to the San Antonio metroarea.
This information has been secured from sources we believe to be reliable, but we make no representations or warranties, expressed orimplied, as to the accuracy of the information. References to square footage or age are approximate. Buyer must verify theinformation and bears all risk for any inaccuracies. Marcus & Millichap Real Estate Investment Services is a service mark of Marcus& Millichap Real Estate Investment Services, Inc. © 2011 Marcus & Millichap R0490011
MA
RKET OVERVIEW
33
San Antonio

REDLAND TRAILS SHOPPING CENTERSAN ANTONIO, TX
This information has been secured from sources we believe to be reliable, but we make no representations or warranties, expressed orimplied, as to the accuracy of the information. References to square footage or age are approximate. Buyer must verify theinformation and bears all risk for any inaccuracies. Marcus & Millichap Real Estate Investment Services is a service mark of Marcus& Millichap Real Estate Investment Services, Inc. © 2011 Marcus & Millichap R0490011
MA
RKET OVERVIEW
34
San AntonioSLOWDOWN OF THE RETAIL BUILDING BOOM IN SIGHT
The Alamo City remains a hotbed for construction, as national retailers are banking on the healthy long-termprospects of the metro. As a result, near-term fundamentals will be mixed, with vacancy expected to exceed 15percent by year end as several major projects come online without sufficient leasing commitments. AlamoRanch, for example, was expected to come online in the third quarter only 80 percent pre-leased, despitehaving half of its space dedicated to national big-box chains. The San Antonio metro has one of the healthiestdemographic and economic outlooks in the nation, however, which will support retail sales. In addition, theplanning pipeline is thinning, which should help vacancy rates firm beginning in the first half of 2009.Nonetheless, owners of older centers in high-development areas will have to extend significant leasingincentives during the next six months to maintain tenancies.The outlook for the local retail investment market remains bright, though turmoil in the national credit marketwill hamper deal flow in the coming months. Regional buyers with cash are expected to be a strong presencein the metro, focusing on the relative safety of single-tenant assets, which have been trading at cap rates in thelow-7 percent range during the past year. Multi-tenant sales velocity has been restrained by the wideexpectations gap and heightened risk from oversupply. Initial yields, currently in the mid- to high-7 percentrange, should push higher as distressed owners readjust their return prospects. This, in turn, could lure somebuyers with a penchant for improving operations to the market. Investors with a long-term horizon,meanwhile, may want to acquire properties that are marketed at a discount in the path of residential growth.Turnkey assets will attract the most competitive bids, but listings remain rare due to limited reinvestmentopportunities.

REDLAND TRAILS SHOPPING CENTERSAN ANTONIO, TX
This information has been secured from sources we believe to be reliable, but we make no representations or warranties, expressed orimplied, as to the accuracy of the information. References to square footage or age are approximate. Buyer must verify theinformation and bears all risk for any inaccuracies. Marcus & Millichap Real Estate Investment Services is a service mark of Marcus& Millichap Real Estate Investment Services, Inc. © 2011 Marcus & Millichap R0490011
MA
RKET OVERVIEW
ECONOMY
• Employers have added 19,500 positions during the past 12 months, expanding payrolls 2.3 percent. Year todate, however, only 6,000 jobs have been generated in San Antonio.
• In response to the rapidly growing population, employers in the educational and health services sectorhave created 4,700 spots year over year in the second quarter, a 4.1 percent increase. An additional 3,600new hires were made in the trade, transportation and utilities sector.
• Although Toyota plans to keep all 2,000 positions at its Tundra plant in southern San Antonio, a recentannouncement indicated that 200 temporary employees might be let go in the third quarter.Approximately 4,000 ancillary jobs in the area could be in jeopardy while the plant is offline. A return tofull production is anticipated in the first quarter of 2009.
• Outlook: Following the addition of 19,200 positions last year, job growth in San Antonio will slow to 8,200new hires in 2008, a 1 percent increase to payrolls. Nevertheless, the local employment market willcontinue to be one of the strongest in the country.
35
San Antonio
CONSTRUCTION
• Development has been robust in the metro over the past 12 months, as 5 million square feet of retail spacehas come online, a 6.4 percent expansion of existing stock. Only 1.2 million square feet was delivered inthe first half of the year, however, indicating a modest slowing.
• The amount of construction under way has more than doubled during the last year to 3 million squarefeet. The size of the planning pipeline, on the other hand, has decreased 38 percent to 4.6 million squarefeet.
• A new Lowe's is planned for the Alamo Ranch project in northwestern San Antonio. Completion of thestore would add 175 jobs to the area and push the amount of retail space in Alamo Ranch to almost 1million square feet.
• Outlook: For the year, developers are expected to bring 3.7 million square feet of retail space to the market,down from 4 million square feet in 2007.

REDLAND TRAILS SHOPPING CENTERSAN ANTONIO, TX
This information has been secured from sources we believe to be reliable, but we make no representations or warranties, expressed orimplied, as to the accuracy of the information. References to square footage or age are approximate. Buyer must verify theinformation and bears all risk for any inaccuracies. Marcus & Millichap Real Estate Investment Services is a service mark of Marcus& Millichap Real Estate Investment Services, Inc. © 2011 Marcus & Millichap R0490011
MA
RKET OVERVIEW
36
VACANCY
• Metrowide vacancy has climbed 270 basis points over the past 12 months to 14.3 percent, the highest ratein over a decade. As construction activity cooled during the first six months of 2008, vacancy rose 100 basispoints.
• Neighborhood/community centers have fared better than the overall metro with regards to vacancy. Theaverage rate in this property type inched up just 40 basis points year over year in the second quarter to10.6 percent.
• In the South submarket, where development activity has been limited, vacancy has increased 100 basispoints in the last year to 11.6 percent, the lowest rate in the metro.
• Outlook: Although development is starting to subside, vacancy is expected to climb during the second halfof the year to 15.1 percent, 190 basis points higher than the rate at year-end 2007.
RENTS
• Asking rents reached $14.97 per square foot in the second quarter, a 2.4 percent increase from one yearearlier. Effective rents climbed 2.5 percent to $13.39 per square foot as owners reduced the rate ofconcession burn.
• In the Northwest San Antonio submarket, where much of the new development is coming online, askingrents have advanced 3.4 percent over the past year to $13.31 per square foot, while effective rents havejumped 4 percent to $11.95 per square foot as owners eased leasing incentives.
• The recent spike in vacancy has led to a 0.5 percent year-over-year reduction in metrowide revenues.During the previous 12-month period, the average revenue gained 3.1 percent.
• Outlook: As vacancy rises, rent growth will slow, though concessions are not expected to widen. Askingrents are forecast to finish 2008 at $15.10 per square foot, while effective rents reach $13.46 per square foot,both gains of 1.8 percent from last year.
San Antonio

REDLAND TRAILS SHOPPING CENTERSAN ANTONIO, TX
SINGLE-TENANT SALES TRENDS**
• Transaction velocity in the single-tenant sector climbed 14 percent during the most recent 12-month periodas investors followed a flight-to-safety trend. Buyer interest in restaurants jumped 78 percent in that time.
• Restaurants have traded at a median price of $233 per square foot over the past year, a 64 percent increasefrom the previous period, when several owner-user deals took place.
• Average cap rates for single-tenant deals have hovered in the low-7 percent range during the last 12months, down 60 basis points from the preceding year. The decline can be attributed to an increasednumber of deals involving properties with national-credit tenants.
• Outlook: While regional and out-of-state buyers will continue to target single-tenant properties withestablished tenants, local investors may find attractive sale-leaseback opportunities.
This information has been secured from sources we believe to be reliable, but we make no representations or warranties, expressed orimplied, as to the accuracy of the information. References to square footage or age are approximate. Buyer must verify theinformation and bears all risk for any inaccuracies. Marcus & Millichap Real Estate Investment Services is a service mark of Marcus& Millichap Real Estate Investment Services, Inc. © 2011 Marcus & Millichap R0490011
MA
RKET OVERVIEW
MULTI-TENANT SALES TRENDS**
• Multi-tenant sales velocity has declined 57 percent year over year, as buyers have shied away from therelatively volatile assets during the building boom and economic cooling.
• The median price for multi-tenant properties in San Antonio has fallen 9 percent to $106 per square foot inthe past year. Buyers have targeted much smaller properties with stable tenancies in established areas.
• During the most recent 12-month period, average cap rates were in the mid- to high-7 percent range formulti-tenant deals, up 50 basis points from the previous span, due to elevated risk from new supply.
• Outlook: Trading in the multi-tenant sector will remain slow through the end of the year as the threat ofnew construction keeps many potential buyers on the sidelines. Developers, meanwhile, will have to havenearly full leasing rosters to list new assets in the market.
37
** Data reflect a full 12-month period, calculated on a trailing 12-month basis by quarter.
San Antonio

REDLAND TRAILS SHOPPING CENTERSAN ANTONIO, TX
This information has been secured from sources we believe to be reliable, but we make no representations or warranties, expressed orimplied, as to the accuracy of the information. References to square footage or age are approximate. Buyer must verify theinformation and bears all risk for any inaccuracies. Marcus & Millichap Real Estate Investment Services is a service mark of Marcus& Millichap Real Estate Investment Services, Inc. © 2011 Marcus & Millichap R0490011
MA
RKET OVERVIEW
38
San AntonioCAPITAL MARKETS
• After aggressively cutting rates earlier this year to stimulate the economy, the Federal Reserve held the fedfunds rate steady at 2 percent during its August meeting. The headline rate of inflation increased by 1.1percent in June, the second-largest monthly gain in more than 25 years, while elevated energy also beganto bleed into the cost of core goods.
• While inflation remains a primary concern, the Fed is betting that persistent job cuts, the weak economyand declining commodity prices will keep wage pressures low and inflation in check in the months ahead.
• Lenders remain cautious and conduits are largely staying on the sidelines. Spreads for retail properties arecurrently 265 to 300 basis points over the 10-year Treasury with maximum leverage at approximately 75percent. Lenders continue to pay particular attention to the type of retailer and tenants' credit qualitywhen quoting terms.
• The yield on the 10-year Treasury rose to 4.2 percent early this summer but has since dropped below 4percent. Through the rest of this year, the yield on the 10-year Treasury is expected to remain in the high-3percent to mid-4 percent range.
SUBMARKET OVERVIEW
• In August, the 950,000-square foot Alamo Ranch lifestyle center opened in the Northwest submarket,featuring several national big-box retailers. Although there are currently only 2,000 homes in the area, themaster-planned community will eventually include 14,000 residences, supporting local retail sales.
• The median household income in the Northeast submarket is $53,000 per year, 10 percent above the metromedian, which should facilitate retail sales. In addition, the area's population is expected to expand at a 1.3percent annual clip over the next five years, supporting local retailers.
• Buyers may want to target stabilized properties in the South submarket, which currently boasts the lowestvacancy rate in the metro. These favorable occupancy levels are due in part to the lack of supply-sidepressure; current rents do not justify a significant amount of new development, insulating owners fromcompetition.

Approved by the Texas Real Estate Commission for Voluntary UseTexas law requires all real estate licensees to give the following information
about brokerage services to prospective buyers, tenants, sellers and landlords.
Information About Brokerage ServicesBefore working with a real estate broker, you should know that the duties of a broker depend on whom the broker represents. If you are a prospective seller or landlord (owner) or a prospective buyer or tenant (buyer), you should know that the broker who lists the property for sale or lease is the owner’s agent. A broker who acts as a subagent represents the owner in cooperation with the listing broker. A broker who acts as a buyer’s agent represents the buyer. A broker may act as an intermediary between the parties if the parties consent in writing. A broker can assist you in locating a property, preparing a contract or lease, or obtaining financing without representing you. A broker is obligated by law to treat you honestly.
IF THE BROKER REPRESENTS THE OWNER:The broker becomes the owner’s agent by entering into an agreement with the owner, usually through a written - listing agreement, or by agreeing to act as a subagent by accepting an offer of subagency from the listing broker. A subagent may work in a different real estate office. A listing broker or subagent can assist the buyer but does not represent the buyer and must place the interests of the owner first. The buyer should not tell the owner’s agent anything the buyer would not want the owner to know because an owner’s agent must disclose to the owner any material information known to the agent.
IF THE BROKER REPRESENTS THE BUYER:The broker becomes the buyer’s agent by entering into an agreement to represent the buyer, usually through a written buyer representation agreement. A buyer’s agent can assist the owner but does not represent the owner and must place the interests of the buyer first. The owner should not tell a buyer’s agent anything the owner would not want the buyer to know because a buyer’s agent must disclose to the buyer any material information known to the agent.
IF THE BROKER ACTS AS AN INTERMEDIARY:A broker may act as an intermediary between the parties if the broker complies with The Texas Real Estate License
Act. The broker must obtain the written consent of each party to the transaction to act as an intermediary. The written consent must state who will pay the broker and, in conspicuous bold or underlined print, set forth the broker’s obligations as anintermediary. The broker is required to treat each party honestly and fairly and to comply with The Texas Real Estate License Act. A broker who acts as an intermediary in a transaction:(1) shall treat all parties honestly;(2) may not disclose that the owner will accept a price less than the asking price unless authorized inwriting to do so by the owner;(3) may not disclose that the buyer will pay a price greater than the price submitted in a written offer unless authorized in writing to do so by the buyer; and(4) may not disclose any confidential information or any information that a party specifically instructs the broker in writing not to disclose unless authorized in writing to disclose the information or required to do so by The Texas Real Estate License Act or a court order or if the information materially relates to the condition of the property. With the parties’ consent, a broker acting as an intermediary between the parties may appoint a person who is licensed under The Texas Real Estate License Act and associated with the broker to communicate with and carry out instructions of one party and another person who is licensed under that Act and associated with the broker to communicate with and carry out instructions of the other party.
If you choose to have a broker represent you,you should enter into a written agreement with the broker that clearly establishes the broker’s obligations and your obligations. The agreement should state how and by whom the broker will be paid. You have the right to choose the type of representation, if any, you wish to receive. Your payment of a fee to a broker does not necessarily establish that the broker represents you. If youhave any questions regarding the duties and responsibilities of the broker, you should resolve thosequestions before proceeding.
Real estate licensee asks that you acknowledge receipt of this information about brokerage services for the licensee’s records.
REDLAND TRAILS SHOPPING CENTERSAN ANTONIO, TX
This information has been secured from sources we believe to be reliable, but we make no representations or warranties, expressed orimplied, as to the accuracy of the information. References to square footage or age are approximate. Buyer must verify theinformation and bears all risk for any inaccuracies. Marcus & Millichap Real Estate Investment Services is a service mark of Marcus& Millichap Real Estate Investment Services, Inc. © 2011 Marcus & Millichap R0490011
CLOSIN
G PA
GE
Buyer, Seller, Landlord or Tenant Date
39
Brokerage Services
Texas Real Estate Brokers and Salespersons are licensed and regulated by the Texas Real Estate Commission (TREC). If you have a complaint regarding a real estate licensee, you should contact TREC at P.O. Box 12188, Austin, Texas 78711-2188 or 512-465-3960.

OFFERING MEMORANDUM
SAN ANTONIO, TX
Offices Nationwidewww.MarcusMillichap.com
REDLAND TRAILS SHOPPINGCENTER
Exclusively Listed By:Exclusively Listed By:Exclusively Listed By:Exclusively Listed By:
Chad J. KnibbeChad J. KnibbeChad J. KnibbeChad J. KnibbeAssociate Vice President InvestmentsAssociate Vice President InvestmentsAssociate Vice President InvestmentsAssociate Vice President Investments
San Antonio OfficeSan Antonio OfficeSan Antonio OfficeSan Antonio OfficeTel: (210) 343-7800Tel: (210) 343-7800Tel: (210) 343-7800Tel: (210) 343-7800Fax: (210) 343-7810Fax: (210) 343-7810Fax: (210) 343-7810Fax: (210) 343-7810
[email protected]@[email protected]@marcusmillichap.comwww.marcusmillichap.com/ChadKnibbewww.marcusmillichap.com/ChadKnibbewww.marcusmillichap.com/ChadKnibbewww.marcusmillichap.com/ChadKnibbe
License: TX: 0497303License: TX: 0497303License: TX: 0497303License: TX: 0497303