reduce excess sludge by over 50 percent with ozone sludge by over 50... · · 2008-08-25¾sludge...
TRANSCRIPT
Copyright © 2001, Praxair Technology, Inc. All rights reserved.
Reduce Excess Sludge By Over 50 Percent with OzoneReduce Excess Sludge By Over 50 Percent with Ozone
Malcolm Fabiyi, PhD., Richard Novak, PE., Randall B. Marx, PhD PE
Praxair R&D 2008
© Praxair, Inc. 2008
2Copyright 2008 © Praxair Technology, Inc. All Rights Reserved.
Agenda
Overview
The challenge of excess sludge generation
Sludge ozonation
Prior approaches vs. Praxair approach
Case Study
Conclusions
3Copyright 2008 © Praxair Technology, Inc. All Rights Reserved.
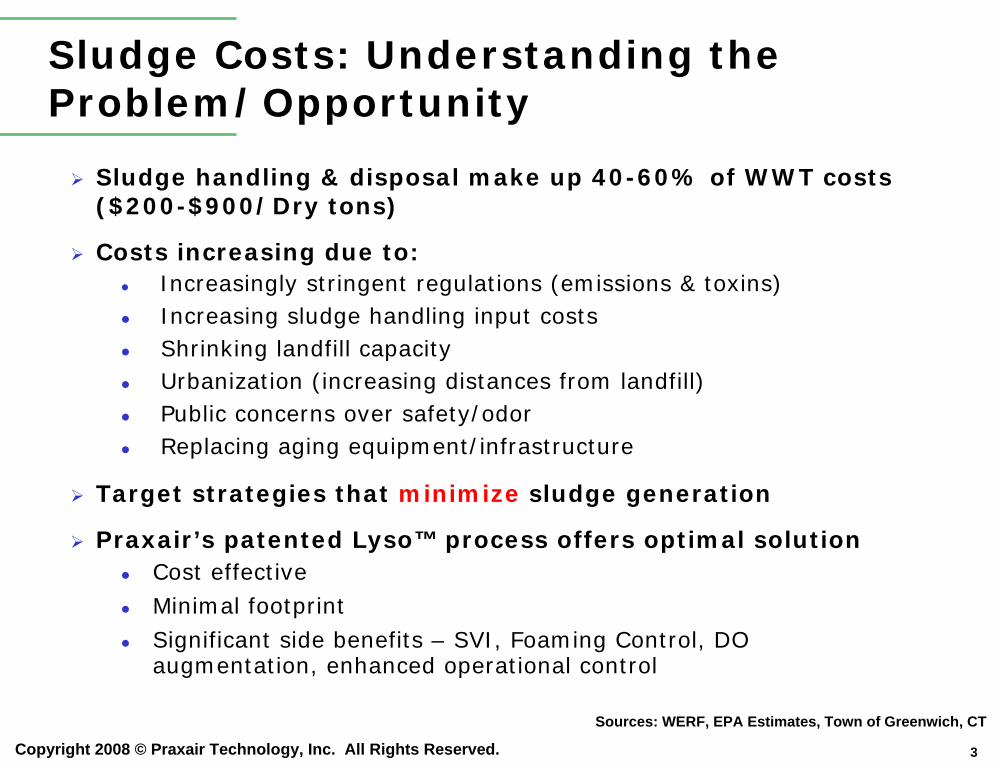
Sludge Costs: Understanding the Problem/Opportunity
Sludge handling & disposal make up 40-60% of WWT costs ($200-$900/Dry tons)
Costs increasing due to:Increasingly stringent regulations (emissions & toxins)Increasing sludge handling input costsShrinking landfill capacityUrbanization (increasing distances from landfill)Public concerns over safety/odorReplacing aging equipment/infrastructure
Target strategies that minimize sludge generation
Praxair’s patented Lyso™ process offers optimal solutionCost effectiveMinimal footprintSignificant side benefits – SVI, Foaming Control, DO augmentation, enhanced operational control
Sources: WERF, EPA Estimates, Town of Greenwich, CT
4Copyright 2008 © Praxair Technology, Inc. All Rights Reserved.
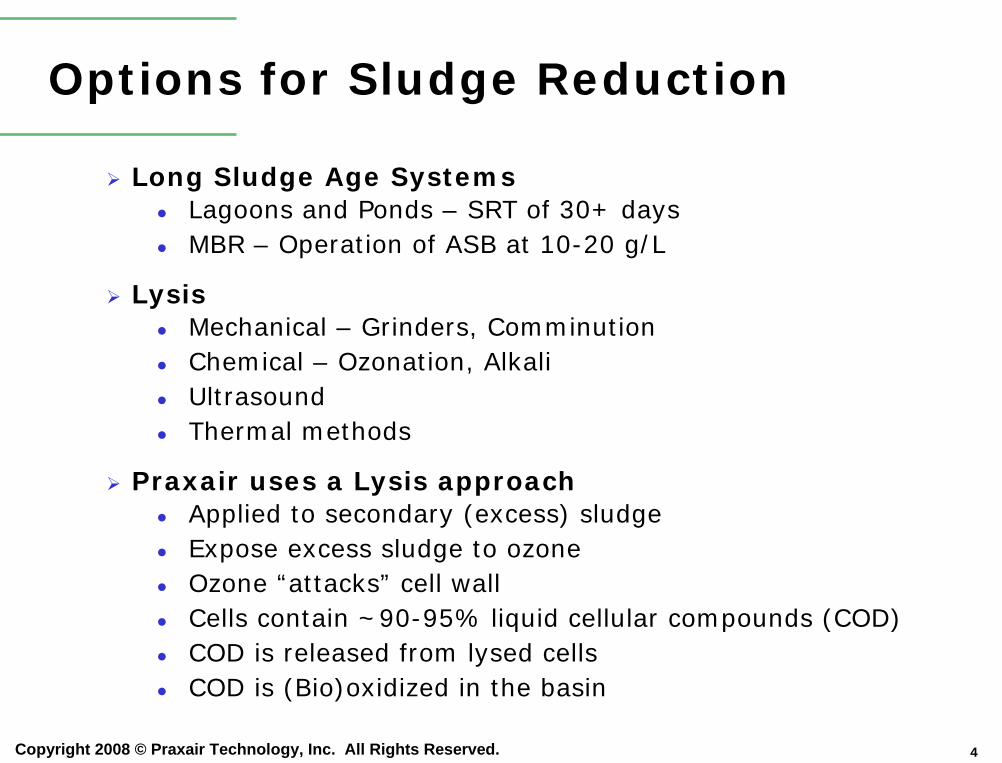
Options for Sludge Reduction
Long Sludge Age SystemsLagoons and Ponds – SRT of 30+ daysMBR – Operation of ASB at 10-20 g/L
LysisMechanical – Grinders, ComminutionChemical – Ozonation, AlkaliUltrasoundThermal methods
Praxair uses a Lysis approachApplied to secondary (excess) sludgeExpose excess sludge to ozoneOzone “attacks” cell wallCells contain ~90-95% liquid cellular compounds (COD)COD is released from lysed cellsCOD is (Bio)oxidized in the basin
5Copyright 2008 © Praxair Technology, Inc. All Rights Reserved.
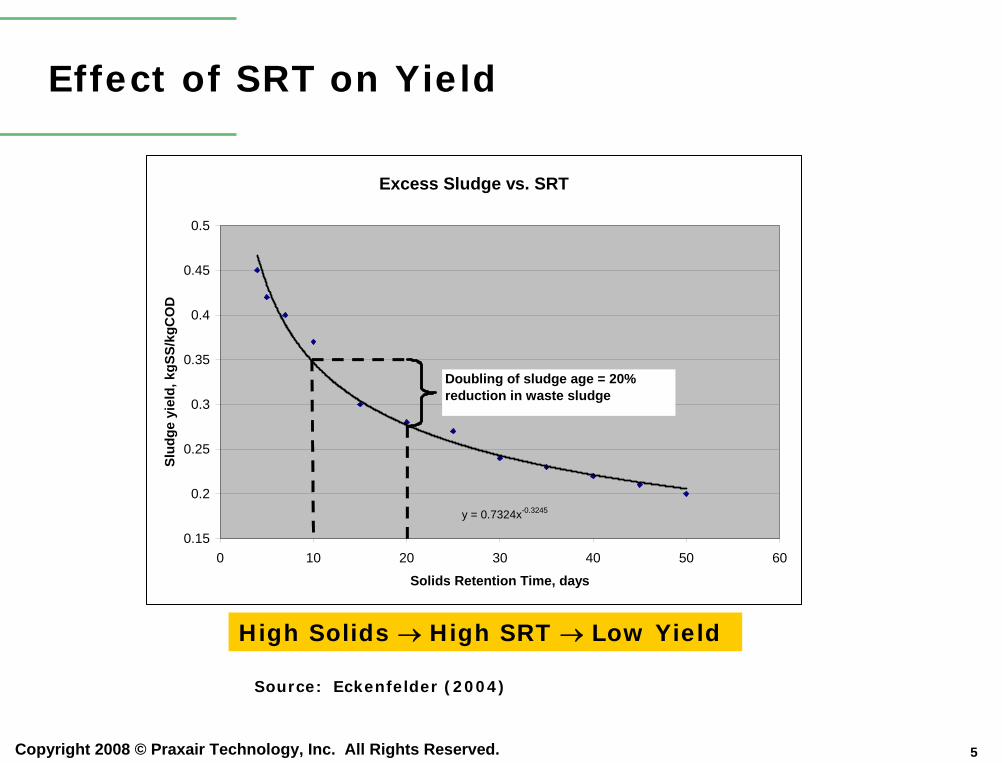
Effect of SRT on Yield
Excess Sludge vs. SRT
y = 0.7324x-0.3245
0.15
0.2
0.25
0.3
0.35
0.4
0.45
0.5
0 10 20 30 40 50 60
Solids Retention Time, days
Slud
ge y
ield
, kgS
S/kg
CO
D
Doubling of sludge age = 20% reduction in waste sludge
High Solids → High SRT → Low Yield
Source: Eckenfelder (2004)
6Copyright 2008 © Praxair Technology, Inc. All Rights Reserved.
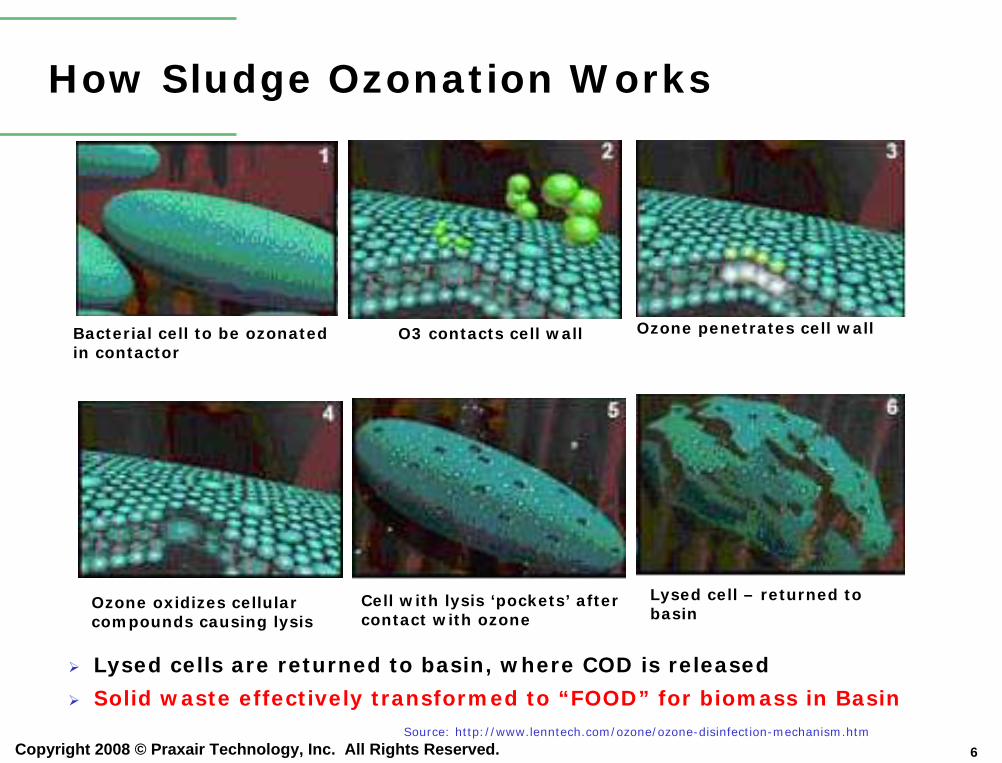
How Sludge Ozonation Works
Ozone penetrates cell wallBacterial cell to be ozonated in contactor
O3 contacts cell wall
Lysed cell – returned to basin
Cell with lysis ‘pockets’ after contact with ozone
Ozone oxidizes cellular compounds causing lysis
Lysed cells are returned to basin, where COD is released
Solid waste effectively transformed to “FOOD” for biomass in BasinSource: http://www.lenntech.com/ozone/ozone-disinfection-mechanism.htm
7Copyright 2008 © Praxair Technology, Inc. All Rights Reserved.
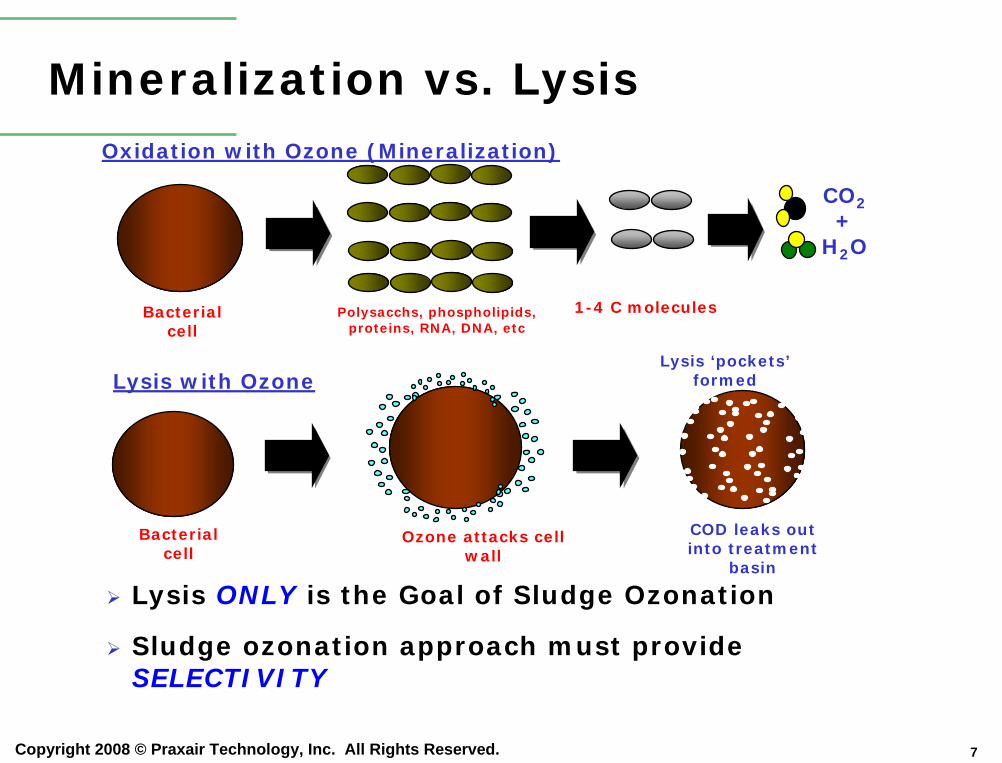
Mineralization vs. LysisOxidation with Ozone (Mineralization)
CO2+
H2O
Lysis ONLY is the Goal of Sludge Ozonation
Sludge ozonation approach must provide SELECTIVITY
Lysis with Ozone
1-4 C moleculesBacterial cell
Polysacchs, phospholipids, proteins, RNA, DNA, etc
Lysis ‘pockets’formed
COD leaks out into treatment
basin
Bacterial cell
Ozone attacks cell wall
8Copyright 2008 © Praxair Technology, Inc. All Rights Reserved.
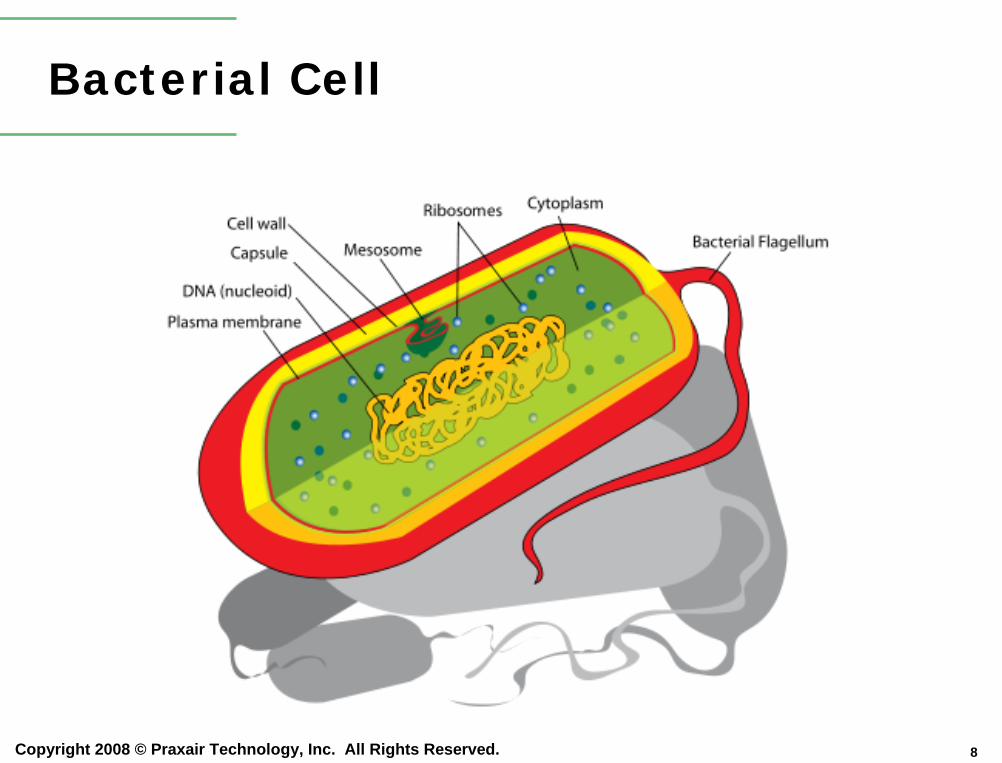
Bacterial Cell
9Copyright 2008 © Praxair Technology, Inc. All Rights Reserved.
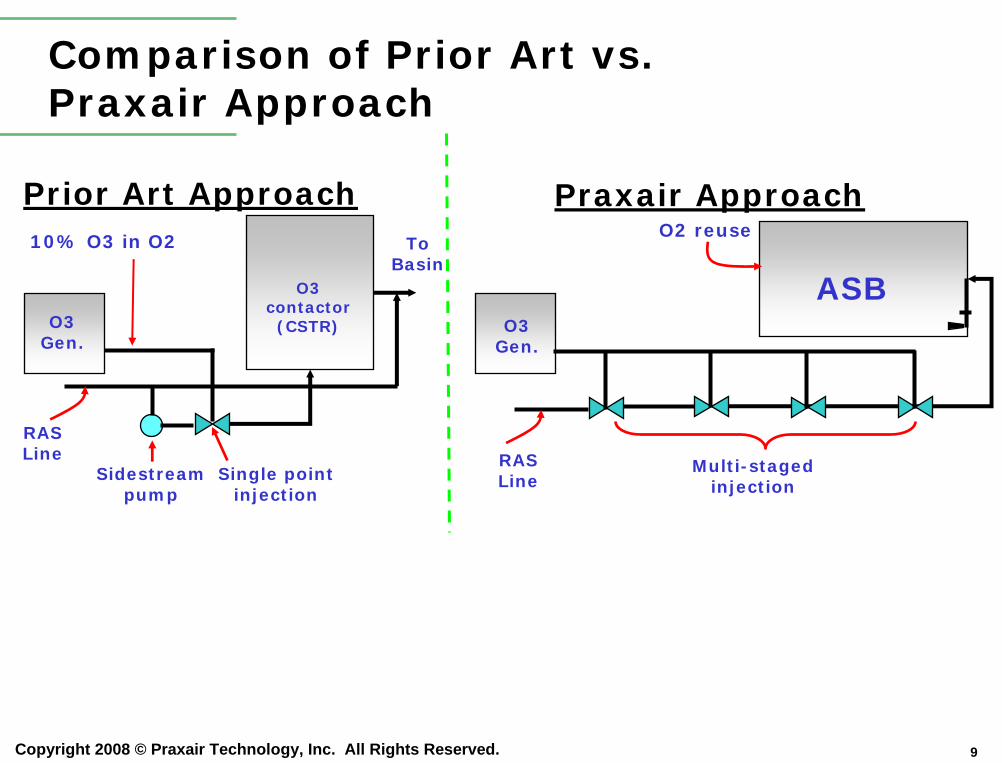
Comparison of Prior Art vs. Praxair Approach
Prior Art Approach Praxair Approach
ASBO3
Gen.
O3 contactor(CSTR)O3
Gen.
RAS Line
Sidestream pump
O2 reuse 10% O3 in O2
Single point injection
To Basin
RAS Line
Multi-staged injection
10Copyright 2008 © Praxair Technology, Inc. All Rights Reserved.
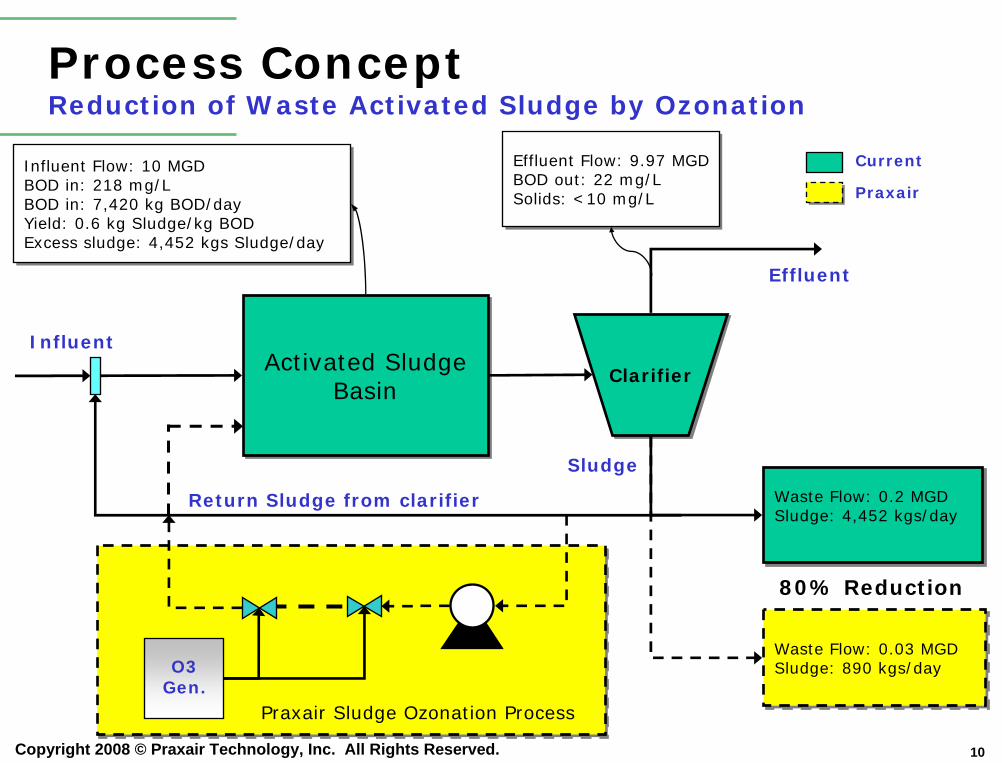
Process ConceptReduction of Waste Activated Sludge by Ozonation
Activated SludgeBasin
Activated SludgeBasin ClarifierClarifier
Waste Flow: 0.03 MGDSludge: 890 kgs/dayWaste Flow: 0.03 MGDSludge: 890 kgs/day
Waste Flow: 0.2 MGDSludge: 4,452 kgs/dayWaste Flow: 0.2 MGDSludge: 4,452 kgs/day
Influent Flow: 10 MGD BOD in: 218 mg/LBOD in: 7,420 kg BOD/dayYield: 0.6 kg Sludge/kg BODExcess sludge: 4,452 kgs Sludge/day
Influent Flow: 10 MGD BOD in: 218 mg/LBOD in: 7,420 kg BOD/dayYield: 0.6 kg Sludge/kg BODExcess sludge: 4,452 kgs Sludge/day
Effluent Flow: 9.97 MGDBOD out: 22 mg/LSolids: <10 mg/L
Effluent Flow: 9.97 MGDBOD out: 22 mg/LSolids: <10 mg/L
O3 Gen.
Praxair Sludge Ozonation Process
Return Sludge from clarifier
Current
Praxair
Effluent
Sludge
Influent
80% Reduction
11Copyright 2008 © Praxair Technology, Inc. All Rights Reserved.
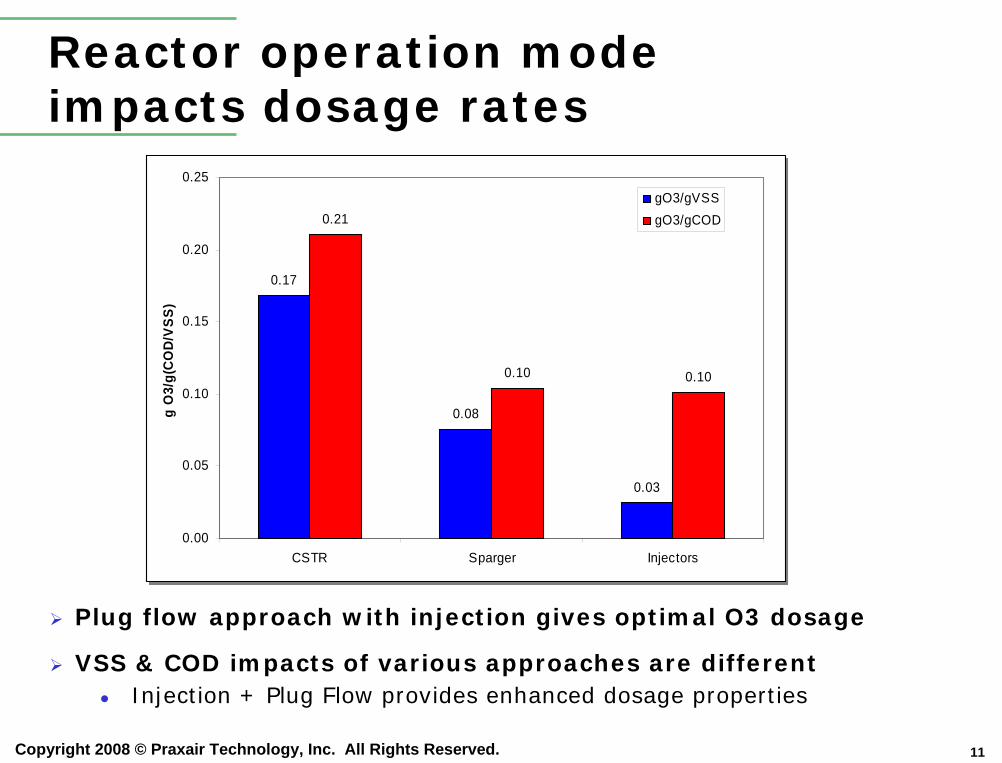
Reactor operation mode impacts dosage rates
0.17
0.08
0.03
0.21
0.10 0.10
0.00
0.05
0.10
0.15
0.20
0.25
CSTR Sparger Injectors
g O
3/g(
CO
D/V
SS)
gO3/gVSSgO3/gCOD
0.17
0.08
0.03
0.21
0.10 0.10
0.00
0.05
0.10
0.15
0.20
0.25
CSTR Sparger Injectors
g O
3/g(
CO
D/V
SS)
gO3/gVSSgO3/gCOD
Plug flow approach with injection gives optimal O3 dosage
VSS & COD impacts of various approaches are differentInjection + Plug Flow provides enhanced dosage properties
12Copyright 2008 © Praxair Technology, Inc. All Rights Reserved.
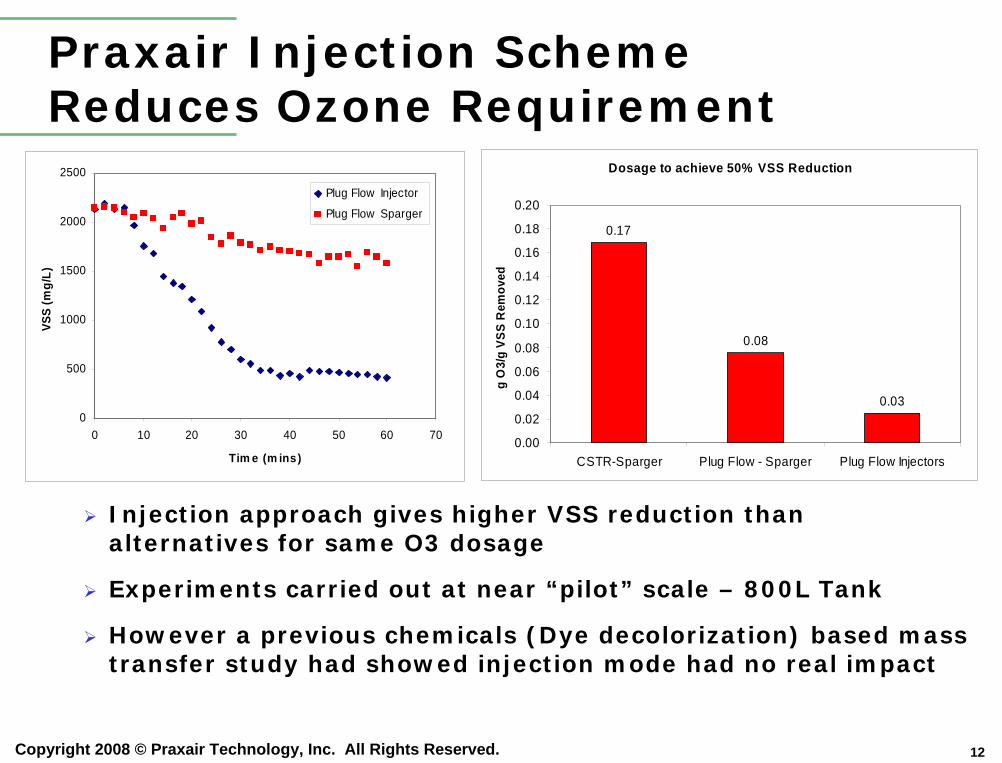
Praxair Injection Scheme Reduces Ozone Requirement
Injection approach gives higher VSS reduction than alternatives for same O3 dosage
Experiments carried out at near “pilot” scale – 800L Tank
However a previous chemicals (Dye decolorization) based mass transfer study had showed injection mode had no real impact
Dosage to achieve 50% VSS Reduction
0.17
0.08
0.03
0.00
0.02
0.04
0.06
0.08
0.10
0.12
0.14
0.16
0.18
0.20
CSTR-Sparger Plug Flow - Sparger Plug Flow Injectors
g O
3/g
VSS
Rem
oved
0
500
1000
1500
2000
2500
0 10 20 30 40 50 60 70
Tim e (m ins)
VSS
(mg/
L)
Plug Flow Injector
Plug Flow Sparger
13Copyright 2008 © Praxair Technology, Inc. All Rights Reserved.
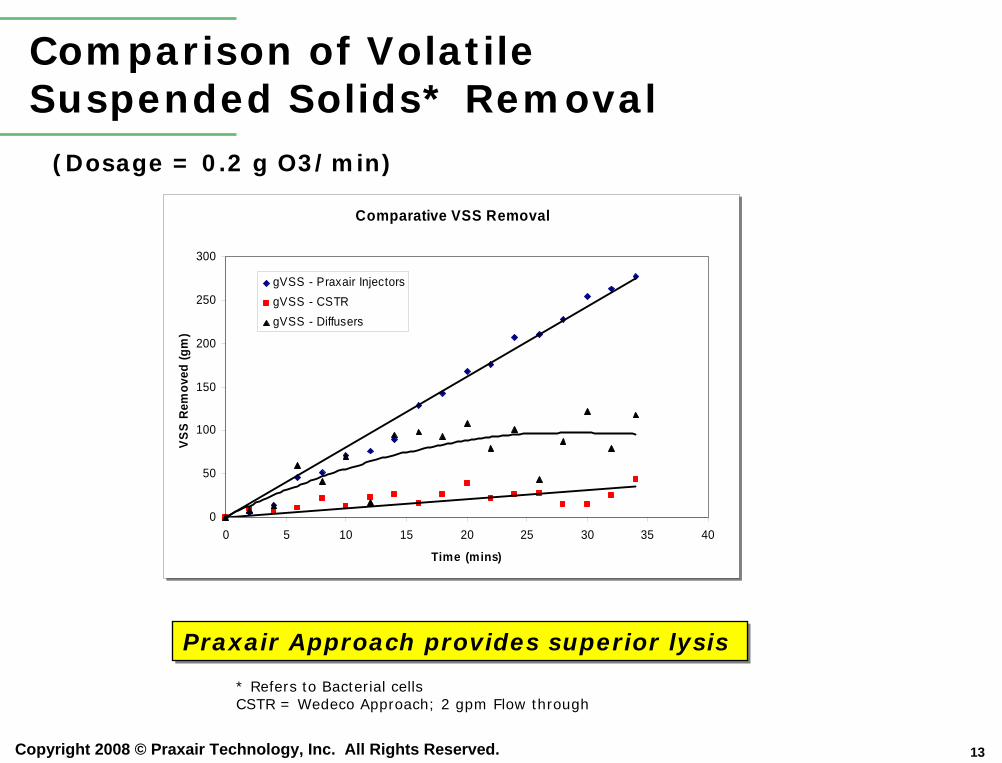
Comparison of Volatile Suspended Solids* Removal
(Dosage = 0.2 g O3/min)
Comparative VSS Removal
0
50
100
150
200
250
300
0 5 10 15 20 25 30 35 40
Time (mins)
VS
S R
emov
ed (g
m)
gVSS - Praxair InjectorsgVSS - CSTRgVSS - Diffusers
Comparative VSS Removal
0
50
100
150
200
250
300
0 5 10 15 20 25 30 35 40
Time (mins)
VS
S R
emov
ed (g
m)
gVSS - Praxair InjectorsgVSS - CSTRgVSS - Diffusers
Praxair Approach provides superior lysisPraxair Approach provides superior lysis
* Refers to Bacterial cellsCSTR = Wedeco Approach; 2 gpm Flow through
14Copyright 2008 © Praxair Technology, Inc. All Rights Reserved.
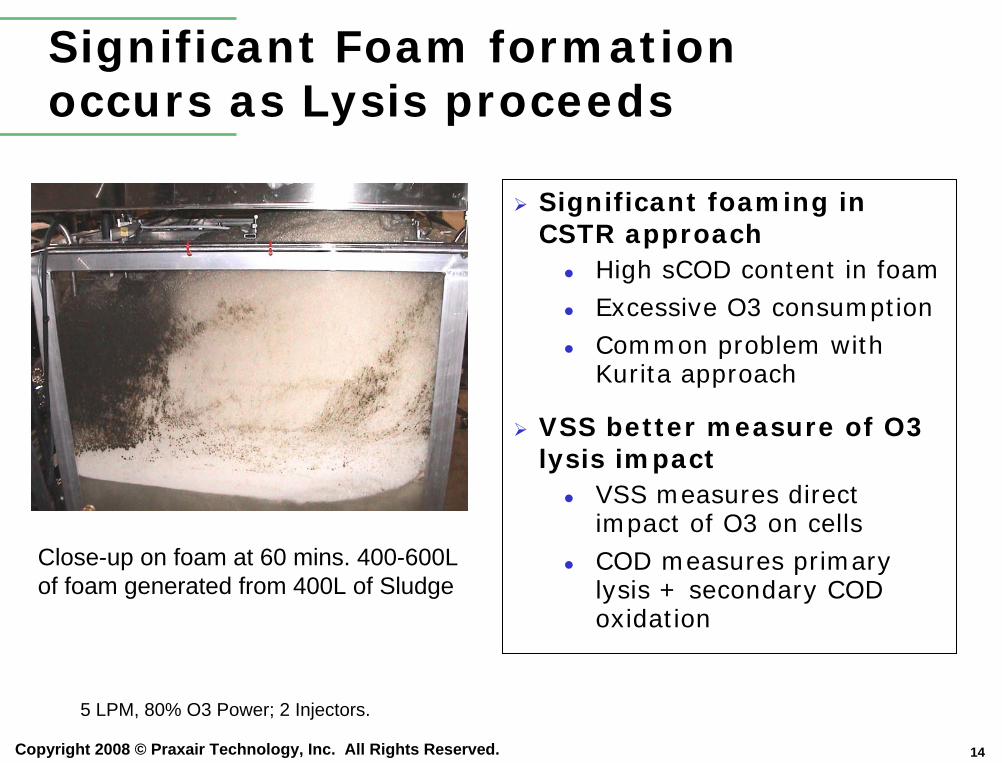
Significant Foam formation occurs as Lysis proceeds
Significant foaming in CSTR approach
High sCOD content in foamExcessive O3 consumptionCommon problem with Kurita approach
VSS better measure of O3 lysis impact
VSS measures direct impact of O3 on cellsCOD measures primary lysis + secondary COD oxidation
Close-up on foam at 60 mins. 400-600L of foam generated from 400L of Sludge
5 LPM, 80% O3 Power; 2 Injectors.
15Copyright 2008 © Praxair Technology, Inc. All Rights Reserved.
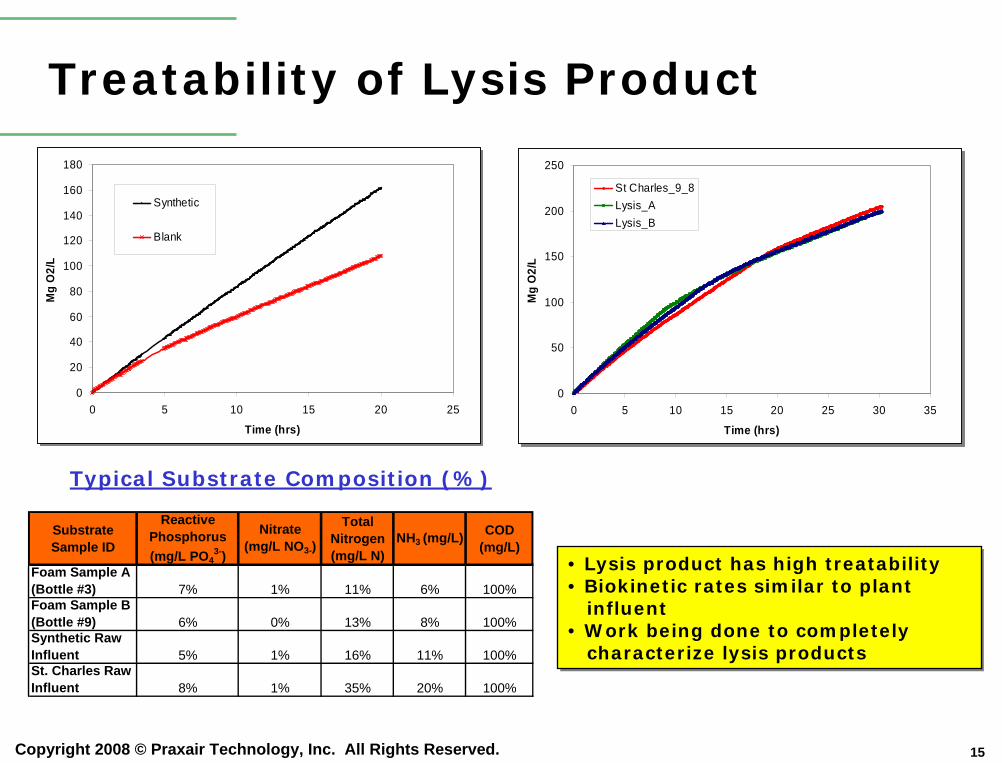
Treatability of Lysis Product
0
20
40
60
80
100
120
140
160
180
0 5 10 15 20 25
Time (hrs)
Mg
O2/
L
Synthetic
Blank
0
20
40
60
80
100
120
140
160
180
0 5 10 15 20 25
Time (hrs)
Mg
O2/
L
Synthetic
Blank
0
50
100
150
200
250
0 5 10 15 20 25 30 35
Time (hrs)
Mg
O2/
L
St Charles_9_8Lysis_ALysis_B
0
50
100
150
200
250
0 5 10 15 20 25 30 35
Time (hrs)
Mg
O2/
L
St Charles_9_8Lysis_ALysis_B
Typical Substrate Composition (%)
Substrate Sample ID
Reactive Phosphorus (mg/L PO4
3-)
Nitrate (mg/L NO3-)
Total Nitrogen (mg/L N)
NH3 (mg/L) COD (mg/L)
Foam Sample A (Bottle #3) 7% 1% 11% 6% 100%Foam Sample B (Bottle #9) 6% 0% 13% 8% 100%Synthetic Raw Influent 5% 1% 16% 11% 100%St. Charles Raw Influent 8% 1% 35% 20% 100%
• Lysis product has high treatability• Biokinetic rates similar to plant
influent• Work being done to completely
characterize lysis products
• Lysis product has high treatability• Biokinetic rates similar to plant
influent• Work being done to completely
characterize lysis products
16Copyright 2008 © Praxair Technology, Inc. All Rights Reserved.
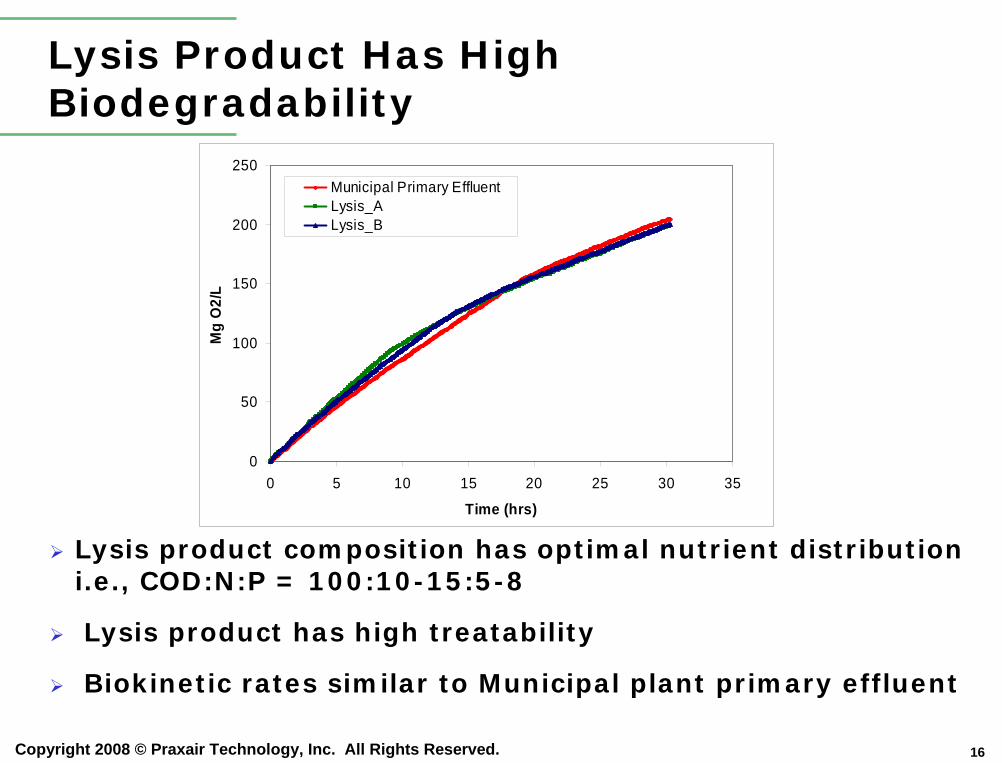
Lysis Product Has High Biodegradability
Lysis product composition has optimal nutrient distribution i.e., COD:N:P = 100:10-15:5-8
Lysis product has high treatability
Biokinetic rates similar to Municipal plant primary effluent
0
50
100
150
200
250
0 5 10 15 20 25 30 35
Time (hrs)
Mg
O2/
L
Municipal Primary EffluentLysis_ALysis_B
17Copyright 2008 © Praxair Technology, Inc. All Rights Reserved.
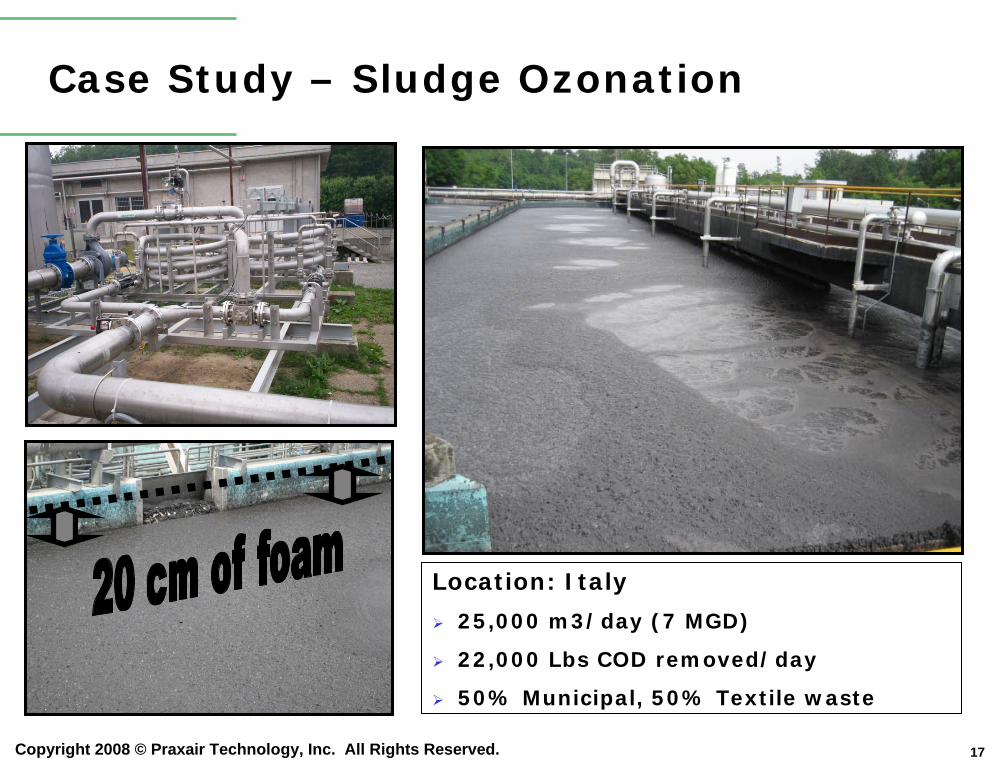
Case Study – Sludge Ozonation
Location: Italy
25,000 m3/day (7 MGD)
22,000 Lbs COD removed/day
50% Municipal, 50% Textile waste
18Copyright 2008 © Praxair Technology, Inc. All Rights Reserved.
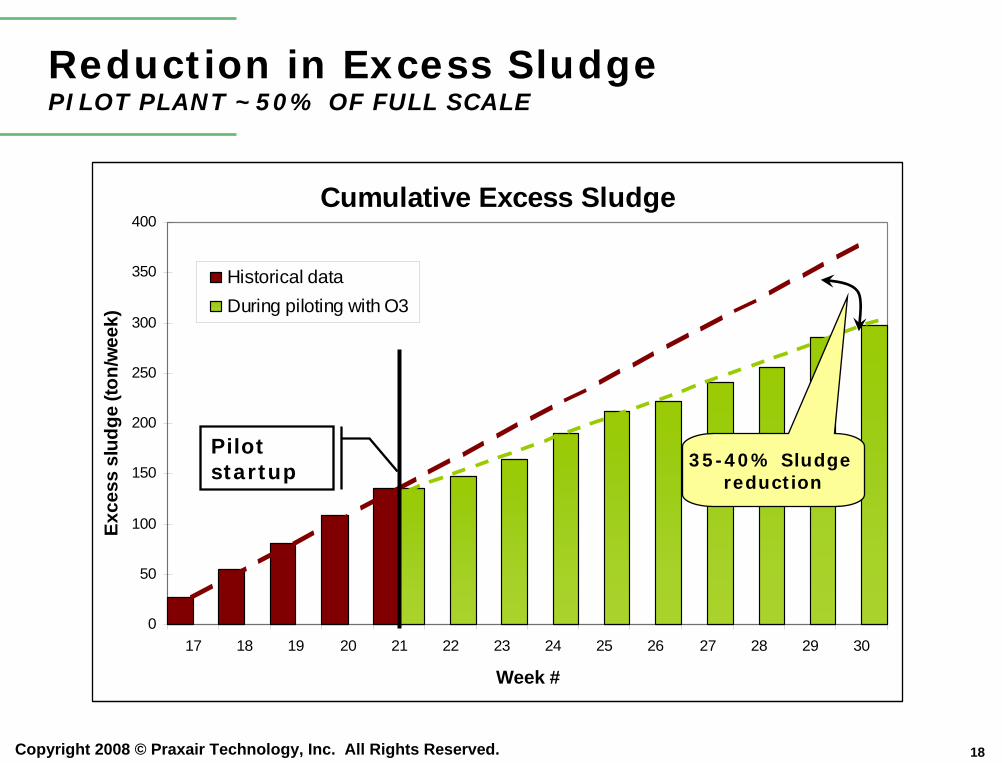
Reduction in Excess SludgePILOT PLANT ~50% OF FULL SCALE
Cumulative Excess Sludge
0
50
100
150
200
250
300
350
400
17 18 19 20 21 22 23 24 25 26 27 28 29 30
Week #
Exce
ss s
ludg
e (to
n/w
eek)
Historical dataDuring piloting with O3
35-40% Sludge reduction
Pilot startup
19Copyright 2008 © Praxair Technology, Inc. All Rights Reserved.
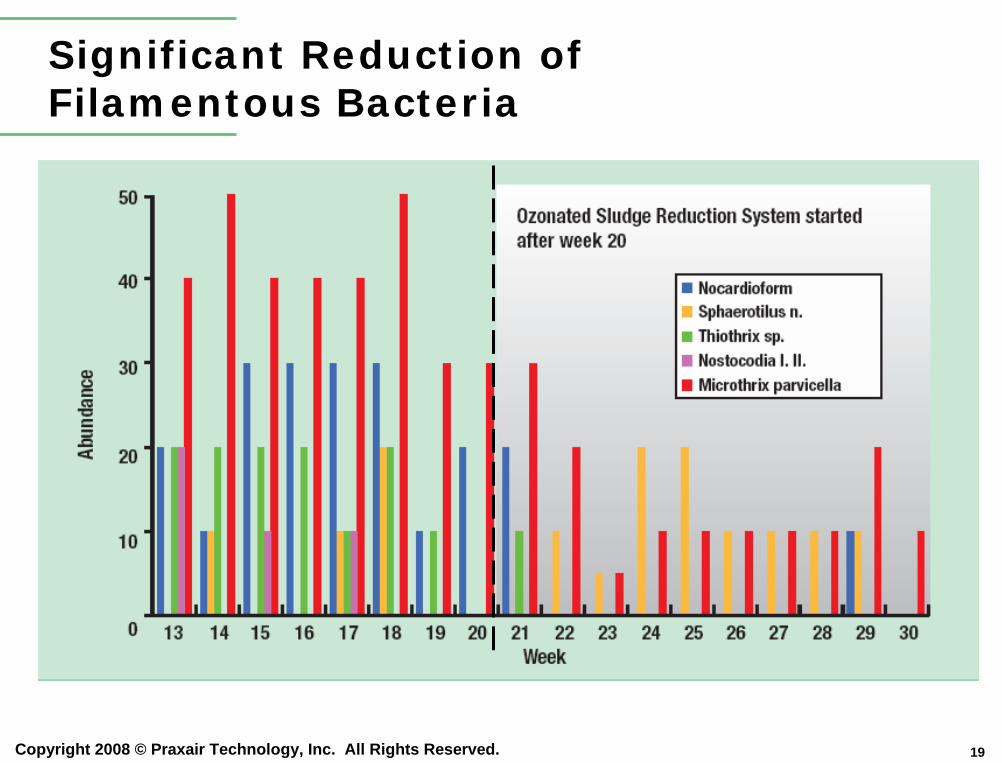
Significant Reduction of Filamentous Bacteria
20Copyright 2008 © Praxair Technology, Inc. All Rights Reserved.
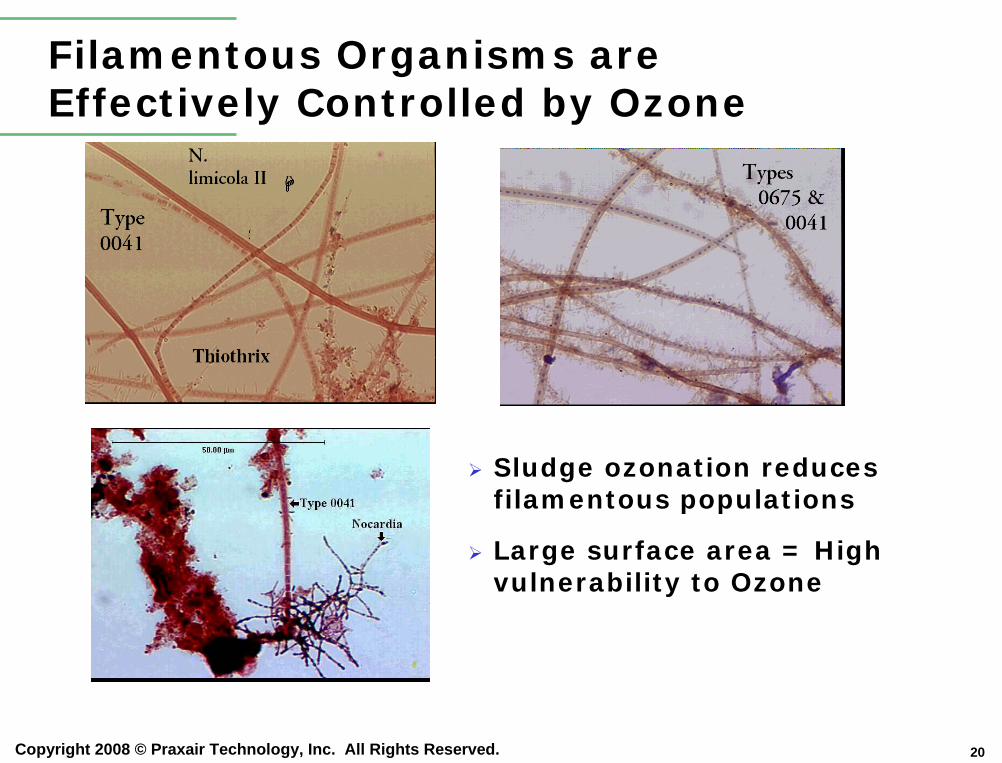
Filamentous Organisms are Effectively Controlled by Ozone
Sludge ozonation reduces filamentous populations
Large surface area = High vulnerability to Ozone
21Copyright 2008 © Praxair Technology, Inc. All Rights Reserved.
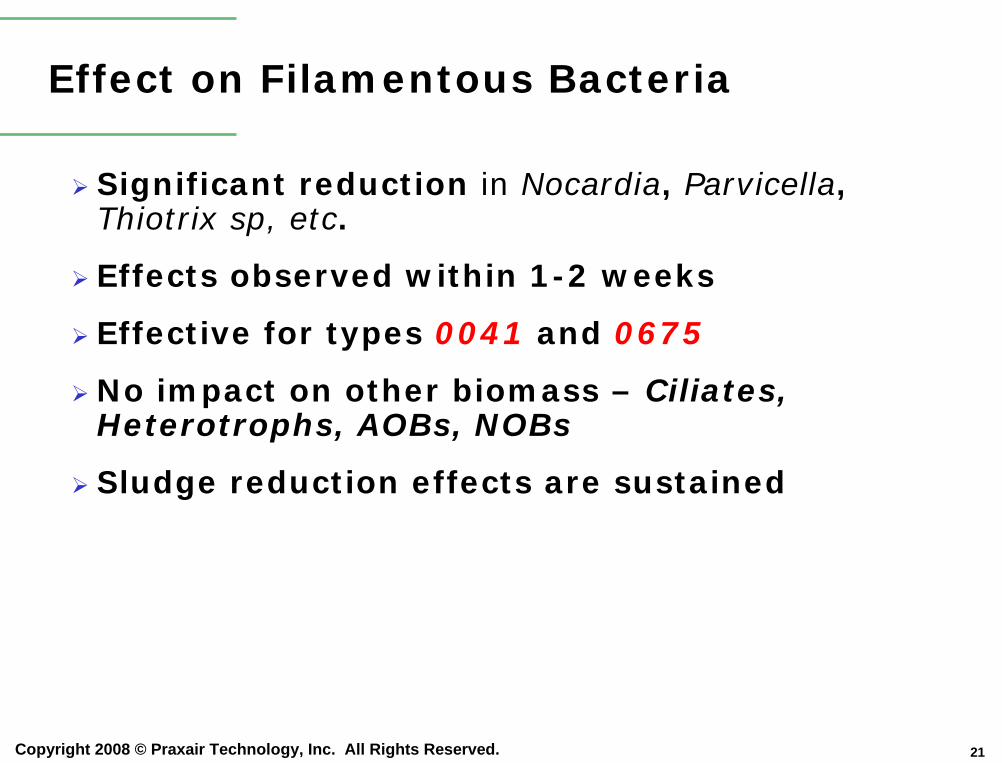
Effect on Filamentous Bacteria
Significant reduction in Nocardia, Parvicella, Thiotrix sp, etc.
Effects observed within 1-2 weeks
Effective for types 0041 and 0675
No impact on other biomass – Ciliates, Heterotrophs, AOBs, NOBs
Sludge reduction effects are sustained
22Copyright 2008 © Praxair Technology, Inc. All Rights Reserved.
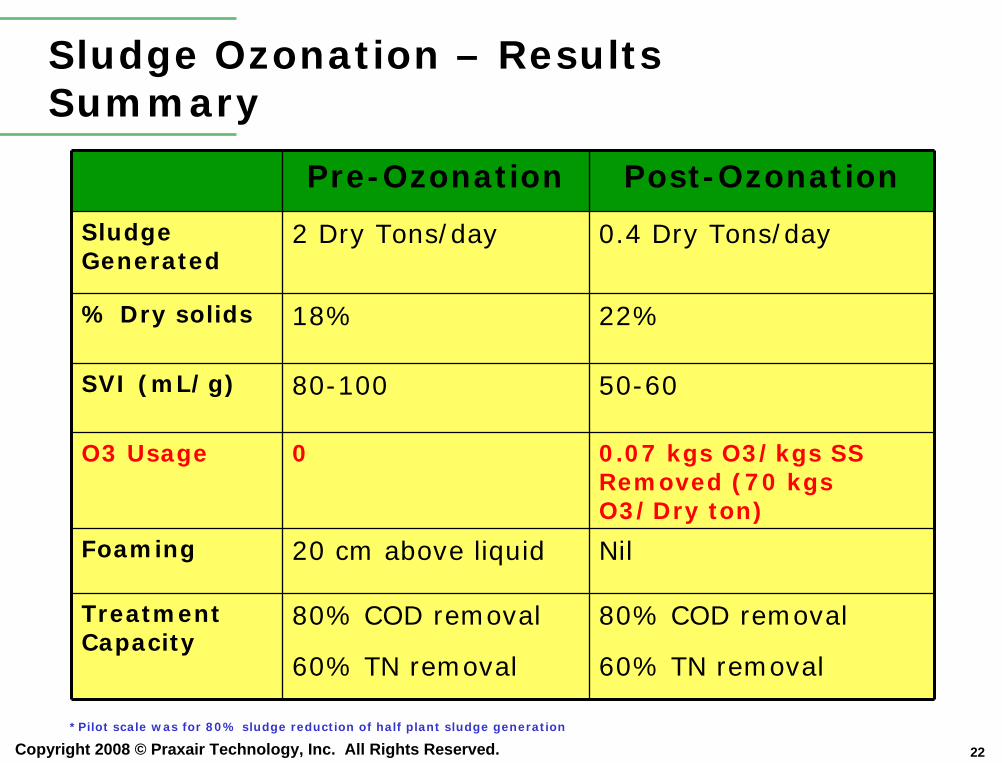
Sludge Ozonation – Results Summary
Pre-Ozonation Post-Ozonation
Sludge Generated
2 Dry Tons/day 0.4 Dry Tons/day
% Dry solids 18% 22%
SVI (mL/g) 80-100 50-60
O3 Usage 0 0.07 kgs O3/kgs SS Removed (70 kgs O3/Dry ton)
Foaming 20 cm above liquid Nil
Treatment Capacity
80% COD removal
60% TN removal
80% COD removal
60% TN removal
*Pilot scale was for 80% sludge reduction of half plant sludge generation
23Copyright 2008 © Praxair Technology, Inc. All Rights Reserved.
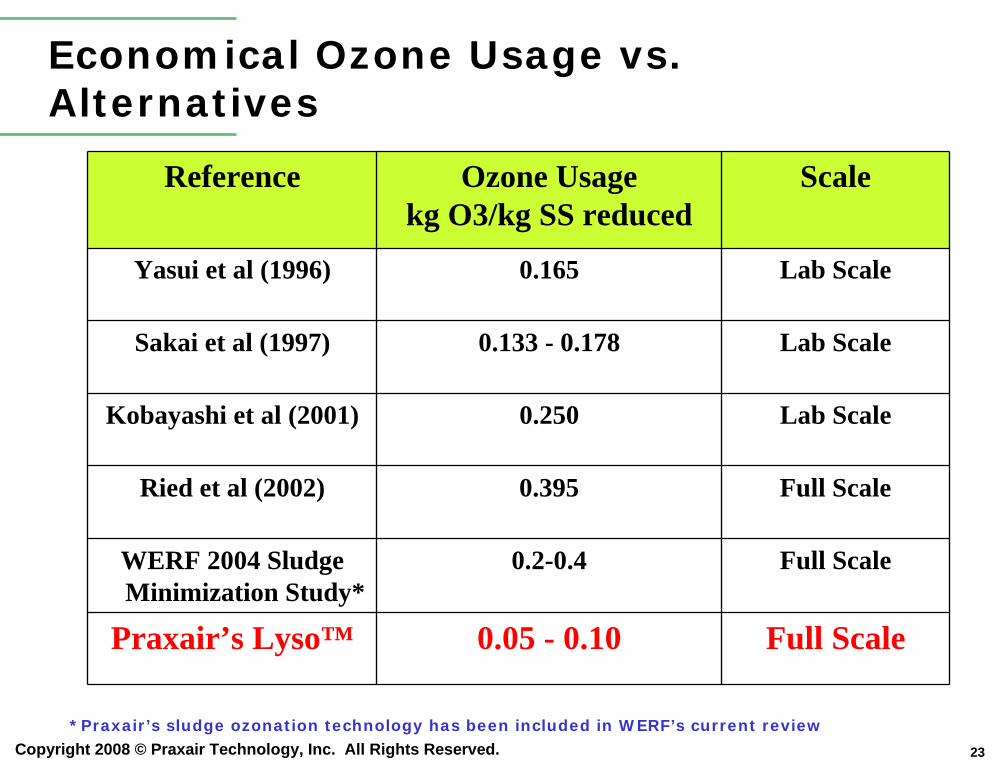
Economical Ozone Usage vs. Alternatives
Reference Ozone Usage kg O3/kg SS reduced
Scale
Yasui et al (1996) 0.165 Lab Scale
Sakai et al (1997) 0.133 - 0.178 Lab Scale
Kobayashi et al (2001) 0.250 Lab Scale
Ried et al (2002) 0.395 Full Scale
WERF 2004 Sludge Minimization Study*
0.2-0.4 Full Scale
Praxair’s Lyso™ 0.05 - 0.10 Full Scale
*Praxair’s sludge ozonation technology has been included in WERF’s current review
24Copyright 2008 © Praxair Technology, Inc. All Rights Reserved.
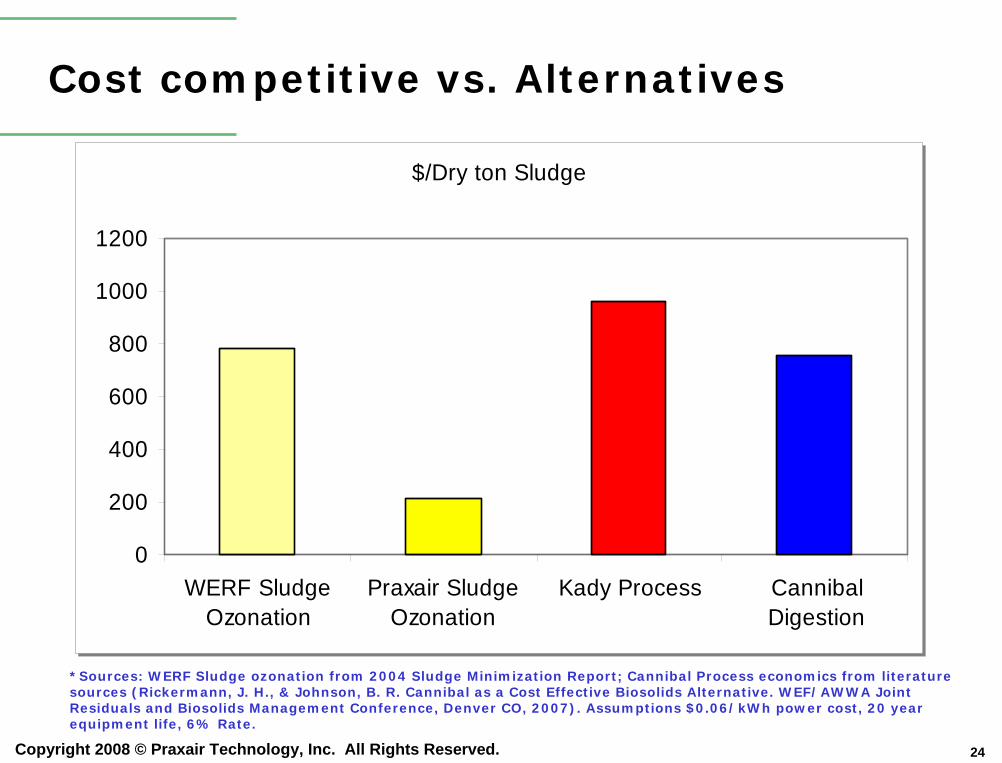
Cost competitive vs. Alternatives
$/Dry ton Sludge
0
200
400
600
800
1000
1200
WERF SludgeOzonation
Praxair SludgeOzonation
Kady Process CannibalDigestion
$/Dry ton Sludge
0
200
400
600
800
1000
1200
WERF SludgeOzonation
Praxair SludgeOzonation
Kady Process CannibalDigestion
*Sources: WERF Sludge ozonation from 2004 Sludge Minimization Report; Cannibal Process economics from literature sources (Rickermann, J. H., & Johnson, B. R. Cannibal as a Cost Effective Biosolids Alternative. WEF/AWWA Joint Residuals and Biosolids Management Conference, Denver CO, 2007). Assumptions $0.06/kWh power cost, 20 year equipment life, 6% Rate.
25Copyright 2008 © Praxair Technology, Inc. All Rights Reserved.
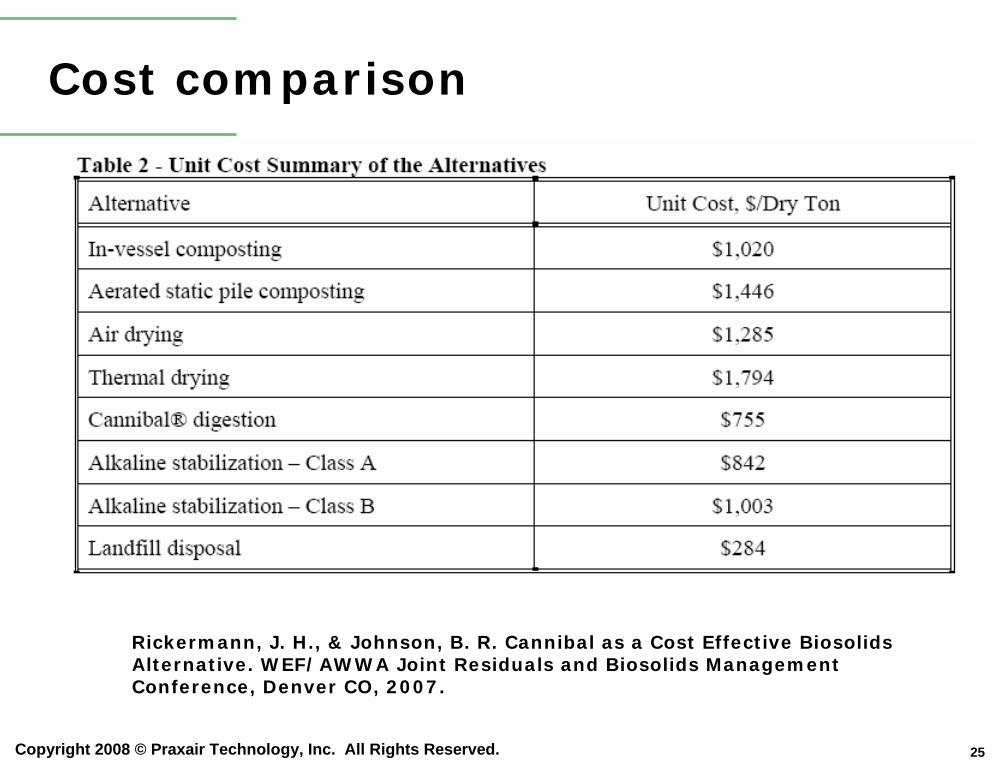
Cost comparison
Rickermann, J. H., & Johnson, B. R. Cannibal as a Cost Effective Biosolids Alternative. WEF/AWWA Joint Residuals and Biosolids Management Conference, Denver CO, 2007.
26Copyright 2008 © Praxair Technology, Inc. All Rights Reserved.
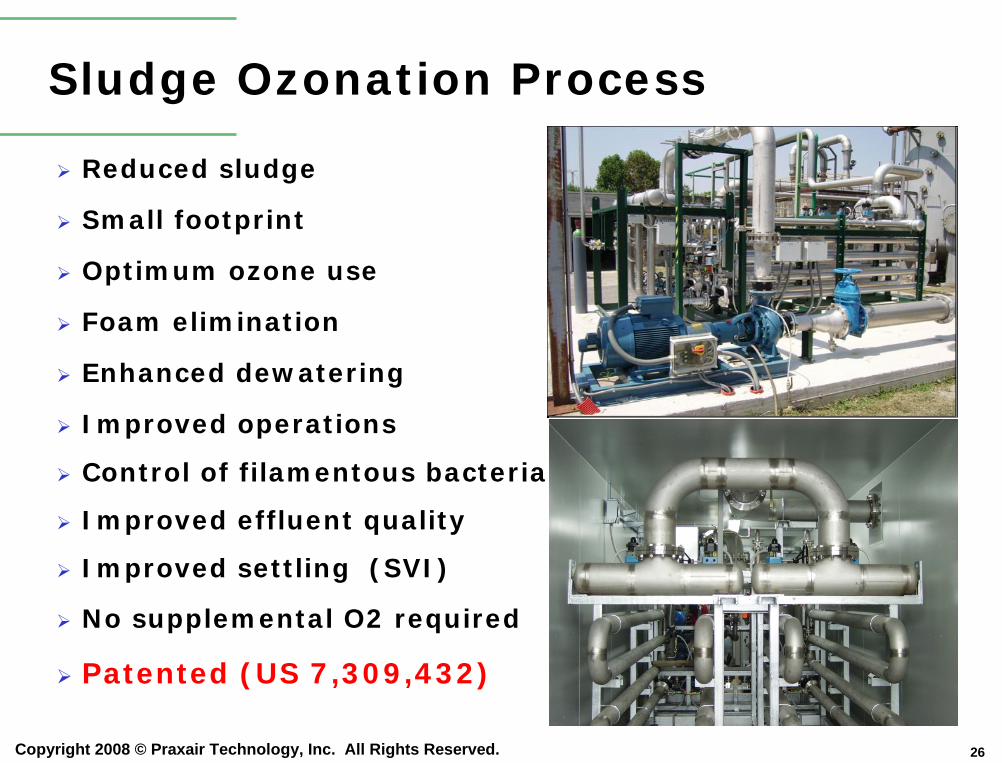
Sludge Ozonation Process
Reduced sludge
Small footprint
Optimum ozone use
Foam elimination
Enhanced dewatering
Improved operations
Control of filamentous bacteria
Improved effluent quality
Improved settling (SVI)
No supplemental O2 required
Patented (US 7,309,432)
27Copyright 2008 © Praxair Technology, Inc. All Rights Reserved.
Conclusions
Sludge ozonation is an effective process for minimizing excess sludge generation
Small footprintHighly biodegradable lysis productsSludge reductionSVI improvementFoaming & Bulking control
No impact on N, COD removal; P release could increase
Plug flow process is the most cost effective approach for sludge ozonation (US Patent 7,309,432)