reduced gene flow at pericentromeric loci in a hybrid zone involving chromosomal races of the house...
TRANSCRIPT
ORIGINAL ARTICLE
doi:10.1111/j.1558-5646.2010.00964.x
REDUCED GENE FLOW AT PERICENTROMERICLOCI IN A HYBRID ZONE INVOLVINGCHROMOSOMAL RACES OF THE HOUSEMOUSE MUS MUSCULUS DOMESTICUSPaolo Franchini,1,2,3 Paolo Colangelo,1,4 Emanuela Solano,1,5 Ernesto Capanna,1 Erik Verheyen,6
and Riccardo Castiglia1
1Dipartimento di Biologia Animale e dell’Uomo, University of Rome “La Sapienza”, Via A. Borelli 50, 00161 Rome, Italy2E-mail: [email protected]
4CNR, Istituto per lo Studio degli Ecosistemi, Via A. Borelli 50, 00161 Rome, Italy6Vertebrate Department of the Royal Belgian Institute of Natural Sciences, Vautierstraat 29, 1000 Brussels, Belgium
Received April 20, 2009
Accepted January 19, 2010
The West European house mouse, Mus musculus domesticus, is a particularly suitable model to investigate the role of chromosomal
rearrangements in reproductive isolation. In fact, it exhibits a broad range of chromosomal polymorphism due to Robertsonian
(Rb) fusions leading to various types of contact zones between different chromosomal races. In the present study, we analyzed a
parapatric contact in central Italy between the Cittaducale chromosomal race (CD: 2n = 22) and the surrounding populations with
standard karyotype (2n = 40) to understand if Rb fusions play a causative role in speciation. One hundred forty-seven mice from 17
localities were genotyped by means of 12 microsatellite loci. A telomeric and a pericentromeric locus situated on six chromosome
arms (four Rbs and one telocentric) were selected to detect differences in the amount of gene flow for each locus in different
chromosomal positions. The analyses performed on the two subsets of loci show differences in the level of gene flow, which is
more restricted near the centromeres of Rb chromosomes. This effect is less pronounced in the homozygotes populations settled
at the border of the hybrid zone. We discuss the possible cause of the differential porosity of gene flow in Rbs considering “hybrid
dysfunctions” and “suppressed recombination” models.
KEY WORDS: chromosomal evolution, microsatellites, recombination, Robertsonian metacentric, speciation.
Chromosomal rearrangements (e.g., deletions, inversions, cen-
tromeric fusion or fissions) are extensively studied events known
to result in various karyotypes in natural populations of plants and
animals (White 1978; Rieseberg and Willis 2007). The fixation
of these mutations in a group of individuals may be followed by
3Present address: Department of Genetics, University of Stellen-
bosch, Private Bag X1, Matieland 7602, South Africa.5Present address: Department of Botany and Zoology, University of
Stellenbosch, Private Bag X1, Matieland, 7602, South Africa.
the establishment of a sympatric (partially overlapping) or parap-
atric (nonoverlapping) contact zone between populations carrying
two different “cytotypes.” Chromosomal rearrangements are be-
lieved to alter patterns of gene flow between hybridizing taxa, but
whether such changes play a direct role in the process of speci-
ation remains controversial (White 1978; Coyne and Orr 2004;
Butlin 2005).
It is traditionally thought that chromosomal changes can play
a causative role in speciation via two principal mechanisms: “hy-
brid dysfunctions” and “suppressed recombination.” Since the
2 0 2 0C© 2010 The Author(s). Journal compilation C© 2010 The Society for the Study of Evolution.Evolution 64-7: 2020–2032
GENE FLOW IN A CHROMOSOMAL HYBRID ZONE
first studies of chromosomal hybrid zones, the “hybrid dysfunc-
tions” mechanism has been indicated as the principal cause of
reduced gene flow (King 1993). According to this model, during
meiosis in hybrid individuals, wrong pairing of the rearranged
chromosomes prevents correct gametogenesis, leading to a large
proportion of nonfunctional gametes. However, recent studies
support “suppressed recombination” as a mechanism that plays a
role in the reduction of gene exchange between two chromosomal
types (for a review see Ortiz-Barrientos et al. 2002). This model
is based on the assumption that some chromosomal regions can
be excluded from crossing over in the rearranged chromosomes.
Thus, they support a mode of speciation in which regions of low
recombination can facilitate genetic divergence in the presence of
gene flow (Navarro and Barton 2003). Recent reviews (Ayala and
Coluzzi 2005; Butlin 2005; Hoffmann and Rieseberg 2008) un-
derline that target genomic regions are affected by recombination
suppression in different species (e.g., sunflower, Helianthus, fruit
fly, Drosophila, mosquito, Anopheles, and human, Homo), and ge-
netic differences may accumulate differentially in these chromo-
some regions so that parapatric or partially sympatric populations
will genetically differentiate, eventually evolving into different
species.
The role of chromosomal rearrangements as a reproductive
barrier under these two models can only be experimentally ad-
dressed by studying gene flow at the chromosome level, which
is only feasible in a species for which the locations of genes
on the karyotype are known. For this reason, few studies have
addressed the question of differential gene flow in natural hy-
brid zones (e.g., Rieseberg et al. 1999; Panithanarak et al. 2004;
Basset et al. 2006), whereas in others the direct role of chromoso-
mal rearrangements in this process remained questionable (Sharp
and Rowell 2007; Kawakami et al. 2008).
Very few studies on mammals have used this approach. The
“suppressed recombination” model was invoked to explain re-
duced gene flow observed in certain locations of the genome of
the house mouse (Panithanarak et al. 2004) and the common shrew
Sorex araneus (Basset et al. 2006). However, in both cases a role
of hybrid unfitness could not be completely ruled out.
The West European house mouse, Mus musculus domesti-
cus, is a particularly suitable model to address this topic. A high
occurrence of Robertsonian (Rb) fusions (the joining of two te-
locentric chromosomes at the centromere to form a metacentric
chromosome) has allowed the formation of numerous chromo-
somal races within the distribution range of the subspecies in
western Europe and North Africa. The diploid number of chro-
mosomal races ranges from 2n = 22 (with nine Rb fusions) to the
standard karyotype of 2n = 40 with all telocentric chromosomes
(Capanna 1982; Sage et al. 1993; Pialek et al. 2005).
When different chromosomal races come into contact, they
form contact zones. These contacts may involve two Rb races or
a single Rb race and the surrounding standard populations. The
result is a large variety of hybrid zones, each one characterized by
different types of chromosomal hybrids and chromosomal struc-
tures. This is an ideal situation for investigation of the involvement
of Rb fusion in the levels of gene flow in what can be called “nat-
ural laboratories for evolutionary studies” (Hewitt 1988).
Hybrids are called “simple heterozygotes” when they form
a trivalent at meiosis (a structure formed by three chromosomes
in meiosis, the two telocentric chromosomes and the metacentric
resulting from their Rb fusion) or “complex heterozygotes” if they
form a chain of more than four chromosomes or ring due to the
presence of metacentrics in “monobrachial homology” (sharing
one chromosome arm). The effect of chromosomal heterozygosity
(CH) on hybrid meiosis and fertility in the house mouse is well
documented. Mice heterozygotes derived from wild populations
have shown that the presence of one or three trivalents at meiosis
may have little effect on fertility (Britton-Davidian et al. 1990;
Wallace et al. 1992; Castiglia and Capanna 2000), whereas many
trivalents or longer chains or rings may reduce fertility to the point
of sterility (Hauffe and Searle 1998; Castiglia and Capanna 2000;
Chatti et al. 2005).
The genomic map of the house mouse was completed more
than a decade ago (Dietrich et al. 1996). This information allows
the selection of genetic markers in desired positions along the
chromosome arms. In the present study, we use 12 microsatellite
loci to assess the impact of chromosomal rearrangements on gene
flow in a well-known chromosomal hybrid zone in central Italy
between the Cittaducale chromosomal race (CD: 2n = 22) and
the surrounding populations with standard karyotype (2n = 40).
The haploid karyotype of the CD race is characterized by nine
Rb chromosomes, 1.7, 2.18, 3.8, 4.15, 5.17, 6.13, 9.16, 10.11,
and 12.14 (where the nomenclature “x.x” indicates the telocentric
chromosomes involved in the centric fusion) plus the telocentric
chromosome 19 (Capanna et al. 1975). The studied transect is
located along a narrow valley and includes a hybridization zone
approximately 10 km wide connecting the two parental races
(Fig. 1). The CD-standard hybrid zone was also studied to deter-
mine the degree of fertility of the hybrid mice. Hybrids between
the two races are exclusively characterized by simple heterozy-
gotes. Decreased fertility has been observed (Castiglia and Ca-
panna 2000), where the number of heterozygous metacentrics is
directly related to the frequency of aneuploid metaphase II and to
a decrease in litter size. The frequency of aneuploid cells is low
for mice carrying one or two trivalents (7–15%) but reaches about
50% in heterozygote F1 mice carrying nine trivalents.
Moreover, “recombination suppression” can also work in
this zone. In fact, a reduction of recombination near centromeres
of Rb heterozygote mice has been observed in laboratory mice
(Davisson and Akeson 1993). However, the pattern observed in
natural house mouse populations seems to be more complex than
EVOLUTION JULY 2010 2 0 2 1

PAOLO FRANCHINI ET AL.
Figure 1. Location of the 17 sample sites along the hybridization zone. The sample sites, 2n variation along the area and karyotype of
parental races are shown. Pooled sites are grouped in circles (see text and Table 1 for detailed explanation). Black circles represent the
sample sites added to those used in the previous works (white circles). The broken lines delimit the populations grouped according to
the chromosomal heterozygosity, CH (see the Results section for details).
those in laboratory mice. Castiglia and Capanna (2002) observed
chiasma repatterning across the hybrid zone of the present study.
They counted a high number of chiasmata in mice near the stan-
dard zone and a decrease of the number of pericentromeric chias-
mata toward the Robertsonian zone. The reduction of chiasmata
was stronger in bivalent metacentrics than in trivalents. Simi-
lar results were observed in wild mice from a hybrid zone in
northern Scotland (Bidau et al. 2001), where a reduction of chi-
asmata was related to the presence of metacentric chromosomes.
The reduction was more pronounced in Robertsonian bivalents
than in trivalents. Moreover, a high presence of chiasmata near
the centromere in Rb heterozygotes was also found. Finally, in
Tunisia, metacentric mice with 2n = 22 had a significant reduc-
tion of pericentromeric chiasmata with respect to standard 2n =40 mice (Dumas and Britton-Davidian 2002). Unfortunately, het-
erozygotes were not studied. These results strongly indicate that,
in wild house mice, chiasmata are less numerous in metacentric
bivalents than in telocentric bivalents. Most importantly, there
are indications that bivalent metacentrics have less centromeric
chiasmata than trivalents.
The aim of this study was to determine (1) if gene flow differs
at loci located at centromeric and telomeric regions and if so, (2)
to discuss possible effect of Rb fusions on such differences.
For this reason, we typed microsatellite loci in centromeric
and telomeric positions of four of the nine metacentrics charac-
terizing the CD race as well as in telocentric number 19, the only
autosome identical in both chromosomal races. We analyzed the
pattern of gene flow at loci in different chromosomal positions and
in areas characterized by different levels of CH for the selected
Rb fusion. This approach allowed the possibility of distinguishing
the different possible causes of the observed pattern of gene flow.
Materials and MethodsSAMPLING AND MOLECULAR METHODS
One hundred forty-seven mice were collected in central Italy in
two sampling sessions. Eighty-six animals were trapped between
1996 and 1998 as part of a previous study (Castiglia and Ca-
panna 1999) and 61 mice were trapped between 2002 and 2005
2 0 2 2 EVOLUTION JULY 2010

GENE FLOW IN A CHROMOSOMAL HYBRID ZONE
Table 1. Localities, sample size (in brackets), populations and chromosomal characteristics of mice from the hybridization zone.
Capture site Locality Population Chromosomalnumber group
1 Collebaccaro (8) CBA (8) 2n=222 Le Mole (5) MOL (16) 2n=223 Le Mole-A (4)4 Le Mole-B (7)5 Monte Cavallo (4) SPT (11) Hybrids6 San Pietro (7)7 Colle del Gallo (6) SBE (18) Hybrids8 San Benedetto (12)9 Colle Paradiso (18) CPA (18) 2n=40 and Hybrids
10 Salisano (6) SAL (6) Hybrids11 Madonna del Mattone (25) MDM (25) 2n=40 and Hybrids12 Mompeo-A (8) MMP (15) 2n=40 and Hybrids13 Mompeo-B (7)14 Granica-A (11) GRA (16) 2n=39–4015 Granica-B (5)16 Montopoli-A (4) MNT (14) 2n=4017 Montopoli-B (10)
(present study). The sampling transect crossed the hybrid zone and
consisted of 17 localities located along a narrow valley between
the cities of Rome (41◦53′60N, 2◦28′60E) and Rieti (42◦23′60N,
12◦50′60E). Different localities were grouped into populations
to increase the population sizes for the microsatellite loci analy-
sis (Fig. 1, Table 1). Groupings were constituted on the basis of
nearness of habitation and their continuity. These two parameters
fit the general low-dispersal capacity of the mice and their com-
mensalism. The mice were caught in Sherman live traps (H.B.
Sherman Traps, Inc., Tallahassee, FL) and tissue samples were
stored in ethanol (80%) at 4◦C for DNA extraction.
Karyotype analyses were performed on somatic metaphase
plates from bone marrow preparations following the standard air-
drying procedure suggested by Hsu and Patton (1969). To identify
the chromosome arms involved in the fusions, the chromosomes
were G-banded according to Seabright (1971).
In the present work, the number of sample sites was increased
to 17 by the addition of eight new ones with respect to those used
in the previous study (Fig. 1, Table 1).
Twelve microsatellite loci in six different chromosome arms
(including four different Rb chromosomes and one telocentric
chromosome) were selected. In each chromosome arm, a telom-
eric and a pericentromeric locus were selected to compare gene
flow of the different regions (see Table 2 for details). The two
loci of chromosome 19 were chosen as controls because chromo-
some 19 is the only telocentric chromosome shared by the two
races, a condition that eliminates the hypothesized effect of the
metacentric configuration on gene flow (see Introduction).
Total genomic DNA was extracted from tissue samples (kid-
ney or muscle) with the DNeasy Tissue Kit (Qiagen, Valencia,
CA). Polymerase chain reaction (PCR) was carried out in a Ther-
mocycler T1 (Biometra, Gottingen, Germany) following the am-
plification conditions described in Franchini et al. (2008).
Table 2. Linkage and physical maps of the 12 microsatellite loci.
Chromosomal arm number (Chr N), Chromosomal length and Locus
position expressed in centiMorgan (cM) and in Megabase (Mb)
are shown. The asterisks indicate the pericentromeric loci. Data
from the Mouse Genome Database map (http://www.informatics.
jax.org/).
Chromosome Locuslength position
Locus Chr NcM Mb cM Mb
D6Mit138∗ 6 91.8 149.51 0.7 4.45D6Mit26 74.0 147.21D9Mit251∗ 9 77.6 124.07 5.0 10.32D9Mit52 72.0 122.61D10Mit75∗ 10 76.5 129.99 2.0 6.87D10Mit103 70.0 125.17D11Mit74∗ 11 83.1 121.84 0.0 5.22D11Mit61 70.0 112.37D12Mit182∗ 12 113.7 121.25 2.0 10.87D12Mit30 46.0 101.29D19Mit94∗ 19 57.9 61.34 4.0 7.19D19Mit6 55.0 61.13
EVOLUTION JULY 2010 2 0 2 3
PAOLO FRANCHINI ET AL.
The PCR products were run on 6.5% denaturing polyacry-
lamide gels using a LI-COR DNA 4200 automated sequencer
(LI-COR Biosciences, Cambridge, United Kingdom). Allele sizes
were estimated using the software GENEIMAGEIR version 4.05
(Scanalytics, Fairfax, VA) by comparison with infrared molecu-
lar size standards for LI-COR DNA analysers.
STATISTICAL ANALYSIS
Genotype frequencies were tested for departures from Hardy–
Weinberg equilibrium with Fisher’s exact test (Louis and
Dempster 1987) using GENEPOP version 3.4 (Raymond and
Rousset 1995). GENEPOP was also used to calculate linkage dise-
quilibrium between all pairs of loci according to Goudet et al.
(1996). Significance levels were calculated with the Markov
Chain method (Guo and Thompson 1992) using 10,000 per-
mutations, 5000 dememorization steps, and 500 batches. When
heterozygote deficit was found in a population, the software
MICROCHECKER version 2.2.3 (Van Oosterhout et al. 2004) was
used to verify the occurrence of null alleles.
Because R-statistics (Slatkin 1995) better fits population ge-
netics studies in which a high number of loci (nl ≥ 20) and a
large sample (ns ≥ 50) are analyzed (Gaggiotti et al. 1999), we
used F-statistics (Wright 1965) in this work to calculate the in-
terpopulation level of genetic differentiation. According to Weir
and Cockerham (1984), FSTAT version 2.9.3.2 (Goudet 2001) was
used to calculate FST-values, estimated by theta (θ). The exact
G-test (Goudet et al. 1996), as implemented in FSTAT, was used to
assess the significance of genetic differentiation. The correlation
between geographic and genetic distances was analyzed with a
Mantel test (“Isolde” subroutine, GENEPOP). The value FST/(1 −FST) was compared with the natural logarithm of the distance
(Rousset 1997).
The model-based clustering methods implemented in STRUC-
TURE version 2.2 (Pritchard et al. 2000; Falush et al. 2003) were
used to detect the presence of a genetic structure and to assign indi-
viduals to inferred clusters using multilocus genotyped data. This
software, unlike the others used in this study, analyzed individ-
ual genotypes only, without receiving information on the original
chromosomal race or population. The model assumes K popu-
lations (or genetic clusters), each one modeled by its own set of
allele frequencies at each locus. The population allele frequencies
and assignation of individuals to populations were inferred simul-
taneously using a Bayesian approach assuming Hardy–Weinberg
equilibrium and complete linkage equilibrium between loci within
populations. In this work, the optimal values of K were selected
according to the formula suggested by Evanno et al. (2005): �K =m|L′′(K)|/s[L(K)]. This procedure allows one to choose the cluster
subdivision that captures the uppermost level of genetic structure.
For each selected K, the program assigns individuals to each of
the inferred clusters with an associated probability (Qi). To select
an appropriate burning length, so as to obtain accurate parameter
estimates, we performed several runs at each K (K = 1 – 10). All
runs were conducted under an admixture model with correlated
frequency through 1,000,000 Markov Chain Monte Carlo itera-
tions after a burn-in period of 1,000,000. The program DISTRUCT
version 1.1 (Rosenberg 2004) was used to display individual mem-
bership coefficients for each cluster.
The FST analyses and the model-based clustering methods
implemented in STRUCTURE were performed on the entire set of
12 loci and subsequently on the 12 loci separately and on the two
subsets of “only telomeric” and “only pericentromeric” loci (see
Results section). The pair of loci of chromosome 19 was excluded
from these subsets to test only the differential gene flow of the
rearranged chromosomes. Numerical differences in the number of
alleles (n), in the expected heterozygosity (He) and in FST-values
between the two groups of loci (pericentromeric and telomeric),
were tested by the nonparametric paired Wilcoxon test.
ResultsCHROMOSOMAL STRUCTURE OF THE HYBRID ZONE
Karyotypic characterization of the 61 individuals collected in the
last sampling confirmed the chromosomal cline revealed in previ-
ous studies (Spirito et al. 1980; Castiglia and Capanna 1999) (see
Fig. 1 and Table 1). The chromosome number increased along
the study transect from the CD (2n = 22) to the standard (2n =40) area. The only exceptions were four individuals collected at
sample site MMP (with diploid numbers of 35, 36, 38, and 39)
and one individual at the GRA site with 2n = 39. These five mice
had hybrid karyotypes even though all the other mice trapped at
the same site had a standard all-telocentric karyotype. All the Rb
metacentrics that characterize the CD race have frequencies that
show a gradual decline from the Rb area to the standard one.
Moreover, their chromosomal clines show a nearly complete co-
incidence (Castiglia and Capanna 1999). More precisely, consid-
ering the examined metacentrics, heterozygote individuals begin
to appear in populations STP, that is, 6.13, 10.11, 12.14, and SBE,
that is, 9.16, and heterozygotes for these Rbs can be found at low
frequency in CPA, MDM, and SAL (Table S1). To analyze the role
of Rb fusion in the pattern of gene flow, we divided the transect
into four zones, pooling nearby populations with similar level of
CH for the selected chromosomes. As measure of CH, we used the
frequency of heterozygous fusions per each population for each
studied Rb. The first zone, characterized by the absence of CH, is
constituted by the populations of the parental CD race, CBA, and
MOL, settled in the northern part of the study area, designated as
“CD 2n = 22.” The second zone, characterized by high CH, is
constituted of STP and SBE populations, and it is designated as
“High CH Zone,” where mice with one to seven trivalents occur.
2 0 2 4 EVOLUTION JULY 2010

GENE FLOW IN A CHROMOSOMAL HYBRID ZONE
The frequency of the heterozygous individuals for the studied
metacentrics ranges from 0.17 (for 10.11) to 0.48 (for 12.14). The
third group, characterized by populations with standard 2n = 40
mice together with mice with one to four trivalents, is constituted
of CPA, SAL, MDM, and MMP populations. These populations
occupy a wide area southern the “High CH zone,” designated as
“Medium CH Zone;” in this zone, the frequency of the heterozy-
gous individuals for the studied metacentrics ranges from 0.02 (for
10.11) to 0.14 (for 9.16). However, in the “Medium CH Zone,”
the frequency of heterozygous Rbs in each population is variable
(e.g., from 0.0 to 1.0 for 9.16; see Table S1). This variation can
be due to both samples bias and passive transport by man. For
this reason, it is difficult to quantitatively evaluate the effective
presence of Rb chromosomes in this zone. Most important is that
it appears different from the fourth zone (designated as “Stan-
dard 2n = 40”), characterized by populations with low/absent
CH. In this zone, constituted of GRA and MNT populations,
only one hybrid individual was found together with parental all-
telocentric 2n = 40 mice. A fifth group consisted of all the hybrid
populations and was designated as “CH Transect.” With the last
group, we excluded the effect of gene flow between parental
populations, increasing the sample to obtain higher statistical
power.
GENETIC STRUCTURE OF THE HYBRID ZONE
The entire sample was successfully genotyped by means of the
12 microsatellite loci. For each population, the values of allelic
variability as well as the expected and observed heterozygosi-
ties and the results of the Hardy–Weinberg equilibrium test are
summarized in Table S2. Because all 14 deviations from Hardy–
Weinberg were due to a deficit of heterozygosis, the presence of
null alleles was tested and subsequently excluded by analysis with
MICROCHECKER. After application of a false discovery rate (FDR)
approach (Benjamini and Hochberg 1995), there was no evidence
of genotypic linkage disequilibrium at any pair of loci.
The overall population FST-value was high (0.133) and sig-
nificant, indicating strong genetic fragmentation in the study area.
The results of the pairwise comparisons differed significantly
from zero (Bonferroni correction applied: P = 0.001), except in
four pairwise tests (see Table S3). There was no correlation be-
tween the genetic and geographic distances (regression of FST/(1 –
FST) over geographic distance, (Mantel test, P > 0.05).
GENE FLOW IN TELOMERIC VERSUS CENTROMERIC
LOCI
Further analyses investigated the dependence of gene flow on
chromosome position. For F-statistics, the populations were an-
alyzed in the five zones identified by the chromosomal analysis.
The F-statistics applied separately to each of the 12 microsatel-
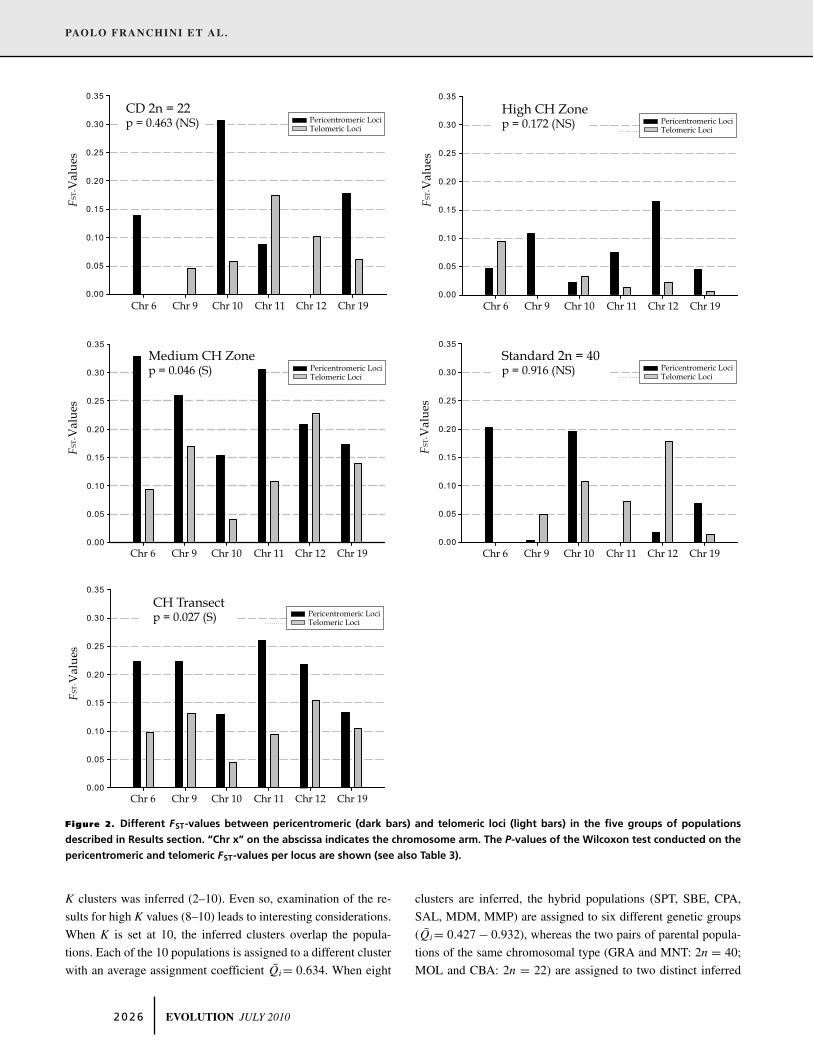
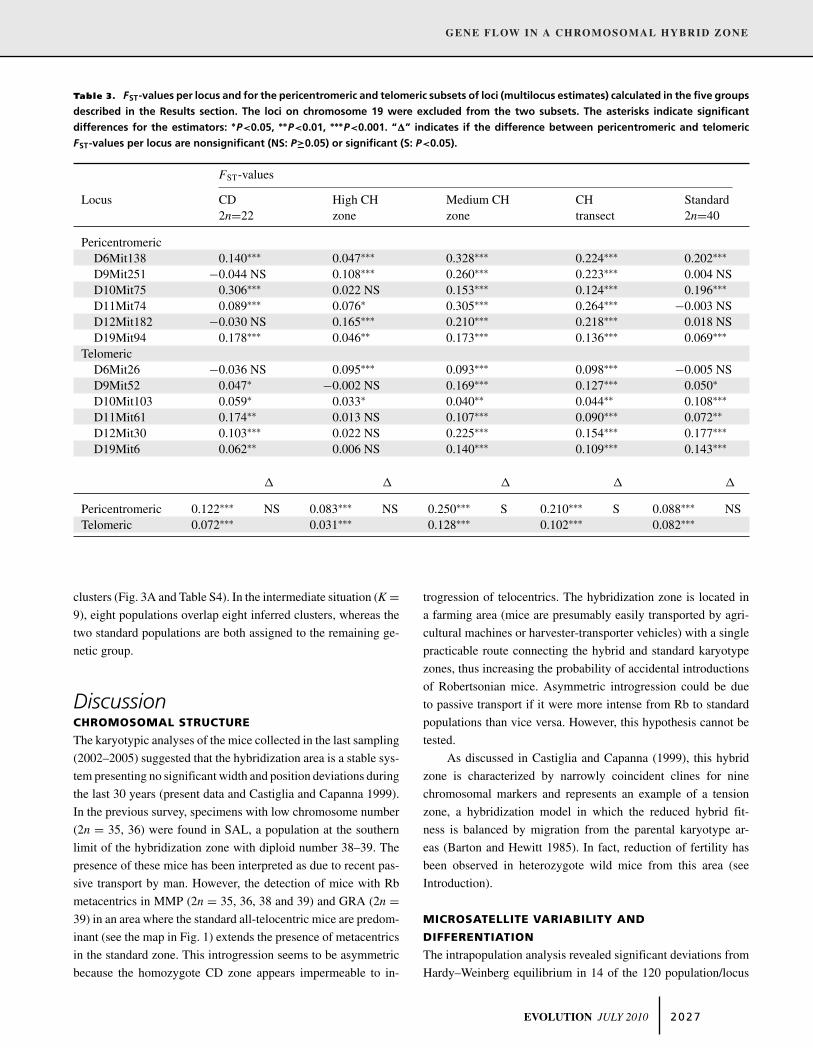
lite loci in these five zones is summarized in Fig. 2 and Table 3.
Regarding the loci mapped in the metacentric chromosomes, the
pericentromeric loci showed higher FST-values than the telomeric
ones in three of five chromosomal arms in the “High CH Zone,”
in four of five chromosomal arms in the “Medium CH Zone,”
and in all five arms in the “CH Transect.” In the two parental
groups (“CD 2n = 22” and “Standard 2n = 40”), the pericen-
tromeric loci showed higher FST-values in two of five chromoso-
mal arms. The pair of loci on chromosome 19 showed a higher
pericentromeric FST-value than the telomeric one in each zone.
However, in the “CH Transect,” chromosome 19 is the only chro-
mosomal arm showing comparable pericentromeric and telomeric
FST-values. We also performed the F-statistics analysis on the
two subsets of loci (only telomeric loci and only pericentromeric
ones), excluding from the two subsets the loci of chromosome 19
to focus the investigation on the rearranged chromosomes. The
analyses showed significant differentiation in all groups for both
the pericentromeric and telomeric subsets (the FST-values range
from 0.031 to 0.250; see Table 3). The differences in FST-values
between the two subsets of loci (higher FST-values for the peri-
centromeric subset) were statistically significant in two of three
groups in which CH is involved (Wilcoxon test: “High CH Zone,”
P = 0.172; “Medium CH Zone,” P = 0.046; “CH Transect,” P =0.027). In contrast, the same test applied to the parental race
groups revealed the absence of differentiation between the FST-
values of both subsets (Wilcoxon test: “CD 2n = 22, P = 0.463;
Standard 2n = 40, P = 0.916; the results are summarized in Fig. 2
and Table 3).
The number of total alleles (n) and expected heterozygos-
ity (He) detected in all samples did not significantly differ be-
tween loci located in the pericentromeric or telomeric position
(Wilcoxon test: p(n) = 0.684 − p(He) = 0.842. The same re-
sult was found in the same groups analyzed with F-statistics
(Wilcoxon test: “CD 2n = 22,” p(n) = 0.786 − p(He) = 0.074;
“High CH Zone,” p(n) = 0.465 − p(He) = 0.916; “Medium CH
Zone,” p(n) = 0.673 − p(He) = 0.172; “CH Transect”, p(n) =0.338 − p(He) = 0.600; “Standard 2n = 40,” p(n) = 0.853 −p(He) = 0.501. Allelic variability is reported in Table S2).
STRUCTURE detected radical differences when the Bayesian
algorithm was applied to the two datasets (Fig. 3). The identifi-
cation of the K that best fits the data was not clear because the
�K-values corresponding to each K were low and comparable
(data not shown). When only telomeric loci are considered, there
is the near absence of any distinct population structure because of
the weak genetic structure in the dataset (see Fig. 3B and Table S4
where the result for K = 8 is shown). This is supported by the
symmetric proportion of the sample assigned to most populations
(P = 1/K), in which individuals are highly admixed, showing sub-
stantial assignment probabilities for different inferred K clusters
(2–10). In contrast, the clustering analysis applied to the peri-
centromeric loci showed genetic structuring when each of the
EVOLUTION JULY 2010 2 0 2 5
PAOLO FRANCHINI ET AL.
Figure 2. Different FST-values between pericentromeric (dark bars) and telomeric loci (light bars) in the five groups of populations
described in Results section. “Chr x” on the abscissa indicates the chromosome arm. The P-values of the Wilcoxon test conducted on the
pericentromeric and telomeric FST-values per locus are shown (see also Table 3).
K clusters was inferred (2–10). Even so, examination of the re-
sults for high K values (8–10) leads to interesting considerations.
When K is set at 10, the inferred clusters overlap the popula-
tions. Each of the 10 populations is assigned to a different cluster
with an average assignment coefficient Qi= 0.634. When eight
clusters are inferred, the hybrid populations (SPT, SBE, CPA,
SAL, MDM, MMP) are assigned to six different genetic groups
(Qi= 0.427 − 0.932), whereas the two pairs of parental popula-
tions of the same chromosomal type (GRA and MNT: 2n = 40;
MOL and CBA: 2n = 22) are assigned to two distinct inferred
2 0 2 6 EVOLUTION JULY 2010
GENE FLOW IN A CHROMOSOMAL HYBRID ZONE
Table 3. FST-values per locus and for the pericentromeric and telomeric subsets of loci (multilocus estimates) calculated in the five groups
described in the Results section. The loci on chromosome 19 were excluded from the two subsets. The asterisks indicate significant
differences for the estimators: ∗P<0.05, ∗∗P<0.01, ∗∗∗P<0.001. “�” indicates if the difference between pericentromeric and telomeric
FST-values per locus are nonsignificant (NS: P≥0.05) or significant (S: P<0.05).
FST-values
Locus CD High CH Medium CH CH Standard2n=22 zone zone transect 2n=40
PericentromericD6Mit138 0.140∗∗∗ 0.047∗∗∗ 0.328∗∗∗ 0.224∗∗∗ 0.202∗∗∗
D9Mit251 −0.044 NS 0.108∗∗∗ 0.260∗∗∗ 0.223∗∗∗ 0.004 NSD10Mit75 0.306∗∗∗ 0.022 NS 0.153∗∗∗ 0.124∗∗∗ 0.196∗∗∗
D11Mit74 0.089∗∗∗ 0.076∗ 0.305∗∗∗ 0.264∗∗∗ −0.003 NSD12Mit182 −0.030 NS 0.165∗∗∗ 0.210∗∗∗ 0.218∗∗∗ 0.018 NSD19Mit94 0.178∗∗∗ 0.046∗∗ 0.173∗∗∗ 0.136∗∗∗ 0.069∗∗∗
TelomericD6Mit26 −0.036 NS 0.095∗∗∗ 0.093∗∗∗ 0.098∗∗∗ −0.005 NSD9Mit52 0.047∗ −0.002 NS 0.169∗∗∗ 0.127∗∗∗ 0.050∗
D10Mit103 0.059∗ 0.033∗ 0.040∗∗ 0.044∗∗ 0.108∗∗∗
D11Mit61 0.174∗∗ 0.013 NS 0.107∗∗∗ 0.090∗∗∗ 0.072∗∗
D12Mit30 0.103∗∗∗ 0.022 NS 0.225∗∗∗ 0.154∗∗∗ 0.177∗∗∗
D19Mit6 0.062∗∗ 0.006 NS 0.140∗∗∗ 0.109∗∗∗ 0.143∗∗∗
� � � � �
Pericentromeric 0.122∗∗∗ NS 0.083∗∗∗ NS 0.250∗∗∗ S 0.210∗∗∗ S 0.088∗∗∗ NSTelomeric 0.072∗∗∗ 0.031∗∗∗ 0.128∗∗∗ 0.102∗∗∗ 0.082∗∗∗
clusters (Fig. 3A and Table S4). In the intermediate situation (K =9), eight populations overlap eight inferred clusters, whereas the
two standard populations are both assigned to the remaining ge-
netic group.
DiscussionCHROMOSOMAL STRUCTURE
The karyotypic analyses of the mice collected in the last sampling
(2002–2005) suggested that the hybridization area is a stable sys-
tem presenting no significant width and position deviations during
the last 30 years (present data and Castiglia and Capanna 1999).
In the previous survey, specimens with low chromosome number
(2n = 35, 36) were found in SAL, a population at the southern
limit of the hybridization zone with diploid number 38–39. The
presence of these mice has been interpreted as due to recent pas-
sive transport by man. However, the detection of mice with Rb
metacentrics in MMP (2n = 35, 36, 38 and 39) and GRA (2n =39) in an area where the standard all-telocentric mice are predom-
inant (see the map in Fig. 1) extends the presence of metacentrics
in the standard zone. This introgression seems to be asymmetric
because the homozygote CD zone appears impermeable to in-
trogression of telocentrics. The hybridization zone is located in
a farming area (mice are presumably easily transported by agri-
cultural machines or harvester-transporter vehicles) with a single
practicable route connecting the hybrid and standard karyotype
zones, thus increasing the probability of accidental introductions
of Robertsonian mice. Asymmetric introgression could be due
to passive transport if it were more intense from Rb to standard
populations than vice versa. However, this hypothesis cannot be
tested.
As discussed in Castiglia and Capanna (1999), this hybrid
zone is characterized by narrowly coincident clines for nine
chromosomal markers and represents an example of a tension
zone, a hybridization model in which the reduced hybrid fit-
ness is balanced by migration from the parental karyotype ar-
eas (Barton and Hewitt 1985). In fact, reduction of fertility has
been observed in heterozygote wild mice from this area (see
Introduction).
MICROSATELLITE VARIABILITY AND
DIFFERENTIATION
The intrapopulation analysis revealed significant deviations from
Hardy–Weinberg equilibrium in 14 of the 120 population/locus
EVOLUTION JULY 2010 2 0 2 7

PAOLO FRANCHINI ET AL.
Figure 3. Clustering analysis results for K = 8. Each individual is represented as a vertical line partitioned into K colored segments,
whose length is proportional to the individual’s estimated membership coefficients in the K clusters. Individuals belonging to different
chromosomal groups (“CD 2n = 22,” “Standard 2n = 40,” “High CH Zone,” “Medium CH Zone,” and “CH Transect”), the same used in
the FST analysis, are separated by a broken line. Populations are labeled above the figures and are sorted from high-to-low metacentric
number (from north to south: see map of Fig. 1 for details). The upper box plot shows the results of microsatellite pericentromeric loci
(A), the lower one the telomeric loci (B). The assignation probability of each population to the eight inferred clusters is shown in Table S4.
combinations. Because the presence of null alleles was excluded,
the observed heterozygosis deficit is probably best explained by
the subpopulation structuring that occurs when several sampling
sites are pooled (Hartl and Clark 1997). In fact, although the pool-
ing was based on (geographic) proximity and habitat continuity,
in some cases the distances among pooled sampling sites may
have been larger than the normal dispersal range of these mice
(Pocock et al. 2005). The absence of linkage disequilibrium at any
pair of loci agreed with the loci mapping. Indeed, the 12 loci were
selected in six different chromosome arms and the pair of loci
in the same arm was mapped in pericentromeric and telomeric
positions, most probably excluding the occurrence of linkage due
to crossing-over events.
The genetic structure inferred from the 12 loci over all pop-
ulations is high (FST = 0.135) and comparable to that found in
other areas for M. m domesticus (FST = 0.15–0.34: Dallas et al.
1998; FST = 0.39, RST = 0.45: Panithanarak et al. 2004; FST =0.187, RST = 0.210: Franchini et al. 2008). These values reflect
substantial genetic structuring in the study area. As discussed by
Franchini et al. (2008), this could be explained by the commensal
habits of the species, because dispersal events among different
sites can be limited by this kind of mutualistic association with
humans. However, the commensalism of the house mouse can
also facilitate passive transport via human vehicles over long dis-
tances (Cucchi et al. 2005; Pocock et al. 2005). The present evi-
dence might explain the observed absence of correlation between
genetic and geographic distance. Isolation-by-distance was found
in studies on noncommensal small mammals such as the com-
mon shrew S. araneus (Andersson et al. 2004; Basset et al. 2006)
and the common vole Microtus arvalis (Heckel et al. 2005), in
which microsatellites also highlighted weaker genetic fragmenta-
tion than that observed in the house mouse.
GENE FLOW IN TELOMERIC VERSUS CENTROMERIC
LOCI
Pericentromeric and telomeric loci were analyzed separately to
test the differential porosity of gene flow in different regions of
the chromosomes. This analysis was performed within groups
of populations with different levels of CH. This allowed us to
understand the role of chromosomal rearrangements in gene flow
and to increase the sample to obtain higher statistical power.
The results of different approaches based on Bayesian algo-
rithms (clustering analysis) and F- statistics agree in showing that
gene flow within the hybrid zone is lower at the centromere of all
the tested Rb chromosomes. However, this phenomenon is less
pronounced between the two pairs of parental populations.
These findings are supported by the values of genetic struc-
ture index (FST) for each locus, which reveal that centromeric loci
2 0 2 8 EVOLUTION JULY 2010

GENE FLOW IN A CHROMOSOMAL HYBRID ZONE
of metacentrics show lower gene exchange than telomeric ones.
Moreover, the differences in FST-values between the two subsets
of loci were statistically significant only in the groups in which
CH is involved (“Medium CH Zone” and “CH Transect”). The
reliability of this result is supported by the similar allelic vari-
ability of the different loci analyzed. Indeed, we are comparing
different groups of microsatellite loci (telomeric and centromeric)
that show similar numbers of alleles, which is fundamental for a
correct comparison of gene flow (Basset et al. 2006). Moreover,
even when migration is low, as in the case of the CD-standard
hybrid zone, microsatellite loci with high mutation rates could
show low FST-values and, consequently, overestimate the amount
of gene flow (Balloux and Lugon-Moulin 2002). The dependence
of gene flow on chromosomal position is less clear in chromo-
some number 19. Indeed, the telomeric and centromeric loci of
chromosome 19 show a comparable level of differentiation when
all the populations within the hybrid zone and the “Medium CH
Zone” are considered.
The clustering analysis performed by STRUCTURE confirms
a clear genetic clustering for the centromeric loci dataset, but
not for the telomeric one. Moreover, when STRUCTURE inferred
eight genetic groups, the two populations belonging to the CD
race (CBA and MOL) and the two populations belonging to the
standard race (MNT and GRA) were assigned to the same cluster
(Fig. 3A). It should be remembered that STRUCTURE worked with
the individual genotype dataset alone, without indication of the
source population.
These results indicate that: (1) the high genetic fragmenta-
tion observed in the CD-standard hybridization zone is mostly
due to low gene flow associated with pericentromeric regions of
the metacentric chromosomes; (2) this effect is stronger among
the hybrid populations than between the two pairs of parental
populations (CBA and MOL; GRA and MNT); (3) chromo-
some 19 shows a slightly different pattern, with a tendency to
a less-pronounced difference between centromeric and telom-
eric loci. These three observations can be useful to understand
which mechanism shapes the pattern of gene flow. First of all,
we should consider that differentiation at centromeric regions
can be explained by recombination differences at corresponding
chromosomes without evoking Robertsonian rearrangements. For
example, a recent study of two subspecies of the European rabbit
(Oryctolagus cuniculus) demonstrated that loci situated near cen-
tromeres appeared to be more differentiated than telomeric loci in
three of the five centromeric loci analyzed (Carneiro et al. 2009).
Given the chromosomal uniformity of this species, these results
show that species can remain differentiated in low-recombination
regions even in the absence of chromosomal rearrangements.
A recently published recombination map of Mus musculus
(Shifman et al. 2006, their Fig. 1) indicated that recombination
was suppressed around the centromere in three of six chromo-
somes analyzed (6, 9, 10). The trend appeared irregular at chromo-
somes 11, 12, and 19. The reduction of centromeric gene flow that
we observed in this hybrid zone may be partly explained by these
intrinsic characteristics of the mouse chromosomes. However, it
does not completely match the expectation of the recombination
map. Indeed, we observed low gene flow at the centromere of all
the studied Rb fusions. More significantly, this effect is stronger
within the hybrid zone and less pronounced in parental popula-
tions at the border. This would not be the case if the suppressed
centromeric gene flow was due to intrinsic characteristics of the
telocentric chromosomes of the house mouse.
Differential gene flow can also be due to a chance associ-
ation of fusion point with genetic factors causing sub-fertility.
This event has been suggested for the reduced introgression at
centromeric loci in two Rb metacentrics that differed between
two chromosomal races of the house mouse in northern Italy
(Panithanarak et al. 2004); a chance effect was possible because
only two metacentrics were involved. Conversely, in the present
study, the reduction of gene flow at centromeric loci is consis-
tently observed in all four metacentrics characterizing the CD
race. It is unlikely that there would be a chance association with
genetic factors at four different unlinked locations in the genome.
Moreover, the absence of this effect in chromosome 19 suggests
that reduction of gene flow is closely related to the metacentric
configuration. The above considerations suggest a direct effect
of the Rb fusions in the observed reduction of gene flow at the
pericentromeric loci. This indicates two other hypotheses as more
plausible: recombination suppression in the centromeric region
of Rb metacentrics in heterozygotes (Panithanarak et al. 2004;
Ayala and Coluzzi 2005; Butlin 2005) and unfitness of chromo-
somal heterozygotes. In fact, because heterozygote individuals are
unfit in this zone, the fusion points are equivalent to unfitness loci,
which can theoretically reduce gene flow at linked loci (Barton
and Hewitt 1981). However, distinguishing between these two
alternatives is theoretically possible because they should affect
the pattern of gene flow in a different ways. If unfitness of het-
erozygotes plays a role in the build-up of genetic differentiation
at centromeric loci, the observed differences between telomeric
and centromeric loci should be more pronounced within the hy-
brid zone, where the frequency of trivalents is higher than at the
border. Alternatively, if suppression of recombination is more
important, we would expect the differential gene flow between
centromeric and telomeric loci to be more pronounced between
populations settled where the metacentric CD lives, than in the
standard areas. In fact, as previously discussed, there are indica-
tions that bivalent metacentrics have less centromeric chiasmata
than trivalents (Bidau et al. 2001; Castiglia and Capanna 2002;
Dumas and Britton-Davidian 2002).
The results of STRUCTURE and of the FST analysis values show
that, for the centromeric loci, the two pairs of parental populations
EVOLUTION JULY 2010 2 0 2 9

PAOLO FRANCHINI ET AL.
are genetically more similar than what occurs within the hybrid
zone. Thus, hybrid unfitness seems to have a stronger effect than
recombination suppression on centromeric gene flow in the hybrid
zone. However, we cannot exclude that both mechanisms are
working synergistically.
ConclusionsThis study shows that chromosome rearrangements limit free ge-
netic exchanges among the centromeric regions of four Rb fusions
in the studied hybrid zone. Because of the low genetic exchange,
these chromosomal regions tend to accumulate genetic differences
in spite of gene flow in other parts of the genome. If loci that con-
tribute in some way to genetic isolation (“isolation genes”) are
linked to these regions, genetic diversification could be facilitated
(Barton 1979; Rieseberg 2001).
Empirical evidence shows that genetic effects exist in natural
conditions and concur with the observed sub-fertility in the house
mouse. This evidence is due to (1) the differences in fertility be-
tween wild-caught hybrids and hybrids generated by laboratory
crosses (Searle 1993); (2) the considerable differences in fertility
found in hybrids carrying the same type of structural heterozy-
gosity (Pialek et al. 2001); and (3) the instances of absence of re-
lationships between the type of CH and fertility estimates (Chatti
et al. 2005). Our study indicates that the genetic divergence can
accumulate, after the establishment of the chromosomal differ-
ences, even if the populations are hybridizing.
ACKNOWLEDGMENTSThis work was supported by MURST 40% and PRIN funds. A specialacknowledgment to Prof. M. Corti, promoter of this research programmeand great friend, who prematurely disappeared. We thank the two anony-mous referees that with their very careful revisions allowed to greatlyimprove this manuscript.
LITERATURE CITEDAndersson, A. C., Y. Narain, H. Tegelstrom, and K. Fredga. 2004. No apparent
reduction of gene flow in a hybrid zone between the West and NorthEuropean karyotypic groups of the common shrew, Sorex araneus. Mol.Ecol. 13:1205–1215.
Ayala, F. J., and M. Coluzzi. 2005. Chromosome speciation: Humans,Drosophila and mosquitoes. Proc. Natl. Acad. Sci. USA 102:6535–6542.
Balloux, F., and N. Lugon-Moulin. 2002. The estimation of population differ-entiation with microsatellite markers. Mol. Ecol. 11:155–165.
Barton, N. H. 1979. The dynamics of hybrid zones. Heredity 43:341–359.Barton, N. H., and G. M. Hewitt. 1981. Hybrid zones and speciation. Pp. 109–
145 in W. R. Atchley and D. S. Woodruff, eds. Evolution and speciation:essays in honor of M. J. D. White. Cambridge Univ. Press, Cambridge,U.K.
———. 1985. Analysis of hybrid zones. Annu. Rev. Ecol. Syst. 16:113–148.Basset, P., G. Yannic, H. Brunner, and J. Hausser. 2006. Restricted gene flow
at specific parts of the shrew genome in chromosomal hybrid zones.Evolution 60:1718–1730.
Benjamini, Y., and Y. Hochberg. 1995. Controlling the false discovery rate—apractical and powerful approach to multiple testing. J. Roy. Stat. Soc.Ser. B. Meth. 1995:289–300.
Bidau, C. J., M. D. Gimenez, C. L. Palmer, and J. B. Searle. 2001. The effectsof Robertsonian fusions on chiasma frequency and distribution in thehouse mouse (Mus musculus domesticus) from a hybrid zone in northernScotland. Heredity 87:305–313.
Britton-Davidian, J., H. Sonjaya, J. Catalan, and G. Cattaneo-Berrebi. 1990.Robertsonian heterozygosity in wild mice: fertility and transmissionrates in Rb (16. 17) translocation heterozygous. Genetica 80:171–174.
Butlin, R. K. 2005. Recombination and speciation. Mol. Ecol. 14:2621–2635.
Capanna, E. 1982. Robertsonian numerical variation in animal speciation:Mus musculus, an emblematic model. Pp. 155–177 in C. Barigozzi, ed.Mechanism of speciation. Alan Liss, New York.
Capanna, E., M. Cristaldi, P. Perticone, and M. Rizzoni. 1975. Identificationof chromosomes involved in the 9 Robertsonian fusions of the Apenninemouse with a 22-chromosome karyotype. Experientia 31:294–296.
Carneiro, M., N. Ferrand, and M. W. Nachman. 2009. Recombination andspeciation: loci near centromeres are more differentiated than loci neartelomeres between subspecies of the European rabbit (Oryctolagus cu-
niculus). Genetics 181:593–606.Castiglia, R., and E. Capanna. 1999. Contact zones between chromosomal
races of Mus musculus domesticus. 1. Temporal analysis of hybrid zonebetween the CD chromosomal race (2n = 22) and populations with thestandard karyotype. Heredity 83:319–326.
———. 2000. Contact zone between chromosomal races of Mus musculusdomesticus. 2. Fertility and segregation in laboratory-reared and wildmice heterozygous for multiple Robertsonian rearrangements. Heredity85:147–156.
———. 2002. Chiasma repatterning across a chromosomal hybrid zonebetween chromosomal races of Mus musculus domesticus. Genetica114:35–40.
Chatti, N., J. Britton-Davidian, J. Catalan, J.-C. Auffray, and K. Saıd. 2005.Reproductive trait divergence and hybrid fertility patterns between chro-mosomal races of the house mouse in Tunisia: analysis of wild andlaboratory-bred males and females. Biol. J. Linn. Soc. 84:407–416.
Coyne, J. A., and H. A. Orr. 2004. Speciation. Sinauer Associates, Sunderland,MA.
Cucchi, T., J. D. Vigne, and J.-C. Auffray. 2005. First occurrence of thehouse mouse (Mus musculus domesticus Schwarz & Schwarz, 1943) inthe Western Mediterranean: a zooarchaeological revision of sub-fossilhouse mouse occurrences. Biol. J. Linn. Soc. 84:429–445.
Dallas, J. F., F. Bonhomme, P. Boursot, J. Britton-Davidian, and V. Bauchau.1998. Population genetic structure in a Robertsonian race of house mice:evidence from microsatellite polymorphism. Heredity 80:70–77.
Davisson, M. T., and E. C. Akeson. 1993. Recombination suppression by het-erozygous Robertsonian chromosomes in the Mouse. Genetics 133:649–667.
Dietrich, W. F., J. Miller, R. Steen, M. A. Merchant, D. Damron-Boles, Z.Husain, R. Dredge, M. J. Daly, K. A. Ingalls, T. J. O’Conner, et al. 1996.A comprehensive genetic map of the mouse genome. Nature 380:149–152.
Dumas, D., and J. Britton-Davidian. 2002. Chromosomal rearrangements andevolution of recombination: comparison of chiasma distribution patternsin standard and Robertsonian populations of the house mouse. Genetics162:1355–1366.
Evanno, G., S. Regnaut, and J. Goudet. 2005. Detecting the number of clustersof individuals using the software STRUCTURE: a simulation study. Mol.Ecol. 14:2611–2620.
2 0 3 0 EVOLUTION JULY 2010

GENE FLOW IN A CHROMOSOMAL HYBRID ZONE
Falush, D., M. Stephens, and J. K. Pritchard. 2003. Inference of populationstructure using multilocus genotype data: linked loci and correlated allelefrequencies. Genetics 164:1567–1587.
Franchini, P., R. Castiglia, and E. Capanna. 2008. Reproductive isolation be-tween chromosomal races of the house mouse Mus musculus domesticusin a parapatric contact area revealed by an analysis of multiple unlinkedloci. J. Evol. Biol. 21:502–513.
Gaggiotti, O. E., O. Lange, K. Rassmann, and C. Gliddon. 1999. A comparisonof two indirect methods for estimating average levels of gene flow usingmicrosatellite data. Mol. Ecol. 8:1513–1520.
Goudet, J. 2001. FSTAT, a program to estimate and test gene diversitiesand fixation indices (version 2.9.3). Institut d’Ecologie, Batiment deBiologie, Universite de Lausanne, Switzerland.
Goudet, J., M. Raymond, T. De Meeus, and F. Rousset. 1996. Testing differ-entiation in diploid populations. Genetics 144:1933–1940.
Guo, S. W., and E. A. Thompson. 1992. Performing the exact test of Hardy-Weinberg proportions for multiple alleles. Biometrics 48:361–372.
Hartl, D. L., and A. G. Clark. 1997. Principles of population genetics. Sinauer,Sunderland, MA.
Hauffe, H. C., and J. B. Searle. 1998. Chromosomal heterozygosity and fer-tility in house mice (Mus musculus domesticus) from northern Italy.Genetics 150:1143–1154.
Heckel, G., R. Burri, S. Fink, J.-F. Desmet, and L. Excoffier. 2005. Geneticstructure and colonization processes in European populations of thecommon vole Microtus arvalis. Evolution 59:2231–2242.
Hewitt, G. M. 1988. Hybrid zones—Natural laboratories for evolutionarystudies. Trend Ecol. Evol. 3:158–167.
Hoffmann, A. A., and L. H. Rieseberg. 2008. Revisiting the impact of in-versions in evolution: from population genetic markers to drivers ofadaptive shifts and speciation? Ann. Rev. Evol. Evol. Syst. 39:21–42.
Hsu, T. C., and J. I. Patton. 1969. Bone marrow preparations for chromosomestudies. Pp. 454–460 in K. Bemirschke, ed. Comparative mammaliancytogenetics. Springer Verlag, Berlin. Heikdelberg, New York.
Kawakami, T., R. K. Butlin, M. Adams, D. J. Paull, and S. J. B. Cooper.2008. Genetic analysis of a chromosomal hybrid zone in the Australianmorabine grasshoppers (Vandiemenella, viatica species group). Evolu-tion 63:139–152.
King, M. 1993. Species evolution, the role of chromosome change. CambridgeUniv. Press, Cambridge.
Louis, E. J., and E. R. Dempster. 1987. An exact test for Hardy–Weinberg andmultiple alleles. Biometrics 43:805–811.
Navarro, A., and N. H. Barton. 2003. Chromosomal speciation and moleculardivergence: accelerated evolution in rearranged chromosomes. Science300:321–324.
Ortiz-Barrientos, D., J. Reiland, J. Hey, and M. A. F. Noor. 2002. Recom-bination and the divergence of hybridizing species. Genetica 116:167–178.
Panithanarak, T., H. C. Hauffe, J. F. Dallas, A. Glover, R. G. Ward, andJ. B. Searle. 2004. Linkage-dependent gene flow in a house mousechromosomal hybrid zone. Evolution 58:184–192.
Pialek, J., H. C. Hauffe, K. M. Rodriguez-Clark, and J. B. Searle. 2001.Raciation and speciation in house mice from the Alps: the role of chro-mosomes. Mol. Ecol. 10:613–625.
Pialek, J., H. C. Hauffe, and J. B. Searle. 2005. Chromosomal variation in thehouse mouse. Biol. J. Linn. Soc. 84:535–563.
Pocock, M. J. O., H. C. Hauffe, and J. B. Searle. 2005. Dispersal in housemice. Biol. J. Linn. Soc. 84:565–583.
Pritchard, J. K., M. Stephens, and P. J. Donnelly. 2000. Inference of populationstructure using multilocus genotype data. Genetics 155:945–959.
Raymond, M., and F. Rousset. 1995. GENEPOP (version 1.2): populationgenetics software for exact tests and ecumenicism. J. Hered. 86:248–249.
Rieseberg, L. H. 2001. Chromosomal rearrangements and speciation. TrendsEcol. Evol. 16:351–358.
Rieseberg, L. H., and J. H. Willis. 2007. Plant speciation. Science 317:910–914.
Rieseberg, L. H., J. Whitton, and K. Gardner. 1999. Hybrid zones and thegenetic architecture of a barrier to gene flow between two sunflowersspecies. Genetics 152:713–727.
Rosenberg, N. 2004. DISTRUCT: a program for the graphical display ofpopulation structure. Mol. Ecol. Notes 4:137–138.
Rousset, F. 1997. Genetic differentiation and estimation of gene flow fromF-statistics under isolation by distance. Genetics 145:1219–1228.
Sage, R. D., W. R. Atchley, and E. Capanna. 1993. House mice as models insystematic biology. Syst. Biol. 42:523–561.
Seabright, M. 1971. A rapid banding technique for human chromosomes.Lancet 2:971–972.
Searle, J. B. 1993. Chromosomal hybrid zones in eutherian mammals. Pp.309–353 in R. G. Harrison, eds. Hybrid zones and the evolutionaryprocess. Oxford Univ. Press, New York.
Sharp, H. E., and D. M. Rowell. 2007. Unprecedented chromosomal diversityand behaviour modify linkage patterns and speciation potential: struc-tural heterozygosity in an Australian spider. J. Evol. Biol. 20:2427–2439.
Shifman, S., J. T. Bell, R. R. Copley, M. S. Taylor, R. W. Williams, R. Mott,and J. Flint. 2006. A high-resolution single nucleotide polymorphismgenetic map of the mouse genome. PLoS Biol. 4:e395.
Slatkin, M. 1995. A measure of population subdivision based on microsatelliteallele frequencies. Genetics 139:457–462.
Spirito, F., A. Modesti, P. Perticone, M. Cristaldi, R. Federici, and M.Rizzoni. 1980. Mechanisms of fixation and accumulation of centricfusions in natural populations of Mus musculus L. I. Karylogical analy-sis of a hybrid zone between two populations in the central Apennines.Evolution 34:453–466.
Van Oosterhout, C., W. F. Hutchinson, D. P. Wills, and P. Shipley. 2004.MICRO-CHECKER: software for identifying and correcting genotypingerrors in microsatellite data. Mol. Ecol. Notes 4:535–538.
Wallace, B. M. N., J. B. Searle, and C. A. Everett. 1992. Male meiosis and ga-metogenesis in wild house mouse mice (Mus musculus domesticus) froma chromosomal hybrid zone; a comparison between “simple” Robertso-nian heterozygotes and homozygotes. Cytogenet. Cell Genet. 61:211–220.
Weir, B. S., and C. C. Cockerham. 1984. Estimating F-statistics for the analysisof population structure. Evolution 38:1358–1370.
White, M. J. D. 1978. Modes of speciation. W. H. Freeman and Company,San Francisco, CA.
Wright, S. 1965. The interpretation of population structure by Fstatistics withspecial regard to systems of mating. Evolution 19:395–420.
Associate Editor: H. Hoekstra
EVOLUTION JULY 2010 2 0 3 1

PAOLO FRANCHINI ET AL.
Supporting InformationThe following supporting information is available for this article:
Table S1. Sample site, population, sex, diploid number, and karyotype of all the 147 individuals studied.
Table S2. Allele frequencies, observed (Ho) and expected (He) heterozygosities, number of alleles (n) for the 12 microsatellite
loci for each population.
Table S3. FST-values for each pair of populations.
Table S4. Average assignment coefficient, Qi , of each population to the eight inferred clusters for the pericentromeric and the
telomeric loci (graphically shown in Fig. 3)
Supporting Information may be found in the online version of this article.
Please note: Wiley-Blackwell is not responsible for the content or functionality of any supporting information supplied by the
authors. Any queries (other than missing material) should be directed to the corresponding author for the article.
2 0 3 2 EVOLUTION JULY 2010