reduced-order parameter optimization for simplifying
TRANSCRIPT

Reduced-order Parameter Optimization for SimplifyingProstate IMRT Planning
Renzhi Lu1, Richard J. Radke1‡, Laura Happersett2, Jie Yang2
Chen-Shou Chui2, Ellen Yorke2, and Andrew Jackson21Electrical, Computer, and Systems Engineering Department,Rensselaer Polytechnic Institute, Troy, NY 121802Department of Medical Physics, Memorial Sloan-Kettering Cancer Center,New York, NY 10021
E-mail: [email protected], [email protected], [email protected],[email protected], [email protected], [email protected],[email protected]
PACS numbers: 87.53.Tf
Keywords: importance factors, IMRT optimization, prostate IMRT planning
Submitted to:Phys. Med. Biol.
‡ Please address correspondence to Richard Radke.
Reduced-order Parameter Optimization for Simplifying Prostate IMRT Planning 2
Abstract.Intensity-modulated radiotherapy (IMRT) has become an effective tool for cancer
treatment with radiation. However, even expert radiation planners still need to spend asubstantial amount of time manually adjusting IMRT optimization parameters such as doselimits and costlet weights in order to obtain a clinically acceptable plan. In this paper, wedescribe two main advances that simplify the parameter adjustment process for five-fieldprostate IMRT planning. First, we report the results of a sensitivity analysis that quantifiesthe effect of each hand-tunable parameter of the IMRT cost function on each clinical objectiveand the overall quality of the resulting plan. Second, we show that a recursive random searchover the 6 most sensitive parameters as an outer loop in IMRT planning can quickly andautomatically determine parameters for the cost function that lead to a plan meeting the clinicalrequirements. Our experiments on a 10-patient dataset show that for 70% of the cases, wecan automatically determine a plan in 10 minutes (on the average) that is either clinicallyacceptable or requires only minor adjustment by the planner. The outer loop optimization canbe easily integrated into a traditional IMRT planning system.
1. Introduction
Intensity-modulated radiotherapy (IMRT) has been called “one of the most importanttechnical advances in radiation therapy since the advent of the medical linear accelerators”(Ling et al., 2004). This computer-controlled method of delivering radiation can preciselyirradiate a target with complex 3-D shape while simultaneously protecting normal radiation-sensitive tissues (Ling et al., 2004, Palta et al., 2004). The IMRT planning problem is usuallysolved by dividing each radiation beam into subcomponent pencil beams (or “beamlets”),and applying numerical optimization algorithms to determine the beamlet intensities suchthat the resultant radiation dose distribution best matches the requirements specified by thephysician. The clinical goals of planning are encapsulated in an objective function that assignsa numerical score to each plan.
A basic difficulty is the formulation of this objective function. IMRT planners typicallyhave to make compromises between competing clinical objectives, e.g., delivering as high andas uniform a dose as possible to the planning target volume (PTV), while sparing organs atrisk (OARs) and normal tissues as much as possible. However, the compromise desired inany given case is not easy to specify in terms of the parameters (e.g., dose limits, weights,importance factors) defining the objective function. Furthermore, the appropriate parametervalues differ from case to case. In current implementations of IMRT, prior knowledge of theseparameters is not available, and planners can spend a substantial amount of time adjustingparameters in order to get a clinically acceptable plan. Despite improvements in the speed ofnumerical optimization procedures, the start-to-finish inverse planning process of obtaining aclinically acceptable IMRT plan for a difficult site can take several hours, largely due to themanual trial-and-error process of adjusting parameters in the objective function (Bedford andWebb, 2003, Bortfeld et al., 2004, Spirou and Chui, 1998). A systematic and partly automatedmethodology would reduce the time wasted in exploring unfruitful parameter sets and aid inreaching the desired planning goals efficiently.

Reduced-order Parameter Optimization for Simplifying Prostate IMRT Planning 3
In this paper, we describe two main advances that simplify the parameter adjustmentprocess: a sensitivity analysis that identifies important parameter/constraint combinations,and an outer-loop optimization algorithm over the sensitive parameter set that can quicklyand automatically determine parameters for the cost function that lead to a plan meetingthe clinical requirements. We focus on the clinical planning procedure applied at MemorialSloan-Kettering Cancer Center (MSKCC), and study prostate cancer treatment planning to aprescription dose of 86.4 Gy with 5-field IMRT (Ling et al., 2004). The paper is organized asfollows. In Section 1.1, we review the types of tunable parameters commonly encountered inIMRT objective functions, and methods for their determination. In Section 2.1, we describeour mathematical formulation for prostate IMRT planning, and introduce our frameworkfor outer-loop parameter optimization. In Section 2.2, we describe methods for sensitivityanalysis that quantify the effect of each hand-tunable parameter of the IMRT cost function oneach clinical objective. In Section 2.3, we describe a score function that ranks a plan basedon how well it satisfies multiple clinical constraints. Section 2.4 describes the parameteroptimization algorithm, which uses a recursive random search algorithm for fast globaloptimization. Sections 3.1 and 3.2 present sensitivity analysis and parameter optimizationresults on a 36-patient dataset using simplified dose calculations. A 10-patient subset is thenevaluated clinically for acceptability following full dose calculation in Section 3.3. Section 4concludes the paper with discussion and ideas for future work.
1.1. Tunable Parameters in IMRT Objective Functions
A typical scalar objective function for IMRT planning is composed of several dose- anddose-volume-based terms (i.e., costlets (Kessler et al., 2005)). Each term includes a doseparameter (i.e., a minimum or maximum limit) or a pair of dose-volume parameters (i.e.,a point on a dose-volume-histogram (DVH) curve), and reflects a clinical objective. Thecostlets are usually combined into a scalar value using a weighted sum that reflects therelative penalty imposed by the planner for not satisfying each objective. While in theory,inverse treatment planning is a one-step, automatic process once the cost function is fixed,in practice, a great deal of trial and error is required to arrive at parameter settings suchthat the resulting minimizer is clinically acceptable (Purdy et al., 2001). The weights (or“importance factors”) are used by the planner to try to “steer” the optimization algorithm tomore clinically desirable solutions (Webb, 2001), but this can be difficult since these weightsare inherently imprecise and unintuitive (Bedford and Webb, 2003). The role of dose limitsin IMRT optimization is also confusing, since it has been observed that in a penalty-basedobjective function, dose limits more stringent than are clinically necessary are frequentlyrequired to obtain convergence to an acceptable plan (see, e.g., (Samuelsson and Johansson,2003, Spirou and Chui, 1998, Starkschall et al., 2001)).
The influence of different sets or distributions of importance factors on the qualitativecharacter of the resulting plans has been investigated (e.g., (Lian and Xing, 2004, Meyer et al.,2004)), but not on a very large scale. Typically, only a few parameter combinations are testedto demonstrate that a difference exists. In contrast, the sensitivity analysis and reduced-order

Reduced-order Parameter Optimization for Simplifying Prostate IMRT Planning 4
models described below integrate results and experience from tens of previously planned casesand thousands of parameter combinations.
Several researchers have investigated methods for easing the planner’s task byautomatically determining good importance factors. Wu and Zhu (Wu and Zhu, 2001) used agenetic algorithm to alternately optimize over importance factors and beam weights. Bedfordand Webb (Bedford and Webb, 2003) eliminated the importance factors by introducing aconstraint-based objective function, and optimized beam weights using simulated annealing.Both approaches were applied to 3D Conformal Radiotherapy (CRT); however, for IMRToptimization, using such stochastic methods would be extremely slow because of the largenumber of beamlets to be determined. One solution is to optimize the beamlet intensitiesusing a fast, deterministic method in an inner loop, while iteratively searching for “good”parameters in an outer loop. Xing et al. (Xing et al., 1999a,b) suggested a ranking functionbased on a plan’s deviation from an ideal DVH for each organ, and showed how the rankingfunction could be minimized to determine the optimal importance factors. However, assumingsimultaneous ideal DVHs for all targets/OARs may not be very realistic from a clinicalperspective, and it is not clear whether this approach can scale up to full IMRT planningproblems.
Fewer publications have investigated the effect of dose limits in penalty-based objectivefunctions. Hunt et al. (Hunt et al., 2002) summarized the influence of optimization parameterson the resulting dose distributions, and observed that dose limits generally have a greaterinfluence than importance factors. They specified a procedure for changes to be made inoptimization parameters given specific deficits in clinical plans. However, this method onlysuggested the direction of change, and was heuristically implemented by hand. Barbiereet al. (Barbiere et al., 2002) searched for the best optimization parameters via structuredgrid searches over historical plans, using a recipe based on empirical knowledge. However,such grid searches might not be suitable for a degenerate parameter space, i.e., one in whichdifferent combinations of parameters lead to similar dose distributions.
Penalty-based scalar objective functions are not the only option for IMRT planning. Arecent focus of interest is multiobjective (MO) optimization, first introduced in (Cotrutz et al.,2001), which results in a representative set of Pareto-efficient solutions for various conflictingoptimization objectives. Craft et al. (Craft et al., 2005) showed how to find the Pareto-efficientspace of solutions for MO optimization, and developed an interface for the planner to examinethe way the tradeoffs change when the optimization parameters are altered. Other recentapproaches were described by Romeijn et al. (Romeijn et al., 2004) and Yu (Yu, 1997).While neither the trial-and-error tweaking process described above nor prior knowledgeabout the parameters is required, a major drawback of the MO approach is speed, sincea large number of full-dose-calculated candidate plans need to be generated. Furthermore,given a set of solutions, the problem of choosing the “best” one from a clinical and patient-specific perspective still remains (Amols and Ling, 2002). A decision-making process thatincorporates clinical reasoning was introduced by Meyer et al. (Meyer et al., 2004), but it onlyworks when the trade-offs between different plans are very large. Another natural approach isto cast IMRT as a constrained minimization problem (see, e.g., (Romeijn et al., 2003, Shepard
Reduced-order Parameter Optimization for Simplifying Prostate IMRT Planning 5
et al., 1999)), but this is still not the clinical standard, since efficiently solving such problemswith DVH-based constraints is very difficult. We also note that Starkschall et al. (Starkschallet al., 2001) described an approach to treatment planning based on an applying an automaticsearch algorithm to simply find a feasible solution to all the constraints. However, in case nofeasible solution is found, manual trial-and-error relaxation of constraints is still necessary,and the approach seems difficult to scale from CRT to IMRT.
In this study, we concentrate on penalty-based objective functions consisting of dose anddose-volume terms, since these are the norm in clinical IMRT planning (Langer et al., 2003).However, we note that the tools developed below would be mathematically general enoughto apply to parameter estimation problems in dose-response-based objective functions, e.g.,those based on TCP, NTCP, the equivalent uniform dose (EUD) (Wu et al., 2002), or the effect-volume histogram (EVH) (Alber and Nusslin, 2002). Furthermore, the sensitivity analysis wepropose may also be useful in a multiobjective context (e.g., by indicating which combinationsof objectives on the Pareto front are worth exploring).
2. Materials and Methods
2.1. IMRT Planning for the Prostate
To meet the clinical goals, we use the quadratic dose-based objective function implementedat MSKCC (Spirou and Chui, 1998, Ling et al., 2004), and determine the beamlet intensitiesby numerical optimization. For thekth target, the corresponding objective function term is:
Ftargetk =1
Nk
(Nk∑i=1
(Di −Dpresk)2 + wmink
Nk∑i=1
(Di −Dmink)2 ·Θ(Dmink
−Di)
+wmaxk
Nk∑i=1
(Di −Dmaxk)2 ·Θ(Di −Dmaxk
)
),
(1)
where Nk is the number of points in the target, andDi is the dose to theith point inthe target. Dpresk
is the prescription dose, andDminkand Dmaxk
are the minimum andmaximum dose allowed without penalty.wmink
andwmaxkare the penalties (weights) for
under- and over-dosing, andΘ(x) is the Heaviside function. The choice of the parameter setPk = {Dpresk
, Dmink, Dmaxk
, wmink, wmaxk
} completely specifies the objective function fortargetk. A similar objective function term is defined for each organ at risk (OAR), which alsoincludes parametersDdvk
andwdvkthat define the dose-volume-histogram (DVH) constraints:
FOARk=
1
Nk
(wmaxk
Nk∑i=1
(Di −Dmaxk)2 ·Θ(Di −Dmaxk
)
+ wdvk
Ndvk∑i=1
(Di −Ddvk)2 ·Θ(Di −Ddvk
)
,
(2)
where the sum in the second term is carried out over the lowestNdvkdoses that are greater

Reduced-order Parameter Optimization for Simplifying Prostate IMRT Planning 6
Targets Dpres Dmin wmin Dmax wmax
PTVE 100% 98% 50 102% 50Overlap 84% 83% 10 85% 20
Mid 98% 97% 10 99% 10
Table 1: Default parameters for the targets.
OARs Dmax wmax Ddv wdv VolumeRectOE 85% 20 30% 20 30%BladO 96% 35 30% 20 30%
Table 2: Default parameters for the OARs.
thanDdvk, andNdvk
is the minimum number of point dose changes required to bring thekthorgan into compliance with the DVH constraint (Spirou and Chui, 1998).
At MSKCC, a typical prostate plan objective function has 3 target structures (theexpanded PTV, or PTVE; the overlap region between the PTV and rectum, or Overlap; and acylindrical structure near the center of the PTV for the protection of the urethra, or Mid), aswell as 2 OAR structures (the expanded outer rectal wall, or RectOE; and the outer bladderwall, or BladO).§ Hence we can formulate the overall intensity optimization problem as:
I∗(P ) = arg minI
(Ntarget∑
j=1
Ftargetj(D(I), P ) +
NOAR∑
k=1
FOARk(D(I), P )
), (3)
whereP = {Pj, j = 1, . . . , Ntarget, Pk, k = 1, . . . , NOAR} is the set of about 20 dose limitsand weights for all the optimization structures that defines the objective function.‖ The currentMSKCC clinical evaluation protocol requires that the plan for IMRT treatment of the prostateto 86.4 Gy satisfies the following conditions: (1) for the PTV,V95 ≥ 87%, andDmax ≤ 111%,(2) for the rectal wall,V87 ≤ 30%,V54 ≤ 53%, andDmax ≤ 99%, and (3) for the bladderwall, V54 ≤ 53% . All doses are expressed as percentage of the prescription dose, and thenotationVx means the structure volume percentage receiving at least x% of the prescriptiondose. The parametersP must be carefully selected, usually by an expert planner’s judgmentand/or manual iterations, to obtain a clinically acceptable dose distribution that satisfies theconstraints of the protocol, as illustrated in Figure 1a. As described above, determining viableparameter values is not an immediate, one-step process for several reasons, the main onebeing that the sum-of-penalties form of the objective function is not guaranteed to force theresulting solution to fully satisfy the clinical constraints. Tables 1 and 2 list the defaultparameter settings specified in the current protocol, which serve as the starting points formanual adjustment.
Our goal in this paper is to automatically find a set of parameters such that the minimizerof the corresponding IMRT objective function satisfies the clinical constraints. One optionwould be to perform an exhaustive search over the approximately 20-dimensional parameterspace as in (Xing et al., 1999a,b), which would be computationally inefficient. Instead, we
§ The expanded structures are slightly larger than the corresponding anatomical structures. These “dummy”structures are used by MSKCC planners to guide their particular optimization algorithm to a more clinicallydesirable solution. Evaluation of the resulting plan is done on the basis of dose to the true anatomical structures(e.g. the PTV and the rectal wall).‖ Equation (3) reflects MSKCC’s clinical practice that the prescription dose weights for all targets are equal to1. In theory, these weights could be independently adjusted, but in practice, the planners find that adjusting theweights on the minimum and maximum dose constraints allows them to achieve satisfactory clinical outcomes.

Reduced-order Parameter Optimization for Simplifying Prostate IMRT Planning 7
Intensity
Optimization
I*=argmin F(D(I),P)
Update
Parameters P
Intensities I*
Parameters P*Acceptable?
Yes
No
Patient Geometry,
Beam Settings
Planner
Assessment
(a)
(b)
Ranking
R(D(I*),P)R minimized?
Intensity
Optimization
I*=argmin F(D(I),P)
Update Sensitive
Parameters P’
Intensities I*
Parameters P*
Yes
No
Patient Geometry,
Beam SettingsAcceptable?
Yes
No
Planner
Assessment
Further
Manual
Adjustment
Figure 1: Clinical planning and our proposed outer-loop algorithm. (a) In the clinic, aplanner manually adjusts a set of patient-specific parametersP defining a cost function, andoptimizes the cost function using an automatic algorithm (shaded box). If all constraints ofthe protocol are satisfied and the plan is judged to be acceptable, the resulting beam intensitiesare used to treat the patient. (b) We propose to replace the dotted box with an algorithm thatautomatically determines a parameter set that will result in a clinically acceptable plan. Apatient-independent ranking functionR reflecting the constraints of the protocol is minimizedin an outer loop over a small subset of the parameters, determined based on sensitivityanalysis.
performed a sensitivity analysis to evaluate the way weights and dose limits affect the clinicalconstraints, and more importantly, to identify the critical parameters that really have an impacton inverse planning.
We obtained clinical five-field, 86.4 Gy IMRT plans for 36 prostate cancer patients fromMSKCC, all created by experienced planners; the access to this data was approved by theMSKCC Privacy Review Board. These hand-tuned clinical plans were referred to as groundtruth. Our automated parameter optimization used the same CT data and beam directions, butthe tunable parametersP , and hence the intensities, were chosen according to the followingprocedure. We first performed the sensitivity analysis (discussed in the next section) on thefirst 5 patients, and the resulting sensitivity measures were averaged over these patients todetermine the sensitive set. Since patients were numbered randomly, these five patients hadno obvious connections with each other. Then we performed a two-loop optimization overall 36 patients, as illustrated in Figure 1b. The inner loop optimized the intensity distributiongiven a parameter setP , and the outer loop optimized the sensitive parameter setP ′ withrespect to a patient-independent ranking functionR that reflects how well a plan satisfiesthe clinical evaluation criteria. An approximate dose calculation algorithm was applied inthe outer loop to increase speed while maintaining accuracy (see Section 2.3). The resultantdose statistics were compared with those from the clinical ground truth. Finally, 10 randomly

Reduced-order Parameter Optimization for Simplifying Prostate IMRT Planning 8
selected plans were evaluated by the same physicist with extensive experience with prostateplanning at MSKCC.
The automatically generated plans (i.e., parameter sets and field intensities) might notcoincide with the clinical plans, due to the mathematical degeneracies discussed in the nextsection. For the purpose of the experiment, we assume that the quality of the plan is definedentirely by the degree to which the clinical constraints described above are satisfied.
The protocol at MSKCC requires that, prior to evaluation of a treatment plan, the dosedistribution is normalized so that the maximum dose to the PTV is equal to 110%. Sinceour goal is to be able to clinically evaluate the outer-loop plans and directly compare them toplans for the same patients produced in the clinic, all of our sensitivity analysis refers to theresponse variables of plans after this normalization.
2.2. Parameter/Constraint Sensitivity Analysis
The goal of sensitivity analysis is to automatically divide the parameter set defining the IMRTobjective function into 3 subsets:
(i) The fixed set, in which the parameters are held approximately constant by the plannersin practice.
(ii) The sensitive set. Varying any element of this set of parameters will greatly affect theplan evaluation.
(iii) The insensitive set. The statistics of plan evaluation are not significantly influenced bythis set of parameters. This leads to the degeneracy problem, i.e., that different sets ofparameters can lead to similar dose distributions.
The first set is easy to identify; for prostate planning at MSKCC, it includes: (1) theprescription dose for PTVE (100% by definition); (2) the maximum and minimum dose forPTVE, Overlap and Mid, which are always of the formDpres±1% or Dpres±2%; and (3) thevolume of RectOE constrained to a particular dose, which is always 30%. The planners havefound empirically that they can arrive at acceptable solutions while keeping these parametersfixed. However, it is less obvious which of the remaining parameters are in the sensitive setand which are not.
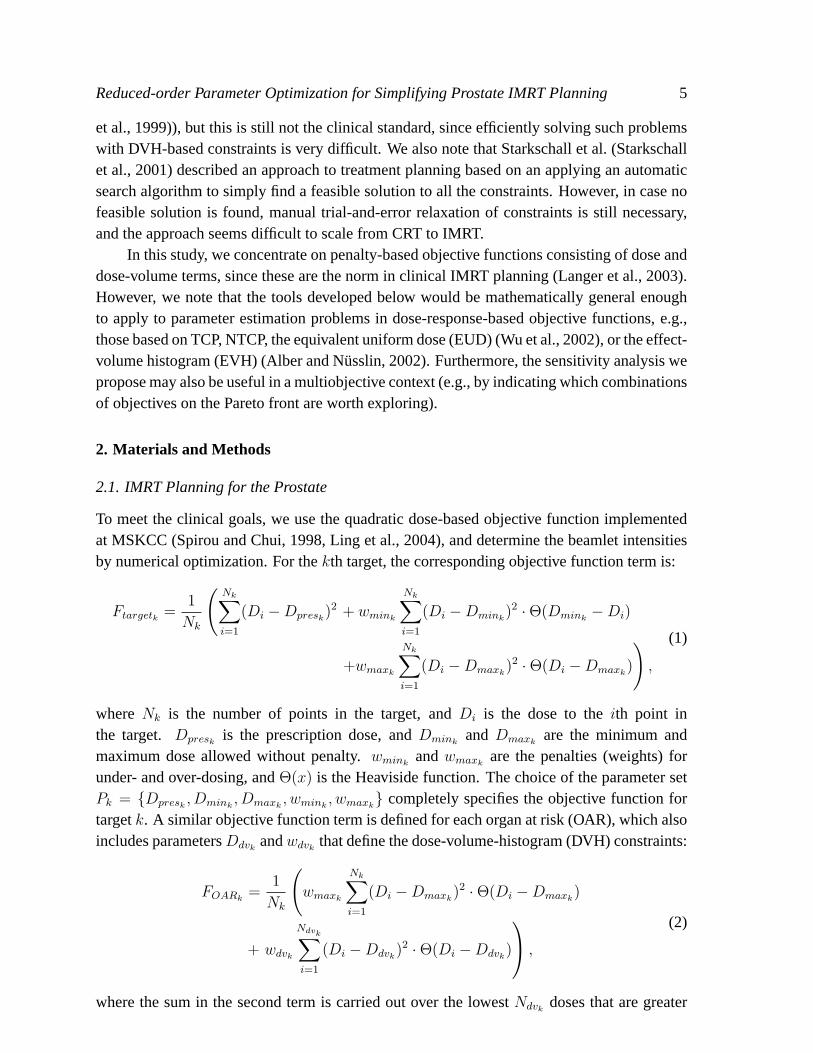
We illustrate the idea of sensitivity analysis for prostate IMRT with a motivating example.We vary two parameters, the weights for PTVE Dmax and Dmin, and hold the otherparameters of the objective function constant. The beamlet intensities are then optimizedusing each set of parameters and the clinical dose statisticV PTV
95 is evaluated. Subsequently,the RectOE Dmax, BladO Dmax and RectoE DVH doses were incremented by 10% andthe process repeated. As shown in Figure 2,V PTV
95 coverage is very sensitive to PTVEDmin weight. It is also influenced by the combination of RectOE Dmax, BladO Dmax andRectOE DVH doses. As we loosen the OAR requirements by increasing the dose limits in thiscombination,V PTV
95 improves significantly. However,V PTV95 is relatively insensitive to PTVE
Dmax weight.To quantify this intuition for all parameters and planning goals, we carried out a
systematic sensitivity analysis for the prostate. We note that in the context of constrained
Reduced-order Parameter Optimization for Simplifying Prostate IMRT Planning 9
0.4
0.5
0.6
0.7
0.8
0.9
1
PT
VE
V95
RectOE Dmax=60%, RectOE Ddvh =20%, BladO Dmax=60%
RectOE Dmax=70%, RectOE Ddvh =30%, BladO Dmax=70%
RectOE Dmax=80%, RectOE Ddvh =40%, BladO Dmax=80%
RectOE Dmax=90%, RectOE Ddvh =50%, BladO Dmax=90%
RectOE Dmax=100%, RectOE Ddvh =60%, BladO Dmax=100%
0
50
100
150
0
50
100
150
PTVE Dmax w
eight
PTV
E D
min w
eight
0.7
0.8
0.9
Figure 2: Example of sensitive/insensitive parameters.V PTV95 is displayed as a function of the
PTVE Dmax weight and Dmin weight. The relationship is also controlled by RectOE maxdose, RectOE DVH dose and BladO max dose.
optimization, Alber et al. (Alber et al., 2002) reported the sensitivity of the objective functionwith respect to changes in dose limits using a Lagrange multiplier approach; however, suchLagrange information is not available in our unconstrained problem (3). We applied MonteCarlo simulation to measure the sensitivity of all clinical output variables (i.e., the dose anddose-volume constraints that determine the clinical acceptability of a plan), with respect tothe tunable input parameters (i.e., the dose and dose-volume limits and penalties used inoptimization). First, we determined the natural range of input parameters based on the valuesobserved over all the training patients. Then, for each training patient, we generated 2000full sets of input parameters from this range by Latin hypercube sampling (a particular caseof stratified sampling that achieves a better coverage of the space of input parameters (Saltelliet al., 2004)). For each set of input parameters, we then minimized the corresponding IMRTcost function using the conjugate gradient method used in the clinic (Spirou and Chui, 1998),and obtained the values of the clinical output variables. Finally, we quantified the sensitivity ofeach input/output combination using three statistical measures. Using these measures, we cantest whether the following hypothesis is true: “no correlation exists between IMRT outcomeYj and IMRT parameter settingXi at the 95% confidence level”. In the subsequent parameteradjustment (either by the planner’s manual adjustment or by an outer-loop optimization aswe describe below), only a small subset of the parameters, i.e., the sensitive set, needs to beexplored, which will decrease the dimensionality of the parameter space significantly. Theother parameters are simply fixed to their defaults.
Suppose we generateM samples, each of which consists of a scalar clinicaloutcomeY , and N independent IMRT parametersX1, · · · , XN . From theM samples

Reduced-order Parameter Optimization for Simplifying Prostate IMRT Planning 10
{(Yi, Xi1, · · · , XiN), i = 1, · · · , M}, we compute the following statistics betweenY andXj, j = 1, . . . , N (Kutner et al., 2004):
• The linear correlation coefficient, also known as the Pearson product moment correlationcoefficient (PMCC):
PMCC(Xj, Y ) =1
M−1
∑Mi=1(Xij − Xj)(Yi − Y )
Std(Xj)Std(Y ), (4)
where· andStd(·) represent the mean value and the standard deviation of a variable.
• The partial correlation coefficient (PCC):
PCC(Xj, Y ) = PMCC(Xj − Xj, Y − Y ), (5)
whereXj = b0 +∑
k 6=j bkXk andY = c0 +∑
k 6=j ckXk represent the linear regressionsfrom Xk, k 6= j ontoXj andY . Thus, the PCC provides a measure of the strength of thelinear relationship between two variables after a correction has been made for the lineareffects of the other variables in the analysis.
• The standardized rank regression coefficients (SRRC):
SRRC(Xj, Y ) =bjStd(Rank(Xj))
Std(Rank(Y )), (6)
where Rank(·) is the transformation that replaces the data points with theircorresponding ranks, i.e., rank 1 is assigned to the smallest observation and rank Mto the largest observation.bj is the linear regression coefficient fromRank(Xj) ontoRank(Y ). The problem associated with poor linear fits to nonlinear data can often beavoided with the use of rank transformations.
2.3. Scoring Candidate Plans
We next require a score functionR(P ) that quantifies the degree to which the dose distributionprovided by minimizing the optimization function with parametersP meets the clinicalconstraints. As described above, the treatment protocol is usually expressed in terms of severalpoints on the DVH curves. Thus, we use a score function based on these key points, ratherthan an entire ideal DVH curve for each organ as in (Xing et al., 1999a).
Under the clinical protocol for 86.4 Gy prostate IMRT at MSKCC, we try to maximizethe target dose coverageV PTV
95 and cold-spotDPTVmin , while minimizing the rectal wall hot-spot
Drectwallmax , as well as certain points on the OAR DVH’s:V rectwall
87 , V rectwall54 , andV bladwall
54 . Inaddition, the planners usually try to push the middle constraint of the rectum (i.e.,V rectwall
54 )to the protocol limit. Hence, we used a score function of the form:
R(D) = α1 · g(87− V PTV95 (%)) + α2 · g(75−DPTV
min (%)) + α3 · g(V rectwall87 (%)− 30)
+ α4 · g(Drectwallmax (%)− 99) + α5 · g(V bladwall
54 (%)− 53)
+ α6 · g(V rectwall54 (%)− 53) + α7 · g(48− V rectwall
54 (%)),
(7)

Reduced-order Parameter Optimization for Simplifying Prostate IMRT Planning 11
where g(x) =
{1000 · x x ≥ 0
x x < 0, which severely punishes the violation of clinical
constraints. The parametersα6 andα7 work together to penalize deviation ofV rectwall54 outside
the interval [48%, 53%], to achieve the clinical goal of pushingV rectwall54 to the protocol limit.
The parametersαi should reflect the emphasis placed by planners on individual clinicalconstraints, and differ from the weight terms in (3). For example, maximizing PTV coverageis usually considered more important than achieving stricter OAR protection than requiredby the clinical evaluation guidelines described in Section 2.1. Also, order statistics such asmaximum doses are too noisy to assign a very large weight. The allocation that we usedin our experiments in Section 3 below wasα1 = 1000, α2 = 10, αi = 1, i = 3, 4, andαi = 100, i = 5, 6, 7. Any deviation from the planner’s expectation of a “good plan” resultsin a high positive score. Conversely, a negative score usually means that all the constraints aresatisfied.
One natural question about the proposed approach has to do with the choice of rankingfunction in (7). Aren’t the coefficientsαi just different kinds of importance factors that stillneed to be tuned by a human? There are two key differences between theαi in (7) and thedose limits and weights in (3). First, we show in Section 3.2 below that the same set ofαi
was reasonably successful for the automatic outer-loop planning of all of the patients in ourstudy (see Figure 6), whereas “good” weights and dose limits in (3) vary widely from patientto patient. This implies that the work of choosing a good ranking function would only needto be done once for a given clinical protocol and anatomic class, not once for every patient.Second, the outer-loop plan quality is relatively insensitive to the exact values of theαi– onlyorder-of-magnitude differences have an effect. The main function of theαi is to reflect theclinical evaluation protocol and the expert planner’s opinion about which constraints are mostimportant to satisfy. The goal is to produce a scalar function that roughly reflects the humanevaluation process.
In our initial experiments, we set allαi equal to 1. The optimization of (7) resembled afeasibility search, since the mere satisfaction of each constraint was emphasized over furtherimprovement viag(x). Most of the plans terminated with a negative ranking score, but theconstraints (especially for the PTV) were barely satisfied. According to clinical evaluationfeedback from MSKCC, planners preferred a further improvement in PTV coverage whilesaturating the rectum middle constraint. Hence, in our second attempt we increasedα1 andα2
to reward improvement in the PTV constraints. Instead of changing theαi on a fine scale, weonly selected an order of magnitude for eachαi that seemed sufficient to reflect the clinicalexpectations. A sample of how the optimization result changes with different settings ofαi is listed in Table 3. Both Settings 2 and 3 emphasize PTV coverage, but with differentmagnitudes. Setting 4 puts more emphasis on OAR protection. We can see that the number ofcases that met all the constraints (based on corrected-dose calculations, see below) is basicallyinsensitive to the 4 different settings, although theαi values are quite different. For Settings 2and 3, moderate changes ofαi result in quite similar dose distributions. Comparing Settings2 and 4, the differences in the orders of magnitude of theαi related to the PTV and OARsdetermine which response variables are pushed beyond the protocol requirements. While we

Reduced-order Parameter Optimization for Simplifying Prostate IMRT Planning 12
Setting α1 α2 α3 α4 α5 α6 α7
1 1 1 1 1 1 1 02 1000 10 1 1 100 100 1003 1500 100 1 1 50 50 504 1 1 100 100 100 100 0
Setting # pass V PTV95 DPTV
min V blad54 V rect
87 V rect54 Drect
max
1 33 87.8 (2.1) 74.1 (2.7) 33.2 (8.4) 10.7 (3.5) 43.8 (5.2) 96.1 (2.1)2 34 92.7 (2.8) 78.1 (4.1) 37.0 (9.1) 11.3 (4.3) 51.1 (2.9) 96.8 (1.7)3 35 92.9 (2.5) 78.7 (4.3) 38.4 (7.9) 12.2 (4.1) 51.2 (2.6) 97.0 (1.4)4 33 87.2 (2.0) 72.6 (3.3) 31.3 (6.3) 8.2 (2.8) 40.5 (4.8) 95.3 (1.9)
Table 3: A summary of the outer-loop optimization results for all 36 patients, with respect todifferent settings of{αi}. “# pass” refers to the number of cases that satisfied all the clinicalconstraints, based on corrected dose calculations. All dose statistics (given in %) are the meanvalues over all 36 patients, with standard deviations in parentheses.
applied Setting 2 in the experiments reported in Section 3, Setting 4 might be a good choicefor a more conservative protocol.
Both intensity optimization in the inner loop and plan ranking in the outer loop wereperformed with approximate dose calculations to reduce computation time. For optimization,MSKCC utilizes a truncated pencil beam method which accounts only partly for scattereddose (Spirou and Chui, 1998, Ling et al., 2004), although the calculation for clinical evaluationincludes full scatter. We apply the same truncated method in the inner loop for speed.However, the full dose calculation is too time-consuming to be applied in each outer loopiteration. Siebers et al. (Siebers et al., 2002) proposed a hybrid method that leveragedthe speed of a fast pencil-beam algorithm yet achieved the accuracy of optimization fromsuperposition/convolution algorithms via the application of dose correction matrices. Weadopt the same strategy, but keep the correction matrix constant during each outer loopiteration. That is, at the first outer-loop iteration, we compare the truncated and fulldose calculation for each voxel in the treatment volume, and compute the local correctionratio Dfull
Dtruncatedfor each voxel. In subsequent iterations, we only perform truncated dose
calculations but scale the result by the correction ratio to improve the consistency with thetrue full dose (see the Appendix for more details). In summary, there are 3 different dosecalculation methods being used: (1) the truncated dose kernel calculations (T-D) used by theoptimization’s inner loop, (2) the “corrected” dose calculations (C-D) used in the outer loop,and (3) the full dose calculations (F-D) used for clinical planning and evaluation (and also toestimate the correction ratio).
2.4. Parameter Optimization Algorithm
The score function (7) is not differentiable with respect to the parameter vector, since themapping between the parameters and the optimized intensities is not differentiable in (1) and

Reduced-order Parameter Optimization for Simplifying Prostate IMRT Planning 13
(2). Hence, we cannot use derivative-based local search methods such as quasi-Newton orsteepest descent. Instead, to minimize over the sensitive setP
′, we adopt the recursive random
search (RRS) algorithm proposed in (Ye and Kalyanaraman, 2003), which is based on randomsampling. The efficiency of random sampling is high at initial samples, but falls sharply atlater samples. This observation led to the idea of restarting the sampling before its efficiencydrops off, either by moving or resizing the sample space according to sample history. The RRSalgorithm searches the parameter space in two recursive steps: exploration and exploitation.The exploration step examines the macroscopic features of the objective function (e.g., convexor valley-like structure) and attempts to identify promising areas in the parameter spaceP ′ thatwill be investigated in the exploitation step. RRS performs exploitation in two iterative steps:(i) random sampling within the current space, and (ii) realignment or shrinkage. In this way,most trivial subspaces will be excluded from exploitation, improving the overall efficiency ofthe search.
The time required for planning depends on the number of iterations in the outer-loopparameter selection algorithm. We define the following stopping criteria for the outer loop:(1) if the current ranking function is negative, and no more improvement is observed afterthe next 20 iterations; or (2) if the current ranking function is still positive, but no moreimprovement is observed after the next 100 iterations.
For comparison, we also performed global minimization using the controlled randomsearch (CRS) algorithm (Price, 1983). CRS randomly generates a population ofn points, andperforms a downhill simplex move (e.g., reflections, expansions, and contractions) within arandom subset of then points. The population ofn points is updated by removing the worstelements as better points are obtained during the downhill simplex moves.
3. Results
3.1. Sensitivity Analysis
For each of the five training patients, we randomly generated 2000 parameter combinations asdescribed above, minimized the corresponding IMRT cost function, and obtained the valuesof six response variables:V PTV
95 , DPTVmin , V rectwall
87 , V rectwall54 , V bladwall
54 , andDrectwallmax . For each
objective function parameter/response variable combination, we computed the measures ofsensitivity given by the Pearson product moment correlation coefficient (PMCC), the PartialCorrelation Coefficient (PCC), and the Standardized Rank Regression Coefficient (SRRC),described in Section 2.2.
The sensitivity measures differ from patient to patient, since the optimized dosedistributions and the compromises in the optimization depend strongly on the shape andposition of the target and normal tissue (Hunt et al., 2002). To make the result applicableacross a general population, we averaged the correlation measures across the first five patientsto determine the parameter sensitivities. Table 4 summarizes the measures forV PTV
95 withrespect to all of the parameters. The values of PMCC and SRRC are similar, indicating thatlinear vs. nonlinear regression models make little difference for this problem. PCC measures

Reduced-order Parameter Optimization for Simplifying Prostate IMRT Planning 14
Parameter Name PMCC PCC SRRCRectOE DVH Dose 0.45 0.66 0.47RectOE Dmax Dose 0.44 0.65 0.50PTVE Dmax Weight 0.39 0.60 0.37BladO Dmax Dose 0.24 0.25 0.21BladO DVH Dose 0.10 0.15 0.11Mid Dpres Dose 0.08 0.13 0.06
Mid Dmin Weight 0.02 0.05 0.02PTVE Dmin Weight -0.02 -0.02 -0.03Mid Dmax Weight -0.02 -0.00 -0.02
BladO DVH Weight -0.02 -0.04 -0.04BladO Dmax Weight -0.06 -0.17 -0.09
RectOE Dmax Weight -0.08 -0.10 -0.05Overlap Dmin Weight -0.10 -0.18 -0.11Overlap Dmax Weight -0.12 -0.28 -0.16RectOE DVH Weight -0.27 -0.47 -0.28
Table 4: PMCC, PCC and SRRC ofV PTV95 coverage with respect to all the parameters.
The parameters are ordered from highest to lowest PMCC, which generally agrees with theordering with respect to PCC and SRCC.
are larger in magnitude than PMCC or SRRC, which leads to the conclusion that the costfunction parameters do not affect the IMRT evaluation objectives independently. The overallranking of the parameters is generally consistent for all three measures.
Figure 3a represents the PCC statistics for all the parameter/constraint combinationsusing a swatch chart, where a darker color signifies a higher correlation. In this view, thesensitive and insensitive sets can easily be visually separated. In Figure 3b, we illustratethe average PCC values for the overall outer-loop score function (7) withα1 = 1000, α2 =
10, αi = 1, i = 3, 4, andαi = 100, i = 5, 6, 7. From the averaged measures over the 5patients, we can identify the 6 most influential factors: PTVE Dmin weight, PTVE Dmaxweight, RectOE Dmax dose, RectOE DVH dose, RectOE DVH weight, and BladO Dmaxdose. Although the relative ranks differed slightly for the 5 training patients (e.g., due to thevariations in patients’ geometry), the set containing the 6 most sensitive variables remainedthe same. Thus, the dimensionality of the sensitive parameter space can be reduced to 6.Based on the clinical plans in our experiment, we limit the range of variation in the subsequentparameter search as indicated in Table 5.
The influence of the differentαi settings discussed in Table 3 on the sensitivity analysisis shown in Table 6. Since the sensitivity of the ranking function is related to that of eachconstraint response variable, as well as the way they are combined, we expect changes inthe values of the sensitivity measures. However, the sensitive sets only differ slightly amongthe 4 settings. In Settings 1 and 4 where PTV coverage is deemphasized, the two additionalparameters BladO DVH dose and BladO DVH weight enter the sensitive set. Thus, an 8-dimensional parameter space would accommodate all 4 settings.
To determine the sensitive set above, we randomly chose 5 out of the 36 patients. The

Reduced-order Parameter Optimization for Simplifying Prostate IMRT Planning 15
V95_PTV Dmin_PTV V87_rectwall V54_rectwall Dmax_rectwall V54_rectwall
PTVE Dmin Weight
PTVE Dmax Weight
RectOE Dmax Dose
Overlap Dmin Weight
Overlap Dmax Weight
Mid Dpre Dose
Mid Dmin Weight
Mid Dmax Weight
RectOE Dmax Weight
RectOE DVH Dose
RectOE DVH Weight
BladO Dmax Dose
BladO Dmax Weight
BladO DVH Dose
BladO DVH Weight
(a)
−0.8 −0.6 −0.4 −0.2 0 0.2 0.4 0.6
PTVE Dmin Weight
PTVE Dmax Weight
RectOE Dmax Dose
Overlap Dmin Weight
Overlap Dmax Weight
Mid Dpre Dose
Mid Dmin Weight
Mid Dmax Weight
RectOE Dmax Weight
RectOE DVH Dose
RectOE DVH Weight
BladO Dmax Dose
BladO Dmax Weight
BladO DVH Dose
BladO DVH Weight
(b)
Figure 3: (a) A swatch chart representing PCC values for all the input parameters, with respectto each output dose evaluation statistic. The gray level indicates the strength of the correlationas follows: empty indicates an absolute value of less than 0.1; a light tone indicates an absolutevalue between 0.1 and 0.3; a moderate tone indicates an absolute value between 0.3 and 0.5;and a dark tone indicates an absolute value greater than 0.5. Boxes with normal outlinesindicate positive correlation; boxes with thicker outlines indicate negative correlation. (b)Average PCC values for the overall score function (7) withα1 = 1000, α2 = 10, αi = 1, i =
3, 4, andαi = 100, i = 5, 6, 7. The range bars indicate the minimum and maximum values ofthe PCC over the 5 training patients. From these visualizations, the most sensitive parameterscan easily be visually identified.

Reduced-order Parameter Optimization for Simplifying Prostate IMRT Planning 16
Parameter Lower Upper Default Clinical rolePTVE Dmax Weight 20 250 50 limit PTV max dosePTVE Dmin Weight 20 250 50 ensure PTV V95RectOE Dmax Dose 60% 100% 85% limit rectwall Dmax,V87RectOE DVH Dose 20% 60% 30% limit rectwall V54
RectOE DVH Weight 10 100 20 limit rectwall V54 ,V87BladO Dmax Dose 60% 100% 96% limit bladwall Dmax
Table 5: The search range, default values, and clinical roles of the sensitive set of parameters.
Setting Sensitive parameters1 PTVE Max/Min weight; RectOE Max dose, DVH dose/weight; BladO DVH dose/weight2 PTVE Max/Min weight; RectOE Max dose, DVH dose/weight; BladO Max dose3 PTVE Max/Min weight; RectOE Max dose, DVH dose/weight; BladO Max dose4 PTVE Max/Min weight; RectOE Max dose, DVH dose/weight; BladO Max dose, DVH dose/weight
Table 6: A summary of the sensitivity analysis result for the 5 training patients, with respectto different settings of{αi}. Settings 1 to 4 correspond to the values in Table 3.
purpose was to show that the sensitivities from a small subset of patients can be appliedto a broader population without requiring patient-specific analysis. Prior information aboutthe remaining patients did not play a role, since we feel it is important to preserve theseparation of training data from testing data. However, Figure 4 illustrates an after-the-factsensitivity analysis for all 36 patients, indicating the number of patients for which a particularparameter/constraint combination had an absolute PCC value of greater than 0.3. Comparedto Figure 3, the patient-specific sensitivities are generally in accordance with what we learnedfrom the 5 training patients. The only major difference is that a subset of patients (11 out of36) are sensitive to BladO DVH dose and BladO DVH weight, which were not in the originalsensitive set.
3.2. Parameter Optimization
We first tested the convergence performance of our parameter optimization method. In theinner loop for intensity optimization, we applied the conjugate gradient method from (Spirouand Chui, 1998), the same method used in the MSKCC planning system. The quadraticobjective function (3) usually converged in 20 to 30 iterations. In the outer loop, we searchedfor the optimum parameters in the reduced parameter set using the RRS method, and as acomparison, using controlled random search (CRS). The parameter search in all cases startedfrom the default values supplied by the clinical protocol (see Tables 1 and 2). Two examplesof iterative optimization are shown in Figure 5 (top). For Patient 3, we found a set ofparameters which satisfies all the constraints (based on the corrected dose calculations, or C-D) within 28 iterations using RRS, compared to 95 iterations using CRS. The optimized scorefunction valueR(D) was -383.06, indicating that all the clinical constraints are satisfied. For

Reduced-order Parameter Optimization for Simplifying Prostate IMRT Planning 17
V95_PTV Dmin_PTV V87_rectwall V54_rectwall Dmax_rectwall V54_rectwall
PTVE Dmin Weight
PTVE Dmax Weight
RectOE Dmax Dose
Overlap Dmin Weight
Overlap Dmax Weight
Mid Dpre Dose
Mid Dmin Weight
Mid Dmax Weight
RectOE Dmax Weight
RectOE DVH Dose
RectOE DVH Weight
BladO Dmax Dose
BladO Dmax Weight
BladO DVH Dose
BladO DVH Weight
0 11 0 0 0 1
35 1 0 0 0 2
34 30 35 34 0 15
0 0 0 0 0 0
12 0 0 0 0 0
0 0 0 0 0 0
0 0 0 0 0 0
0 0 0 0 0 0
0 0 0 0 0 0
35 8 13 1 35 5
18 12 0 0 23 0
15 0 0 0 0 23
0 0 0 0 0 1
2 8 0 0 0 11
0 2 0 0 0 11
Figure 4: A sensitivity analysis for all 36 patients, indicating the number of patients for whicha particular parameter/constraint combination had an absolute PCC value of greater than 0.3.
comparison, the ranking function value for the clinical plan actually used to treat Patient 3was -2610, indicating some room for improvement. For Patient 8, RRS converged to -172.34after 24 iterations, compared to -161.5 using CRS after 73 iterations. For comparison, theranking function value for the clinical plan actually used to treat Patient 8 was -241, which iscomparable to the RRS plan. For both RRS and CRS, we fixed the value of the objectivefunction until the next move is downhill. RRS is able to escape from the unproductivesampling space more quickly than CRS.
We also examined the sensitivity of the optimization algorithm with respect to thedimensionality of the parameter space. As shown in Figure 5 (top), for Patient 3, the RRSin a full 13-dimensional space reached 1574 after 100 iterations (i.e., some constraints wereleft unsatisfied), and converged more slowly than the reduced-order search. Patient 8 has asimilar result, indicating that the dimensionality reduction is highly beneficial for the randomsampling technique.
To illustrate the improvement of plans gained by outer-loop parameter optimization,Figure 5 (bottom) also compares the dose-volume histograms (DVHs) from the RRSoptimization with the result corresponding to the default parameter settings for Patients 3 and8. While the rectum and bladder received lower doses using the default parameter settings,the clinical constraint forV PTV
95 was not satisfied. The reduced order parameter optimizationachieved better coverage in the prostate, and the OAR protection was still acceptable. Figure6 summarizes the results for all 36 patients based on 6 evaluation points on DVH curves:V PTV
95 , DPTVmin , V rectwall
87 , V rectwall54 , V bladwall
54 , andDrectwallmax . Compared to the plans obtained
using default settings, the parameter optimization significantly improvedDPTVmin andV PTV
95 .The mean value ofDPTV
min increased from 67.5% to 78.1%, and the mean value ofV PTV95
increased from 82.2% to 92.7%. RRS generally pushedV rectwall54 to the clinical limit of
53% as we expected, while still leaving enough margins forV bladwall54 and V rectwall
87 . All

Reduced-order Parameter Optimization for Simplifying Prostate IMRT Planning 18
0 20 40 60 80 100−1
0
1
2
3
4x 10
4
iteration number
rankin
g function s
core
RRS, sensitive setCRS, sensitive set RRS, all parameters
0 20 40 60 80 100−0.5
0
0.5
1
1.5
2
2.5
3x 10
4
iteration number
ran
kin
g f
un
ctio
n s
co
re
RRS, sensitive setCRS, sensitive set RRS, all parameters
0 20 40 60 80 100 1200
0.1
0.2
0.3
0.4
0.5
0.6
0.7
0.8
0.9
1
Cumulative Dose Volume Histogram
Relative Dose
Fra
ctio
n o
f V
olu
me
PTV V95 = 0.875
Rect V54 = 0.53
Rect V87
= 0.3PTV, RRS plan
Rectwall, RRS plan
Bladwall, RRS plan
PTV, default params
Rectwall, default params
Bladwall, default params
0 20 40 60 80 100 1200
0.1
0.2
0.3
0.4
0.5
0.6
0.7
0.8
0.9
1
Cumulative Dose Volume Histogram
Relative Dose
Fra
ctio
n o
f V
olu
me
PTV V95=0.875
Rect V54=0.53
Rect V87
=0.3PTV, RRS plan
Rectwall, RRS plan
Bladwall, RRS plan
PTV, default params
Rectwall, default params
Bladwall, default params
(a) (b)
Figure 5: Parameter optimization for (a) Patient 3 and (b) Patient 8. The upper row illustratesthe overall score as a function of the iteration number. The lower row compares the DVHsof the prostate, rectum wall and bladder wall for the RRS optimization result vs. the DVHscorresponding to the default parameter settings. The clinical constraints are marked as circledpoints.
6 statistics from RRS optimization were comparable to those of hand-tuned clinical plansevaluated by full dose calculation. Based on corrected dose calculations, the constraints forall patients were found to be satisfied (resulting in a negative ranking scores), except forslightly higherDrectwall
max in 2 of the 36 cases. This is not overly worrisome, since this kind ofmaximum/minimum statistic is inherently noisy. We expect the scores could be improved ifthe constraint is replaced withD05 or other more robust measures for hotspot.
It is reasonable to expect that in prostate IMRT, the major conflict is between PTVcoverage and rectum hotspot, due to the overlap between the two structures. The twoconstraintsV PTV
95 andDPTVmin compete against the rectum constraintDrectwall
max , which is themost difficult compromise to negotiate in the parameter search. For the “cooler” parts of

Reduced-order Parameter Optimization for Simplifying Prostate IMRT Planning 19
5 10 15 20 25 30 350.3
0.4
0.5
0.6
0.7
0.8
0.9
1
patient ID
PT
V V
95
result from RRS optimization
result from default setting
clinical plan
clinical requirement
5 10 15 20 25 30 3530
40
50
60
70
80
90
100
patient ID
PT
V D
min
(%
)
result from RRS optimization
result from default setting
clinical plan
clinical requirement
(a) (b)
5 10 15 20 25 30 350
0.1
0.2
0.3
0.4
0.5
0.6
0.7
0.8
patient ID
Bla
dw
all
V5
4
result from RRS optimization
result from default setting
clinical plan
clinical requirement
5 10 15 20 25 30 350
0.1
0.2
0.3
0.4
0.5
patient ID
Re
ctw
all
V8
7.5
result from RRS optimization
result from default setting
clinical plan
clinical requirement
(c) (d)
5 10 15 20 25 30 350
0.1
0.2
0.3
0.4
0.5
0.6
0.7
0.8
patient ID
Re
ctw
all
v5
4
result from RRS optimization
result from default setting
clinical plan
clinical requirement
5 10 15 20 25 30 3570
75
80
85
90
95
100
105
110
patient ID
Re
ctw
all
Dm
ax(%
)
result from RRS optimization
result from default setting
clinical plan
clinical requirement
(e) (f)
Figure 6: Comparisons of dose evaluation statistics for RRS, default, and clinical parametersettings. The clinical parameters come from the hand-tuned historical plans from MSKCC.(a):V PTV
95 . (b): DPTVmin . (c): V bladwall
54 . (d): V rectwall87 . (e): V rectwall
54 . (f): Drectwallmax .

Reduced-order Parameter Optimization for Simplifying Prostate IMRT Planning 20
the rectum and bladder (which are also farther away from the PTV), the constraints forV rectwall
87 , V rectwall54 andV bladder
54 are relatively easy to satisfy, even using the default parametersettings. Since these OAR constraints are also negatively correlated withV PTV
95 andDPTVmin ,
the outer-loop search achieves the compromise by increasingV rectwall54 and V bladder
54 to theclinical limits, while maximizing the PTV coverage.
The number of iterations required for outer-loop convergence ranged from 40 to 180, andfor each iteration, the inner-loop intensity optimization takes about 5 seconds on a Pentium 41.6 GHZ, 1GB RAM PC. The average time for outer-loop convergence for one clinical caseis about 10 minutes. For a typical patient, the inner-loop optimization involves about 10000total sample points in the PTV and OARs, and the optimization is taken over 2000 beamletintensities.
3.3. Clinical Validation
The parameter optimization results for 10 of the 36 plans described above were clinicallyevaluated at MSKCC by an expert planner who examined dose volume histograms and isodosecontours on three orthogonal slices through the isocenter. As discussed in the Appendix,the dose results based on corrected dose calculation in Section 3.2 differ slightly from thefull dose calculation performed in the clinic. Accordingly, the plans from the outer-loopoptimization are not guaranteed to be approved by the planner, since certain dose statisticsmight violate their constraints after full dose calculation. We defined three categories for theclinical validation of the outer-loop plans:
Category I The outer-loop plan was clinically acceptable after the usual re-normalization ofthe doses. This re-normalization ensuresDPTV
max to be 109.5-110% andDrectwallmax to be
98.5-99%, and requires a trivial amount of time compared to re-optimization.
Category II The outer-loop plan required only minor parameter changes followed by re-optimization to obtain a clinically acceptable plan. Here we define “minor” adjustment toinvolve less than 5 re-optimizations and 15 minutes of effort using the MSKCC planningsystem running on a Pentium 4 3.06 GHZ, 2.5 GB RAM PC.
Category III Starting from the outer-loop plan required more than 15 minutes or 5 re-optimizations to obtain an clinically acceptable plan.
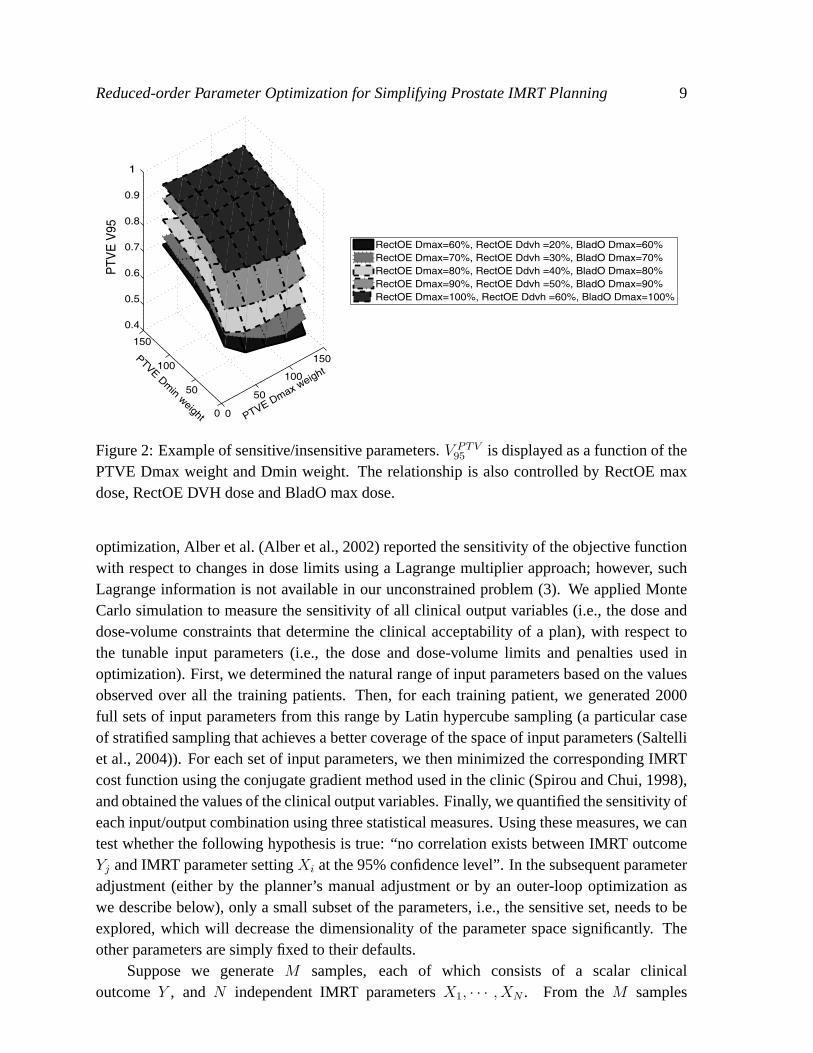
Among the 10 clinically validated plans, 4 were considered to be in Category I. Figures7(a)-(c) show the full dose distributions for one of the immediately acceptable patients inthe sagittal, transversal and coronal planes. For the other 6 plans that were not immediatelyapproved, 3 plans were in Category II and 3 plans were in Category III. Hence, in 70% of thecases, the parameters from the reduced-order optimization resulted in a substantial reductionin planning time.
4. Conclusions
We showed that prostate IMRT treatment planning can be made more intuitive and less time-consuming, based on a sensitivity analysis and an automated, reduced-order search over
Reduced-order Parameter Optimization for Simplifying Prostate IMRT Planning 21
(a) (b)
Levels in %
107.3
100.0
90.0
70.0
50.0
30.0
10.0
(c)
Figure 7: Clinical full dose evaluations for the outer-loop plan for Patient 24. Dosedistributions are displayed in the (a) transverse, (b) sagittal, and (c) coronal planes throughthe isocenter.
the sensitive set. The method is relatively fast and efficient, since we use unconstrainedquadratic programming and simplified dose calculations in the inner loop (which takes justseconds and several MB of memory), and stochastic optimization over less than 10 variablesin the outer loop. Our methods can be applied to anatomically similar situations such asprostate treatments intended for different total doses, using more treatment beams, or subjectto different clinical preferences. We also believe our approach has the potential to improveefficiency for sites where the IMRT planning process is more challenging or tedious, such ashead and neck cancer treatment.
As described above, the optimized outer-loop result may not always be clinicallyacceptable. The optimization may end with a positive score after the decided number of RRSiterations, or the plan may not be approved by planners after full dose calculation and planevaluation. The first case indicates that a good solution is not available within the sensitiveparameter set, and additional parameters should be included in the outer loop. The second case

Reduced-order Parameter Optimization for Simplifying Prostate IMRT Planning 22
is caused by the difference between the corrected pencil beam method (in the outer loop) andfull dose calculation. However, even in these two cases, we expect the resulting parameterswill still provide a better starting point for manual tuning than the default parameters. In thefuture, we plan to investigate more accurate dose calculation algorithms in the outer loop.We also intend to investigate methods for quickly determining an appropriate sensitive set fora given patient. For example, as mentioned above, the bladder wall DVH parameters had astrong impact on plan quality for some patients, but were not determined to be highly sensitivefor the 5 training patients. One possibility might be to add the bladder wall parameters basedon a simple rule involving the patient’s organ geometry (e.g., bladder size). We also plan touse our sensitivity analysis to provide a prescriptive basis for further tuning so that given thedeficiencies of a candidate plan, planners can more easily determine which parameters shouldbe tuned and to what extent.
A natural idea is to minimize the ranking function (7) directly, using a stochasticalgorithm (like RRS) to deal with the non-differentiable nature of the objective function. Themajor problem with this approach would be dimensionality, since stochastic optimization overthousands of beamlet variables would be extremely time-consuming, compared to stochasticoptimization over less than 10 variables in the outer loop of our method.
In discussions with planners, we found that there are some features of the automatically-produced plans that, while not rendering them clinically unacceptable, indicate room forimprovement. For example, planners observed that in some cases, they expected that a higherPTV coverage or lower maximum dose in the Mid region could be achievable, and notedthat in a “good” plan, the OAR constraints should generally be pushed to their limits. Infuture work, we will improve our scoring function to further take into account expert planners’experience (much of which is not explicitly written in the clinical protocol).
While we only considered dose and dose-volume based objective function terms inthis work, the same approach should apply to other types of objective function terms aswell. For example, a typical dose-response-based objective function to be maximized isgiven by: F =
∏j fj, where each termfj is of the formfT = 1
1+(EUD0EUD )
n for tumors or
fOAR = 1
1+(
EUDEUD0
)n for normal tissues (Wu et al., 2002). The equivalent uniform dose is
defined asEUD =(
1N
∑i D
ai
) 1a , whereDi is the dose to theith voxel (Niemierko, 1997).
In this case, the tunable parameters that could be analyzed include the dose-volume effectparametera, the desired dosesEUD0, and the power termn for each structure.
A final goal is to produce a better patient-specific starting point for the outer-loopoptimization based on a parametric shape model fit to the organs of interest in CT images,such as the one described in (Jeong and Radke, 2006).
Appendix: Full Dose and Truncated Dose Calculation Algorithms
As described in Section 2.3, while our corrected dose (C-D) calculations enable speed andaccuracy in the outer loop optimization, they still differ slightly from the full dose (F-D)calculations performed in the clinic. The assumption of the C-D method is that the full

REFERENCES 23
and truncated doses are locally related by a scaling factor, which, for a given voxel, isapproximately constant in optimized plans. As a result of this approximation, the doseoutputs from RRS optimization and MSKCC full dose evaluation are not identical. Table7 compares the dose statistics for 6 patients using both methods. The differences in extreme(i.e., maximum or minimum) dose statistics were generally larger than those in the other DVHstatistics, as would be expected, since they only depend on the dose at one sample. In theMid structure, doses were higher with F-D than with C-D, which makes sense since the Midstructure is thin and is surrounded by target that can scatter into it. For Patient 24, the meanvalues of the dose differences for all evaluation points in the PTV, rectal wall and bladder wallwere -2.14, -1.58 and -0.84, respectively. The standard deviations of the differences were 0.81,1.41 and 1.83, respectively. Such differences do not necessarily weaken the clinical value ofthe RRS results, as long as the RRS-generated plans have enough margin beyond the clinicalconstraints. For Patient 24, the DVH curves from RRS and full dose evaluation were almostidentical, as illustrated in Figure 8. After full dose calculation, all the clinical constraints werestill satisfied, which suggests that for this case, the approximate dose calculation was accurateenough for parameter optimization.
V PTV95 DPTV
min V rectwall54 Drectwall
max Dmidmax
PatientC-D F-D C-D F-D C-D F-D C-D F-D C-D F-D
1 0.94 0.97 82.67 82.93 0.51 0.53 97.36 100.26 99.73 104.817 0.99 0.98 84.79 82.51 0.50 0.52 96.34 99.38 105.48 108.0519 0.95 0.96 75.78 71.29 0.50 0.52 99.45 98.96 103.16 106.5623 0.94 0.95 71.44 69.23 0.55 0.54 100.47 101.59 102.90 105.5924 0.91 0.93 77.94 79.61 0.52 0.52 92.97 96.46 102.82 105.8627 0.98 0.98 83.46 82.49 0.54 0.53 99.60 99.80 105.51 106.56
Table 7: Comparison of the doses from RRS plans using the corrected dose calculationalgorithm (C-D), and doses from clinical evaluation using the full dose calculation algorithm(F-D). All doses are expressed as percentages.
Acknowledgments
This work was supported by the National Cancer Institute under grant 5P01CA59017-13, andCenSSIS, the NSF Center for Subsurface Sensing and Imaging Systems, under the awardEEC-9986821.
References
M. Alber, M. Birkner, and F. Nusslin. Tools for the analysis of dose optimization: II. sensitivity analysis.PhysMed Biol., 47(4):265–270, April 2002.
M. Alber and F. Nusslin. Tools for the analysis of dose optimization: I. Effect-volume histogram.Phys MedBiol., 47(14):2451–2458, July 2002.

REFERENCES 24
0 20 40 60 80 100 1200
0.1
0.2
0.3
0.4
0.5
0.6
0.7
0.8
0.9
1Cumulative Dose Volume Histogram
Relative Dose
Fra
ctio
n o
f V
olu
me
PTV RRS F-D evaluation
RectWall RRS F-D evaluation
BladWall RRS F-D evaluation
PTV RRS C−D evaluation
RectWall RRS C−D evaluation
BladWall RRS C−D evaluation
Rect V54=0.53
Rect V87=0.30
PTV V95=0.875
Figure 8: DVHs of the RRS plan using full dose (F-D) calculation (solid line) vs. thecorrected-pencil-beam dose (C-D) calculation (dashed line), showing that the differences areslight.
H. I. Amols and C. C. Ling. EUD but not QED.International Journal of Radiation Oncology Biology Physics,52:1–2, 2002.
J. Barbiere, M. Chan, J. Mechalakos, D. Cann, K. Schupak, and C. Burman. A parameter optimization algorithmfor intensity-modulated radiotherapy prostate treatment planning.Journal of Applied Clinical MedicalPhysics, 3:227–234, 2002.
J. L. Bedford and S. Webb. Elimination of importance factors for clinically accurate selection of beamorientations, beam weights, and wedge angles in conformal radiation therapy.Medical Physics, 30:1788–1804, 2003.
T. Bortfeld, K.-H. Kufer, M. Monz, A. Trofimov, and A. Niemierko. Problems with current IMRT prescriptionpractices and planning systems [abstract].Medical Physics, 31:1761, 2004.
C. Cotrutz, M. Lahanas, C. Kappas, and D. Baltas. A multiobjective gradient based dose optimization algorithmfor conformal radiotherapy.Physics in Medicine and Biology, 46:2161–2175, 2001.
D. Craft, T. Halabi, and T. Bortfeld. Exploration of tradeoffs in intensity-modulated radiotherapy.Phys. Med.Biol., 50(24):5857–5868, December 2005.
M. A. Hunt, C.-Y. Hsiung, S. V. Spirou, C.-S. Chui, H. I. Amols, and C. C.Ling. Evaluation of concave dosedistributions created using an inverse planning system.International Journal of Radiation Oncology BiologyPhysics, 54:953–962, 2002.
Y. Jeong and R. J. Radke. Modeling inter- and intra-patient anatomical variation using a bilinear model.Proceedings of the IEEE Computer Society Workshop on Mathematical Methods in Biomedical ImageAnalysis (MMBIA 06), in conjunction with CVPR 06, New York, NY, 2006.
M. L. Kessler, D. L. Mcshan, M. A. Epelman, K. A. Vineberg, A. Eisbruch, T. S. Lawrence, and B. A. Fraass.Costlets: A generalized approach to cost functions for automated optimization of IMRT treatment plans.Optimization and Engineering, 6(4):421–448, December 2005.
M. Kutner, C. Nachtsheim, and J. Neter.Applied Linear Regression Models. McGraw-Hill, 2004.
M. Langer, E. Lee, J. Deasy, R. Rardin, and J. Deye. Operations research applied to radiotherapy, an NCI-

REFERENCES 25
NSF-sponsored workshop, February 7-9, 2002.Int J Radiat Oncol Biol Phys., 57(3):762–768, November2003.
J. Lian and L. Xing. Incorporating model parameter uncertainty into inverse treatment planning.Med Phys., 31(9):2711–2720, September 2004.
C. C. Ling et al. A Practical Guide to Intensity-Modulated Radiation Therapy. Medical Physics Publishing,2004.
J. Meyer, M. Phillips, P. Cho, I. Kalet, and J. Doctor. Application of influence diagrams to prostate intensity-modulated radiation therapy plan selection.Phys Med Biol., 49(9):1637–1653, May 2004.
A. Niemierko. Optimization of inverse treatment planning using a fuzzy weight function.Med Phys., 24(1):103–110, January 1997.
J. R. Palta et al.Intensity-Modulated Radiation Therapy: The State of the Art. Medical Physics Publishing,2004.
W. L. Price. Internet traffic engineering - global optimization by controlled random search.J. Optimiz. TheoryApp, 41:333–348, 1983.
J. Purdy et al. Intensity-modulated radiotherapy: current status and issues of interest.Int J Radiat Oncol BiolPhys., 51(4):880–914, November 2001.
H. E. Romeijn, R. K. Ahuja, J. F. Dempsey, A. Kumar, and J. G. Li. A novel linear programming approach tofluence map optimization for intensity modulated radiation therapy treatment planning.Medical Physics, 48(21):3521–3542, November 2003.
H. E. Romeijn, J. F. Dempsey, and J. G. Li. A unifying framework for multi-criteria fluence map optimizationmodels.Physics in Medicine and Biology, 49:1991–2013, 2004.
A. Saltelli, S. Tarantola, F. Campolongo, and M. Ratto.Sensitivity Analysis in Practice: A Guide to AssessingScientific Models. Wiley, 2004.
A. Samuelsson and K. Johansson. Intensity modulated radiotherapy treatment planning for dynamic multileafcollimator delivery: influence of different parameters on dose distributions.Radiother Oncol., 66(1):19–28,January 2003.
D. Shepard, M. Ferris, G. Olivera, and T. Mackie. Optimizing the delivery of radiation to cancer patients.SIAMReview, 41:721–744, 1999.
J. Siebers, M. Lauterbach, S. Tong, Q. Wu, and R. Mohan. Reducing dose calculation time for accurate iterativeIMRT planning.Medical Physics, 29(2):231–237, February 2002.
S. Spirou and C. Chui. A gradient inverse planning algorithm with dose-volume constraints.Medical Physics,25(3):321–333, March 1998.
G. Starkschall, A. Pollack, and C. Stevens. Treatment planning using a dose-volume feasibility search algorithm.Int J Radiat Oncol Biol Phys., 49(5):1419–1427, April 2001.
S. Webb.Intensity-Modulated Radiation Therapy. Taylor and Francis, 2001.
Q. Wu, R. Mohan, A. Niemierko, and R. Schmidt-Ullrich. Optimization of intensity-modulated radiotherapyplans based on the equivalent uniform dose.Int J Radiat Oncol Biol Phys., 52(1):224–235, January 2002.
X. Wu and Y. Zhu. An optimization method for importance factors and beam weights based on genetic algorithmsfor radiotherapy treatment planning.Phys Med Biol., 46(4):1085–1099, April 2001.
L. Xing, J. Li, S. Donaldson, Q. Le, and A. Boyer. Optimization of importance factors in inverse planning.Physics in Medicine and Biology, 44:2525–2536, 1999a.
L. Xing, J. Li, A. Pugachev, Q. Le, and A. Boyer. Estimation theory and model parameter selection fortherapeutic treatment plan optimization.Med Phys., 26(11):2348–2358, November 1999b.
T. Ye and S. Kalyanaraman. Internet traffic engineering - a recursive random search algorithm for large-scalenetwork parameter configuration.ACM SIGMETRICS Perf. Eval. Rev, 31:10, 2003.
Y. Yu. Multiobjective decision theory for computational optimization in radiation therapy.Medical Physics, 24:1445–1454, 1997.