reducing carbon emissions in the automotive value...
TRANSCRIPT
Reducing Carbon Emissions In The
Automotive Value Chain
#CRSummit2016
Panel Introductions – Al Hildreth, GM
AIAG GHG Workgroup Activities – Sherry Mueller, Ford
Importance of Supplier Engagement in Auto OEM GHG Reduction
- Doug Andrews, Lear
Delivering Sustainability – Lee Kindberg, Maersk
Let SmartWay track your carbon footprint – Erik Herzog, US EPA
SmartWay
Panel questions and discussion
Agenda
#CRSummit2016
Sherry Mueller
Ford Motor Company
#CRSummit2016
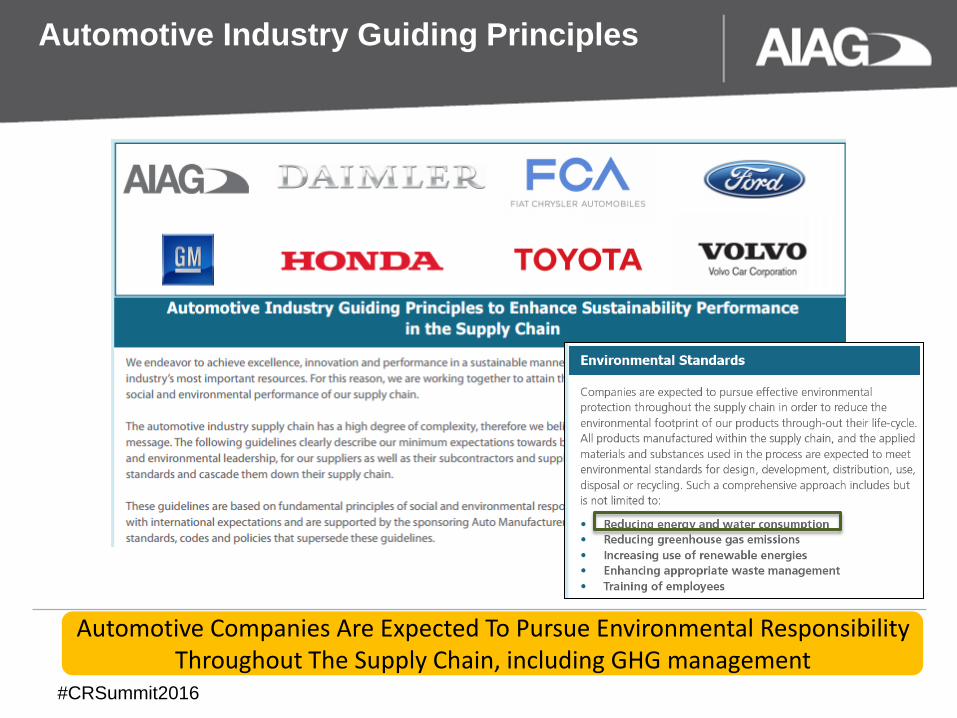
Automotive Industry Guiding Principles
Automotive Companies Are Expected To Pursue Environmental Responsibility Throughout The Supply Chain, including GHG management
#CRSummit2016
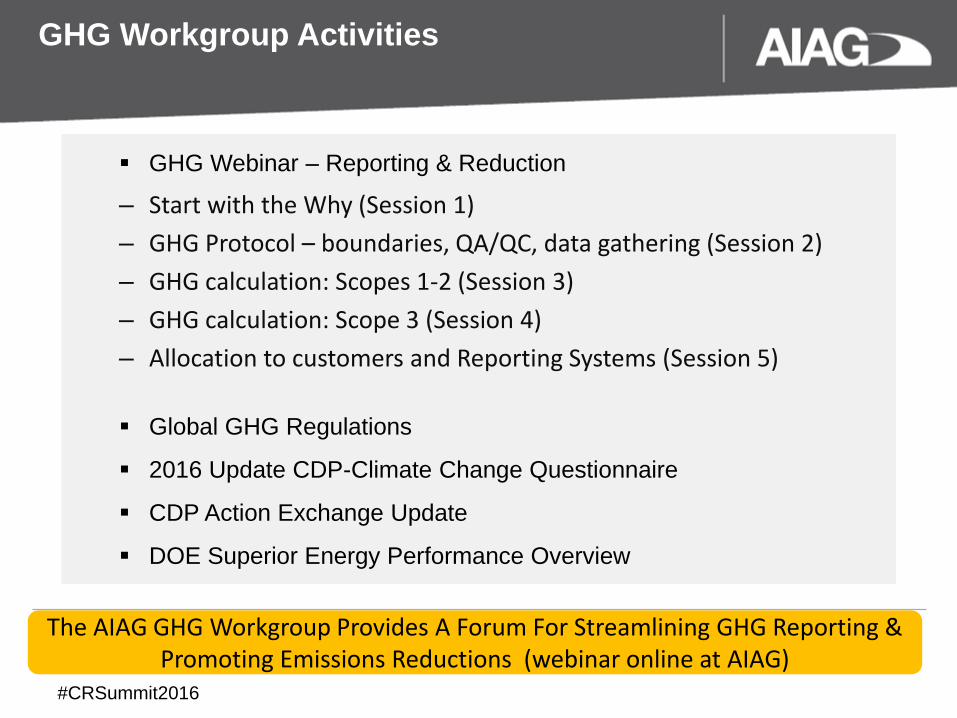
GHG Workgroup Activities
GHG Webinar – Reporting & Reduction
– Start with the Why (Session 1)
– GHG Protocol – boundaries, QA/QC, data gathering (Session 2)
– GHG calculation: Scopes 1-2 (Session 3)
– GHG calculation: Scope 3 (Session 4)
– Allocation to customers and Reporting Systems (Session 5)
Global GHG Regulations
2016 Update CDP-Climate Change Questionnaire
CDP Action Exchange Update
DOE Superior Energy Performance Overview
The AIAG GHG Workgroup Provides A Forum For Streamlining GHG Reporting & Promoting Emissions Reductions (webinar online at AIAG)
#CRSummit2016
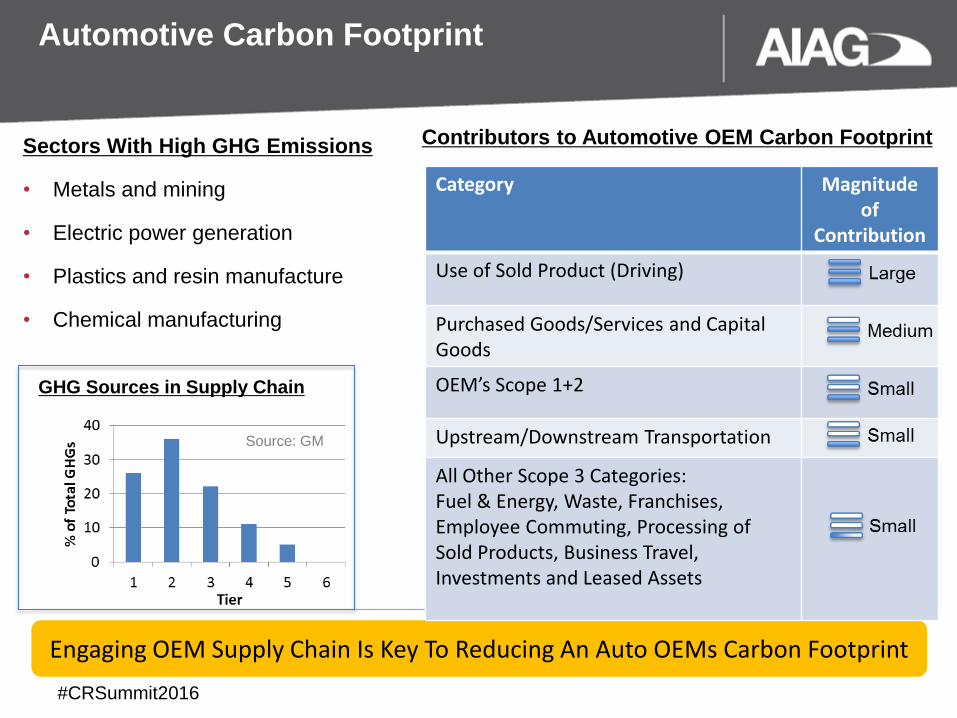
Automotive Carbon Footprint
Engaging OEM Supply Chain Is Key To Reducing An Auto OEMs Carbon Footprint
Sectors With High GHG Emissions
• Metals and mining
• Electric power generation
• Plastics and resin manufacture
• Chemical manufacturing
GHG Sources in Supply Chain
Source: GM
Contributors to Automotive OEM Carbon Footprint
Category Magnitude of
Contribution
Use of Sold Product (Driving)
Purchased Goods/Services and Capital Goods
OEM’s Scope 1+2
Upstream/Downstream Transportation
All Other Scope 3 Categories: Fuel & Energy, Waste, Franchises, Employee Commuting, Processing of Sold Products, Business Travel, Investments and Leased Assets
#CRSummit2016
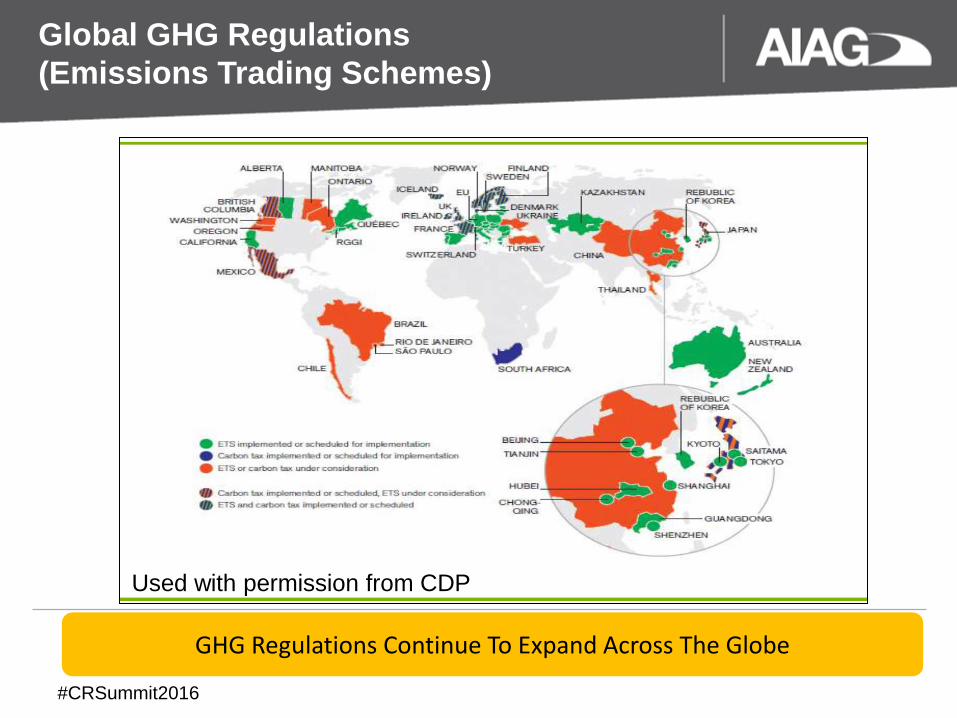
Used with permission from CDP
Global GHG Regulations
(Emissions Trading Schemes)
GHG Regulations Continue To Expand Across The Globe
#CRSummit2016
Delivering Sustainability: Supply Chain Transportation Lee Kindberg Director, Environment & Sustainability
#CRSummit2016
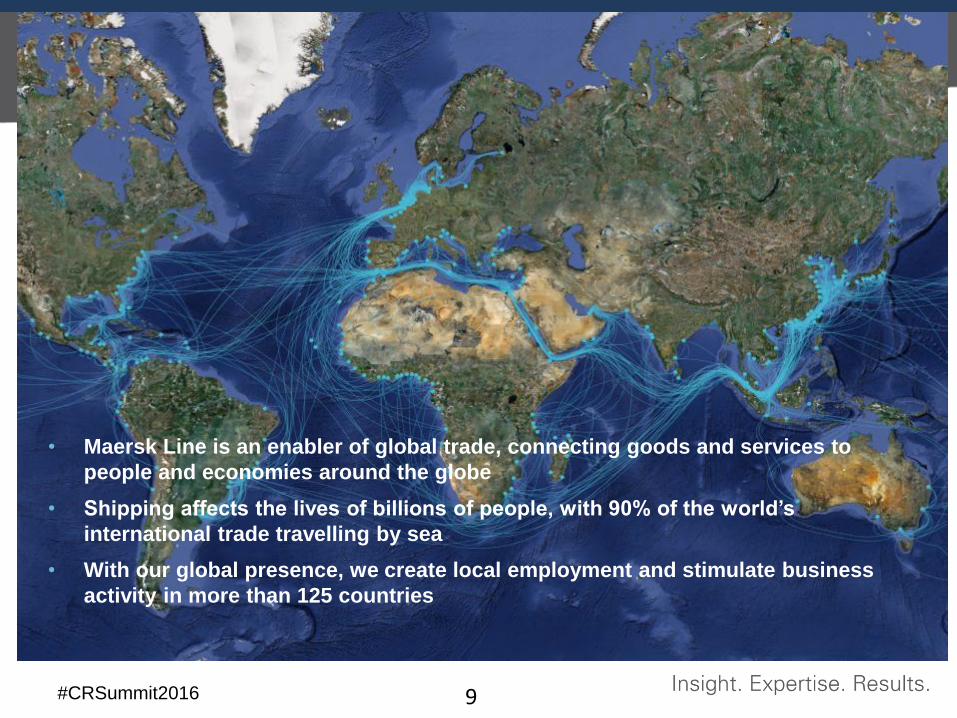
• Maersk Line is an enabler of global trade, connecting goods and services to
people and economies around the globe
• Shipping affects the lives of billions of people, with 90% of the world’s
international trade travelling by sea
• With our global presence, we create local employment and stimulate business
activity in more than 125 countries
9
#CRSummit2016
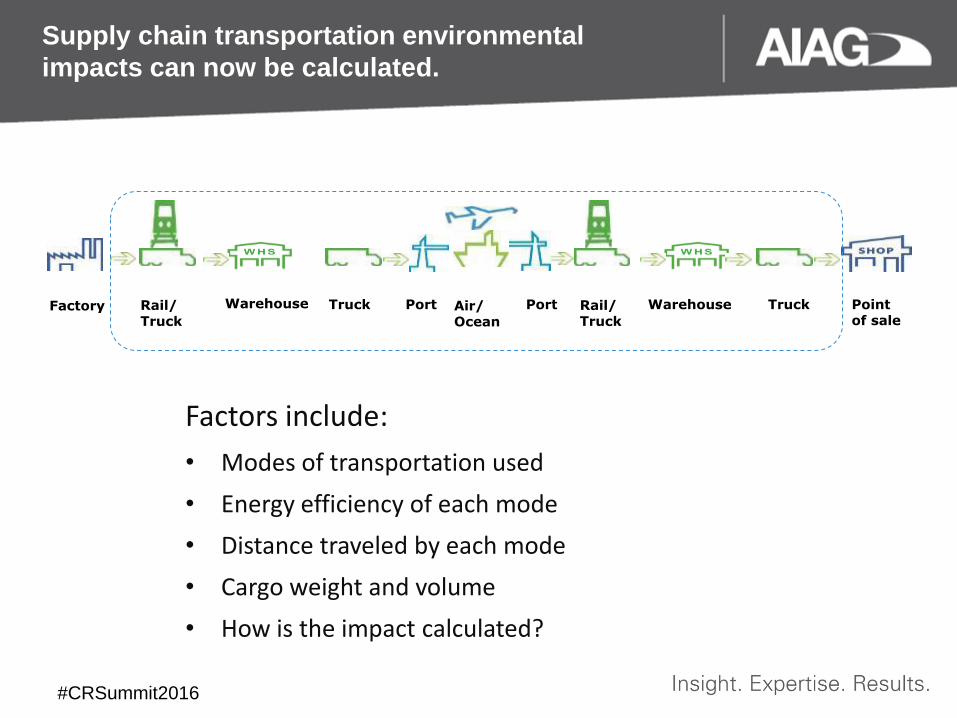
Supply chain transportation environmental
impacts can now be calculated.
Factors include:
• Modes of transportation used
• Energy efficiency of each mode
• Distance traveled by each mode
• Cargo weight and volume
• How is the impact calculated?
Factory Rail/ Truck
Warehouse Port Truck Air/ Ocean
Port Rail/ Truck
Warehouse Truck Point of sale
#CRSummit2016
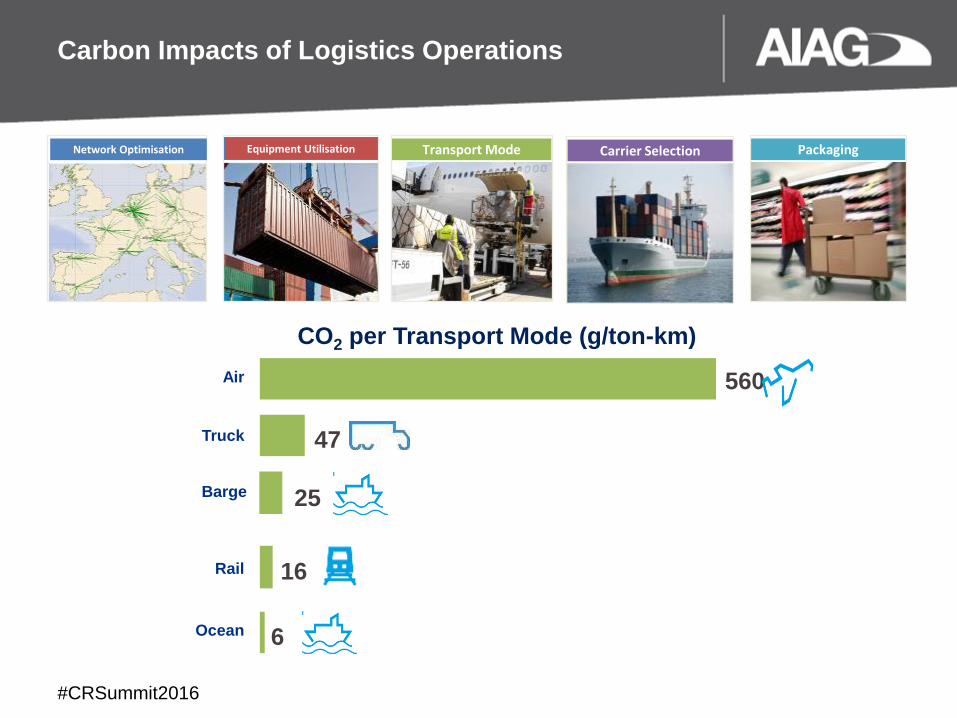
Carbon Impacts of Logistics Operations
Network Optimisation Equipment Utilisation Carrier Selection Packaging Transport Mode
Air
Truck
Ocean 6
16
47
560
Rail
25 Barge
CO2 per Transport Mode (g/ton-km)
#CRSummit2016
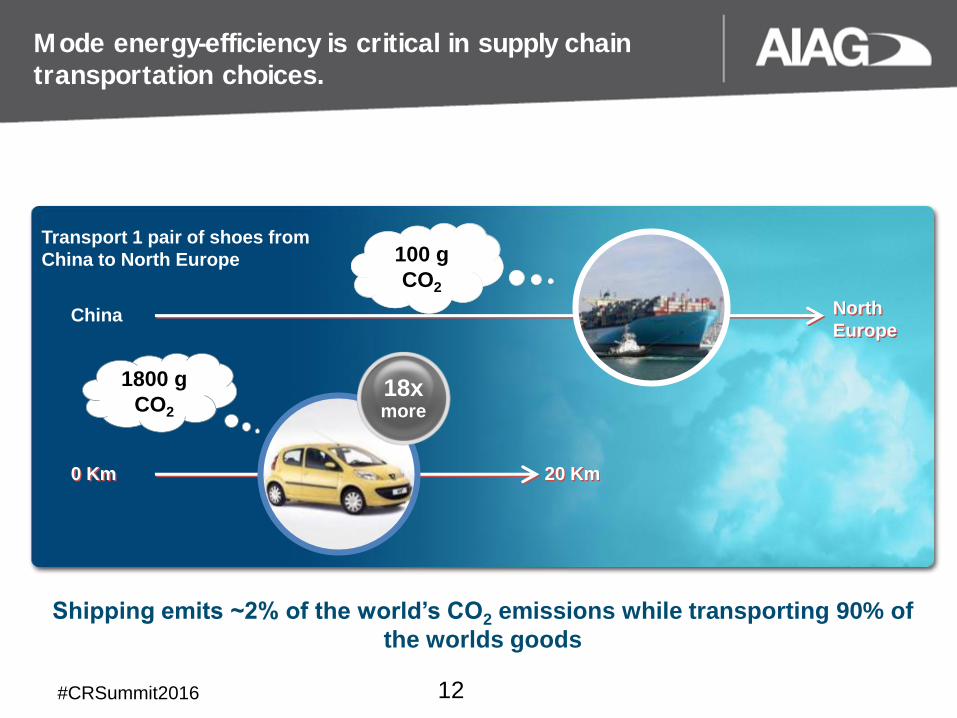
Shipping emits ~2% of the world’s CO2 emissions while transporting 90% of
the worlds goods
Transport 1 pair of shoes from
China to North Europe
China
100 g
CO2
North
Europe
20 Km 0 Km
18x more
1800 g
CO2
Mode energy-efficiency is critical in supply chain
transportation choices.
12
#CRSummit2016
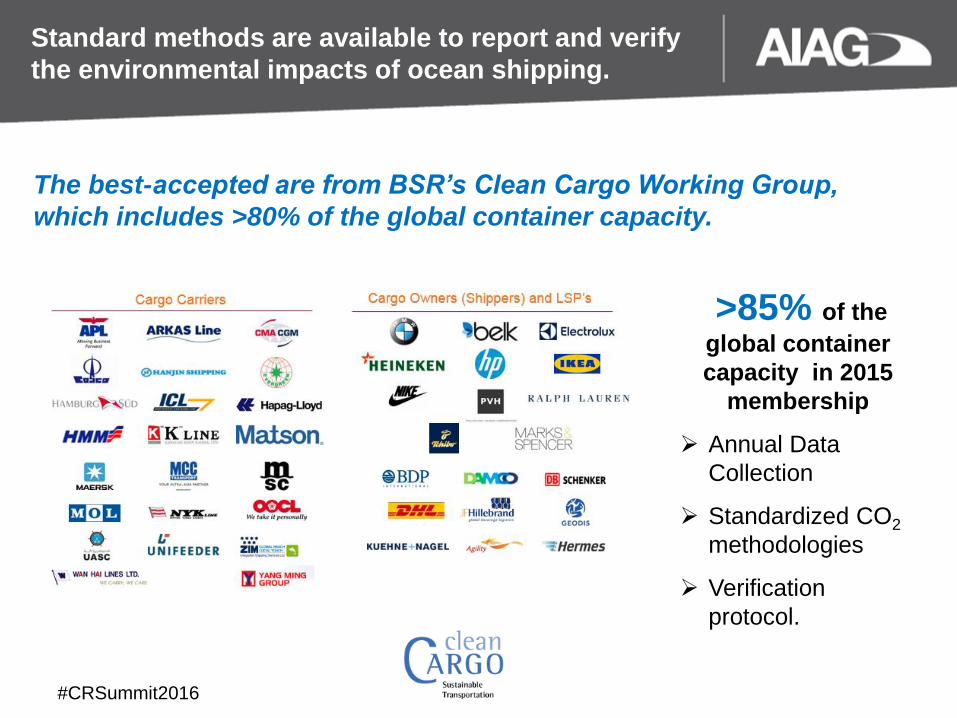
The best-accepted are from BSR’s Clean Cargo Working Group,
which includes >80% of the global container capacity.
>85% of the
global container
capacity in 2015
membership
Annual Data
Collection
Standardized CO2
methodologies
Verification
protocol.
Standard methods are available to report and verify
the environmental impacts of ocean shipping.
#CRSummit2016
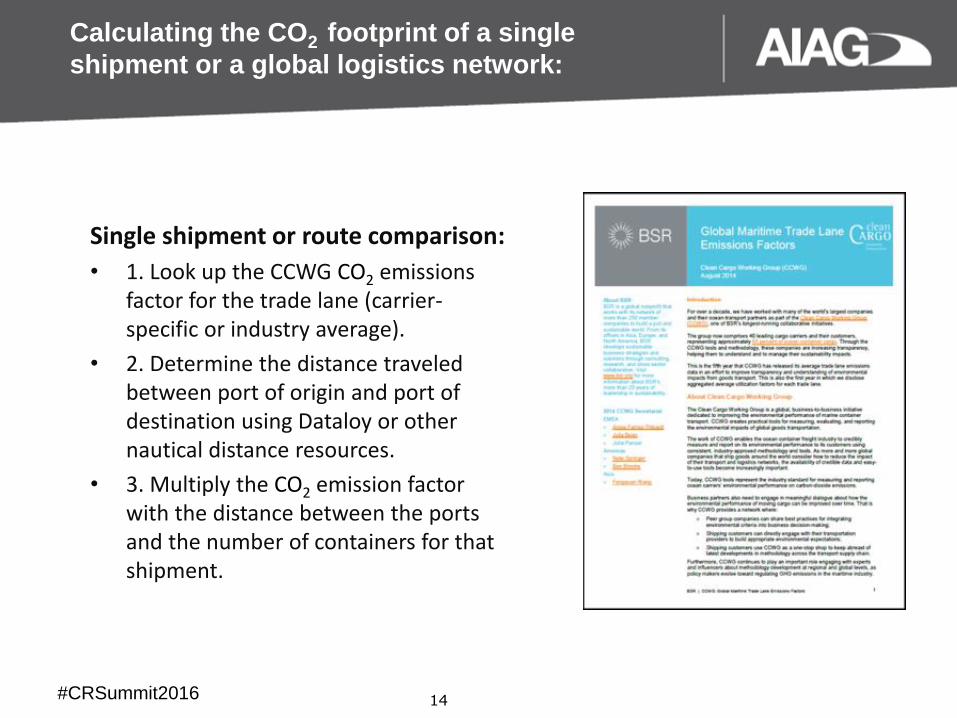
Calculating the CO2 footprint of a single
shipment or a global logistics network:
Single shipment or route comparison:
• 1. Look up the CCWG CO2 emissions factor for the trade lane (carrier-specific or industry average).
• 2. Determine the distance traveled between port of origin and port of destination using Dataloy or other nautical distance resources.
• 3. Multiply the CO2 emission factor with the distance between the ports and the number of containers for that shipment.
14
#CRSummit2016 15
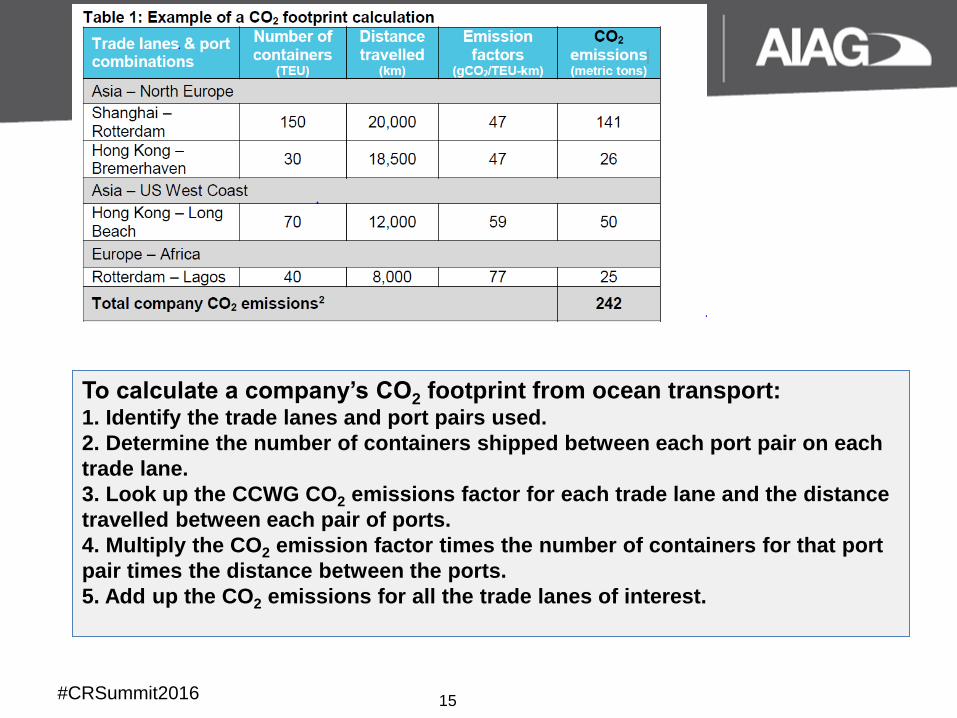
To calculate a company’s CO2 footprint from ocean transport: 1. Identify the trade lanes and port pairs used.
2. Determine the number of containers shipped between each port pair on each
trade lane.
3. Look up the CCWG CO2 emissions factor for each trade lane and the distance
travelled between each pair of ports.
4. Multiply the CO2 emission factor times the number of containers for that port
pair times the distance between the ports.
5. Add up the CO2 emissions for all the trade lanes of interest.
#CRSummit2016
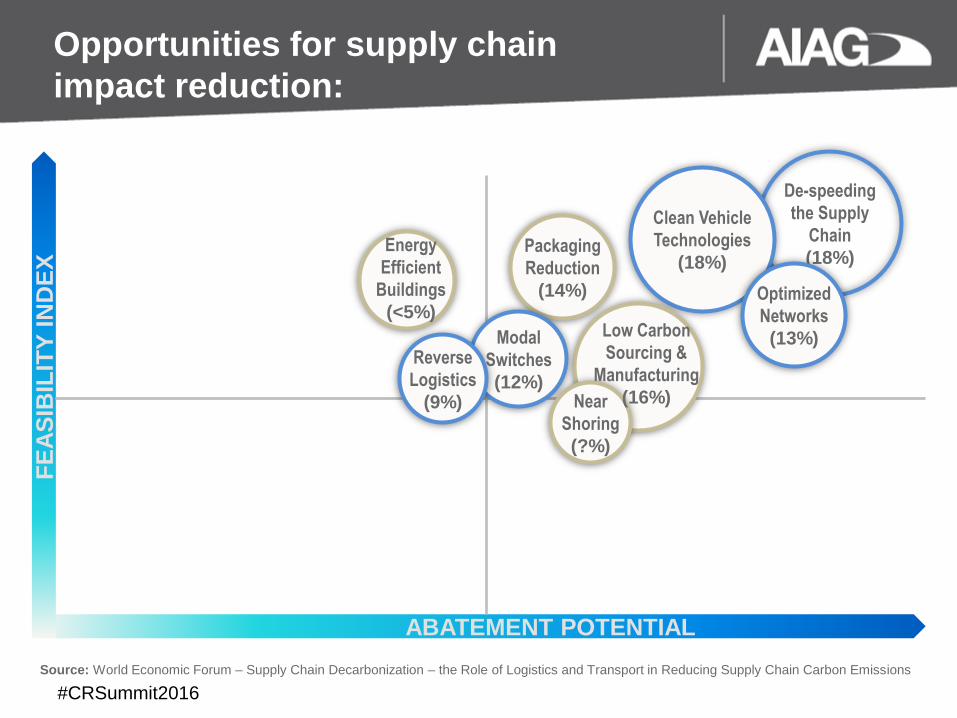
De-speeding
the Supply
Chain
(18%)
Opportunities for supply chain
impact reduction:
Source: World Economic Forum – Supply Chain Decarbonization – the Role of Logistics and Transport in Reducing Supply Chain Carbon Emissions
ABATEMENT POTENTIAL
FE
AS
IBIL
ITY
IN
DE
X
Clean Vehicle
Technologies
(18%)
Optimized
Networks
(13%) Low Carbon
Sourcing &
Manufacturing
(16%) Near
Shoring
(?%)
Packaging
Reduction
(14%)
Modal
Switches
(12%)
Reverse
Logistics
(9%)
Energy
Efficient
Buildings
(<5%)
#CRSummit2016
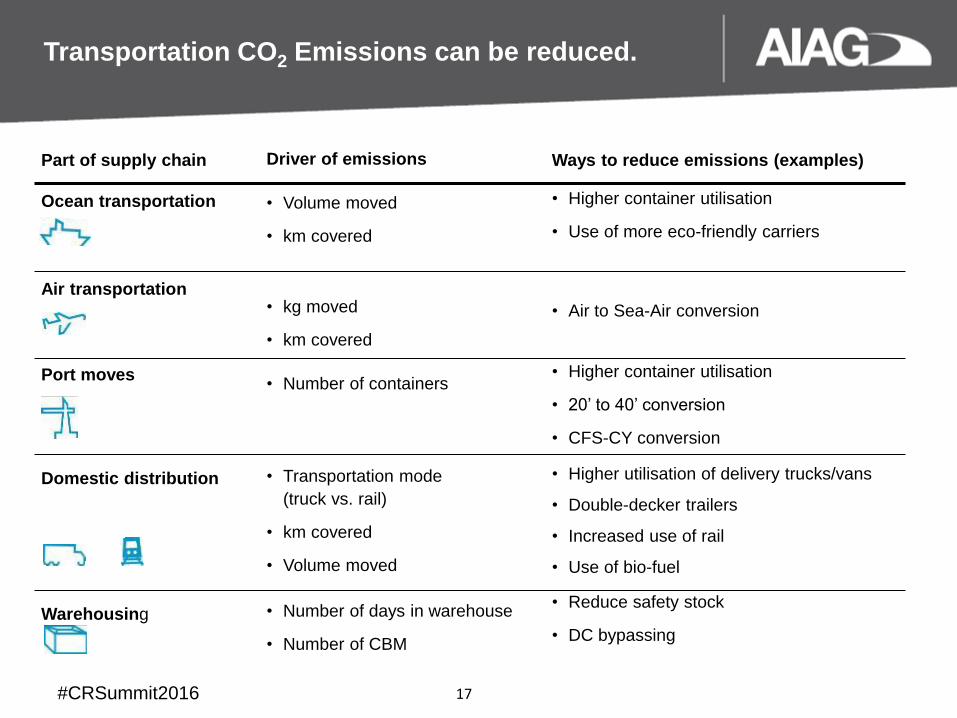
Transportation CO2 Emissions can be reduced.
Part of supply chain Driver of emissions Ways to reduce emissions (examples)
Ocean transportation
Air transportation
Port moves
Domestic distribution
Warehousing
• Volume moved
• km covered
• kg moved
• km covered
• Number of containers
• Transportation mode
(truck vs. rail)
• km covered
• Volume moved
• Number of days in warehouse
• Number of CBM
• Higher container utilisation
• Use of more eco-friendly carriers
• Air to Sea-Air conversion
• Higher container utilisation
• 20’ to 40’ conversion
• CFS-CY conversion
• Higher utilisation of delivery trucks/vans
• Double-decker trailers
• Increased use of rail
• Use of bio-fuel
• Reduce safety stock
• DC bypassing
17
#CRSummit2016
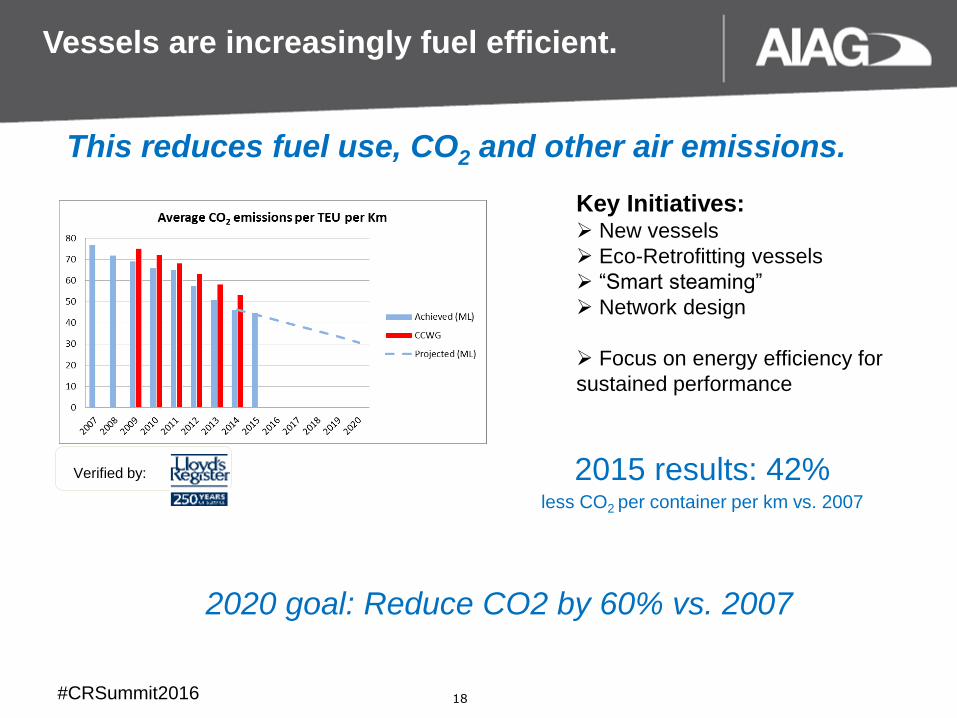
Vessels are increasingly fuel efficient.
Verified by:
Key Initiatives: New vessels
Eco-Retrofitting vessels
“Smart steaming”
Network design
Focus on energy efficiency for
sustained performance
18
2015 results: 42% less CO2 per container per km vs. 2007
2020 goal: Reduce CO2 by 60% vs. 2007
This reduces fuel use, CO2 and other air emissions.
#CRSummit2016
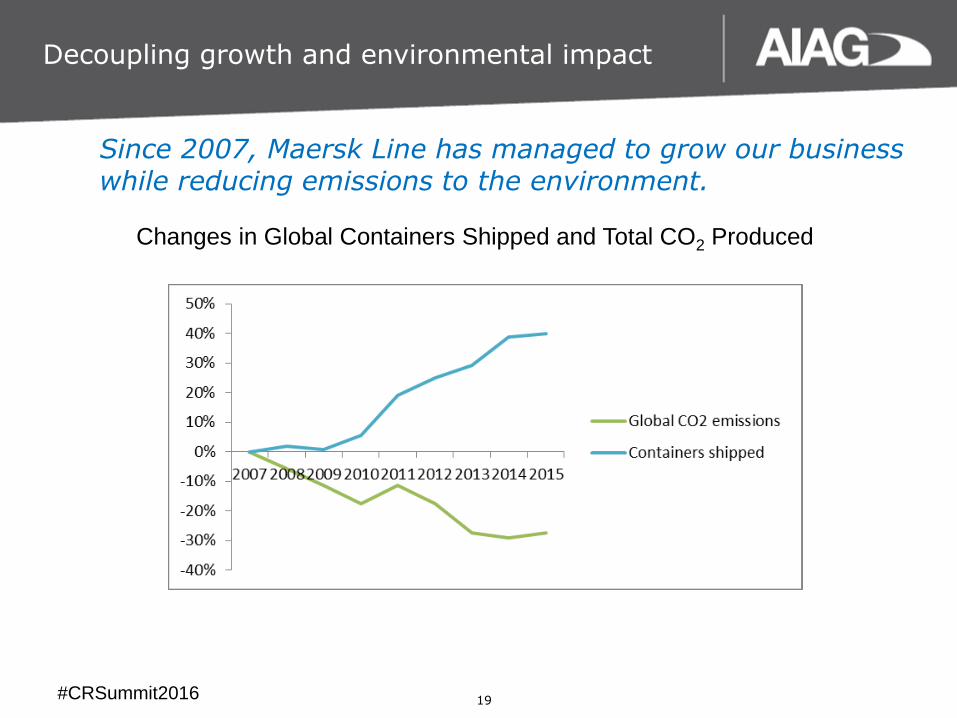
Decoupling growth and environmental impact
Changes in Global Containers Shipped and Total CO2 Produced
19
Since 2007, Maersk Line has managed to grow our business while reducing emissions to the environment.
#CRSummit2016
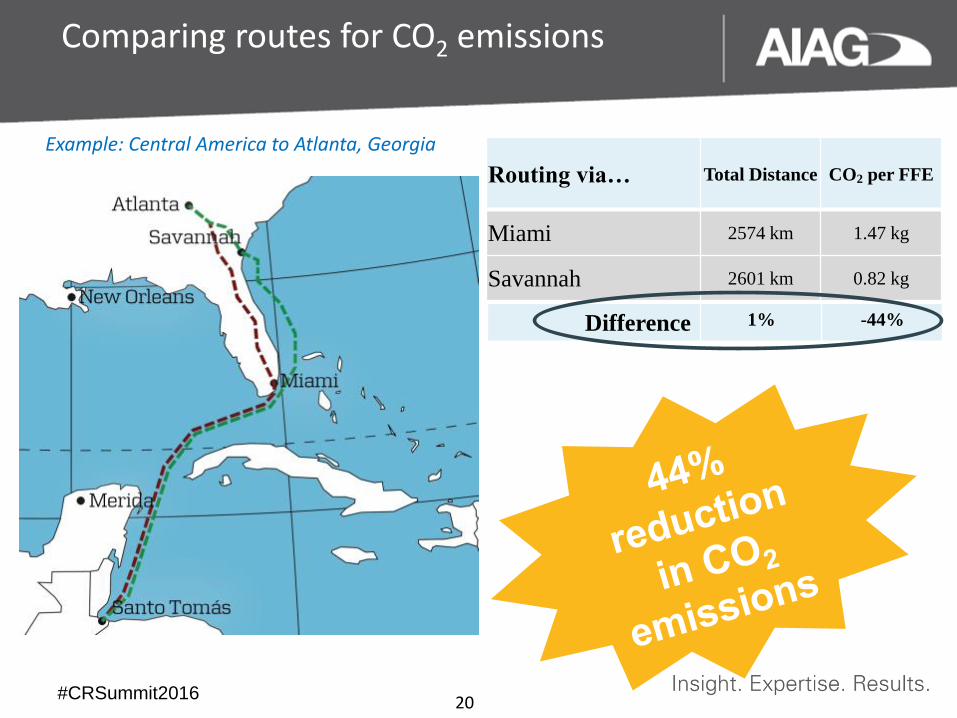
Comparing routes for CO2 emissions
Routing via… Total Distance CO2 per FFE
Miami 2574 km 1.47 kg
Savannah 2601 km 0.82 kg
Difference 1% -44%
20
Example: Central America to Atlanta, Georgia
#CRSummit2016
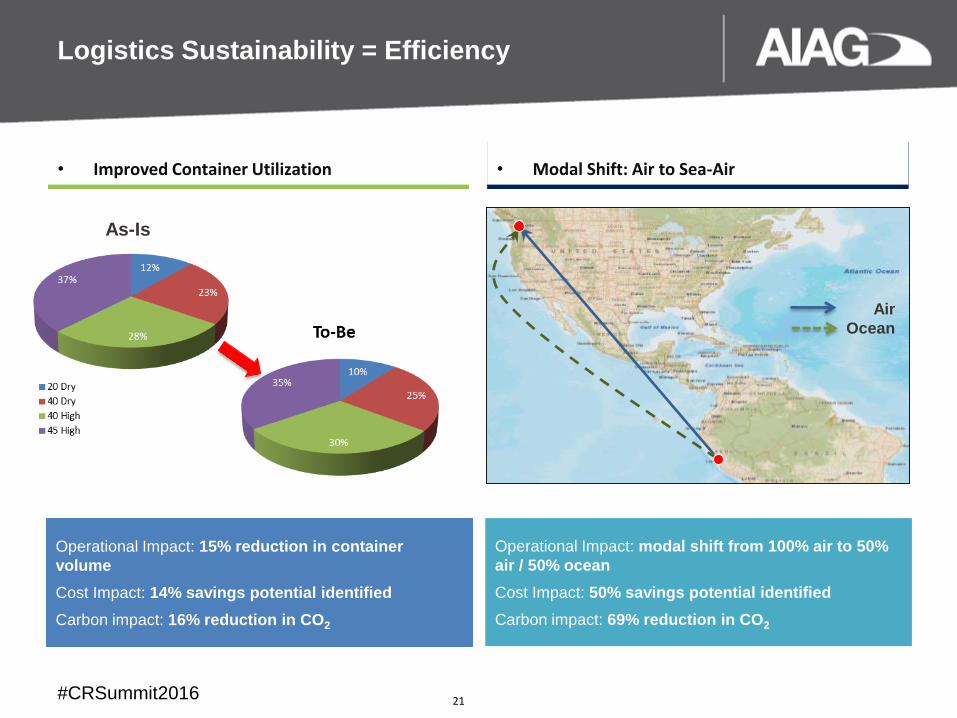
Logistics Sustainability = Efficiency
• Improved Container Utilization • Modal Shift: Air to Sea-Air
Air
Ocean
Operational Impact: modal shift from 100% air to 50%
air / 50% ocean
Cost Impact: 50% savings potential identified
Carbon impact: 69% reduction in CO2
As-Is
Operational Impact: 15% reduction in container
volume
Cost Impact: 14% savings potential identified
Carbon impact: 16% reduction in CO2
21
#CRSummit2016
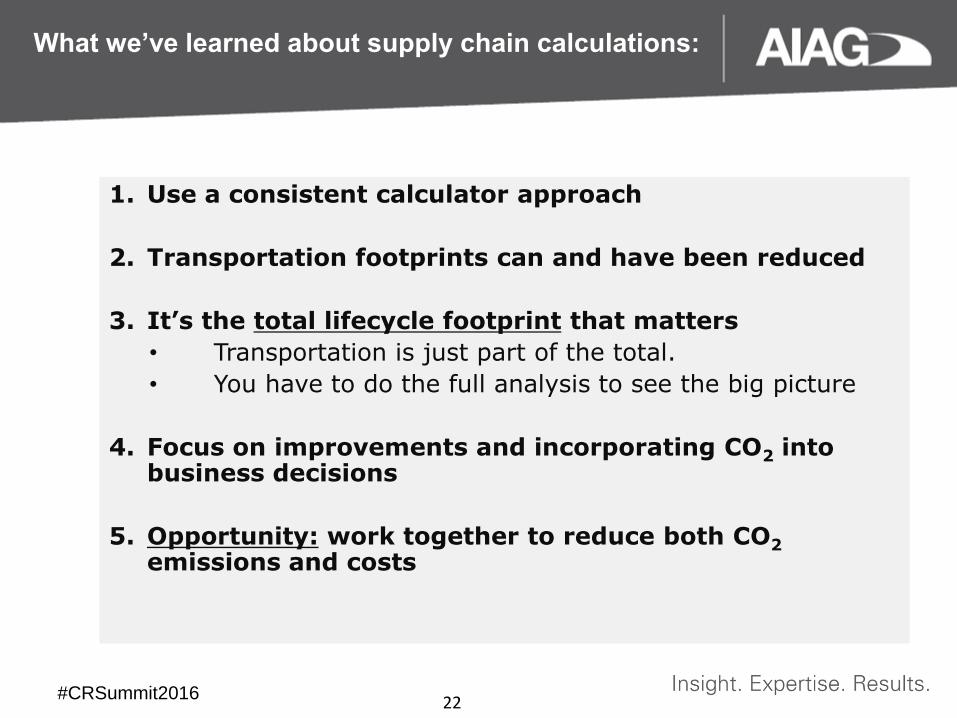
What we’ve learned about supply chain calculations:
1. Use a consistent calculator approach
2. Transportation footprints can and have been reduced
3. It’s the total lifecycle footprint that matters
• Transportation is just part of the total.
• You have to do the full analysis to see the big picture
4. Focus on improvements and incorporating CO2 into business decisions
5. Opportunity: work together to reduce both CO2 emissions and costs
22

Panel Discussion Q&A
Insert department name via
‘View/Header and Footer…’
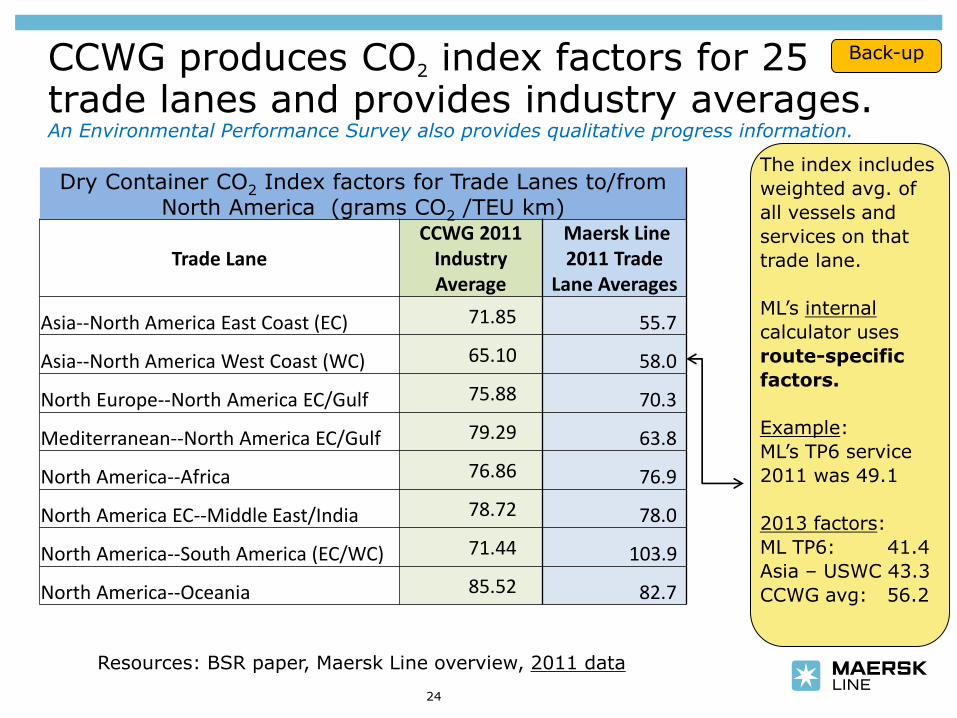
CCWG produces CO2 index factors for 25 trade lanes and provides industry averages. An Environmental Performance Survey also provides qualitative progress information.
Dry Container CO2 Index factors for Trade Lanes to/from North America (grams CO2 /TEU km)
Trade Lane CCWG 2011
Industry Average
Maersk Line 2011 Trade
Lane Averages
Asia--North America East Coast (EC) 71.85 55.7
Asia--North America West Coast (WC) 65.10 58.0
North Europe--North America EC/Gulf 75.88 70.3
Mediterranean--North America EC/Gulf 79.29 63.8
North America--Africa 76.86 76.9
North America EC--Middle East/India 78.72 78.0
North America--South America (EC/WC) 71.44 103.9
North America--Oceania 85.52 82.7
Resources: BSR paper, Maersk Line overview, 2011 data
The index includes
weighted avg. of
all vessels and
services on that
trade lane.
ML’s internal
calculator uses
route-specific
factors.
Example:
ML’s TP6 service
2011 was 49.1
2013 factors:
ML TP6: 41.4
Asia – USWC 43.3
CCWG avg: 56.2
24
Back-up
Insert department name via
‘View/Header and Footer…’
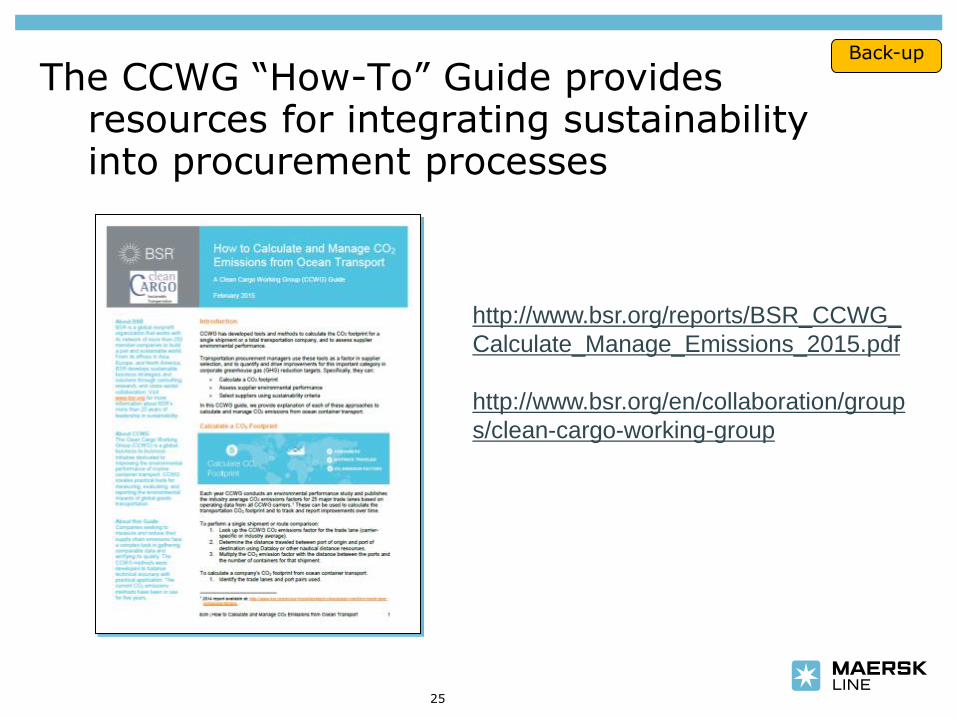
The CCWG “How-To” Guide provides resources for integrating sustainability into procurement processes
http://www.bsr.org/reports/BSR_CCWG_
Calculate_Manage_Emissions_2015.pdf
http://www.bsr.org/en/collaboration/group
s/clean-cargo-working-group
25
Back-up
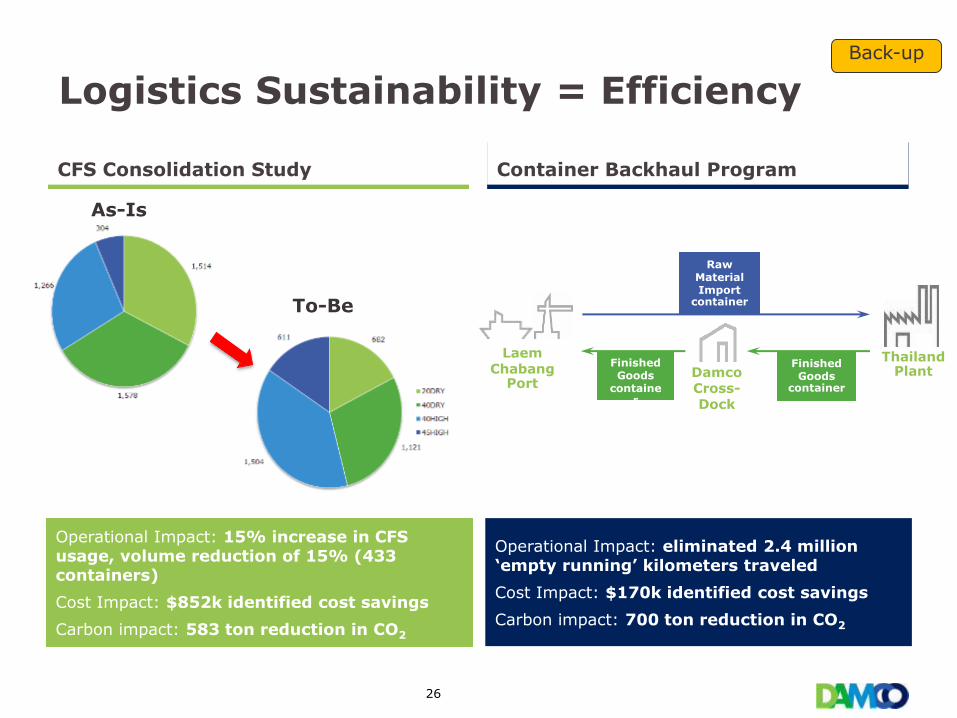
Logistics Sustainability = Efficiency
CFS Consolidation Study Container Backhaul Program
As-Is
Operational Impact: 15% increase in CFS usage, volume reduction of 15% (433 containers)
Cost Impact: $852k identified cost savings
Carbon impact: 583 ton reduction in CO2
To-Be
Thailand Plant Damco
Cross-Dock
Laem Chabang
Port
Raw Material Import
container
Finished Goods
container
Finished Goods
container
Operational Impact: eliminated 2.4 million ‘empty running’ kilometers traveled
Cost Impact: $170k identified cost savings
Carbon impact: 700 ton reduction in CO2
26
Back-up