reducing emissions through transportation mode switching
TRANSCRIPT
Reducing Emissions throughTransportation Mode Switching
Bus Rapid Transit inCape Town, South Africa
This study examines the air pollution effects of a proposed bus rapid
transit (BRT) system in Cape Town, South Africa. The BRT system would
allocate a pair of traffic lanes for exclusive use by buses. A logit model
is used to predict changes in travelers’ choices among the trains, buses,
minibuses, and automobiles along the BRT corridor. The response of
public transportation operators to changes in passenger demand is
simulated. Finally, emissions of greenhouse gases and local pollutants are
predicted for different combinations of system design and operational
characteristics. With the anticipated policy intervention, emissions of
carbon dioxide and local pollutants decrease 5 to 7 percent relative
to the status quo. Emissions levels are found to be more responsive
to congestion effects of the BRT system than to the improvement in
bus service. Increases in travel time resulting from the intervention,
including congestion-caused delays for minibus and car users, exceed
time savings for bus riders.
Christopher Kost2nd edition | 26 May 2004
AdvisorProfessor Lawrence Goulder,
Department of Economics
1 Introduction 12 Background 2 2.1 Urban context in South Africa 3 2.2 Transportation in Cape Town 3 2.3 Air quality in Cape Town 4 2.4 Bus rapid transit in Cape Town 43 Analytical approach 6 3.1 From trips to emissions 6 3.2 Scope of the analysis 7 3.3 The modeling process in detail 8 3.3.1 Modal split analysis 8 3.3.2 Load factor analysis 11 3.3.3 Emissions calculation 134 Econometric results 155 Simulation results 16 5.1 Status quo emissions 16 5.2 Policy intervention—central case 16 5.3 Sensitivity 17 5.4 Sensitivity to emissions factors 19 5.5 Sensitivity to vehicle technology 20 5.6 General characteristics of switching 20 5.7 Summary 206 Economic analysis 227 Conclusions 238 References 24
i
contents
acknowledgements
I would like to recognize the generous assistance of my parents, Larry Goulder, Kenneth Train, Luis Willumsen, Paul
White, Mark Delucchi, Lew Fulton, Haroon Williams, Sisa Mtwa, Bob Krause, Andrew Wheeldon, and the students and
faculty of Stanford’s Goldman Program.
1
1introduction1Concern about climate change has led to increas-
ing interest in approaches to sustainable urban development. Especially in rapidly developing
countries, urban and transportation planning deci-sions can have a profound effect on the magnitude of future environmental problems. The present study evaluates the ability of a specific intervention, the in-troduction of a bus rapid transit (BRT) system, to alter the status quo trend of rising transportation sector pollution in Cape Town, South Africa. The analysis assesses “mode switching” as a means of reducing emissions from transportation vehicles. That is, if the BRT system attracts passengers from other modes, emissions may fall if the passengers leave vehicles with higher levels of pollution per passenger trip.
Section 2 introduces the challenge of meeting rising urban travel demand in less developed coun-tries while reducing greenhouse gases emissions and describes existing means of transportation in Cape Town. Section 3 covers the methodology employed to estimate the emissions effects of the BRT system. Sections 4, 5, and 6 report econometric, emissions, and economic results, respectively. Finally, Section 7 offers conclusions and recommendations for future research.
introduction
2
Carbon dioxide and other greenhouse gas emissions from transportation have global consequences. Anthropogenic increases in
greenhouse gas concentrations threaten to disrupt agricultural and ecological systems by altering tem-peratures, rainfall patterns, and other aspects of the climate (IPCC 2001). Some negative consequences of climate change may affect poorer tropical and sub-tropical countries disproportionately (IPCC 2001:9, 12), worsening global inequality. Less developed countries are also vulnerable because they have lim-ited resources to adapt to climate change.
Energy consumption in transportation, currently 28 percent of global energy use, is rising faster than in any other sector (Fulton et al. 2002:17; Sperling 2002:2). Transportation was responsible for 23 percent of global carbon dioxide emissions in 1997 (Sperling 2002:21). In South Africa, transportation activities produce one-fifth of the country’s greenhouse gas emissions (Prozzi et al. 2002:20).
Less developed countries (LDCs) will account for most of the growth in transportation sector green-house gas emissions over the coming decades, in large part because of rising automobile ownership and use (Fulton et al. 2002:20). Although higher incomes often coincide with greater numbers of trips taken in private vehicles, this relationship is not fixed (Sper-ling 2002:10). Through policy and investment deci-sions that constrain private vehicle ownership and use while providing attractive alternatives, cities can influence patterns of urban development in a way that reduces greenhouse gas emissions.
Given the pressing social issues they face, LDCs have limited resources to commit to efforts to reduce greenhouse gas emissions. Wealthy countries have made some funding available for LDC transportation projects through international donor agencies such as the Global Environment Facility (GEF). Projects sponsored by the GEF initially focused on improving vehicle efficiencies and promoting fuel cell demon-
stration technology, but some of the organization’s more recent efforts recognize that significant, near-term transportation emissions reductions will require a more comprehensive approach (Hook and Wright 2003:7). Projects in Santiago, Chile and Lima, Peru seek to promote public and non-motorized trans-portation through infrastructure improvements and land-use planning (GEF 2004). Shifting the balance away from private automobile use is expected to re-duce emissions in these cities. In general, cities with greater fractions of trips by public transportation tend to produce lower transportation sector greenhouse gas emissions (Newman and Kenworthy 1999:120).
A key intervention consists of improving the per-formance of buses. In cities around the world, traffic congestion slows bus speeds, making buses increas-ingly unappealing to current and potential riders. “Bus rapid transit” has emerged as an array of technologies that can reduce bus travel times and otherwise provide a more convenient service. BRT systems feature vari-ous combinations of the following characteristics: • Dedicated lanes, free of other road traffic • Station stops • Level boarding, sometimes through multiple
doors • Prepaid boarding • Traffic signal priority at intersections • Arrival time displays at stations
Taken together, these design approaches give BRT some of the “feel” of a rail system, but at a signifi-cantly lower cost. BRT construction costs range from $1 to 10 million per kilometer (km), compared to $10 to 30 million per km for light rail and $15 to $180 million per km for subways. The use of existing road infrastructure allows for rapid implementation, in contrast to the lengthy planning and construction periods required for rail systems. Bogotá, Colombia, implemented a 41 km BRT system in 2 years (CAF and Transmilenio 2004:7). In Jakarta, Indonesia, the design and construction of a 12.9 km BRT line lasted only 8 months (Fjellstrom 2003:2). By reallocating road space from private to public vehicles, BRT can improve the relative appeal of public transportation, potentially setting the stage for a transition to a less pollution-intensive transportation system.
2background
2
background 3
2.1 Urban context in South Africa
Greenhouse gas emissions from South Africa’s trans-portation sector are particularly high as a result of de-cades of racially motivated urban policy. The National Party, after coming into power in 1948, instituted a series of regulations to ensure the complete segrega-tion of South Africa’s racial groups. An early piece of apartheid legislation, the 1950 Group Areas Act, com-pelled local authorities to create separate commercial and residential areas for blacks, whites, Indians, and persons of mixed racial descent (Tomlinson 1990:35). Planners located black townships in the urban periph-ery, well away from white residential neighborhoods, forcing township residents to make long daily trips to work. In Cape Town, townships lie an average of 19 kilometers from the central business district (Prozzi et al. 2002:3). The effect of increasing physical sepa-ration between work and home locations is exempli-fied by the disappearance of South Africa’s bicycling industry and culture (White 1999). Overall, the long travel distances resulting from apartheid spatial poli-cies caused transportation energy use and greenhouse gas emissions to rise above levels in more compact cit-ies (Naude et al. 2000:16).
Initially, the national government subsidized long-distance bus and train services to ensure the sup-ply of black labor despite the long commute distances (ibid). Transportation subsidies became increasingly unsustainable in the 1980s as government priorities shifted to social services and internal security (Prozzi et al. 2002:7). Private minibus operators were allowed to expand their service in order to relieve the govern-ment of some of the financial burden of public trans-portation. Still, subsidies remain high, covering 56 percent of rail operating costs and 60 percent of bus operating costs in Cape Town (Behrens and Wilkin-son 2003:161).
2.2 Transportation in Cape Town
Consistent with trends elsewhere in the developing world, Cape Town faces increasing levels of private automobile ownership and use. Growth in the city’s automobile stock, approximately 45 percent from 1990 to 2000, exceeds the growth rate of the popula-tion and is expected to continue at a rapid pace (CCT 2004b:107; Behrens 2002:8). A market segmentation
study conducted by the South African Department of Transport predicted that the number “stubborn” travelers, those only willing to travel by automobile, would increase 88 percent by 2020 (Cameron and Kingma 2002:1). The number of “selective” travelers, open to using public transport but financially able to use cars, would rise by 30 percent over the same time period (ibid). “Selective” travelers currently make up 19 percent of the urban population, and “stubborn” travelers, 14 percent (Cameron and Kingma 2002:2). Rising affluence, a dispersion of home and work locations, and the poor quality of public transporta-tion are all contributing to the rising use of private vehicles. The additional cars contribute to congestion, slowing public and private vehicles alike. In addition, increased automobile use exacerbates unhealthy levels of air pollution in Cape Town.
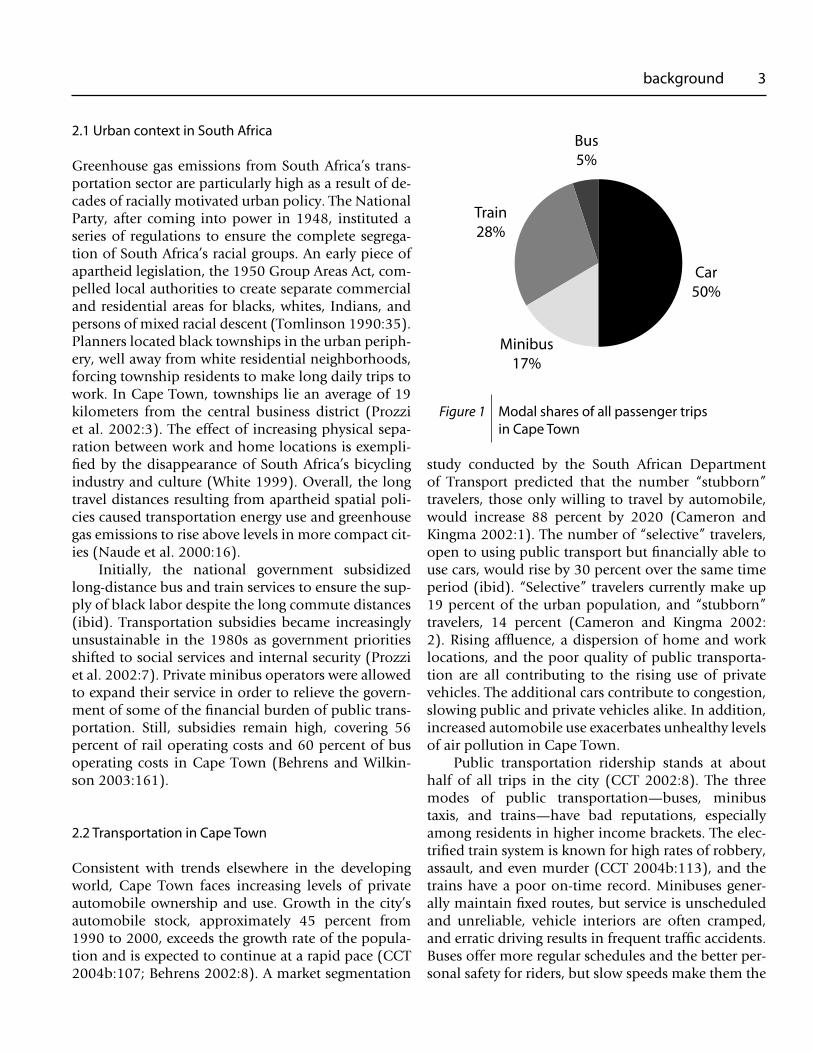
Public transportation ridership stands at about half of all trips in the city (CCT 2002:8). The three modes of public transportation—buses, minibus taxis, and trains—have bad reputations, especially among residents in higher income brackets. The elec-trified train system is known for high rates of robbery, assault, and even murder (CCT 2004b:113), and the trains have a poor on-time record. Minibuses gener-ally maintain fixed routes, but service is unscheduled and unreliable, vehicle interiors are often cramped, and erratic driving results in frequent traffic accidents. Buses offer more regular schedules and the better per-sonal safety for riders, but slow speeds make them the
������
����������
�����
��������
Figure 1 Modal shares of all passenger trips in Cape Town
least popular form of public transportation.Little coordination occurs among the three public
transportation modes, leading to duplication of ser-vice. The City of Cape Town has no budgetary or legal control over the train operator Metrorail, which oper-ates as a subsidiary of a corporation owned by the na-tional government (Holtzhausen 2003). Over the past decade, the minibus industry has undergone a rapid, unplanned expansion, its ridership as a fraction of all trips by public transportation rising threefold. Oppor-tunistic minibus operators sought out Cape Town’s most lucrative routes, to the detriment of bus and rail ridership. Most of the new minibus passengers switched from buses, leading to intense competition between the two road-based modes (CCT 2002:27). The high frequency of service on some routes during the morning and evening peak periods served as a key selling point for minibuses. In 2000, the conflict between buses and minibuses erupted in the form of a “taxi war,” resulting in deaths and injuries among drivers and passengers.
Buses and minibuses both continue to serve long distance routes, with the result that many vehicles have unused capacity. Bus passengers fill only around 43 percent of capacity even during peak periods (CCT 2004b:111). Bus loads remain low in part because the City requires the operator, Golden Arrow Bus Services, to provide service to communities that otherwise would lack transportation options. The smaller-sized minibuses would be more appropriately scaled to this task, but the City has more control over Golden Ar-row, a public-private partnership, than over the pri-vate minibus companies.
2.3 Air quality in Cape Town
The shift from public transportation to private vehicle use in Cape Town contributes to rising motor vehicle emissions of local pollutants, including particulate matter and nitrous oxides. Particulate matter (PM) contributes to lung cancer, heart attacks, asthma, and strokes. Ground-level ozone, formed by reactions of nitrogen oxides (NOx) and organic compounds in the presence of sunlight, exacerbates respiratory ail-ments, including asthma. Besides their health effects, “brown haze” episodes, accentuated by a temperature inversion layer during the winter, are considered to be detrimental to Cape Town’s growing tourism industry
(Wicking-Baird et al. 1997).Diesel and gasoline vehicles contribute 42 and 25
percent, respectively, of particulate matter emissions in Cape Town (ibid:iv). Diesel vehicles account for nearly half of visibility impairment, and gasoline ve-hicles, 17 percent (ibid:v). While testing has indicated that atmospheric NOx concentrations in Cape Town are in decline, ozone and PM levels are increasing or remaining roughly steady (CCT 2004b:11). The City’s State of Environment report expresses concern that PM concentrations are especially high in the densely pop-ulated, lower-income area of Khayelitsha (ibid). PM concentrations, in Khayelitsha and elsewhere, exceed the United Kingdom’s health guidelines (ibid:14). Wicking-Baird et al. (1997:60) expect PM pollution levels to rise at a rate of 4 percent per year because fuel consumption is increasing and the motor vehicle fleet in Cape Town is aging.
South Africa has not set national ambient air quality or mobile source emissions standards. Most vehicles in the country still lack catalytic convertors (Prozzi 2002:18). Motor vehicle pollution control is limited to efforts at the local level. The City of Cape Town has established a program to identify smoking diesel vehicles (CCT 2004a). Since 2000, the City has stopped offending vehicles at roadside checkpoints, recorded the light transmittance of exhaust, and re-quired owners to have their vehicles serviced. The program does not address pollution from gasoline vehicles.
2.4 Bus rapid transit in Cape Town
To address its worsening congestion and pollution problems, the City of Cape Town has proposed a 30 km BRT line along the “Klipfontein Corridor,” a series of 4- and 6-lane arterials stretching from the central business district to outlying suburbs and former townships. City officials began the planning process in early 2003 and plan to have the system operational by 2005. The BRT system is part of a USD 70 million project to rejuvenate portions of the city that had been marginalized during the years of apartheid (Gophe 2004).
Presently buses, minibuses, and private automo-biles all use the roads that comprise the Corridor. Along some portions of the Corridor, the city has painted an additional lane stripe to indicate that only
4 background
background 5
buses and minibuses may use the leftmost lane. With-out enforcement from traffic officers, the lane desig-nation has failed to increase bus and minibus speeds. Private car drivers use the public transportation lane without hesitation and sometimes even park in the lane, forcing through-traffic to enter the remaining general lanes (Manojlovic 2003; personal observa-tions). Even if enforced, the lane designation would have a limited effect on public transportation travel times. Cars may still enter the lane to make left turns, and buses would be subject to the erratic stopping pat-terns of minibuses. The proposed BRT system would appropriate two lanes, either on the sides of the road or at the median, making use of a physical barrier to separate buses from other traffic.
To the extent that travelers view the BRT system as an improvement over the existing bus mode, they may be inclined to switch to BRT from their current modes. This switching could have emissions benefits to the extent that the BRT system transports riders more efficiently, in terms of pollution, than do the alternate modes. For instance, introduction of the BRT system could reduce emissions of greenhouse gases if it drew passengers from cars, such that the fall in emis-sions resulting from the decrease in car travel more than compensated for the rise in emissions from the increase in bus travel. The next section describes the methodology used to predict the overall emissions effect.
6
3analytical approach
Researchers have followed a variety of methods in analyses of the emissions effects of new public transportation systems, depending on
the scope, data sources, time horizon, and goals of the study. The following discussion attempts to give a sense of the approaches that are relevant to this study.
Romilly (1999) investigates changes in social costs from pollution if car users switch to buses in urban settings in the United Kingdom. A spreadsheet model calculates the cost differential between sce-narios: in one scenario, 160 passengers travel with automobiles, and in other, the riders travel by bus. In each case, the load factor—the number of passengers in each vehicle—and distance traveled are assumed to equal the corresponding national averages for the U.K. Since external costs for buses sometimes exceed those for cars for his assumed load factors, Romilly performs sensitivity analysis to determine what bus loads would be sufficient for the bus and car costs to be equal.
Prozzi et al. (2002), in a discussion of greenhouse gas emissions from transportation in South Africa as a whole, offer a pair of emissions scenarios for 2020. The study seeks to gauge the extent to which the country could alter its emissions trajectory by way of governmental policy interventions. To generate the alternative emissions scenarios, the researchers assumed two sets of changes in vehicle loads, modal splits, trip lengths, and other variables, relative to the base year of 2000. These assumptions simulate plausible responses to governmental efforts to make public transportation more efficient and convenient, among other things. The accuracy of the emissions projections depends on the researchers’ understand-ing of the relationship between governmental regula-tion and the behavior of travelers.
Studies that consider the emissions effects of shorter-term modifications of transportation systems can attempt to model changes in travel demand with
more precision. Some analyses make use of transpor-tation modeling software, which follows a four-step simulation process, consisting of trip generation, trip distribution, mode choice, and trip assignment. “Trip generation” models use demographic information, including household income and vehicle owner-ship, and employment data to predict the number of trips originating and arriving in each zone that a modeler has created for a city. The “trip distribution” component then allocates a certain number of these trips to each origin-destination pair in the city. For each trip defined by the first two steps, the “modal choice” model uses information on characteristics of the trips and of the travelers’ preferences to predict modal shares for each origin-destination pair. Finally, the “trip assignment” component predicts the routes taken by travelers so as to optimize the levels of con-gestion through the city’s road network.
The city of Bogotá, Colombia, has applied for funding through the Clean Development Mechanism to extend its BRT system, based on predicted reduc-tions in greenhouse gas emissions. Bogotá’s emis-sions estimation procedure (CAF and Transmilenio 2004) relies on the results of transportation modeling software to predict the future “modal split,” the dis-tribution of travelers among the available transporta-tion modes, for corridors relevant to the BRT system. Compared to the country-level predictions in Prozzi et al. (2002), the policy intervention is defined at a finer level of detail in the modeling software, and the software uses revealed preference data to make a more rigorous prediction about the future behavior of indi-vidual travelers. Then, the modal split proportions are used to calculate the number of trips by each mode, and these figures are multiplied by average trip lengths and emissions rates.
3.1 From trips to emissions
The present study begins with the third step, “modal choice,” from the transportation modeling software process described above. The outcomes of the first two steps, the total number of trips and the origins and destinations of those trips, are assumed to remain the same under all policy intervention scenarios. Changes in modal choice, in the third step, are expected to
6
constitute the primary mechanism by which the BRT system reduces emissions.
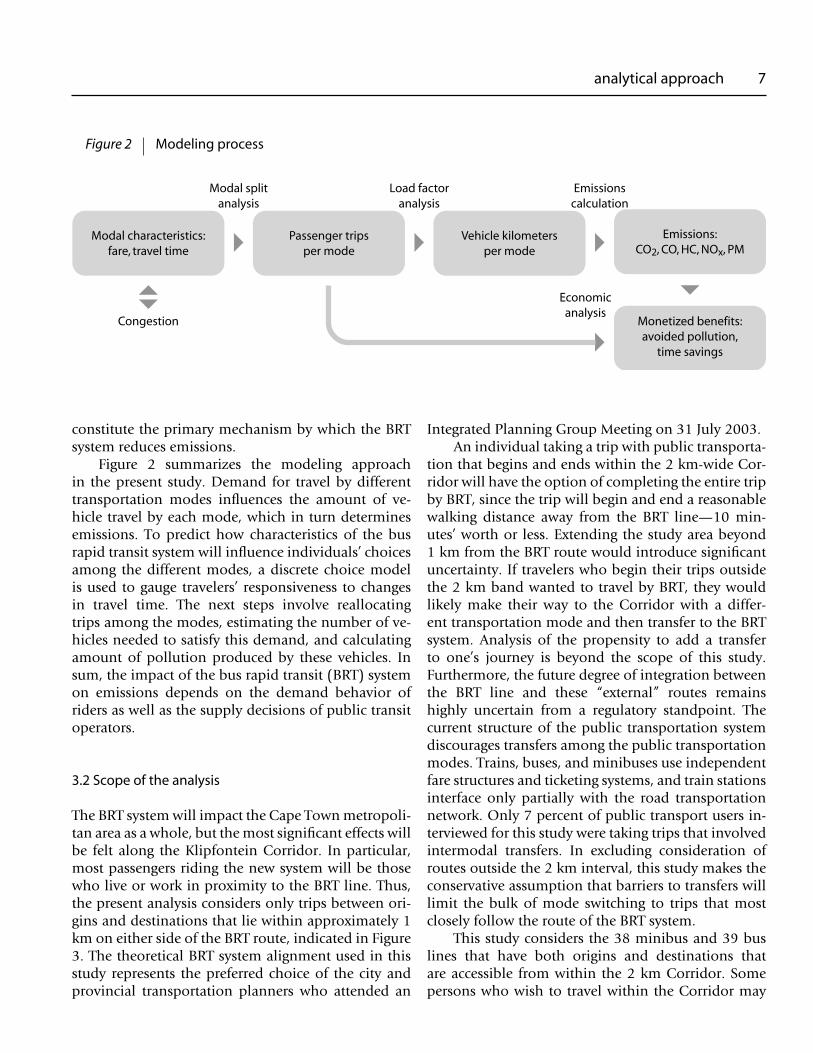
Figure 2 summarizes the modeling approach in the present study. Demand for travel by different transportation modes influences the amount of ve-hicle travel by each mode, which in turn determines emissions. To predict how characteristics of the bus rapid transit system will influence individuals’ choices among the different modes, a discrete choice model is used to gauge travelers’ responsiveness to changes in travel time. The next steps involve reallocating trips among the modes, estimating the number of ve-hicles needed to satisfy this demand, and calculating amount of pollution produced by these vehicles. In sum, the impact of the bus rapid transit (BRT) system on emissions depends on the demand behavior of riders as well as the supply decisions of public transit operators.
3.2 Scope of the analysis
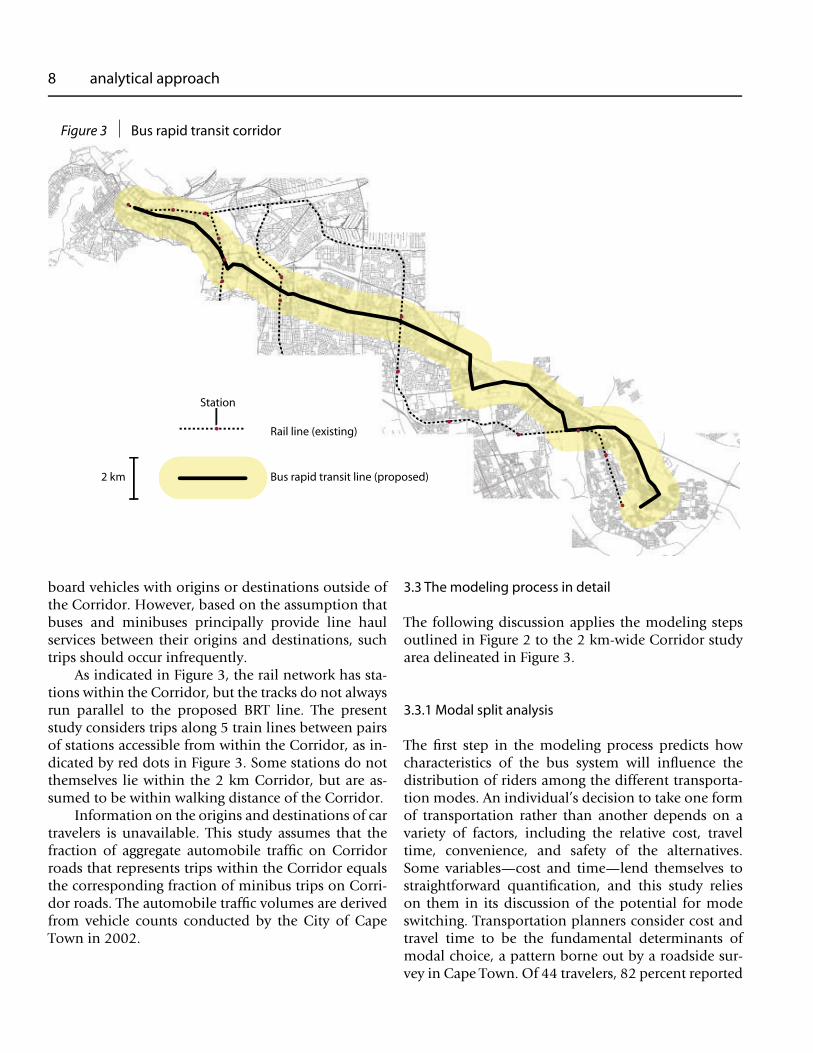
The BRT system will impact the Cape Town metropoli-tan area as a whole, but the most significant effects will be felt along the Klipfontein Corridor. In particular, most passengers riding the new system will be those who live or work in proximity to the BRT line. Thus, the present analysis considers only trips between ori-gins and destinations that lie within approximately 1 km on either side of the BRT route, indicated in Figure 3. The theoretical BRT system alignment used in this study represents the preferred choice of the city and provincial transportation planners who attended an
Integrated Planning Group Meeting on 31 July 2003.An individual taking a trip with public transporta-
tion that begins and ends within the 2 km-wide Cor-ridor will have the option of completing the entire trip by BRT, since the trip will begin and end a reasonable walking distance away from the BRT line—10 min-utes’ worth or less. Extending the study area beyond 1 km from the BRT route would introduce significant uncertainty. If travelers who begin their trips outside the 2 km band wanted to travel by BRT, they would likely make their way to the Corridor with a differ-ent transportation mode and then transfer to the BRT system. Analysis of the propensity to add a transfer to one’s journey is beyond the scope of this study. Furthermore, the future degree of integration between the BRT line and these “external” routes remains highly uncertain from a regulatory standpoint. The current structure of the public transportation system discourages transfers among the public transportation modes. Trains, buses, and minibuses use independent fare structures and ticketing systems, and train stations interface only partially with the road transportation network. Only 7 percent of public transport users in-terviewed for this study were taking trips that involved intermodal transfers. In excluding consideration of routes outside the 2 km interval, this study makes the conservative assumption that barriers to transfers will limit the bulk of mode switching to trips that most closely follow the route of the BRT system.
This study considers the 38 minibus and 39 bus lines that have both origins and destinations that are accessible from within the 2 km Corridor. Some persons who wish to travel within the Corridor may
Figure 2 Modeling process
analytical approach 7
����� ��������������������� ������ ����
����� �������������
���� ��������������
����������
��������� �������� ����
������� ������������� ����
�������������� ���������� ��
��������������������
��������� ���������������� ����������
���� �������
����������������
board vehicles with origins or destinations outside of the Corridor. However, based on the assumption that buses and minibuses principally provide line haul services between their origins and destinations, such trips should occur infrequently.
As indicated in Figure 3, the rail network has sta-tions within the Corridor, but the tracks do not always run parallel to the proposed BRT line. The present study considers trips along 5 train lines between pairs of stations accessible from within the Corridor, as in-dicated by red dots in Figure 3. Some stations do not themselves lie within the 2 km Corridor, but are as-sumed to be within walking distance of the Corridor.
Information on the origins and destinations of car travelers is unavailable. This study assumes that the fraction of aggregate automobile traffi c on Corridor roads that represents trips within the Corridor equals the corresponding fraction of minibus trips on Corri-dor roads. The automobile traffi c volumes are derived from vehicle counts conducted by the City of Cape Town in 2002.
8 analytical approach
���� ���� ����������
��� ����� ������� ���� ����������
�������
� ��
Figure 3 Bus rapid transit corridor
3.3 The modeling process in detail
The following discussion applies the modeling steps outlined in Figure 2 to the 2 km-wide Corridor study area delineated in Figure 3.
3.3.1 Modal split analysis
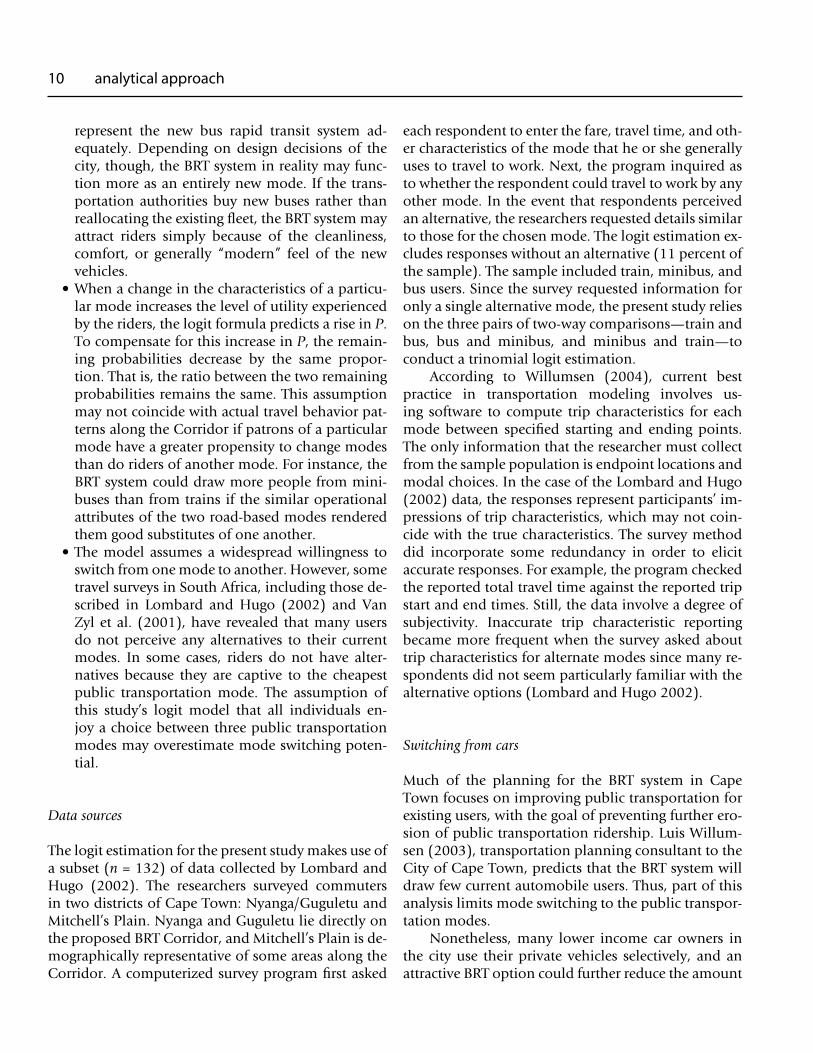
The fi rst step in the modeling process predicts how characteristics of the bus system will infl uence the distribution of riders among the different transporta-tion modes. An individual’s decision to take one form of transportation rather than another depends on a variety of factors, including the relative cost, travel time, convenience, and safety of the alternatives. Some variables—cost and time—lend themselves to straightforward quantifi cation, and this study relies on them in its discussion of the potential for mode switching. Transportation planners consider cost and travel time to be the fundamental determinants of modal choice, a pattern borne out by a roadside sur-vey in Cape Town. Of 44 travelers, 82 percent reported
cost or travel time as the primary reason for choosing one mode over another (see Table 1).
Econometric model
Multinomial logit, a standard disaggregate model used in transportation planning, can help predict the effect of a change in a characteristic of a mode on the probability that an individual selects the mode. The utility, U
ni, of mode i for person n depends on known
variables, such as cost and travel time, as well as fac-tors unobserved by the researcher:
(1)where V
ni is the observed “representative utility” of
mode i for person n and εni represents unobserved fac-
tors (Train 2003:38). For a choice among three alter-natives, the model defines the probability of choosing mode x for person n as
(2)V
i is a linear function of the trip characteristics that the
traveler would face when using mode i:
(3)where c
ni is the cost and t
ni is the travel time faced by
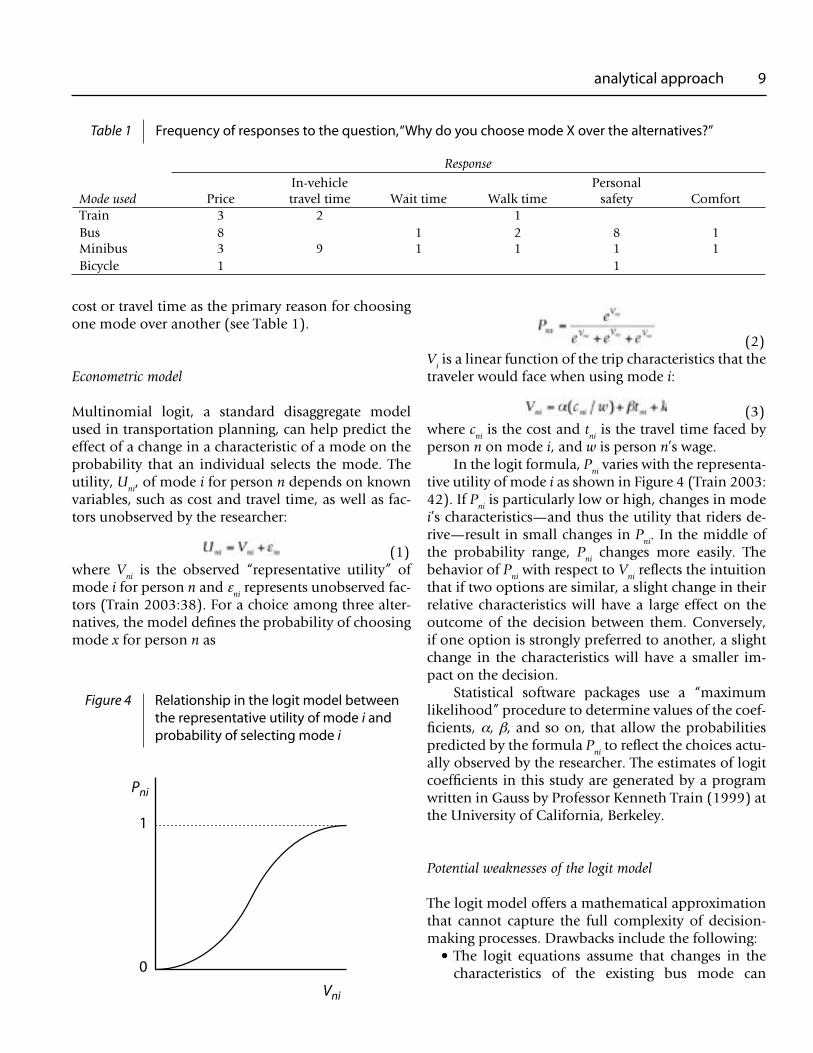
person n on mode i, and w is person n’s wage.In the logit formula, P
ni varies with the representa-
tive utility of mode i as shown in Figure 4 (Train 2003:42). If P
ni is particularly low or high, changes in mode
i’s characteristics—and thus the utility that riders de-rive—result in small changes in P
ni. In the middle of
the probability range, Pni changes more easily. The
behavior of Pni with respect to V
ni reflects the intuition
that if two options are similar, a slight change in their relative characteristics will have a large effect on the outcome of the decision between them. Conversely, if one option is strongly preferred to another, a slight change in the characteristics will have a smaller im-pact on the decision.
Statistical software packages use a “maximum likelihood” procedure to determine values of the coef-ficients, α, β, and so on, that allow the probabilities predicted by the formula P
ni to reflect the choices actu-
ally observed by the researcher. The estimates of logit coefficients in this study are generated by a program written in Gauss by Professor Kenneth Train (1999) at the University of California, Berkeley.
Potential weaknesses of the logit model
The logit model offers a mathematical approximation that cannot capture the full complexity of decision-making processes. Drawbacks include the following: • The logit equations assume that changes in the
characteristics of the existing bus mode can
���
���
�
�
Relationship in the logit model between the representative utility of mode i and probability of selecting mode i
Table 1 Frequency of responses to the question, “Why do you choose mode X over the alternatives?”
Figure 4
Response
Mode used PriceIn-vehicle travel time Wait time Walk time
Personal safety Comfort
Train 3 2 1Bus 8 1 2 8 1Minibus 3 9 1 1 1 1Bicycle 1 1
analytical approach 9
represent the new bus rapid transit system ad-equately. Depending on design decisions of the city, though, the BRT system in reality may func-tion more as an entirely new mode. If the trans-portation authorities buy new buses rather than reallocating the existing fleet, the BRT system may attract riders simply because of the cleanliness, comfort, or generally “modern” feel of the new vehicles.
• When a change in the characteristics of a particu-lar mode increases the level of utility experienced by the riders, the logit formula predicts a rise in P. To compensate for this increase in P, the remain-ing probabilities decrease by the same propor-tion. That is, the ratio between the two remaining probabilities remains the same. This assumption may not coincide with actual travel behavior pat-terns along the Corridor if patrons of a particular mode have a greater propensity to change modes than do riders of another mode. For instance, the BRT system could draw more people from mini-buses than from trains if the similar operational attributes of the two road-based modes rendered them good substitutes of one another.
• The model assumes a widespread willingness to switch from one mode to another. However, some travel surveys in South Africa, including those de-scribed in Lombard and Hugo (2002) and Van Zyl et al. (2001), have revealed that many users do not perceive any alternatives to their current modes. In some cases, riders do not have alter-natives because they are captive to the cheapest public transportation mode. The assumption of this study’s logit model that all individuals en-joy a choice between three public transportation modes may overestimate mode switching poten-tial.
Data sources
The logit estimation for the present study makes use of a subset (n = 132) of data collected by Lombard and Hugo (2002). The researchers surveyed commuters in two districts of Cape Town: Nyanga/Guguletu and Mitchell’s Plain. Nyanga and Guguletu lie directly on the proposed BRT Corridor, and Mitchell’s Plain is de-mographically representative of some areas along the Corridor. A computerized survey program first asked
each respondent to enter the fare, travel time, and oth-er characteristics of the mode that he or she generally uses to travel to work. Next, the program inquired as to whether the respondent could travel to work by any other mode. In the event that respondents perceived an alternative, the researchers requested details similar to those for the chosen mode. The logit estimation ex-cludes responses without an alternative (11 percent of the sample). The sample included train, minibus, and bus users. Since the survey requested information for only a single alternative mode, the present study relies on the three pairs of two-way comparisons—train and bus, bus and minibus, and minibus and train—to conduct a trinomial logit estimation.
According to Willumsen (2004), current best practice in transportation modeling involves us-ing software to compute trip characteristics for each mode between specified starting and ending points. The only information that the researcher must collect from the sample population is endpoint locations and modal choices. In the case of the Lombard and Hugo (2002) data, the responses represent participants’ im-pressions of trip characteristics, which may not coin-cide with the true characteristics. The survey method did incorporate some redundancy in order to elicit accurate responses. For example, the program checked the reported total travel time against the reported trip start and end times. Still, the data involve a degree of subjectivity. Inaccurate trip characteristic reporting became more frequent when the survey asked about trip characteristics for alternate modes since many re-spondents did not seem particularly familiar with the alternative options (Lombard and Hugo 2002).
Switching from cars
Much of the planning for the BRT system in Cape Town focuses on improving public transportation for existing users, with the goal of preventing further ero-sion of public transportation ridership. Luis Willum-sen (2003), transportation planning consultant to the City of Cape Town, predicts that the BRT system will draw few current automobile users. Thus, part of this analysis limits mode switching to the public transpor-tation modes.
Nonetheless, many lower income car owners in the city use their private vehicles selectively, and an attractive BRT option could further reduce the amount
10 analytical approach
that they travel in cars. On Fridays, for instance, con-gestion on Cape Town’s streets increases as commut-ers who normally travel with public transportation switch to automobiles to avoid having their weekly paychecks stolen during the trip home. BRT systems elsewhere in the world have successfully attracted riders from automobiles. In Vancouver, 20 percent of new riders had used cars previously (Levinson et al. 2003:6). Approximately 10 percent of the riders of Bogotá’s BRT system had traveled in automobiles (CAF and Transmilenio 2004:38).
3.3.2 Load factor analysis
In the modal split analysis, the logit equation predicts changes in the aggregate modal split for trips along the Klipfontein Corridor. The modal split can be ap-plied to the total number of trips taken to determine how many trips are taken on each mode. Then, the load factor analysis involves predicting the number of vehicles that will be used to carry the projected vol-umes of riders. (See Figure 2.)
Data sources
For estimates of status quo vehicle-km traveled by the different modes, the present study relies on data com-piled by the City of Cape Town’s Directorate of Trans-port, Roads and Stormwater. National law mandates that each municipality regularly publish a Current Public Transport Record (CPTR) that catalogs average daily vehicle operating patterns and ridership levels. The Cape Town CPTR distinguishes between morning peak, midday, and evening peak time periods. The lat-est update reflects traffic levels in 2000 and 2001. The CPTR offers data for the three public transportation modes as follows: • Trains. The CPTR includes the number of trains
and volume of passengers traveling between each pair of adjacent stations as well as the number of boardings and alightings at each station. Informa-tion on the number of tickets sold in October 2002 between every pair of stations in the Cape Town rail network supplements the CPTR data, which do not distinguish among different origin and destination pairs. Only a portion of total train traffic along each rail segment represents
analytical approach 11
���
���
���
���
�
��
��
��
��
���
���
����
���������
�������
��
��������
�����
������
�������
��
�������
����
��
������
����
��
����
����
�����
��
���������
�����
�����
�����
���
��
�������
���
�����
����
����
���
�����
�������
������
�������
���
����
���
����
������
���������
������
�
��������
�������
����
�
������
����
����
��������� ����������
��� ����
��
��
���
����
���
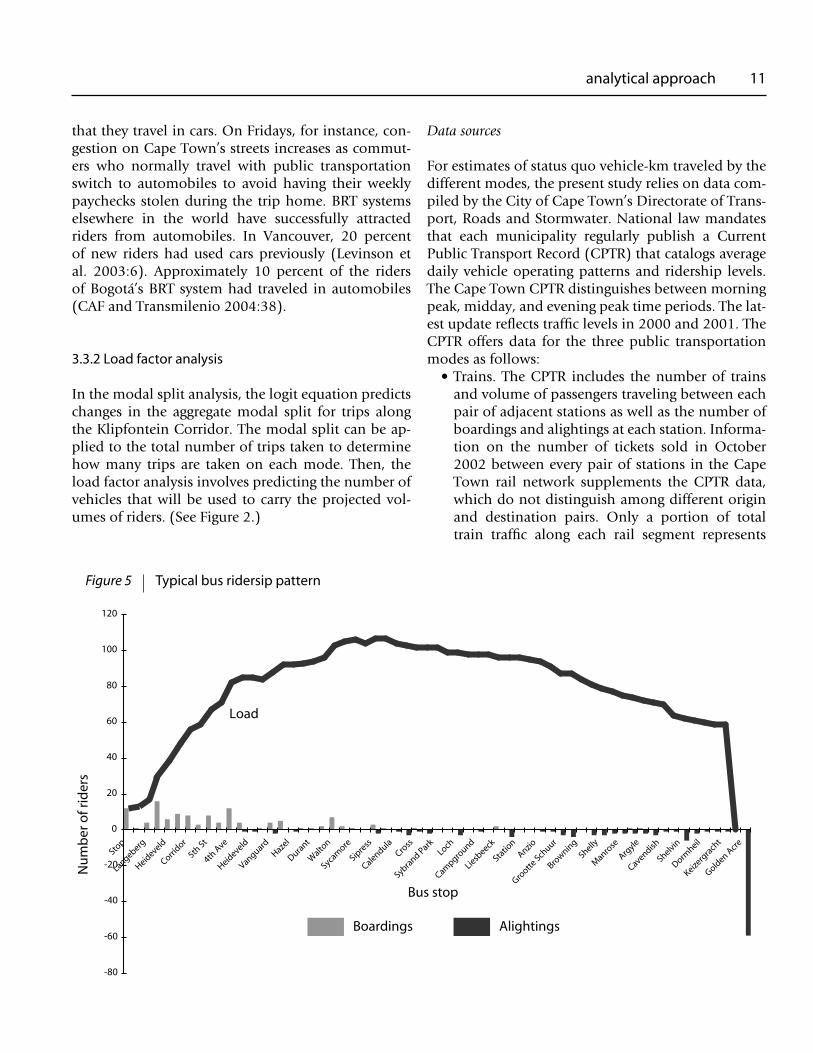
Figure 5 Typical bus ridersip pattern
travel between Corridor locations. The ratio of Corridor traffic to total traffic is assumed to equal the ratio of ticket sales for Corridor trips to total ticket sales.
• Minibuses. The CPTR assumes that in most cases minibuses provide a “line-haul” service.” That is, a group of passengers boards at the origin of a particular line and travels the entire distance to the destination. Thus, the CPTR provides a single figure for the ridership for each route.
• Buses. For each stop along a line, the CPTR lists the volume of passengers on the vehicle, the number of boardings, and the number of alightings. Given the difficulty of calculating the average number of passengers per unit of distance, this study takes the maximum passenger volume over the course of each trip to represent the number of passengers that traveled the route. The maximum usually of-fers a decent approximation of average ridership because buses in Cape Town tend to provide line haul service, similar to minibuses. Figure 5 shows a typical bus ridership pattern. Most passengers board before the bus travels far from its origin, and most get off at the end of the line. Relatively few riders board or alight from the bus mid-route. This assumption is conservative because it results in the underestimation of the potential for emis-sions reductions through increases in load fac-tors.
Data on automobile travel are limited to roadside vehicle counts conducted by the City of Cape Town, separate from the CPTR.
Passenger volumes under the alternative scenarios
The mode switching analysis considers the changes in travel time and fare that would be experienced by someone making a representative Corridor trip, from the Nyanga/Guguletu area to the central business district. All travelers along the Corridor are assumed to benefit from time savings proportional to those experienced by the Nyanga/Guguletu subset, so this subset’s change in modal choice is applied to all Cor-ridor travelers.
Modal shifts occur among the pools of all trips taken on each mode. Besides failing to account for the differences in modal characteristics experienced by riders in different parts of the Corridor, such aggrega-
tion leads to inaccuracy to the extent that the modes have different trip length distributions. The inaccuracy results in a conservative estimate of emissions effects because buses have the highest average trip lengths.
For the logit formula, the change in Pni, the prob-
ability of choosing mode i, due to a change in param-eter z of the same mode is defined as
(4)(Train 2003:62). If z changes for mode j, the effect on the probability of choosing mode i is defined as
(5)(ibid). The following formula combines (4) and (5) and approximates the change in P
ni in response to a
small marginal change in z for the three modes:
(6)Δz could equal, among other things, the reduction in bus travel time as a result of dedicated bus lanes. Extrapolation of the coefficients β
z to apply to auto-
mobiles allows for consideration of four modes in the modal split model:
(7)With the new probability, a new number of trips
can be calculated for each mode. For example,
(8)where B
x is the number of bus trips in scenario x, and
T0, B0, and M0 are the numbers of train, bus, and mini-bus trips under the status quo scenario.
Traffic volumes under alternative scenarios
Operators of the different modes are expected to react differently to changes in passenger demand: • Three of the rail lines are operating near or over
capacity, but the operator cannot supply addi-tional trains due to limitations of the signaling system. For these lines, the number of trains is assumed to remain constant. For the remaining two lines, which see lower passenger loads, the number of trains rises or falls in proportion to
12 analytical approach
changes in the number of riders. • Cape Town’s buses have an average seated capac-
ity of 67 and standing room for 25 persons. The CPTR and other city publications (such as CCT 2002) count the sum of standing and sitting room to be the capacity of a bus. However, given poten-tial for growth on a particular route, the operator tends to add a new vehicle when the load exceeds the seated capacity (Krause 2004). Thus, to the extent that the BRT system results in higher bus ridership, existing buses are allowed to fill to the seated capacity. Until all buses on a particular line have reached a load of 67 passengers, the number of vehicles remains constant. As soon as a line’s new volumes exceed present capacity, new buses are added as needed to maintain a load factor of 67 passengers per vehicle.
• In the minibus industry, supply decisions are market-driven, so drivers are expected to leave routes with falling ridership in search of more profitable opportunities. Therefore, the number of vehicles rises or falls in proportion to changes in the number of riders. That is, the number of ve-hicles is multiplied by the same scalar that is used to adjust the number of riders. The load factor for each route remains the same.
• As with minibuses, the load factor for cars is as-sumed to stay constant at 2 persons per vehicle. The number of vehicles is directly proportional to the number of riders.
Passenger and vehicle volumes are calculated for each individual train, bus, and minibus route. Separate calculations are maintained for the morning, midday, and evening periods in order to account for changes in load factors at different times of the day.
3.3.3 Emissions calculation
The present study estimates emissions levels on a per-kilometer basis. The first set of emissions factors, labeled “Basic,” assumes direct conversions (Environ-ment Canada 2003; Eskom 2003; Mkhabela 2003) between volume of fuel or quantity of electricity consumed and the mass of carbon dioxide released. Fuel consumption factors for private automobiles and minibuses come from Schutte (1996:2-2), who provides parameters for the South African context. The fuel consumption factor for buses constitutes a weighted average of the efficiencies of five different types of buses that comprise the fleet of Golden Ar-row Bus Services (GABS), Cape Town’s bus operator. Electricity consumption of trains is assumed to equal the average for U.S. heavy rail systems (APTA 2003). The level of greenhouse gas emissions from electricity production reflects the mix of nuclear, coal, and hy-droelectric sources that serve Cape Town, as estimated by the South African electricity provider Eskom.
The second set of emissions factors, “LEM,” is from the Lifecycle Emissions Model, developed by Mark Delucchi (2003) at the University of California, Davis. Whereas the Basic factors consider only end-use emissions, the LEM estimates take into account the additional upstream pollution generated in the process of producing the fuels. In addition, the LEM
analytical approach 13
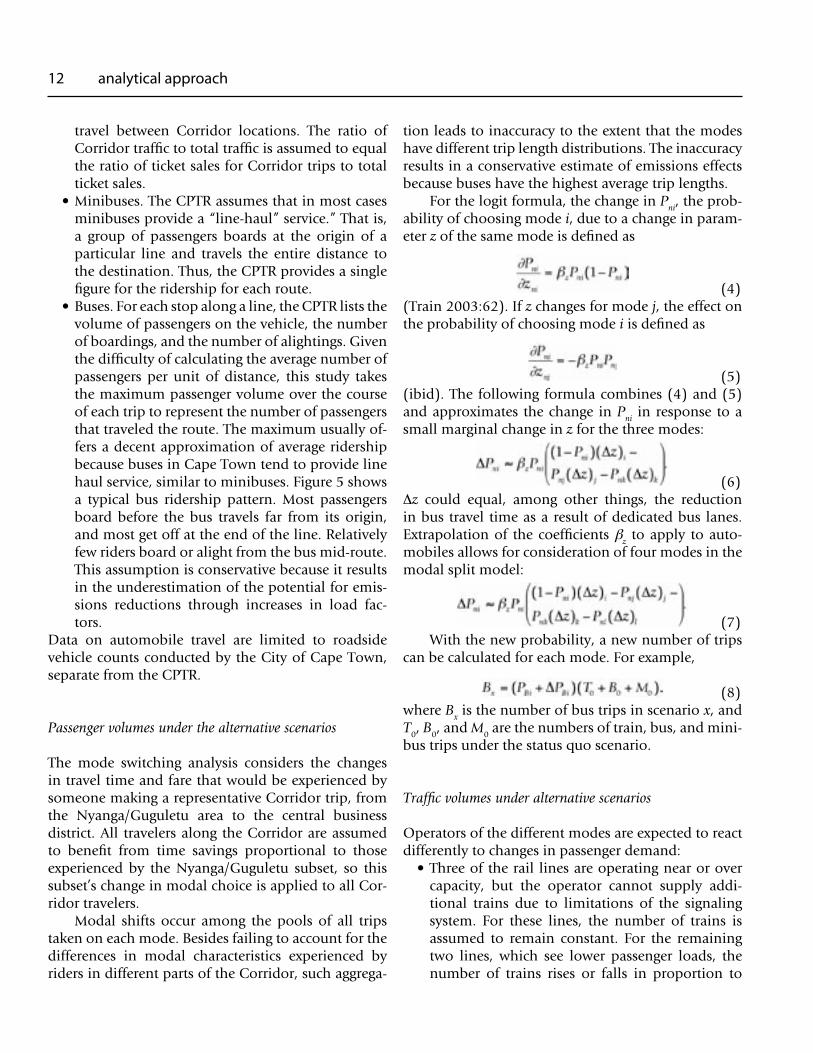
Table 2 Emissions factors: greenhouse gases (kg / km)
Basic(CO
2 only)
LEM (CO2 and
equivalents)Train 1.62 0.14Bus 1.19 6.09Minibus 0.33 0.89Car 0.26 0.55
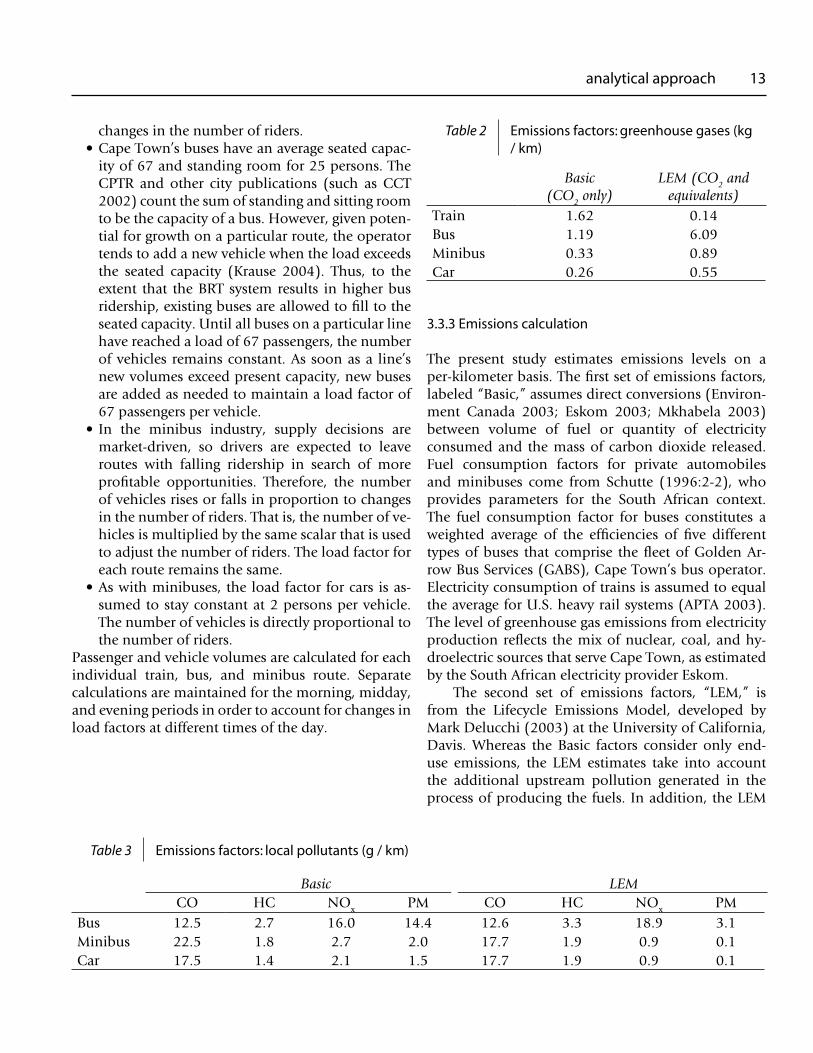
Table 3 Emissions factors: local pollutants (g / km)
Basic LEMCO HC NOx PM CO HC NOx PM
Bus 12.5 2.7 16.0 14.4 12.6 3.3 18.9 3.1Minibus 22.5 1.8 2.7 2.0 17.7 1.9 0.9 0.1Car 17.5 1.4 2.1 1.5 17.7 1.9 0.9 0.1
calculates emissions of non-CO2 greenhouse gases and reports these emissions in CO2-equivalent values. These additional emissions are especially significant in South Africa (Delucchi 2004). Dr. Delucchi had previously customized the LEM for use in South Af-rica. For this study, the customized model was run to predict emissions per vehicle-km in the year 2005. The “Basic” and “LEM” emissions factors are listed in Tables 2 and 3.
The emissions calculations do not take into ac-count variation due to speed, the frequency of stops, or other specific vehicle operating characteristics. Fol-lowing the calculation of the number of vehicle-km traveled, the amount of pollution produced by the ve-hicles is determined. For the Basic emissions factors,
(9)For the LEM emissions factors,
(10)For sensitivity analysis, current emissions of local
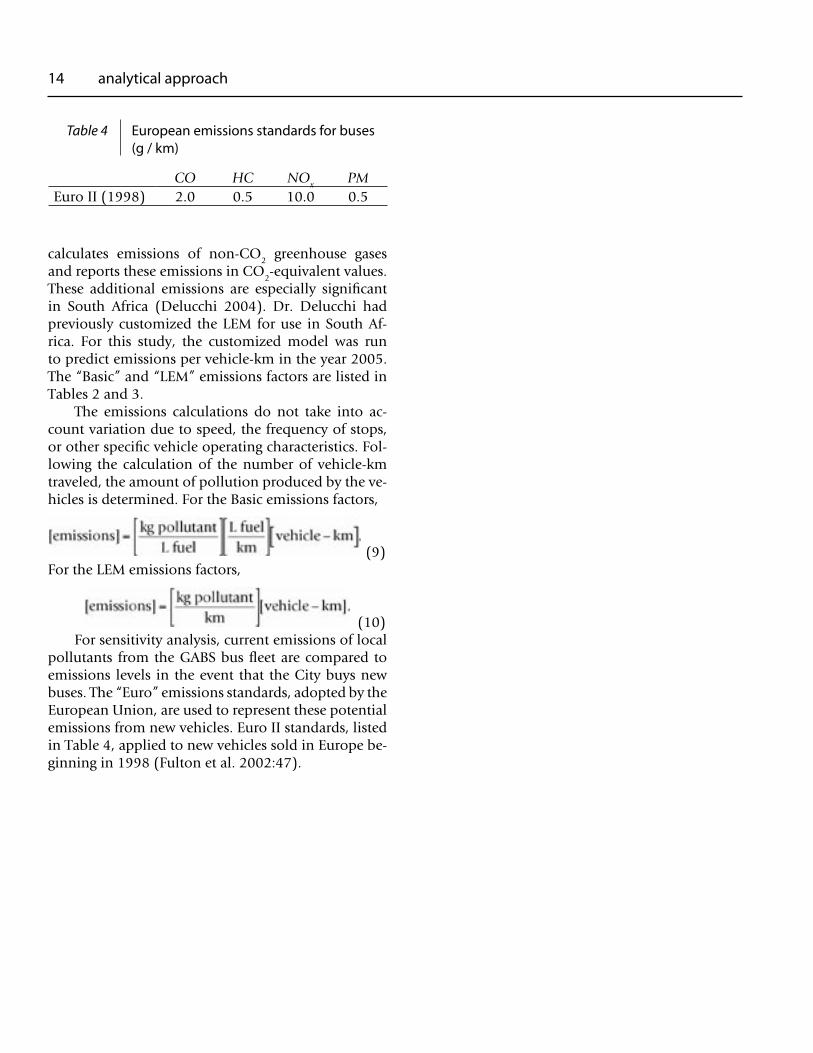
pollutants from the GABS bus fleet are compared to emissions levels in the event that the City buys new buses. The “Euro” emissions standards, adopted by the European Union, are used to represent these potential emissions from new vehicles. Euro II standards, listed in Table 4, applied to new vehicles sold in Europe be-ginning in 1998 (Fulton et al. 2002:47).
14 analytical approach
Table 4 European emissions standards for buses (g / km)
CO HC NOx
PMEuro II (1998) 2.0 0.5 10.0 0.5
4econometric results
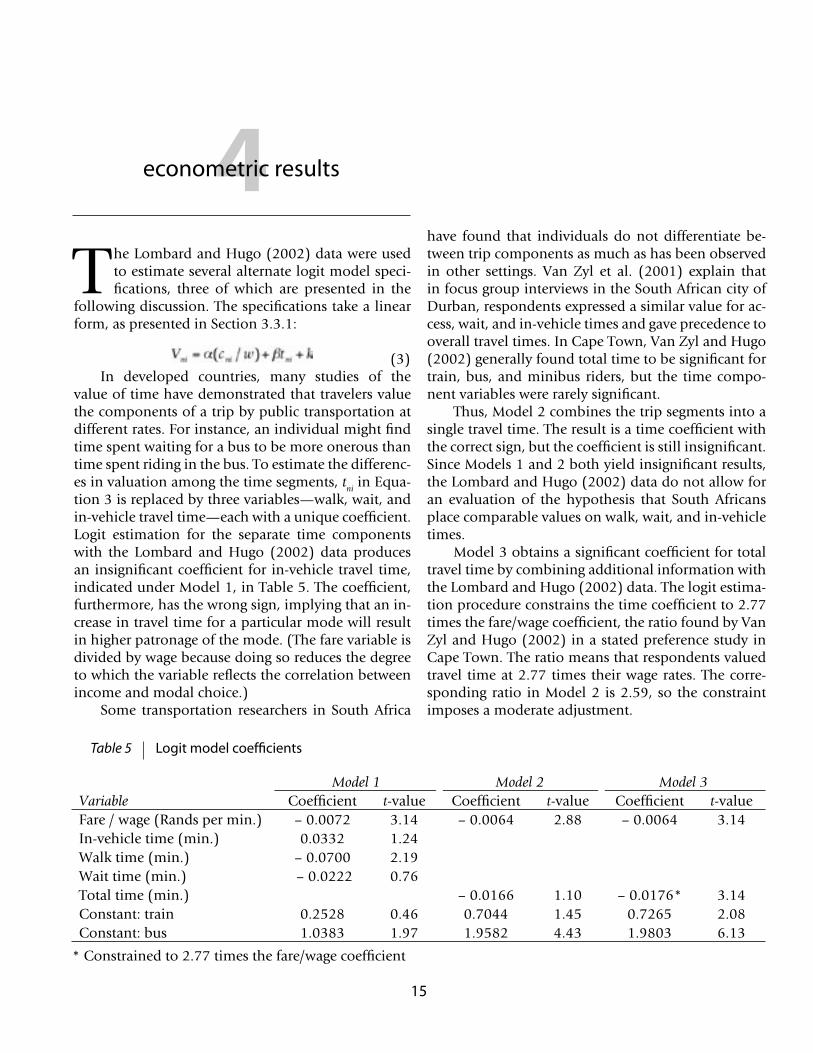
The Lombard and Hugo (2002) data were used to estimate several alternate logit model speci-fications, three of which are presented in the
following discussion. The specifications take a linear form, as presented in Section 3.3.1:
(3)In developed countries, many studies of the
value of time have demonstrated that travelers value the components of a trip by public transportation at different rates. For instance, an individual might find time spent waiting for a bus to be more onerous than time spent riding in the bus. To estimate the differenc-es in valuation among the time segments, t
ni in Equa-
tion 3 is replaced by three variables—walk, wait, and in-vehicle travel time—each with a unique coefficient. Logit estimation for the separate time components with the Lombard and Hugo (2002) data produces an insignificant coefficient for in-vehicle travel time, indicated under Model 1, in Table 5. The coefficient, furthermore, has the wrong sign, implying that an in-crease in travel time for a particular mode will result in higher patronage of the mode. (The fare variable is divided by wage because doing so reduces the degree to which the variable reflects the correlation between income and modal choice.)
Some transportation researchers in South Africa
have found that individuals do not differentiate be-tween trip components as much as has been observed in other settings. Van Zyl et al. (2001) explain that in focus group interviews in the South African city of Durban, respondents expressed a similar value for ac-cess, wait, and in-vehicle times and gave precedence to overall travel times. In Cape Town, Van Zyl and Hugo (2002) generally found total time to be significant for train, bus, and minibus riders, but the time compo-nent variables were rarely significant.
Thus, Model 2 combines the trip segments into a single travel time. The result is a time coefficient with the correct sign, but the coefficient is still insignificant. Since Models 1 and 2 both yield insignificant results, the Lombard and Hugo (2002) data do not allow for an evaluation of the hypothesis that South Africans place comparable values on walk, wait, and in-vehicle times.
Model 3 obtains a significant coefficient for total travel time by combining additional information with the Lombard and Hugo (2002) data. The logit estima-tion procedure constrains the time coefficient to 2.77 times the fare/wage coefficient, the ratio found by Van Zyl and Hugo (2002) in a stated preference study in Cape Town. The ratio means that respondents valued travel time at 2.77 times their wage rates. The corre-sponding ratio in Model 2 is 2.59, so the constraint imposes a moderate adjustment.
Model 1 Model 2 Model 3Variable Coefficient t-value Coefficient t-value Coefficient t-valueFare / wage (Rands per min.) – 0.0072 3.14 – 0.0064 2.88 – 0.0064 3.14In-vehicle time (min.) 0.0332 1.24Walk time (min.) – 0.0700 2.19Wait time (min.) – 0.0222 0.76Total time (min.) – 0.0166 1.10 – 0.0176* 3.14Constant: train 0.2528 0.46 0.7044 1.45 0.7265 2.08Constant: bus 1.0383 1.97 1.9582 4.43 1.9803 6.13
* Constrained to 2.77 times the fare/wage coefficient
Table 5 Logit model coefficients
15
16
5simulation results
This chapter compares current emissions from Klipfontein Corridor transportation vehicles to emissions under scenarios that incorporate
BRT. The Central Case intervention represents the likely characteristics of the BRT system. Parameters in the sensitivity analyses depart from those in the Central Case in to test the importance of Central Case assumptions about the design of the BRT system and the system’s effects on other modes of transportation.
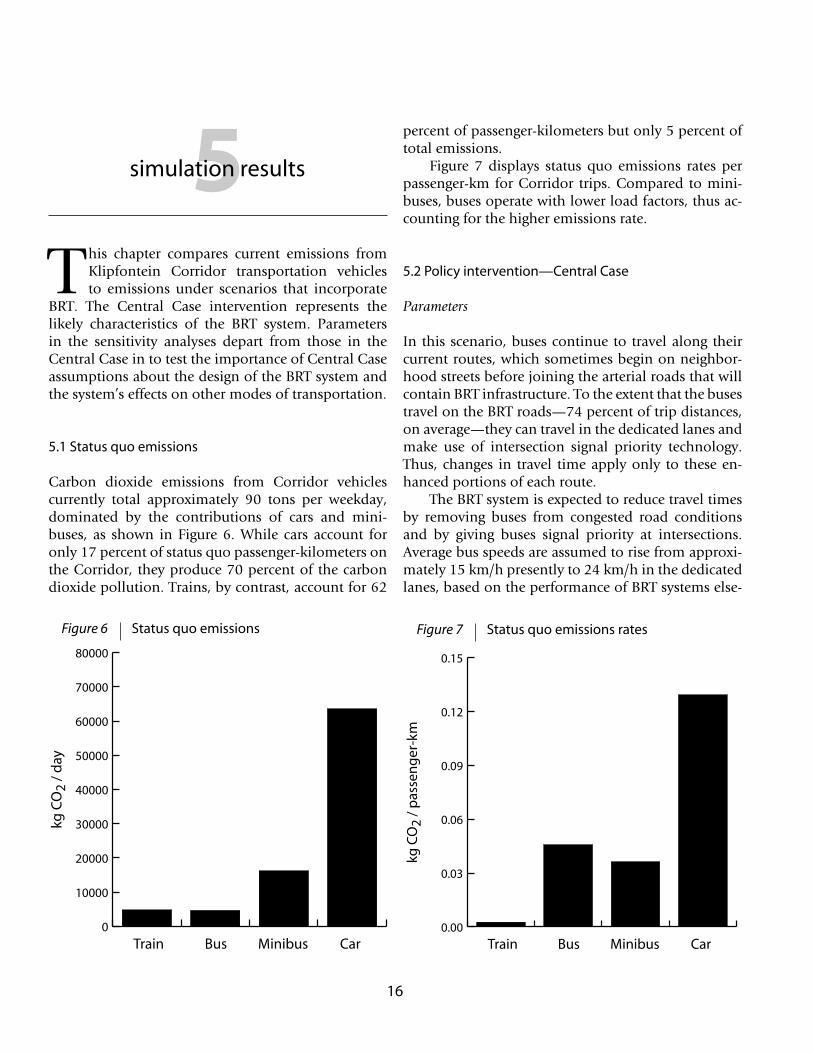
5.1 Status quo emissions
Carbon dioxide emissions from Corridor vehicles currently total approximately 90 tons per weekday, dominated by the contributions of cars and mini-buses, as shown in Figure 6. While cars account for only 17 percent of status quo passenger-kilometers on the Corridor, they produce 70 percent of the carbon dioxide pollution. Trains, by contrast, account for 62
percent of passenger-kilometers but only 5 percent of total emissions.
Figure 7 displays status quo emissions rates per passenger-km for Corridor trips. Compared to mini-buses, buses operate with lower load factors, thus ac-counting for the higher emissions rate.
5.2 Policy intervention—Central Case
Parameters
In this scenario, buses continue to travel along their current routes, which sometimes begin on neighbor-hood streets before joining the arterial roads that will contain BRT infrastructure. To the extent that the buses travel on the BRT roads—74 percent of trip distances, on average—they can travel in the dedicated lanes and make use of intersection signal priority technology. Thus, changes in travel time apply only to these en-hanced portions of each route.
The BRT system is expected to reduce travel times by removing buses from congested road conditions and by giving buses signal priority at intersections. Average bus speeds are assumed to rise from approxi-mately 15 km/h presently to 24 km/h in the dedicated lanes, based on the performance of BRT systems else-
�
�����
�����
�����
�����
�����
�����
�����
�����
������������������
���
��
��
��
Figure 6 Status quo emissions Figure 7 Status quo emissions rates
����
����
����
����
����
����
������������������
���
��
��
����
��
����
�
16
where in the world (Levinson et al. 2003:11) as well as expert advice (Willumsen 2004). Extrapolation of the speed increase to 74 percent of the distance between Nyanga/Guguletu and downtown yields a time sav-ings of 18 minutes.
The allocation of lanes for exclusive use by buses probably will result in increasing congestion else-where in the Corridor. Willumsen (2004) predicts that this feedback mechanism may increase minibus and car travel times by 7 minutes for the entire BRT Corridor. Five of the 7 minutes of delay are assumed to occur between Nyanga/Guguletu and downtown. Table 6 summarizes the expected travel time changes for the Central Case.
Note that passengers switching to buses experi-ence increases in travel times. For these individuals, switching constitutes an improvement in terms of other factors, such as price.
Results
The changes in travel times under the Central Case result in a small change in modal shares, as indicated in Table 7. Buses gain ridership under the central BRT scenario because of the decrease in travel time. Cars and minibuses lose ridership. Since minibuses and
cars characteristics worsen relative to trains, trains at-tract some of the former minibus and car riders.
Emissions of carbon dioxide and all local pollut-ants decrease 5 to 7 percent relative to the status quo in the Central Case.
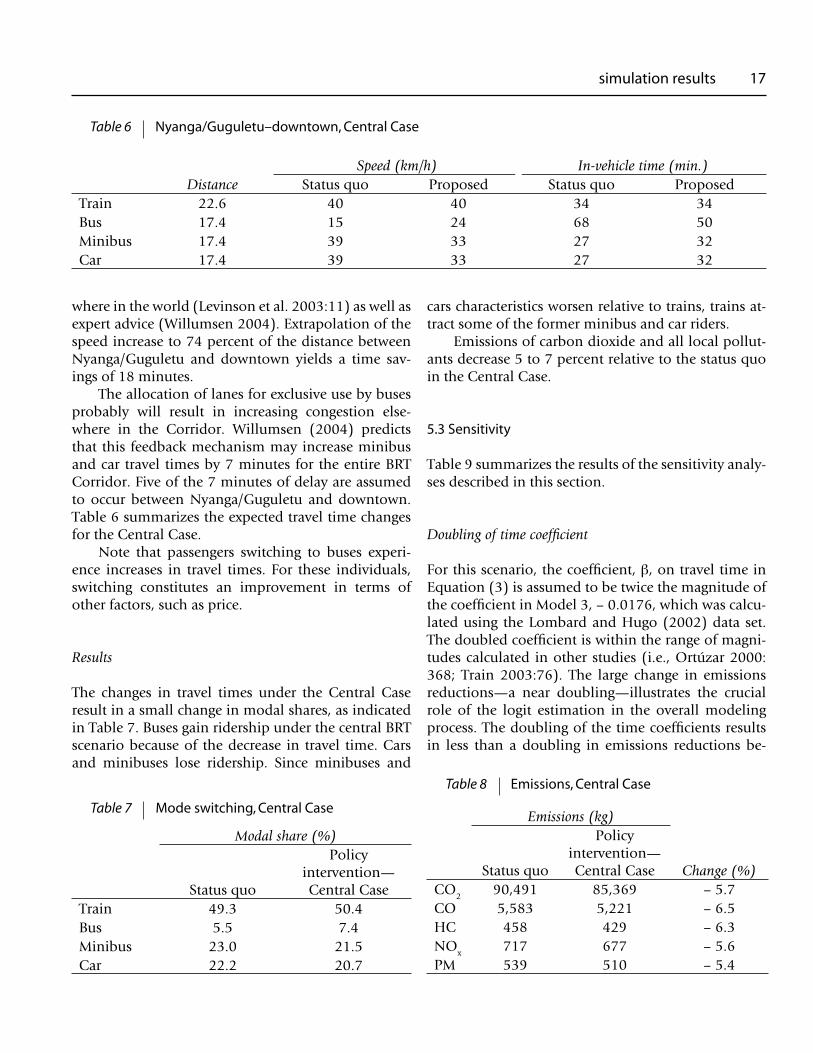
5.3 Sensitivity
Table 9 summarizes the results of the sensitivity analy-ses described in this section.
Doubling of time coefficient
For this scenario, the coefficient, β, on travel time in Equation (3) is assumed to be twice the magnitude of the coefficient in Model 3, – 0.0176, which was calcu-lated using the Lombard and Hugo (2002) data set. The doubled coefficient is within the range of magni-tudes calculated in other studies (i.e., Ortúzar 2000:368; Train 2003:76). The large change in emissions reductions—a near doubling—illustrates the crucial role of the logit estimation in the overall modeling process. The doubling of the time coefficients results in less than a doubling in emissions reductions be-
Table 6 Nyanga/Guguletu–downtown, Central Case
Speed (km/h) In-vehicle time (min.)Distance Status quo Proposed Status quo Proposed
Train 22.6 40 40 34 34Bus 17.4 15 24 68 50Minibus 17.4 39 33 27 32Car 17.4 39 33 27 32
Table 7 Mode switching, Central Case
Modal share (%)
Status quo
Policy intervention—Central Case
Train 49.3 50.4Bus 5.5 7.4Minibus 23.0 21.5Car 22.2 20.7
Table 8 Emissions, Central Case
Emissions (kg)
Status quo
Policy intervention—Central Case Change (%)
CO2 90,491 85,369 – 5.7CO 5,583 5,221 – 6.5HC 458 429 – 6.3NOx 717 677 – 5.6PM 539 510 – 5.4
simulation results 17
cause of changing load factors on the buses. Initially, riders switching to buses occupy empty seats in buses already in operation. As those buses fill, further switching necessitates the provision of additional buses, with their associated emissions.
Congestion feedback
Emissions levels are also highly responsive to changes in travel times for cars and minibuses. Comparing the scenario without congestion delays for cars and mini-buses to the Central Case indicates that the congestion effect leads to a larger percentage-point reduction in emissions than does the improvement in bus service alone: emissions fall 1.4 percent without congestion, compared to 5.7 percent with congestion. That is, some passengers switched to buses as a result of the 18-minute reduction in bus travel time, but a greater number of passengers switched to buses as a result of the 5-minute increase in minibus and car travel times.
The decomposition of modal switching behavior in the congestion sensitivity test demonstrates that changes in the characteristics of the three modes are associated with different degrees of responsiveness. These differences reflect the behavior of the underly-ing modal choice model, which predicts a higher level of responsiveness if probabilities are high. (See Figure 4.) Since bus modal share is low initially, improve-ments in bus service result in minimal changes in bus modal share. The increase in minibus travel time, on the other hand, results in a more dramatic change in minibus ridership. The overall emissions reductions reflect the “push” effect of a drop in the quality of
minibus service more than the “pull” effect of the bus improvements.
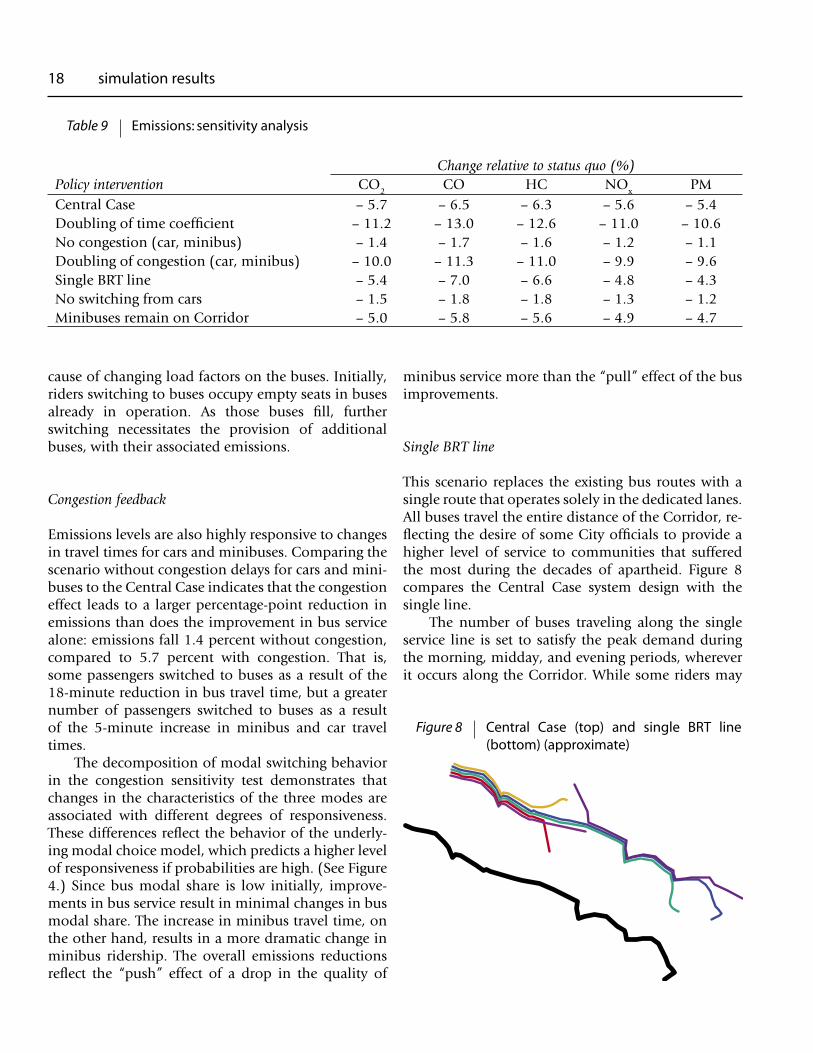
Single BRT line
This scenario replaces the existing bus routes with a single route that operates solely in the dedicated lanes. All buses travel the entire distance of the Corridor, re-flecting the desire of some City officials to provide a higher level of service to communities that suffered the most during the decades of apartheid. Figure 8 compares the Central Case system design with the single line.
The number of buses traveling along the single service line is set to satisfy the peak demand during the morning, midday, and evening periods, wherever it occurs along the Corridor. While some riders may
Table 9 Emissions: sensitivity analysis
Change relative to status quo (%)Policy intervention CO2 CO HC NOx PMCentral Case – 5.7 – 6.5 – 6.3 – 5.6 – 5.4Doubling of time coefficient – 11.2 – 13.0 – 12.6 – 11.0 – 10.6No congestion (car, minibus) – 1.4 – 1.7 – 1.6 – 1.2 – 1.1Doubling of congestion (car, minibus) – 10.0 – 11.3 – 11.0 – 9.9 – 9.6Single BRT line – 5.4 – 7.0 – 6.6 – 4.8 – 4.3No switching from cars – 1.5 – 1.8 – 1.8 – 1.3 – 1.2Minibuses remain on Corridor – 5.0 – 5.8 – 5.6 – 4.9 – 4.7
18 simulation results
Figure 8 Central Case (top) and single BRT line (bottom) (approximate)
experience an increase in walking times, this change should be offset by a decrease in wait times, since riders will have more vehicles from which to choose. Applying the changes that affected 74 percent of the Corridor under the Central Case to the entire Corridor decreases travel times by 7 additional minutes, for a total bus travel time savings of 25 minutes.
If bus lines were restructured into the single line without any improvements in travel times, daily emis-sions would fall 836 kg because a smaller number of buses would be needed. Given expected changes in travel times and consequent increases in bus rider-ship, the restructured line results in slightly higher CO2 emissions than in the Central Case. The improved travel time allows the single BRT line system to attract 34 percent more riders to buses than does the Central Case, contributing to emissions reductions. However, the buses used to accommodate the additional riders must travel the entire length of the Corridor under this scenario, whereas in the Central Case they only serve the specific routes where extra capacity is needed. The extra distance traveled partly offsets the emissions re-ductions achieved through mode switching.
No switching from cars
To gauge the importance of the uncertainty regarding the propensity of automobile users to switch to the public transportation modes, this scenario assumes that no travelers switch to or from cars. The logit equa-tion is used to model switching only among the three public transportation modes.
Since private automobiles produce most of the Corridor’s carbon dioxide emissions, emissions reduc-tions from mode switching are considerably smaller when the volume of private vehicle traffic is assumed to remain constant.
Minibuses linger
This scenario relaxes the assumption that minibuses leave the Corridor in proportion to the change in passenger demand. Instead, only half of the vehicles expected to stop operating under the Central Case ac-tually do so. The City of Cape Town hopes to engage the minibus industry by giving minibus operators the opportunity to participate in the new transit author-
ity that will operate the BRT line. However, Bogotá, despite following a similar plan upon introducing its BRT system, fell short of its goal to reduce the number of transit vehicles along Corridors affected by the new system (CAF and Transmilenio (2004:34).
Since switching from cars accounts for a large por-tion of the emissions reductions, as explained in the “no switching from cars” section, the increase in mini-bus emissions under this scenario has only a slight impact on the overall size of emissions reductions.
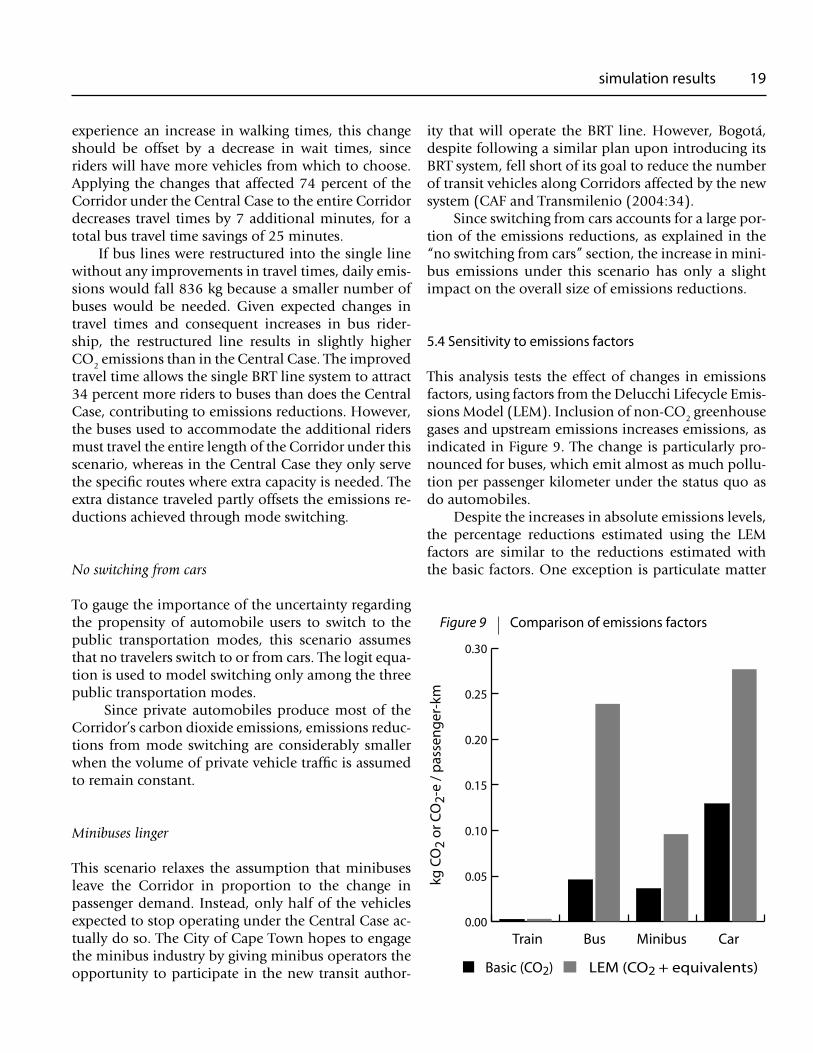
5.4 Sensitivity to emissions factors
This analysis tests the effect of changes in emissions factors, using factors from the Delucchi Lifecycle Emis-sions Model (LEM). Inclusion of non-CO2 greenhouse gases and upstream emissions increases emissions, as indicated in Figure 9. The change is particularly pro-nounced for buses, which emit almost as much pollu-tion per passenger kilometer under the status quo as do automobiles.
Despite the increases in absolute emissions levels, the percentage reductions estimated using the LEM factors are similar to the reductions estimated with the basic factors. One exception is particulate matter
Figure 9 Comparison of emissions factors
����
����
����
����
����
����
����
������������������
�������������������������
����� ����� ��� ���� � ������������
simulation results 19
pollution, as the LEM predicts high PM emissions from buses. While the percentages are similar, the absolute decline in greenhouse gases predicted by the LEM factors is over twice as large as the estimate using the Basic factors.
5.5 Sensitivity to vehicle technology
The final sensitivity analysis compares emissions un-der current bus technology in use in Cape Town with emissions in the event that the City buys new buses to operate on the Corridor. Table 11 indicates local pol-lutant emissions reductions that would be achieved with buses that meet the Euro 2 standard. The table also shows the change in CO2 emissions if the city uses hybrid diesel technology, which can reduce greenhouse gas emissions from 15 to 30 percent per vehicle (Feigon et al. 2003:41).
Since buses contribute a relatively small propor-tion of overall CO2 emissions from the Corridor, the significant improvement in bus efficiency reduce over-all emissions by a small margin. In the case of par-ticulate emissions, on the other hand, the buses are significant contributors under the status quo, so the Euro 2 technology allows for large overall reductions.
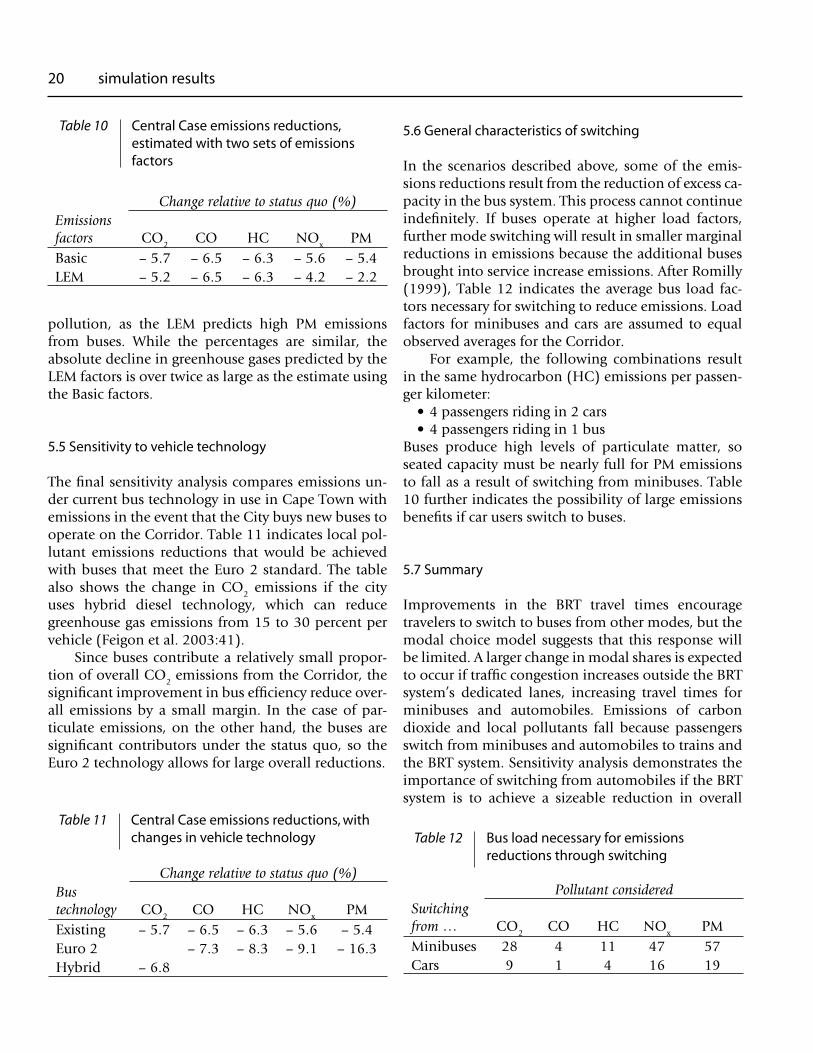
5.6 General characteristics of switching
In the scenarios described above, some of the emis-sions reductions result from the reduction of excess ca-pacity in the bus system. This process cannot continue indefinitely. If buses operate at higher load factors, further mode switching will result in smaller marginal reductions in emissions because the additional buses brought into service increase emissions. After Romilly (1999), Table 12 indicates the average bus load fac-tors necessary for switching to reduce emissions. Load factors for minibuses and cars are assumed to equal observed averages for the Corridor.
For example, the following combinations result in the same hydrocarbon (HC) emissions per passen-ger kilometer: • 4 passengers riding in 2 cars • 4 passengers riding in 1 busBuses produce high levels of particulate matter, so seated capacity must be nearly full for PM emissions to fall as a result of switching from minibuses. Table 10 further indicates the possibility of large emissions benefits if car users switch to buses.
5.7 Summary
Improvements in the BRT travel times encourage travelers to switch to buses from other modes, but the modal choice model suggests that this response will be limited. A larger change in modal shares is expected to occur if traffic congestion increases outside the BRT system’s dedicated lanes, increasing travel times for minibuses and automobiles. Emissions of carbon dioxide and local pollutants fall because passengers switch from minibuses and automobiles to trains and the BRT system. Sensitivity analysis demonstrates the importance of switching from automobiles if the BRT system is to achieve a sizeable reduction in overall
Table 10 Central Case emissions reductions, estimated with two sets of emissions factors
Change relative to status quo (%)Emissions factors CO2 CO HC NOx PMBasic – 5.7 – 6.5 – 6.3 – 5.6 – 5.4LEM – 5.2 – 6.5 – 6.3 – 4.2 – 2.2
Table 11 Central Case emissions reductions, with changes in vehicle technology
Change relative to status quo (%)Bus technology CO2 CO HC NOx PMExisting – 5.7 – 6.5 – 6.3 – 5.6 – 5.4Euro 2 – 7.3 – 8.3 – 9.1 – 16.3Hybrid – 6.8
Table 12 Bus load necessary for emissions reductions through switching
Pollutant consideredSwitching from … CO2 CO HC NOx PMMinibuses 28 4 11 47 57Cars 9 1 4 16 19
20 simulation results
carbon dioxide emissions from the Corridor. The assumption in the Central Case that car users are as likely to switch to other modes as are public transpor-tation users is somewhat optimistic. However, in light of international experience, the City of Cape Town probably can expect a sizable portion of the Central Case’s predicted switching from cars to occur.
simulation results 21
22 23
6economic evaluation
The bus rapid transit system is the core of a broader effort to revitalize communities along the Klipfontein Corridor. Besides building the
BRT infrastructure, the City plans to enhance public spaces and improve pedestrian and bicycle access throughout the Corridor. Altogether, these projects are estimated to cost approximately USD 70 million (Gophe 2004). In addition, the BRT system will in-volve yearly operating costs.
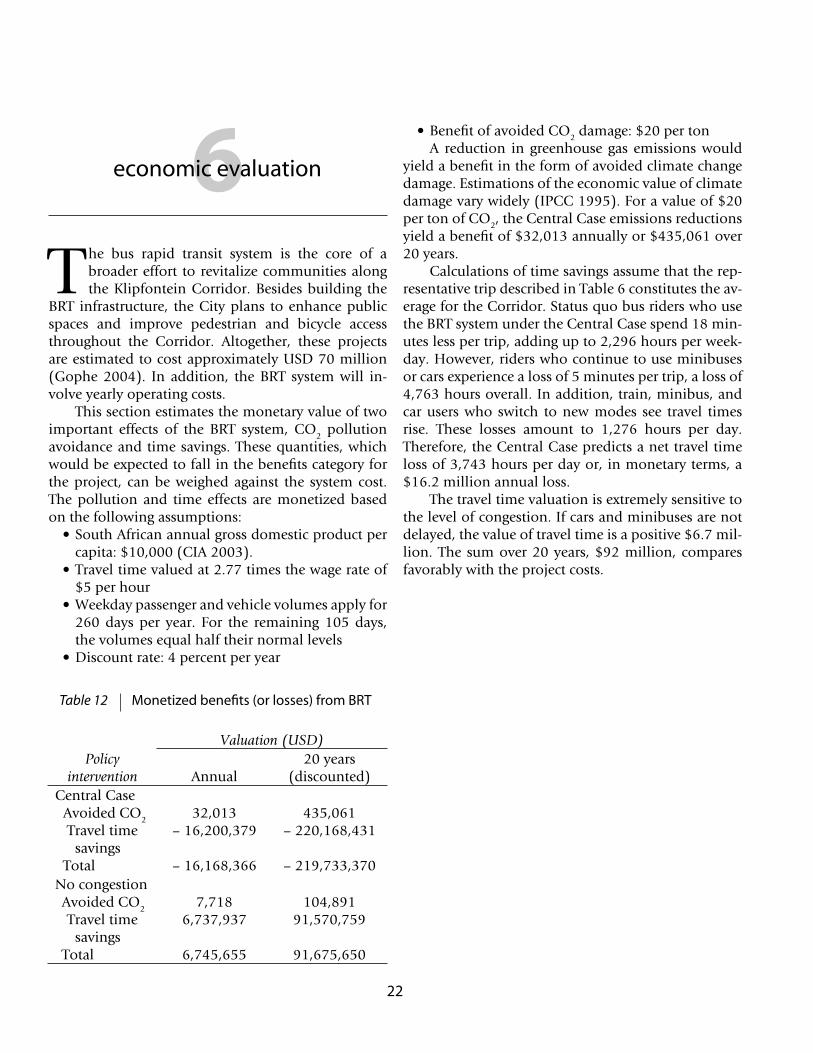
This section estimates the monetary value of two important effects of the BRT system, CO2 pollution avoidance and time savings. These quantities, which would be expected to fall in the benefits category for the project, can be weighed against the system cost. The pollution and time effects are monetized based on the following assumptions: • South African annual gross domestic product per
capita: $10,000 (CIA 2003). • Travel time valued at 2.77 times the wage rate of
$5 per hour • Weekday passenger and vehicle volumes apply for
260 days per year. For the remaining 105 days, the volumes equal half their normal levels
• Discount rate: 4 percent per year
• Benefit of avoided CO2 damage: $20 per tonA reduction in greenhouse gas emissions would
yield a benefit in the form of avoided climate change damage. Estimations of the economic value of climate damage vary widely (IPCC 1995). For a value of $20 per ton of CO2, the Central Case emissions reductions yield a benefit of $32,013 annually or $435,061 over 20 years.
Calculations of time savings assume that the rep-resentative trip described in Table 6 constitutes the av-erage for the Corridor. Status quo bus riders who use the BRT system under the Central Case spend 18 min-utes less per trip, adding up to 2,296 hours per week-day. However, riders who continue to use minibuses or cars experience a loss of 5 minutes per trip, a loss of 4,763 hours overall. In addition, train, minibus, and car users who switch to new modes see travel times rise. These losses amount to 1,276 hours per day. Therefore, the Central Case predicts a net travel time loss of 3,743 hours per day or, in monetary terms, a $16.2 million annual loss.
The travel time valuation is extremely sensitive to the level of congestion. If cars and minibuses are not delayed, the value of travel time is a positive $6.7 mil-lion. The sum over 20 years, $92 million, compares favorably with the project costs.
Valuation (USD)Policy
intervention Annual20 years
(discounted)Central Case
Avoided CO2
Travel time savings
Total
32,013– 16,200,379
– 16,168,366
435,061– 220,168,431
– 219,733,370No congestionAvoided CO2
Travel time savings
Total
7,7186,737,937
6,745,655
104,89191,570,759
91,675,650
Table 12 Monetized benefits (or losses) from BRT
22 23
7conclusions
The foregoing analysis indicates that train travel results in the lowest rate of greenhouse gas emissions. Buses, if sufficiently full, produce
the next lowest amount of greenhouse gas pollution. Therefore, a strategy that encourages a shift toward trains or buses from cars and minibuses should re-duce emissions. Indeed, Cape Town’s proposed bus rapid transit (BRT) system appears beneficial from an environmental perspective: the present study predicts reductions in greenhouse gases and local pollutants. For the Central Case assumptions, passengers switch from minibuses and cars to trains and the BRT system, and emissions fall 5 to 7 percent. Furthermore, emis-sions are expected to fall under a variety of different assumptions about the BRT system and its impact on other road users. However, the bulk of the reductions from mode switching is induced by the negative ef-fect of congestion on cars and minibus users. If the congestion effect fails to materialize, emissions are predicted to decline only between 1 and 2 percent relative to the status quo.
The congestion effect is also crucial in determin-ing the size of the economic benefits from the project. Greater delays for cars and minibuses offset the time benefits for bus riders, leading to net loss of travel time. Without delays, the monetized time savings constitute a benefit of similar magnitude to the proj-ect cost. Within the present study’s modeling process, environmental and economic benefits are sometimes at odds. Congestion leads to a greater drop in pollu-tion by encouraging a stronger modal shift toward buses and trains, but the detrimental impact on travel times swamps the comparatively small monetary ben-efit of avoided pollution.
The impact of the BRT system on travel times rais-es important equity concerns. Status quo bus riders benefit from improved travel times, but at the expense of car and minibus travel times. Car and minibus users tend to be more affluent than bus riders, so the policy intervention has the effect of establishing a more eq-
uitable distribution among the transportation services available to different segments of the population.
The BRT system will have many effects outside the scope of the present study. Topics for further research include the following. • As part of the Klipfontein Corridor project, the
City of Cape Town is improving infrastructure for bicyclists and pedestrians. The availability of bicy-cle routes between the BRT line and surrounding neighborhoods could expand the “catchment” area for the system, leading to increased ridership and reduced emissions if users switch from more polluting modes.
• The City hopes that the public investment in BRT will spur in-fill residential and commercial devel-opment along the corridor. Densification might contribute to a decline in transportation emis-sions by allowing new residents to locate within walking distance of existing urban amenities and in proximity to convenient public transportation service.
• The national Department of Transport is in the midst of a minibus recapitalization process, which will provide incentives for minibus op-erators to exchange their vans for larger 18- and 35-seat vehicles that run on diesel rather than gasoline. The emissions performance of the new vehicles is uncertain, and could either expand or reduce the benefits of mode switching to buses.
• The long-term transportation strategy in Cape Town and elsewhere in South Africa aims to in-tegrate public transportation services, with mini-buses serving as a feeder system for mainline bus and train routes. This restructuring could reduce emissions by encouraging a modal shift toward buses for long-distance routes.
24
8references
American Public Transportation Association, “Heavy Rail National Totals, Fiscal Year 2002,” < http://www.apta.com/research/stats/rail/hrsum.cfm> (2003).
Behrens, Roger and Peter Wilkinson, “Housing and Urban Passenger Transport Policy and Planning in South African Cities: A Problematic Relation-ship?” in Confronting Fragmentation: Housing and Urban Development in a Democratising Society, Phil-ip Harrison et al., ed., (Cape Town: University of Cape Town Press, 2003).
Behrens, Roger, “Looking Beyond Commuter travel in Cape Town: Methodological Lessons from the Application of an Activity-Based Travel Survey,” International Conference on Transport Survey Quality and Innovation: How to Recognise It and How to Achieve It, (5-11 August 2001).
Cameron, J. and R. Kingma, “Public Transport in Cape Town: Market Segmentation and Policy Tests to Give Effect to Modal Shifts,” 21st Annual South African Transport Conference, (15-19 July 2002).
Central Intelligence Agency (CIA), “The World Fact-book,” <http://www.cia.gov/cia/publications/factbook/geos/sf.html#Econ> (2003).
City of Cape Town (CCT), “Summary of CPTR 2000/2001: Public Transport in Cape Town,” (June 2002).
City of Cape Town (CCT), “Diesel Vehicle Testing,” < http://www.capetown.gov.za/clusters/health.asp?IDPathString=1123-1395-1410&clusid=245&catparent=1410>, accessed 6 May 2004, (2004a).
City of Cape Town (CCT), “State of Environment Re-port for the City of Cape Town: Year 5 (2002),” <http://www.capetown.gov.za/soe/>, accessed 11 May 2004, (2004b).
Corporación Andina de Fomento (CAF) and Trans-milenio, S.A., “Clean Development Mechanism: Project Design Document,” (2004).
DeWaal, Louis, Hawkins, Hawkins, and Osborn, per-sonal interview, (7 September 2003).
Delucchi, Mark, “Lifecycle Emissions Model,” documented at < http://its.ucdavis.edu/faculty/delucchi.htm> 2003.
Delucchi, Mark, personal communications, (2004).Dutkiewicz R K. “An estimate of emissions from ve-
hicles in South Africa,” Energy Research Institute, Report No. INT 183, (June 1993).
Environment Canada, “Annex 7: Emission Factors,” Canada’s Greenhouse Gas Inventory: 1990-2001, <http://www.ec.gc.ca/pdb/ghg/1990_01_report/Annex7_e.cfm>, accessed 7 May 2004 (2003).
Eskom, Annual Report 2003, < http://www.eskom.co.z a / a b o u t / A n n u a l % 2 0 R e p o r t % 2 0 2 0 0 3 /Enterprise/>, accessed 2 May 2004 (2003).
Feigon, Sharon, et al., “Travel Matters: Mitigating Climate Change with Sustainable Surface Trans-portation,” (Washington, D.C.: Transportation Research Board, 2003).
Fjellstrom, Karl, “TransJakarta Busway: an experience for Asia,” < http://www.sutp.org/docs/sutp-asia/TransJakarta.pdf> (23 April 2004).
Fulton, Lew et al., Bus Systems for the Future: Achieving Sustainable Transport Worldwide, (Paris: Interna-tional Energy Agency, 2002).
Fulton, Lew and Lloyd Wright, “Greenhouse Gas Emission Guide for Bus Rapid Transit: Outline of Proposed Methodology and Work Plan,” Interna-tional Energy Agency and Institute for Transporta-tion and Development Policy (30 July 2003).
Global Environment Facility, “GEF Project Tracking System,” <http://www.gefonline.org/home.cfm> (2004).
Gophe, Myolisi, “Corridor to bring dignity to Gugs,” Cape Argus, < http://capeargus.co.za/index.php?fSectionId=49&fArticleId=383750> (25 March 2004).
Holtzhausen, Louis, City of Cape Town, personal in-terview, (21 August 2003).
Hook, Walter and Lloyd Wright, “Reducing Green-house Gas Emissions by Shifting Passenger Trips to Less Polluting Modes: A background paper for the brainstorming session on non-technology options for engineering modal shifts in city trans-port systems,” Institute for Transportation and Development Policy, (March 2002).
Intergovernmental Panel on Climate Change (IPCC), “Climate Change 2001: Synthesis Report: Sum-
24
mary for Policymakers,” <http://www.ipcc.ch/pub/un/syreng/spm.pdf>, (2001).
Intergovernmental Panel on Climate Change (IPCC), “Summary for Policymakers: The Economic and Social Dimensions of Climate Change,” <http://www.ipcc.ch/pub/sarsum3.htm#six> (1995).
Khosa, Meshack, “Public Transport in the Chang-ing South Africa, 1994-2000,” in Geography and economy in south Africa and its Neighbours, Anthony Lemon and Christian M. Rogerson, ed. (Burling-ton, VT: Ashgate, 2002).
Kingma, Ron, Cobus Hugo, and Romano Del Mistro, “Results of the Application of a Cost Model to Public Transport Services in Cape Town,” 21st Annual South African Transport Conference, (15-19 July 2002).
Krause, Bob, Golden Arrow Bus Services, personal communications (2003-2004).
Levinson, Herbert, et al., “Bus Rapid Transit: Volume 1: Case Studies in Bus Rapid Transit,” (Washing-ton, D.C.: Transportation Research Board, 2003).
Lombard, M. and J. Hugo, “Public Transport in Cape Town: Customer Opinions, Attitudes and Re-vealed Preferences,” 21st Annual South African Transport Conference, (15-19 July 2002).
Manojlovic, Stevan, “Prioritisation of Public Trans-port in Cape Town—Strategy to Save Energy,” (Cape Town: November 2003).
Mazaza, Maddie, City of Cape Town, personal inter-view (19 August 2003).
Minter, Sue, Integrating Transport and Land Use: Les-sons from the North and South, (Cape Town: UCT Urban Problems Research Unit, February 1997).
Mkhabela, Sikelela, Eskom, personal communication (17 September 2003).
Naude, Clifford, et al., “Global Climate Change, De-veloping Countries, and Transport Sector Options in South Africa,” Institute of Transportation Stud-ies, University of California, Davis, 00-12, (No-vember 2000).
Newman, Peter and Jeffrey Kenworthy, Sustainabil-ity and Cities: Overcoming Automobile Dependence, (Washington, D.C.: Island Press, 1999).
Ortúzar, Juan and Luis Willumsen, Modelling Trans-port, (New York: John Wiley & Sons, LTD, 2001).
Prozzi, Jolanda, et al., “Transportation in Developing Countries: Greenhouse Gas Scenarios for South Africa,” Pew Center on Global Climate Change
(February 2002).Romilly, Peter, “Substitution of bus for car travel in
urban Britain: an economic evaluation of bus and car exhaust emission and other costs,” Transporta-tion Research Part D, 4 (1999) 109-125.
Schutte, I. and W. Pienaar, “Characteristics and oper-ating cost of South African vehicles,” South Africa Department of Transport, (August 1996).
Sperling, Daniel and Deborah Salon, “Transportation in Developing Countries: An Overview of Green-house Gas Reduction Strategies,” Pew Center on Global Climate Change (May 2002).
Train, Kenneth, Discrete Choice Models with Simulation, (New York: Cambridge, 2003).
—, et al., “Mixed Logit Estimation Routine for Cross-Sectional Data,” documented at < http://elsa.berkeley.edu/Software/abstracts/train0196.html>, (1999).
Tomlinson, Richard, Urbanization in Post-Apartheid South Africa, (London: Unwin Hyman, 1990).
Van Zyl, N. and J. Hugo, “Public Transport in Cape Town: Evaluating Modal Attributes with Stated Preference Models,” 21st Annual South African Transport Conference, (15-19 July 2002).
Van Zyl, N., Wilmot C., and van der Reis A. To es-tablish the commuting patterns in South African Metropoles with the objective of encouraging the use of public transport. Produced for the Depart-ment of Minerals and Energy. March 1993.
White, Paul, “South Africa Rides Again,” Sustainable Transport, (Fall 1999).
Wicking-Baird, M., M. DeVilliers, and R. Dutkiewicz, “Cape Town Brown Haze Study,” University of Cape Town Energy Research Group, (September 1997).
Wijetilleke, Lakdasa and Suhashini Karunaratne, “Air Quality Management: Considerations for Devel-oping Countries,” World Bank Technical Paper No. 278, (April 1995).
Williams, R. and R. Kingma, “Cape Town’s Strategic Public Transport Network,” 21st Annual South African Transport Conference, (15-19 July 2002).
Willumsen, Luis, Steer Davies Gleave, personal com-munications, (2003-2004).
references 25