reducing infant mortality in maryland s. lee woods, m.d., ph.d. medical director, center for...
TRANSCRIPT

Reducing Infant Mortality in Maryland
S. Lee Woods, M.D., Ph.D.
Medical Director, Center for Maternal and Child Health
Maryland Department of Health & Mental Hygiene
April 21, 2010

2
Reducing Infant Mortality
Partners include ….
Office of Minority Health and Health Disparities
Medicaid
Behavioral Health Mental Hygiene Administration Alcohol and Drug Abuse Administration
WIC
Local Health Departments
Department of Human Resources
Governor’s Office for Children

3
Infant Mortality in Maryland & U.S.
Infant Mortality Rate, Maryland and U.S., 1982-2008
6
7
8
9
10
11
12
13
Year
Rate
per
1,0
00 li
ve b
irths
Maryland 11.7 11.7 11.7 11.9 11.7 11.4 11.2 10.4 9.6 9.1 9.8 9.8 8.8 8.7 8.4 8.6 8.6 8.3 7.4 8.0 7.6 8.1 8.5 7.3 7.9 8.0 8.0
United States 11.5 11.2 10.8 10.6 10.4 10.1 10.0 9.8 9.2 8.9 8.5 8.3 8.0 7.6 7.3 7.2 7.2 7.1 6.9 6.8 7.0 6.8 6.8 6.9 6.7 6.6 6.5
1982 1983 1984 1985 1986 1987 1988 1989 1990 1991 1992 1993 1994 1995 1996 1997 1998 1999 2000 2001 2002 2003 2004 2005 20062007
*2008
*
Data Source: MD DHMH:Vital Statistics Administration, CDC:NCHS* U.S. data for 2007 are preliminary, data for 2008 are provisional
4
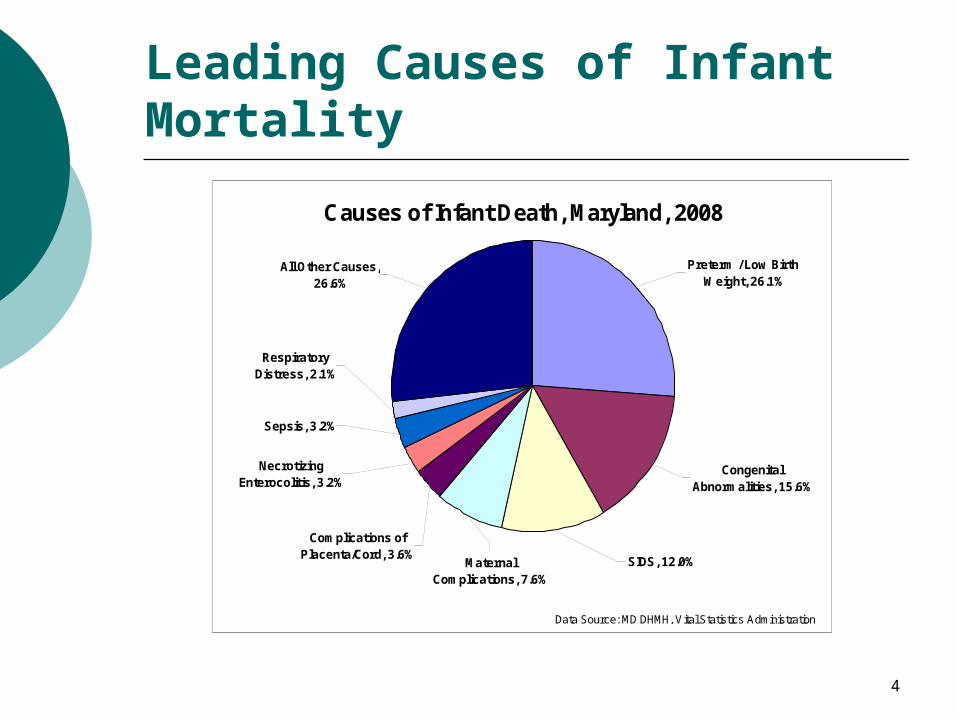
Leading Causes of Infant Mortality
Causes of Infant Death, Maryland, 2008
Preterm / Low Birth Weight, 26.1%
Congenital Abnormalities, 15.6%
SIDS, 12.0%Maternal Complications, 7.6%
All Other Causes, 26.6%
Respiratory Distress, 2.1%
Sepsis, 3.2%
Necrotizing Enterocolitis, 3.2%
Complications of Placenta/Cord, 3.6%
Data Source: MD DHMH, Vital Statistics Administrationn=617 deaths

5
Maryland Rankings
Infant Mortality 39th
Preterm Birth 34th
Low Birth Weight 43rd
SIDS / SUID 35th

6
Racial Disparity in Infant Mortality
Black:White ratio of 3:1
Infant Mortality Rates, Maryland, 1999-2008
0
5
10
15
20
Year
Rat
e p
er 1
,000
live
bir
ths
All Races 8.3 7.4 8.0 7.6 8.1 8.5 7.3 7.9 8.0 8.0
White 5.1 4.7 5.5 5.4 5.4 5.6 4.7 5.7 4.6 5.2
Black 14.7 13.0 13.6 12.7 14.7 14.9 12.7 12.7 14.0 13.4
Hispanic 5.1 6.2 5.3 6.0 5.3 4.6 3.0 3.8 3.2
1999 2000 2001 2002 2003 2004 2005 2006 2007 2008
Data Source: MD DHMH, Vital Statistics Administration

7
Racial Disparity in Leading Causes of Infant Mortality
In Maryland, a Black infant ….
is 1 ½ times as likely to be born prematurely,
almost twice as likely to be born at low birth weight,
almost 2 ½ times as likely to die of SIDS/SUID as a white infant.

8
BaltimoreCity
AnneArundel
Howard
Baltimore
Caroline
QueenAnne’s
PrinceGeorge’s
St. Mary's
Charles
AlleganyCarroll Harford
Cecil
Kent
Wicomico
Dorchester
Worcester
WashingtonGarrett
Frederick
Montgomery
Talbot
Calvert
Somerset
Geographic Disparity in MarylandAverage Infant Mortality Rate, By Jurisdiction, 2003-07
Legend
Rate per 1000 live births
3.6 – 5.0
5.1 – 10.0
10.1 -14.8
Data Source: MD Vital Statistics Administration

9
(1) Health and Health Care Risks – Lack of Early Prenatal Care – Associated with Increased Infant Mortality
Percent of Births to Women Receiving 1st Trimester Prenatal Care, Maryland and U.S., 1999-2008
78
81
84
87
90
% o
f Bir
ths
MD 87.0 86.4 83.7 84.1 83.7 82.3 81.3 80.4 79.5 80.2
U.S.* 83.2 83.2 83.4 83.7 84.1 84.2 83.9 83.2
1999 2000 2001 2002 2003 2004 2005 2006 2007 2008
Data Sources: MD: DHMH, Vital Statistics Administration, US: National Center for Health Statistics* US data for 2003-2006 represents 32 states using 1989 birth certif icate, US data for 2007, 2008 not available

10
(1) Health and Health Care Risks – Lack of Early Prenatal Care – Associated with Increased Infant Mortality
Percentage of Births to Women Receiving Late or No Prenatal Care, Maryland, 1999-2008
2
4
Per
cen
t
Maryland 3.1 3.1 3.7 3.6 3.8 3.9 4.3 4.3 4.7 4.2
U.S. 3.8 3.9 3.8 3.6 3.5 3.6 3.5 3.6
1999 2000 2001 2002 2003 2004 2005 2006 2007 2008
Data Sources: MD DHMH, Vital Statistics Administration, NCHS, National Vital Statistics Reports, U.S. data for 2007,2008 not available

11
(2) Socio-demographic Risks – Racial Disparities Go Beyond Socio-Economic Factors
0
20
Pre
term
Bir
th R
ate
(Per
cent)
Maternal Race-Ethnicity
< Grade 8 Grades 8-12 Grades 13-15 > Grade 15
< Grade 8 19.6 11.0 10.7 11.5
Grades 8-12 16.8 9.9 10.4 10.5
Grades 13-15 14.5 8.3 9.3 9.1
> Grade 15 12.8 7.0 8.4 7.5
Black White Hispanic Asian
From NCHS 1998-2000 data, Preterm Birth, IOM, 2007

12
(3) Behavioral Risks – Unintended Pregnancy – Associated with Increased Neonatal Mortality *
* Bustan et al, AJPH, March 1994
Distribution of Mothers by Pregnancy Intention, Maryland, 2008
Didn't w ant to be pregnant then or later
8.9%
Wanted to be pregnant then
40.8%
Wanted to be pregnant sooner
16.7%
Wanted to be pregnant later
33.5%
Intendedpregnancies57.6%
Unintendedpregnancies42.4%
Data Source: Maryland PRAMS, 2008

13
(3) Behavioral Risks – Substance Abuse
Percentage of Reports of Substance Problems among Women (ages 15-44 yrs) Enrolled in ADAA-Funded Treatment, Maryland, 2009
0
10
20
30
40
50
Alcohol
Heroin
Mar
ijuan
a/Hash
ish
Crack
Oth
er C
ocai
ne
Oxy
codo
ne
Oth
er O
piat
es
Benzo
diaz
epines PCP
Non-R
x Met
hado
ne
Oth
er
Oth
er A
mph
etam
ines
Halluc
inoge
ns
Met
hamph
etam
ines
Oth
er S
edat
ives
or H
ypnot
ics
Ove
r the
Cou
nter
Barbi
tura
tes
Inha
lant
s
Stimul
ants
Oth
er T
ranq
uilizers
Substance Abused
Per
cen
t
Data Source: MD DHMH, Alcohol and Drug Abuse Administration

14
(3) Behavioral Risks – Substance Abuse
Non-pregnant women in treatment 48% White 49% Black 1.6% Hispanic
Pregnant women in treatment 45% White 52% Black 1.5% Hispanic

15
(3) Behavioral Risks – Substance Abuse
Number of Alcoholic Drinks Consumed by Mothers During the Last Three Months of Pregnancy, 2001-2005
Nondrinkers92.3%
< 1 drink/wk6.2%
7 - 13 drinks/wk
0.1%
1 - 3 drinks/wk1.2%
4 - 6 drinks/wk0.2%
Data Source: Maryland PRAMS
16
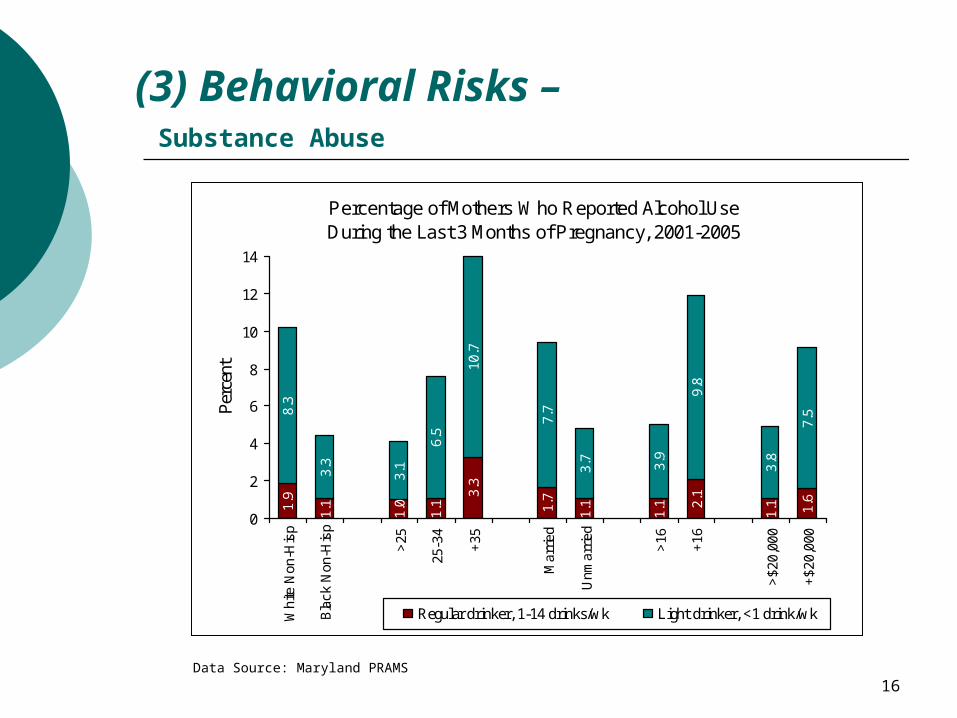
(3) Behavioral Risks – Substance Abuse
Data Source: Maryland PRAMS
Percentage of Mothers Who Reported Alcohol Use During the Last 3 Months of Pregnancy, 2001-2005
1.9
1.1
1.0
1.1 1.7
1.1
1.1
1.1
8.3
3.3
3.1
6.5
10.7
7.7
3.7
3.9
9.8
3.8
7.5
2.1
1.63.
3
0
2
4
6
8
10
12
14
Whi
te N
on-H
isp
Bla
ck N
on-H
isp
<25
25-3
4
+35
Mar
ried
Unm
arrie
d
<16
+16
<$2
0,00
0
+$2
0,00
0
Per
cent
Regular drinker, 1-14 drinks/wk Light drinker, <1 drink/wk
17
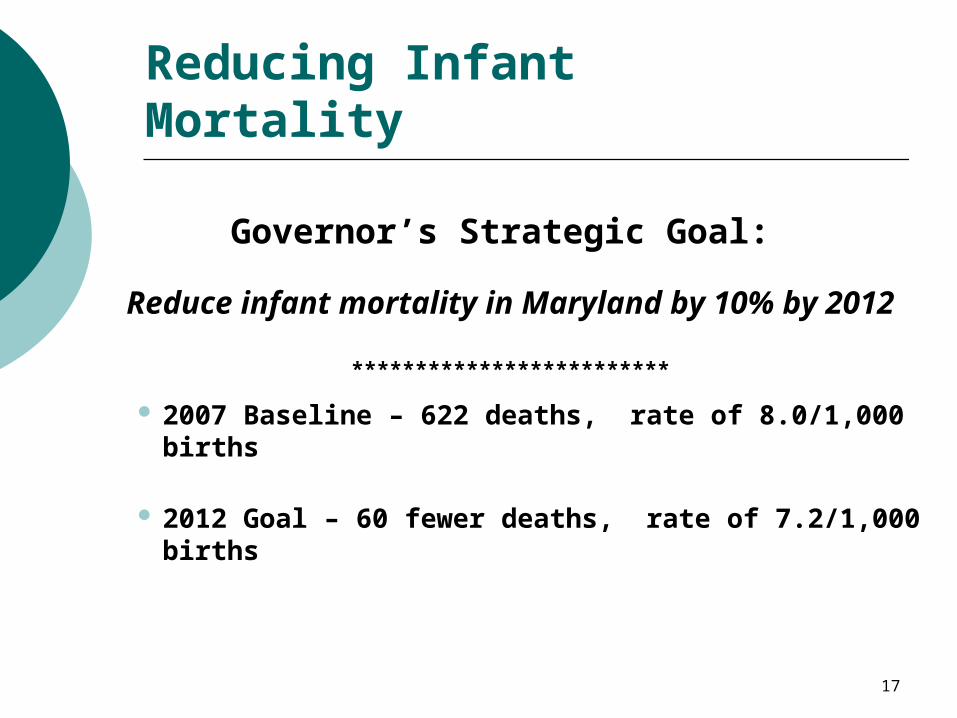
Reducing Infant Mortality
Governor’s Strategic Goal:
Reduce infant mortality in Maryland by 10% by 2012
*************************
2007 Baseline – 622 deaths, rate of 8.0/1,000 births
2012 Goal – 60 fewer deaths, rate of 7.2/1,000 births

18
Reducing Infant Mortality –Targeting High-Risk Jurisdictions – 2007 Baseline
BaltimoreCity
PrinceGeorge’s
Somerset
112 Infant Deaths Rate 11.3/1000
150 Infant Deaths Rate 11.7/1000
6 Infant Deaths Rate 24.0/1000

19
Reducing Infant Mortality – Intervention Points Across the Life Span
PRECONCEPTION (Before
pregnancy)
Healthier women at time of
conception, planned
pregnancies
Earlier entry into prenatal
care
Comprehensive, high quality
perinatal and neonatal care
Healthier Children
and Adults
PRENATAL (During
pregnancy)
PERINATAL/NEONATAL
(After delivery)

20
Reducing Infant Mortality – Strategy 1 – Before Pregnancy
Expand access to women’s comprehensive health and
wellness services
• Transition 3 family planning sites into Comprehensive Women’s Health Programs.
•Transition 3 sexually transmitted disease program sites and 3 behavioral health program sites to implement expanded referral services.
• Include screening/referral for Medicaid eligibility, WIC, substance abuse, mental health, domestic violence, smoking cessation, weight management services.
• Promote culturally-competent outreach and education efforts in the community.
21
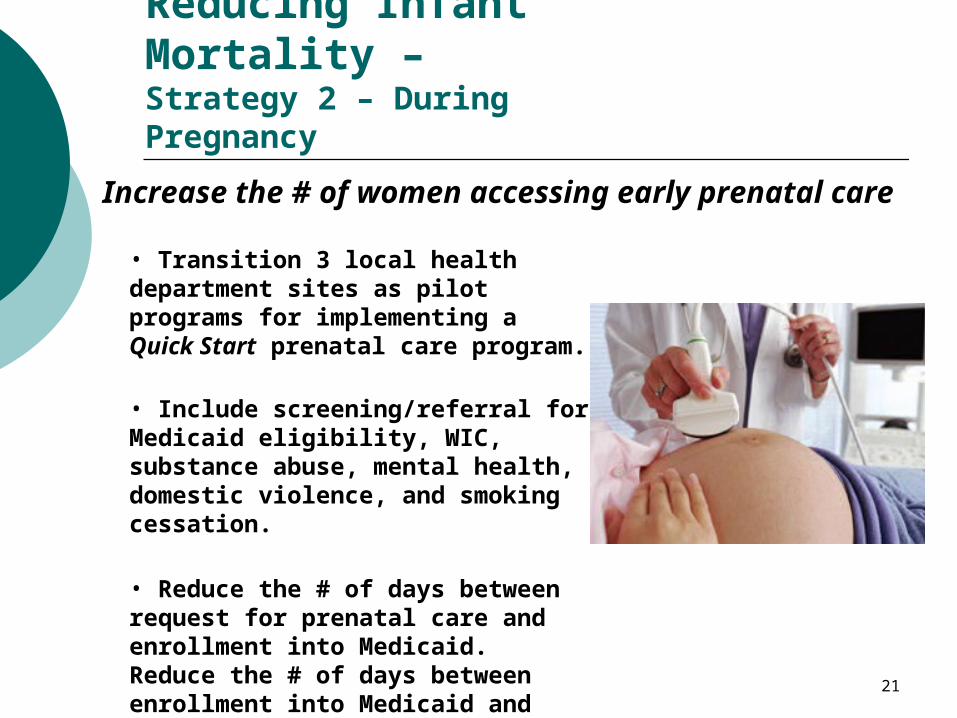
Reducing Infant Mortality – Strategy 2 – During Pregnancy
Increase the # of women accessing early prenatal care
• Transition 3 local health department sites as pilot programs for implementing a Quick Start prenatal care program.
• Include screening/referral for Medicaid eligibility, WIC, substance abuse, mental health, domestic violence, and smoking cessation.
• Reduce the # of days between request for prenatal care and enrollment into Medicaid. Reduce the # of days between enrollment into Medicaid and first prenatal care visit.

22
Reducing Infant Mortality – Strategy 3 – During and Following Delivery
Expand access to more comprehensive, high quality
perinatal and neonatal care
• Ensure that pregnant women identified through these programs receive timely perinatal care and appropriate follow up referrals for substance abuse, mental health, domestic violence, and smoking cessation.
• Develop a standardized hospital postpartum discharge process that ensures risk-appropriate follow-up care for mother and infant.
• Assure linkages to culturally-competent, community-based prevention services.
•Future data - Electronic Birth Certificate

23
Reducing Infant Mortality in Maryland –Summary of the Plan
APPROACH
• Assessing the Data & Targeting Disparities
• Building on Strengths & Partnerships
• Comprehensive Systems Approach
GOALS
• Healthier Women/ Planned Pregnancies
• Earlier Entry into Prenatal Care
• Improve Quality of Perinatal and Post-
Delivery Care
STRATEGIES
• Comprehensive Women’s Health Centers
• Expediting Medicaid eligibility / Quick Start
Prenatal Care
• Standardized hospital discharge protocols