reducing new zealand’s agricultural greenhouse gases ... · reducing new zealand’s agricultural...
TRANSCRIPT
REDUCING NEW ZEALAND’S AGRICULTURAL GREENHOUSE GASES:
MAPPING SOIL ORGANIC CARBON STOCKS
DEVELOPED IN COLLABORATION WITH LANDCARE RESEARCH NEW ZEALAND
2
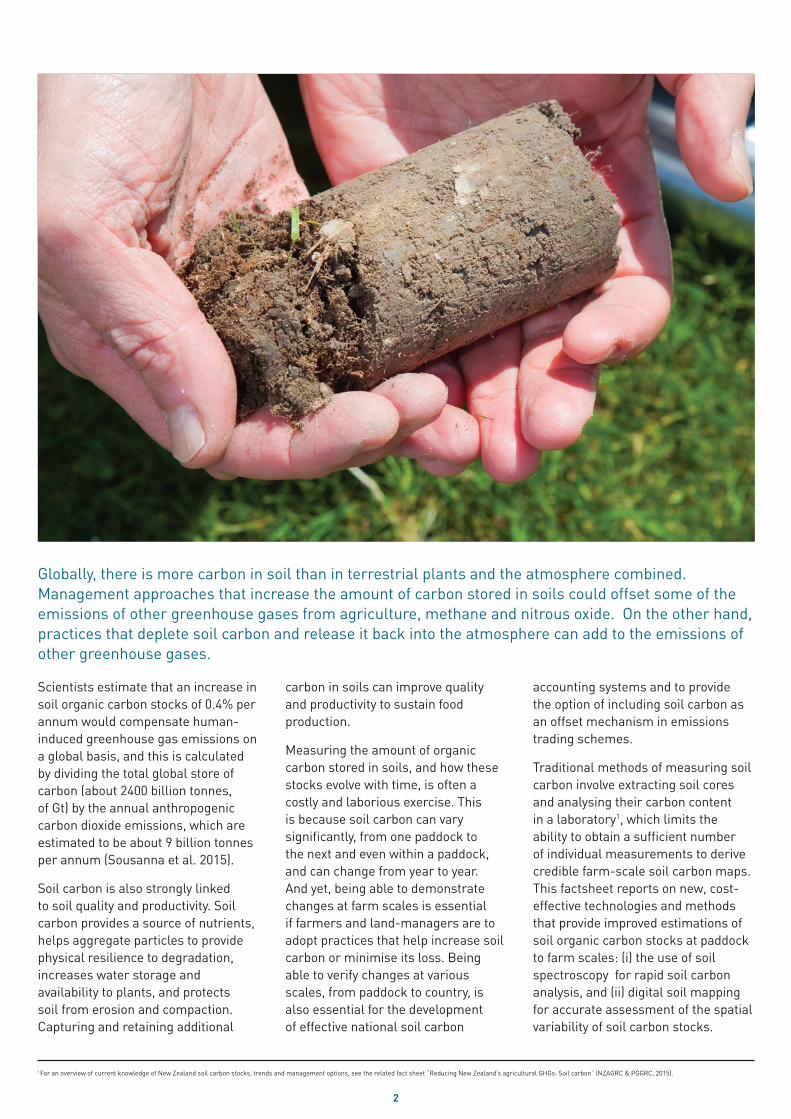
Globally, there is more carbon in soil than in terrestrial plants and the atmosphere combined. Management approaches that increase the amount of carbon stored in soils could offset some of the emissions of other greenhouse gases from agriculture, methane and nitrous oxide. On the other hand, practices that deplete soil carbon and release it back into the atmosphere can add to the emissions of other greenhouse gases.
Scientists estimate that an increase in soil organic carbon stocks of 0.4% per annum would compensate human-induced greenhouse gas emissions on a global basis, and this is calculated by dividing the total global store of carbon (about 2400 billion tonnes, of Gt) by the annual anthropogenic carbon dioxide emissions, which are estimated to be about 9 billion tonnes per annum (Sousanna et al. 2015).
Soil carbon is also strongly linked to soil quality and productivity. Soil carbon provides a source of nutrients, helps aggregate particles to provide physical resilience to degradation, increases water storage and availability to plants, and protects soil from erosion and compaction. Capturing and retaining additional
carbon in soils can improve quality and productivity to sustain food production.
Measuring the amount of organic carbon stored in soils, and how these stocks evolve with time, is often a costly and laborious exercise. This is because soil carbon can vary significantly, from one paddock to the next and even within a paddock, and can change from year to year. And yet, being able to demonstrate changes at farm scales is essential if farmers and land-managers are to adopt practices that help increase soil carbon or minimise its loss. Being able to verify changes at various scales, from paddock to country, is also essential for the development of effective national soil carbon
accounting systems and to provide the option of including soil carbon as an offset mechanism in emissions trading schemes.
Traditional methods of measuring soil carbon involve extracting soil cores and analysing their carbon content in a laboratory1, which limits the ability to obtain a sufficient number of individual measurements to derive credible farm-scale soil carbon maps. This factsheet reports on new, cost-effective technologies and methods that provide improved estimations of soil organic carbon stocks at paddock to farm scales: (i) the use of soil spectroscopy for rapid soil carbon analysis, and (ii) digital soil mapping for accurate assessment of the spatial variability of soil carbon stocks.
1 For an overview of current knowledge of New Zealand soil carbon stocks, trends and management options, see the related fact sheet “Reducing New Zealand’s agricultural GHGs: Soil carbon” (NZAGRC & PGGRC, 2015).
3
THE CHALLENGE OF SPATIAL VARIABILITY
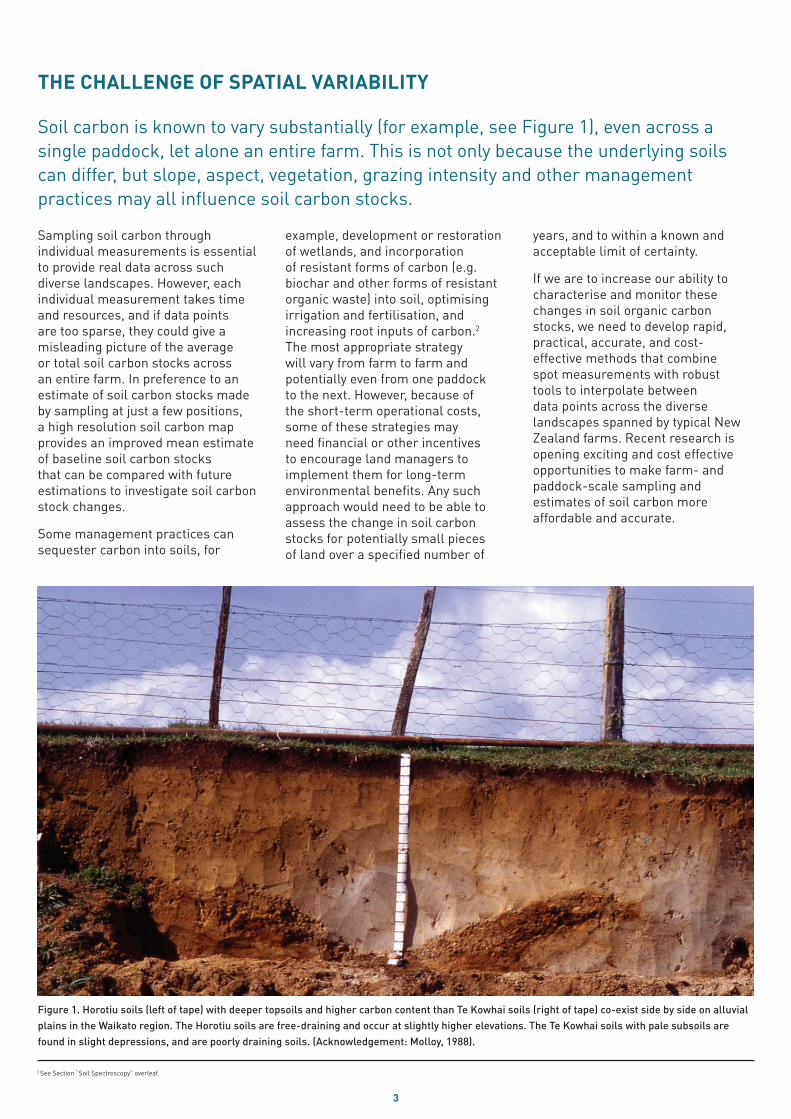
Soil carbon is known to vary substantially (for example, see Figure 1), even across a single paddock, let alone an entire farm. This is not only because the underlying soils can differ, but slope, aspect, vegetation, grazing intensity and other management practices may all influence soil carbon stocks.
Sampling soil carbon through individual measurements is essential to provide real data across such diverse landscapes. However, each individual measurement takes time and resources, and if data points are too sparse, they could give a misleading picture of the average or total soil carbon stocks across an entire farm. In preference to an estimate of soil carbon stocks made by sampling at just a few positions, a high resolution soil carbon map provides an improved mean estimate of baseline soil carbon stocks that can be compared with future estimations to investigate soil carbon stock changes.
Some management practices can sequester carbon into soils, for
example, development or restoration of wetlands, and incorporation of resistant forms of carbon (e.g. biochar and other forms of resistant organic waste) into soil, optimising irrigation and fertilisation, and increasing root inputs of carbon.2
The most appropriate strategy will vary from farm to farm and potentially even from one paddock to the next. However, because of the short-term operational costs, some of these strategies may need financial or other incentives to encourage land managers to implement them for long-term environmental benefits. Any such approach would need to be able to assess the change in soil carbon stocks for potentially small pieces of land over a specified number of
years, and to within a known and acceptable limit of certainty.
If we are to increase our ability to characterise and monitor these changes in soil organic carbon stocks, we need to develop rapid, practical, accurate, and cost-effective methods that combine spot measurements with robust tools to interpolate between data points across the diverse landscapes spanned by typical New Zealand farms. Recent research is opening exciting and cost effective opportunities to make farm- and paddock-scale sampling and estimates of soil carbon more affordable and accurate.
Figure 1. Horotiu soils (left of tape) with deeper topsoils and higher carbon content than Te Kowhai soils (right of tape) co-exist side by side on alluvial plains in the Waikato region. The Horotiu soils are free-draining and occur at slightly higher elevations. The Te Kowhai soils with pale subsoils are found in slight depressions, and are poorly draining soils. (Acknowledgement: Molloy, 1988).
2 See Section “Soil Spectroscopy” overleaf.
4
SOIL SPECTROSCOPY
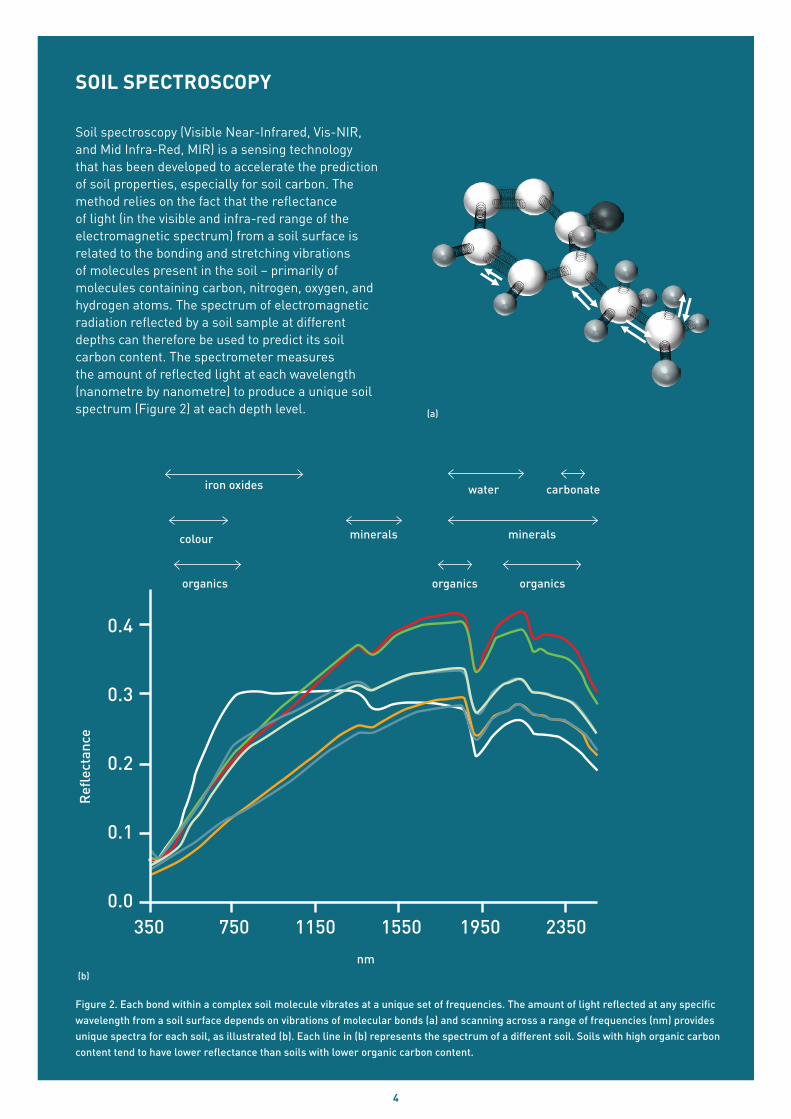
Soil spectroscopy (Visible Near-Infrared, Vis-NIR, and Mid Infra-Red, MIR) is a sensing technology that has been developed to accelerate the prediction of soil properties, especially for soil carbon. The method relies on the fact that the reflectance of light (in the visible and infra-red range of the electromagnetic spectrum) from a soil surface is related to the bonding and stretching vibrations of molecules present in the soil – primarily of molecules containing carbon, nitrogen, oxygen, and hydrogen atoms. The spectrum of electromagnetic radiation reflected by a soil sample at different depths can therefore be used to predict its soil carbon content. The spectrometer measures the amount of reflected light at each wavelength (nanometre by nanometre) to produce a unique soil spectrum (Figure 2) at each depth level.
Figure 2. Each bond within a complex soil molecule vibrates at a unique set of frequencies. The amount of light reflected at any specific wavelength from a soil surface depends on vibrations of molecular bonds (a) and scanning across a range of frequencies (nm) provides unique spectra for each soil, as illustrated (b). Each line in (b) represents the spectrum of a different soil. Soils with high organic carbon content tend to have lower reflectance than soils with lower organic carbon content.
(b)
0.4
0.3
0.2
0.1
0.0
Refl
ecta
nce
iron oxides
minerals
water carbonate
mineralscolour
organics organics organics
nm
350 750 1150 1550 1950 2350
(a)
5
SOIL SPECTROSCOPY
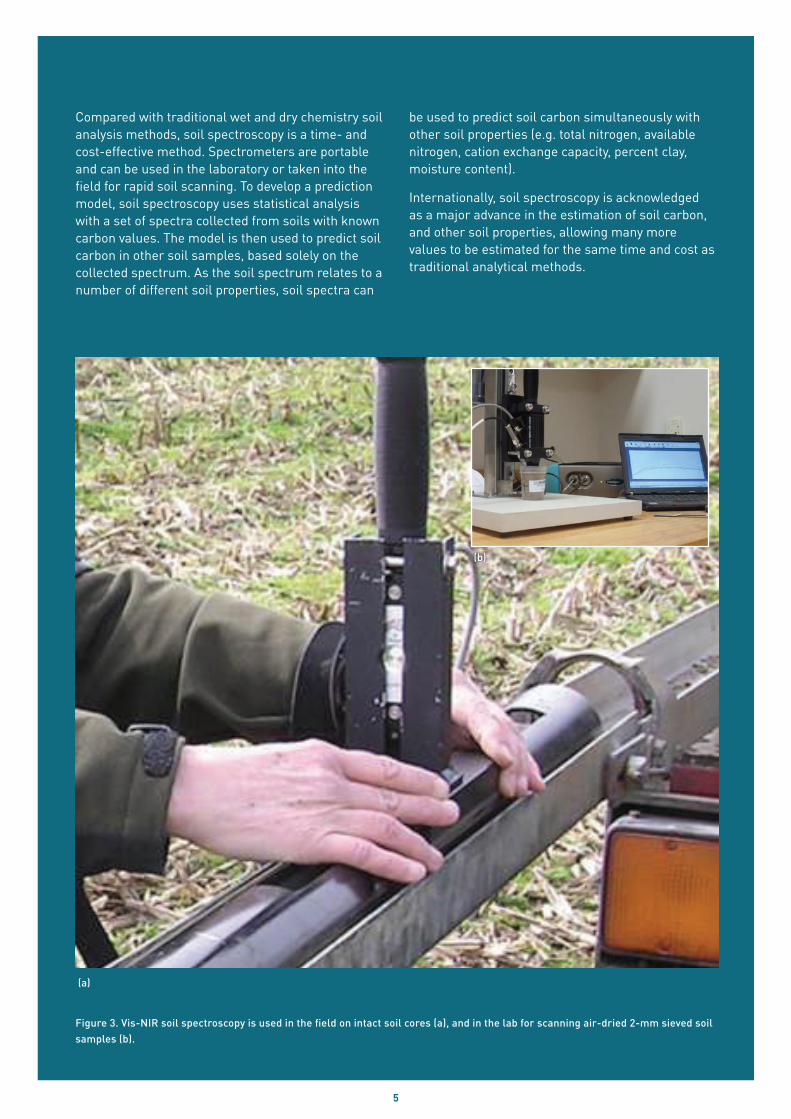
Figure 3. Vis-NIR soil spectroscopy is used in the field on intact soil cores (a), and in the lab for scanning air-dried 2-mm sieved soil samples (b).
Compared with traditional wet and dry chemistry soil analysis methods, soil spectroscopy is a time- and cost-effective method. Spectrometers are portable and can be used in the laboratory or taken into the field for rapid soil scanning. To develop a prediction model, soil spectroscopy uses statistical analysis with a set of spectra collected from soils with known carbon values. The model is then used to predict soil carbon in other soil samples, based solely on the collected spectrum. As the soil spectrum relates to a number of different soil properties, soil spectra can
be used to predict soil carbon simultaneously with other soil properties (e.g. total nitrogen, available nitrogen, cation exchange capacity, percent clay, moisture content).
Internationally, soil spectroscopy is acknowledged as a major advance in the estimation of soil carbon, and other soil properties, allowing many more values to be estimated for the same time and cost as traditional analytical methods.
(a)
(b)
6
DIGITAL SOIL MAPPING
Digital Soil Mapping uses environmental datasets along with advanced modelling methods (e.g. geostatistics, data mining) to develop spatial models of soil properties such as soil carbon.
The amount of organic carbon in a soil at any specific position in the landscape can be calculated based on the type and age of soil and other soil attributes, climate, vegetation, ground relief, human activities and land-use changes, and of course informed by any near-by actual measurements of soil carbon. In the past, equations to calculate soil carbon in this way were largely conceptual, but data are now available to populate such equations and use them to produce a soil carbon map.
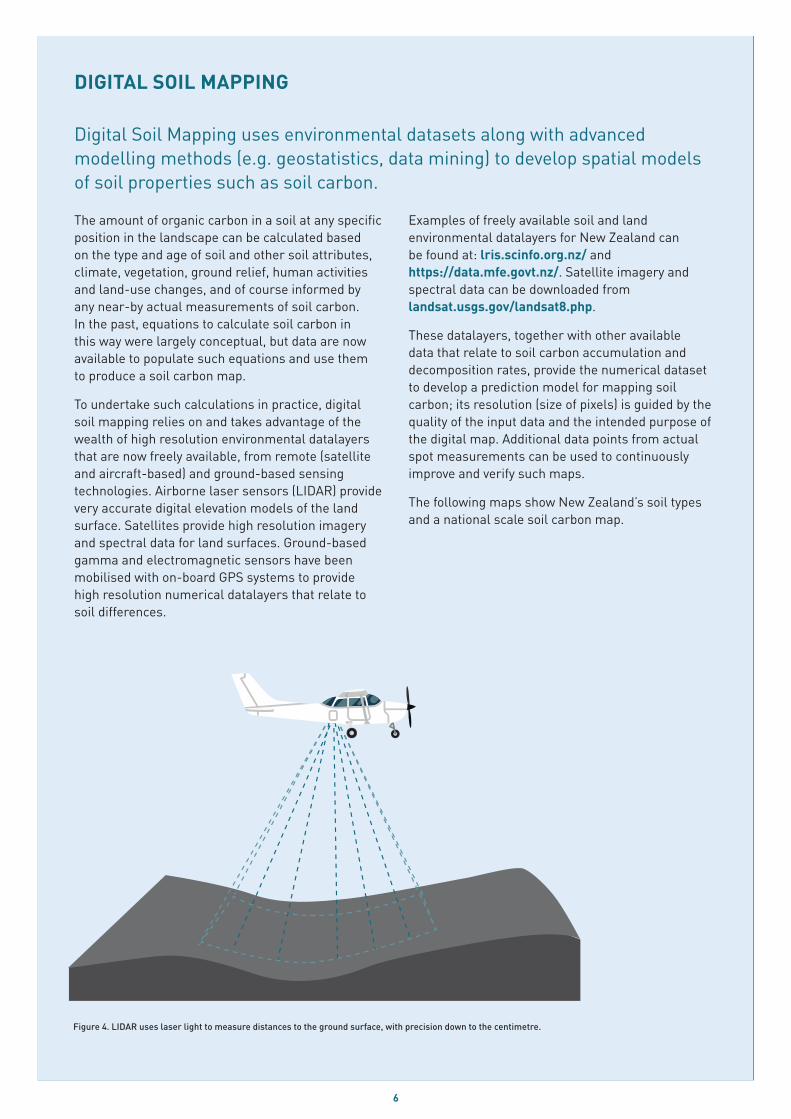
To undertake such calculations in practice, digital soil mapping relies on and takes advantage of the wealth of high resolution environmental datalayers that are now freely available, from remote (satellite and aircraft-based) and ground-based sensing technologies. Airborne laser sensors (LIDAR) provide very accurate digital elevation models of the land surface. Satellites provide high resolution imagery and spectral data for land surfaces. Ground-based gamma and electromagnetic sensors have been mobilised with on-board GPS systems to provide high resolution numerical datalayers that relate to soil differences.
Examples of freely available soil and land environmental datalayers for New Zealand can be found at: lris.scinfo.org.nz/ and https://data.mfe.govt.nz/. Satellite imagery and spectral data can be downloaded from landsat.usgs.gov/landsat8.php.
These datalayers, together with other available data that relate to soil carbon accumulation and decomposition rates, provide the numerical dataset to develop a prediction model for mapping soil carbon; its resolution (size of pixels) is guided by the quality of the input data and the intended purpose of the digital map. Additional data points from actual spot measurements can be used to continuously improve and verify such maps.
The following maps show New Zealand’s soil types and a national scale soil carbon map.
Figure 4. LIDAR uses laser light to measure distances to the ground surface, with precision down to the centimetre.

7
NEW ZEALAND SOIL TYPESSOIL TYPE
Allophanic
Brown
Brown-Stony
Gley
Granular
Melanic
Organic
Oxidic
Pallic
Podzol
Raw
Recent
Ulitic
Supplied by Landcare Research – Manaaki Whenua Source: Les Molloy, Soils in the New Zealand landscape: the living mantle. 2nd ed. Lincoln: New Zealand Society of Soil Science, 1998, p. 230
Supplied by Landcare Research – Manaaki Whenua Note: Soil carbon stocks do not indicate whether carbon is increasing or decreasing in the soil
MAP OF SOIL CARBON STOCKS FOR NEW ZEALAND MAINLAND IN 2012 FOR 0-30cm
8
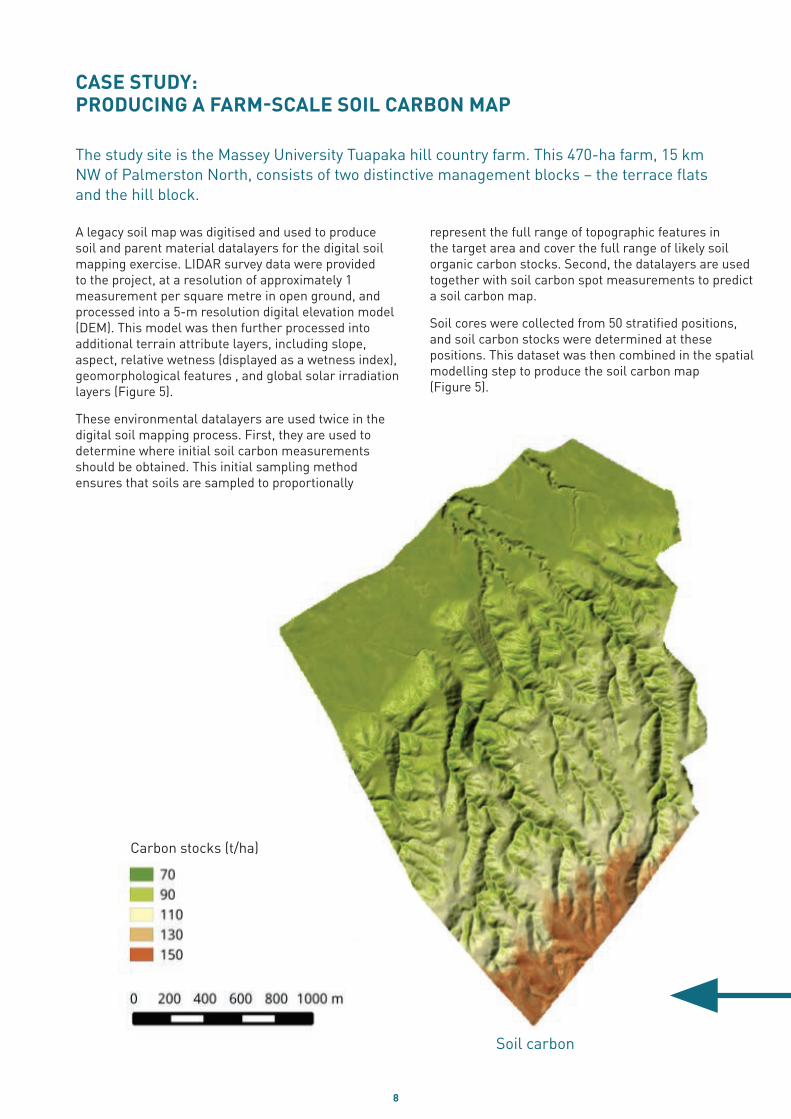
CASE STUDY: PRODUCING A FARM-SCALE SOIL CARBON MAP
The study site is the Massey University Tuapaka hill country farm. This 470-ha farm, 15 km NW of Palmerston North, consists of two distinctive management blocks – the terrace flats and the hill block.
A legacy soil map was digitised and used to produce soil and parent material datalayers for the digital soil mapping exercise. LIDAR survey data were provided to the project, at a resolution of approximately 1 measurement per square metre in open ground, and processed into a 5-m resolution digital elevation model (DEM). This model was then further processed into additional terrain attribute layers, including slope, aspect, relative wetness (displayed as a wetness index), geomorphological features , and global solar irradiation layers (Figure 5).
These environmental datalayers are used twice in the digital soil mapping process. First, they are used to determine where initial soil carbon measurements should be obtained. This initial sampling method ensures that soils are sampled to proportionally
represent the full range of topographic features in the target area and cover the full range of likely soil organic carbon stocks. Second, the datalayers are used together with soil carbon spot measurements to predict a soil carbon map.
Soil cores were collected from 50 stratified positions, and soil carbon stocks were determined at these positions. This dataset was then combined in the spatial modelling step to produce the soil carbon map (Figure 5).
Soil carbon
Carbon stocks (t/ha)
9
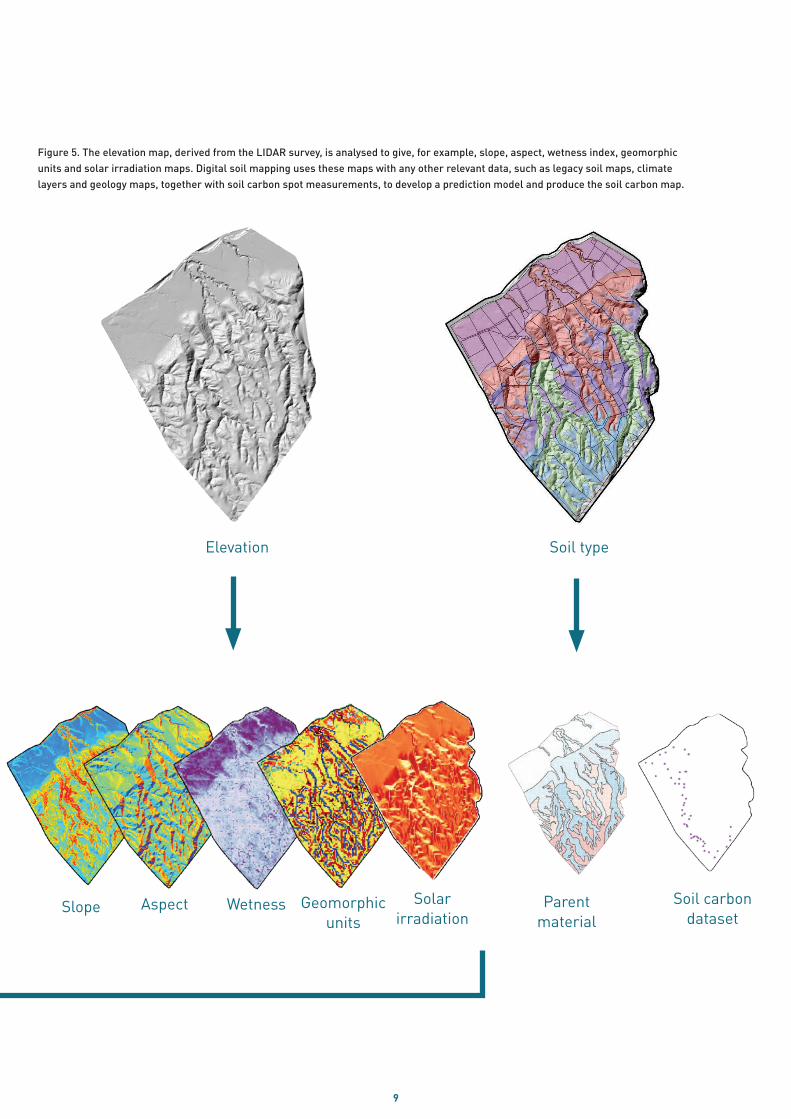
Figure 5. The elevation map, derived from the LIDAR survey, is analysed to give, for example, slope, aspect, wetness index, geomorphic units and solar irradiation maps. Digital soil mapping uses these maps with any other relevant data, such as legacy soil maps, climate layers and geology maps, together with soil carbon spot measurements, to develop a prediction model and produce the soil carbon map.
Elevation Soil type
Wetness AspectSlope Geomorphic units
Parent material
Solar irradiation
Soil carbon dataset
10
• Soil carbon supports healthy and productive farm systems; and greater understanding of the distribution and changes in soil carbon across farms can help farmers adjust and improve management of this essential resource
• Soil carbon sequestration could offset some greenhouse gas emissions that are currently difficult to reduce otherwise
• Estimating soil carbon stock changes must deal with high spatial variability and the cost of individual measurements
• Soil spectroscopy enables the cost-effective prediction of soil carbon content
• Digital soil mapping methods have rapidly advanced over the last decade, enabling soil carbon maps to be produced at high resolution (<10 m) at farm, regional, and national scales
• These new technologies help reduce the uncertainty of soil carbon stock and stock change predictions, enabling soil carbon stock changes to be monitored at farm scales
CONCLUSIONS
11
References
Hedley CB, Roudier, P, Maddi L (2015) Vis-NIR soil spectroscopy for field soil analysis. Communications in Soil and Plant Analysis 46: 1-18.
Minasny B, McBratney AB, et al. 2013. Digital mapping of soil carbon. Advances in Agronomy 118: 1–47.
Molloy L 1988 Soils in the New Zealand Landscape – The Living Mantle. Published by Mallinson Rendel Publishers in association with the New Zealand Society of Soil Science, Wellington, 239p.
Soussana J-F, Saint-Macary H, Chotte J-L 2015. Carbon sequestration in soils: the 4 per mil concept. Agriculture and agricultural soils facing climate change and food security challenges: public policies and practices Paris, Sept. 16, 2015. UN Climate Change Conference, COP21-CMP11, Paris, September 2015.
Valette L (2013) Farm-scale mapping of soil organic carbon on a hill country farm using visible near infrared spectroscopy. M.Sc. Thesis, Montpellier, SupAgro, France and Landcare Research, NZ, 51p.
Glossary
Geomorphological features: landform features, for example, valley, ridge, spur, slope, hollow and footslope, extracted from the digital elevation map.
Nanometre: one billionth of a meter, expressed as 10–9 meter.
LIDAR: light detection and ranging. Airborne and ground based devices that record the time that laser light takes to be reflected from a surface at high resolution (e.g. every square metre) enabling the development of very accurate digital elevation models/maps.
Soil spectroscopy: uses a spectrometer to collected reflected light energy from a soil surface at nanometre resolution. The collected soil spectrum is interpreted to predict soil carbon content, and other soil properties.
12
www.pggrc.co.nzwww.nzagrc.org.nz
Pastoral Greenhouse Gas Research Consortium (PGgRc)
PO Box 121 Wellington 6140 New Zealand Tel: +64 4 471 6031
Landcare Research Manaaki Whenua
PO Box 69040 Lincoln 7640New Zealand Tel: +64 3 321 9999
Date of publication: November 2016
More information
This fact sheet has been produced by NZAGRC and PGgRc, with substantial input from Landcare Research as part of a deliverable for a project funded by the New Zealand Government in support of the objectives of the Livestock Research Group of the Global Research Alliance on agricultural greenhouse gases.
There is more information on our websites, or contact us:
New Zealand Agricultural Greenhouse Gas Research Centre (NZAGRC)
Private Bag 11008 Palmerston North 4442 New Zealand Tel: +64 6 351 8334
www.landcareresearch.co.nz