reducing phone call abandonment rates in ut …uthscsa.edu/cpshp/cseproject/cohort15/group5.pdf ·...
TRANSCRIPT
Clinical Safety and Effectiveness
Cohort 15
Reducing Phone Call Abandonment Rates in UT Medicine ENT Clinic

Project Team • Clinical Operations
- Jaime Alonso, MBA, PMP, LSSBB
- LaKesha Brooks, FACHE
- Andrea Camarillo, BSHA
- Shannon Nunnelly, RN
- Facilitator: Hope Nora, PhD
• Sponsor
- Christian L. Stallworth, M.D., Clinical Assistant Professor, Department of Otolaryngology – Head and Neck Surgery

Project Milestones
• Team Created Aug 2014
• AIM statement created Sep 2014
• Weekly Team Meetings
• Background Data, Brainstorm Sessions Sep-Dec 2014 Workflow and Fishbone Analyses
• Interventions Implemented
– Intervention 1 Sep 2014
– Intervention 2, 3 Oct 2014
– Intervention 4, 5 Nov 2014
• Data Analysis Dec 2014
• CS&E Presentation Jan 23rd, 2015

Aim Statement
The aim of this project is to reduce phone call abandonment rates in UT Medicine ENT Clinic from 7.64% to less than 5% by the end of 1st week of Jan 2015. By doing this we expect to improve patient satisfaction scores in the domains of courtesy, respect and helpfulness by clinic clerks and receptionists. This is in line with the strategic goal of the organization to become the provider of choice in South Texas.
PLAN
Background
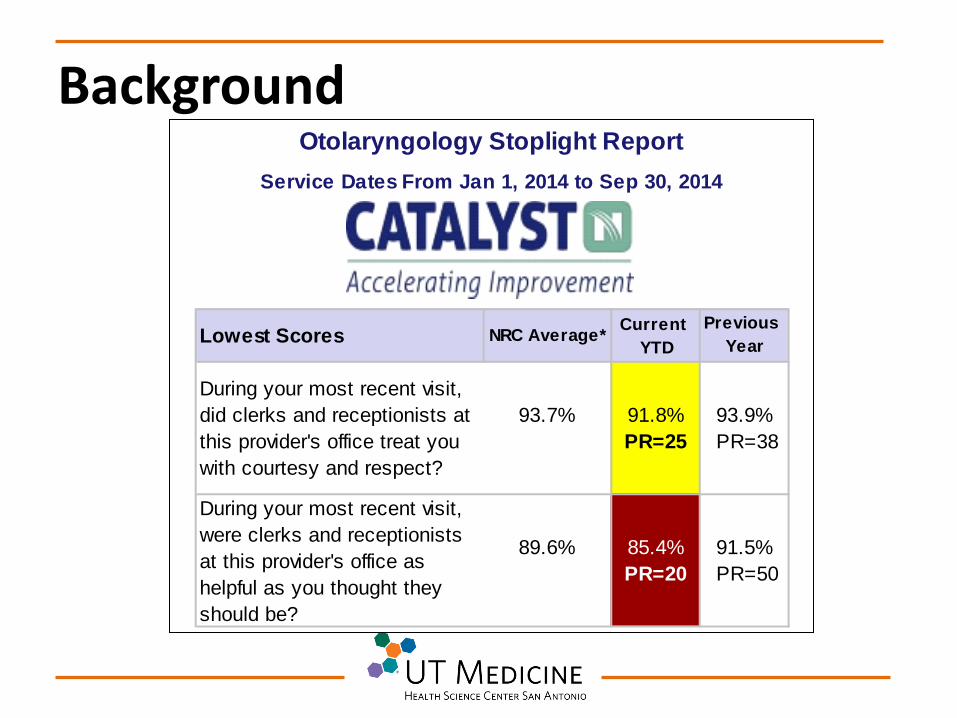
Lowest Scores NRC Average*Current
YTD
During your most recent visit,
did clerks and receptionists at
this provider's office treat you
with courtesy and respect?
93.7% 91.8%
PR=25
During your most recent visit,
were clerks and receptionists
at this provider's office as
helpful as you thought they
should be?
89.6% 85.4%
PR=20
Otolaryngology Stoplight Report
Service Dates From Jan 1, 2014 to Sep 30, 2014
91.5%
PR=50
93.9%
PR=38
Previous
Year

Staff Feedback • Initial meeting with staff
to identify areas of opportunity and pain points
• Main issues brought up: - Front desk staff
handles too many calls, affecting face to face interaction with patients
- Many repeat calls
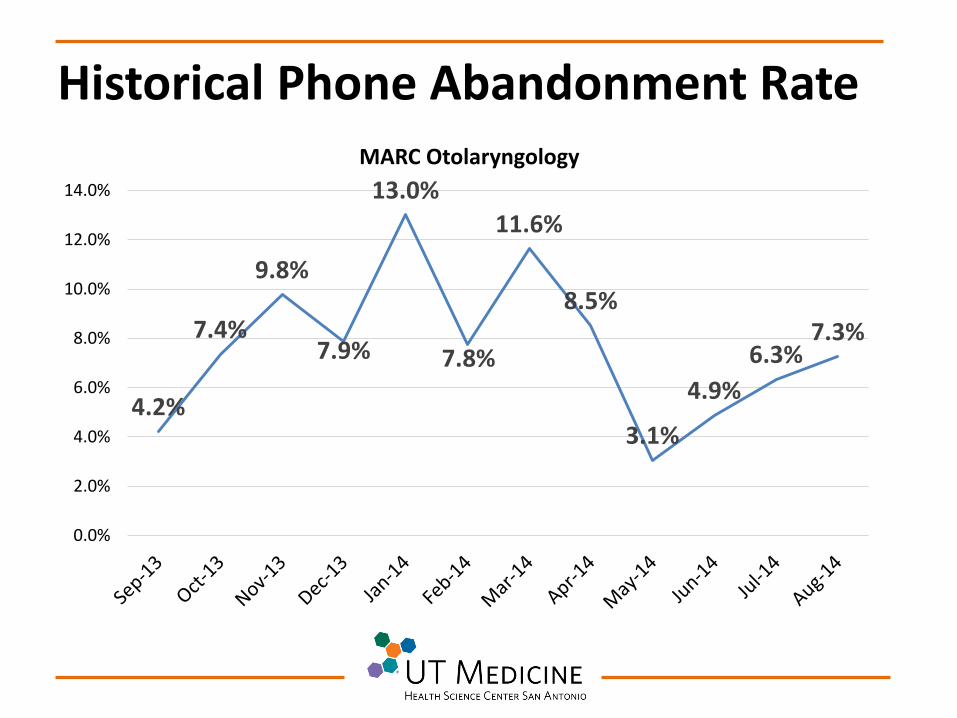
Historical Phone Abandonment Rate
4.2%
7.4%
9.8%
7.9%
13.0%
7.8%
11.6%
8.5%
3.1%
4.9%
6.3% 7.3%
0.0%
2.0%
4.0%
6.0%
8.0%
10.0%
12.0%
14.0%
MARC Otolaryngology

Abandonment Rate Baseline
UCL 16.00%
7.64%
LCL -0.71%
-3.50%
1.50%
6.50%
11.50%
16.50%
21.50%
Sep-13 Oct-13 Nov-13 Dec-13 Jan-14 Feb-14 Mar-14 Apr-14 May-14 Jun-14 Jul-14 Aug-14
Ab
and
on
emen
t Pe
rcen
t/M
on
th
DO

Fishbone Diagram
Responsiveness / Courteousness of Staff in Person or by Phone
Effective Communication Wait Times
Lack of courteous attention by staff
Factors Affecting Patient
Satisfaction
Clear/Easy Processes
Patients unsure about check-out process
Front desk staff multitasking with phone calls
Expectations not being set upfront
Patients not being updated
Appointments taking longer than allotted time
Too many phone calls
No return calls
Check-in lines not clearly identified
Long response times for phone encounters
Patients not sure about their surgery date

This waiting caused an increase of patient phone calls to get an
update on their case
Intervention 1: Change in Process for Handling Patient Messages
Original Process New Process
Patient calls for medical advice
Provider in
clinic?
Wait until provider comes to clinic
Patient questions addressed
Yes
No
Patient calls for medical advice
Provider in
clinic?
MA forwards message to provider
Yes
No
If provider does not respond within 24
hours MA calls patient
MA follows up with provider
Faster response to
patient needs and
reduction of phone calls

• First study took place from 10/1/14 to 10/8/14 • Logged 634 calls
Intervention 2: Conducted Study on Reasons for Call
350
73 48 46
22 18 18 14 13 12 10 5
ENT Call Reasons
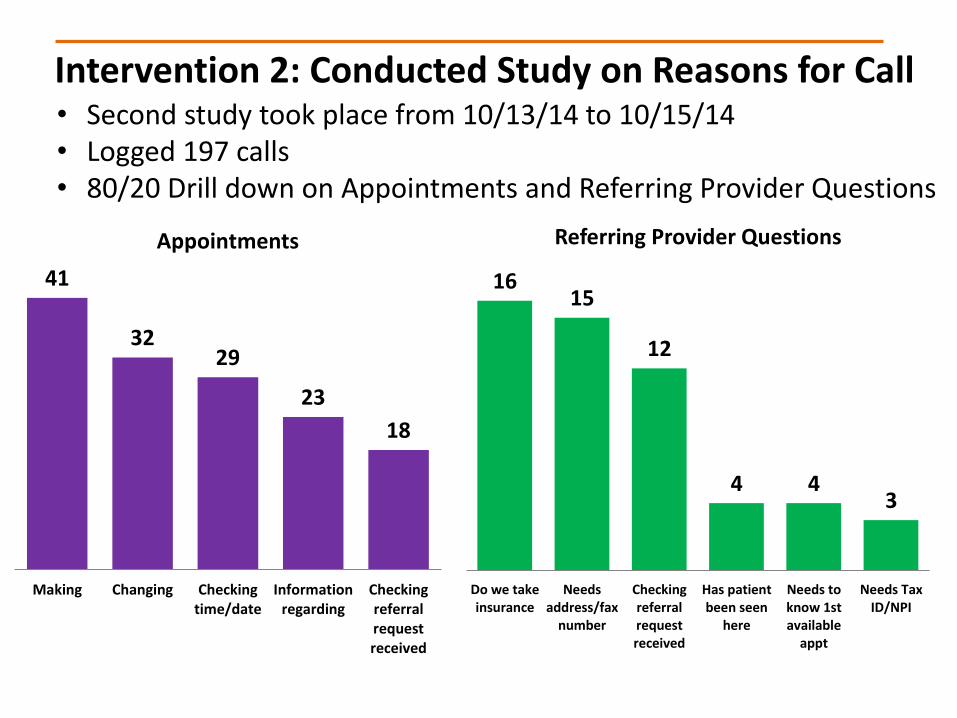
• Second study took place from 10/13/14 to 10/15/14 • Logged 197 calls • 80/20 Drill down on Appointments and Referring Provider Questions
Intervention 2: Conducted Study on Reasons for Call
41
32 29
23
18
Making Changing Checkingtime/date
Informationregarding
Checkingreferralrequestreceived
Appointments
16 15
12
4 4 3
Do we takeinsurance
Needsaddress/fax
number
Checkingreferralrequestreceived
Has patientbeen seen
here
Needs toknow 1stavailable
appt
Needs TaxID/NPI
Referring Provider Questions

Intervention 3: Changed staffing model to assigned MA’s by provider
• Previously: “if it is everybody’s responsibility, it is nobody’s responsibility”
• New model promotes accountability and this
results in faster response to patients

Intervention 4: Phone system workload redistribution
• New configuration in the phone system allows to route more calls to dedicated phone staff members
• Staff in the back office were assigned a higher call
priority level so that the front desk staff is freed up for better quality of patient interactions

Intervention 5: Visual Management
• Staff members logging in daily individual number of calls, engaged in the improvement process
• Weekly updating of abandonment rate creates awareness among the team
• Easy correlation of high call volume vs. abandonment rate

CHECK

18.0%
17.2%
14.7%
10.7%
9.4%
9.3%
8.1%
8.0%
7.5%
7.3%
7.0%
6.2%
5.6%
5.5%
5.2%
4.4%
3.8%
2.2%
1.8%
1.7%
0.0% 2.0% 4.0% 6.0% 8.0% 10.0% 12.0% 14.0% 16.0% 18.0% 20.0%
MARC Urology
MARC Family Medicine
Medical Oncology
MARC Plastic Surgery
Senior Health
MARC Vascular Surgery
CTRC Dermatology
MARC Surgery
MARC Gastroenterology
MARC Otolaryngology
MARC Ob/Gyn
MARC Neurology
ASB Answering Service
MARC Cardiology
MARC Medicine Specialty
MARC Ophthalmology
MARC Orthopaedics/Podiatry
MARC Radiology
Westover Hills
Westgate Pain Clinic - Scheduling
Abandonment Rate by Clinic (Pre Intervention) August 2014
Goal

15.1%
11.3%
9.6%
6.8%
6.7%
5.9%
5.6%
5.5%
5.2%
4.8%
4.5%
4.4%
4.3%
4.2%
3.9%
3.2%
3.2%
2.7%
2.4%
2.1%
0.0% 2.0% 4.0% 6.0% 8.0% 10.0% 12.0% 14.0% 16.0% 18.0% 20.0%
Medical Oncology
PCMH Medical Drive
Senior Health
CTRC Dermatology
MARC Gastroenterology
MARC Urology
MARC Vascular Surgery
MARC Ob/Gyn
MARC Radiology
ASB Answering Service
MARC Plastic Surgery
MARC Ophthalmology
Westgate Pain Clinic -…
MARC Neurology
MARC Family Medicine
MARC Orthopaedics/Podiatry
MARC Surgery
MARC Medicine Specialty
Westover Hills
MARC Otolaryngology
MARC Cardiology
Abandonment Rate by Clinic (Post Intervention) November 2014
Goal

15.1%
15.1%
12.2%
12.2%
9.1%
8.0%
7.4%
6.5%
5.9%
5.3%
5.2%
5.0%
4.9%
4.7%
4.2%
4.0%
4.0%
3.3%
3.0%
2.9%
2.8%
0.0% 2.0% 4.0% 6.0% 8.0% 10.0% 12.0% 14.0% 16.0%
PCMH Medical Drive
Senior Health
Medical Oncology
MARC Gastroenterology
MARC Urology
CTRC Dermatology
MARC Ophthalmology
MARC Neurology
MARC Vascular Surgery
ASB Answering Service
MARC Ob/Gyn
MARC Family Medicine
MARC Radiology
MARC Plastic Surgery
MARC Medicine Specialty
Westover Hills
MARC Cardiology
Westgate Pain Clinic -…
MARC Orthopaedics/Podiatry
MARC Surgery
MARC Otolaryngology
Abandonment Rate by Clinic (Post Intervention) December 2014
Goal
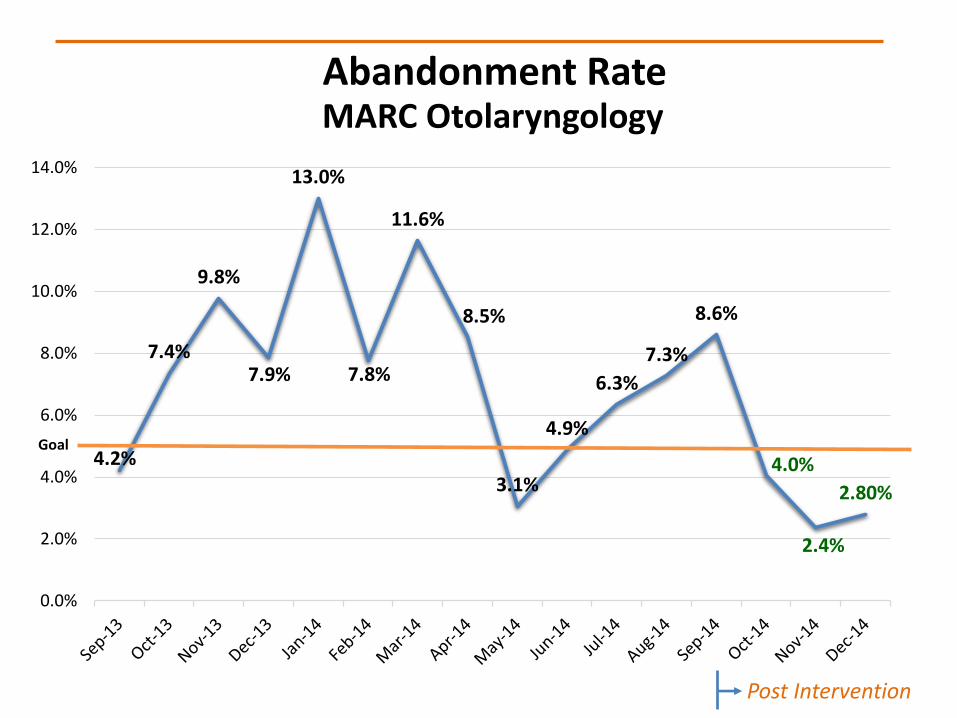
Abandonment Rate
4.2%
7.4%
9.8%
7.9%
13.0%
7.8%
11.6%
8.5%
3.1%
4.9%
6.3%
7.3%
8.6%
4.0%
2.4%
2.80%
0.0%
2.0%
4.0%
6.0%
8.0%
10.0%
12.0%
14.0%
MARC Otolaryngology
Goal
Post Intervention

Abandonment Rate MARC Otolaryngology
UCL 16.00%
10.10%
CL 7.64%
4.43%
LCL -0.71%
-1.25%
-4.50%
0.50%
5.50%
10.50%
15.50%
20.50%
Pe
rc
en
t
Pre and Post Intervention

Abandonment Rate: Trend by Week
6.9%
8.4% 8.9%
6.3%
4.4%
1.8%
5.3% 5.8%
1.9%
2.7% 3.0%
1.4%
2.7%
3.8%
1.8%
2.5% 2.6%
UCL 8.3%
CL 4.1%
LCL -0.1%
-5.0%
-3.0%
-1.0%
1.0%
3.0%
5.0%
7.0%
9.0%
11.0%
Pe
rc
en
t
Post Intervention Sept-14 -Dec-14
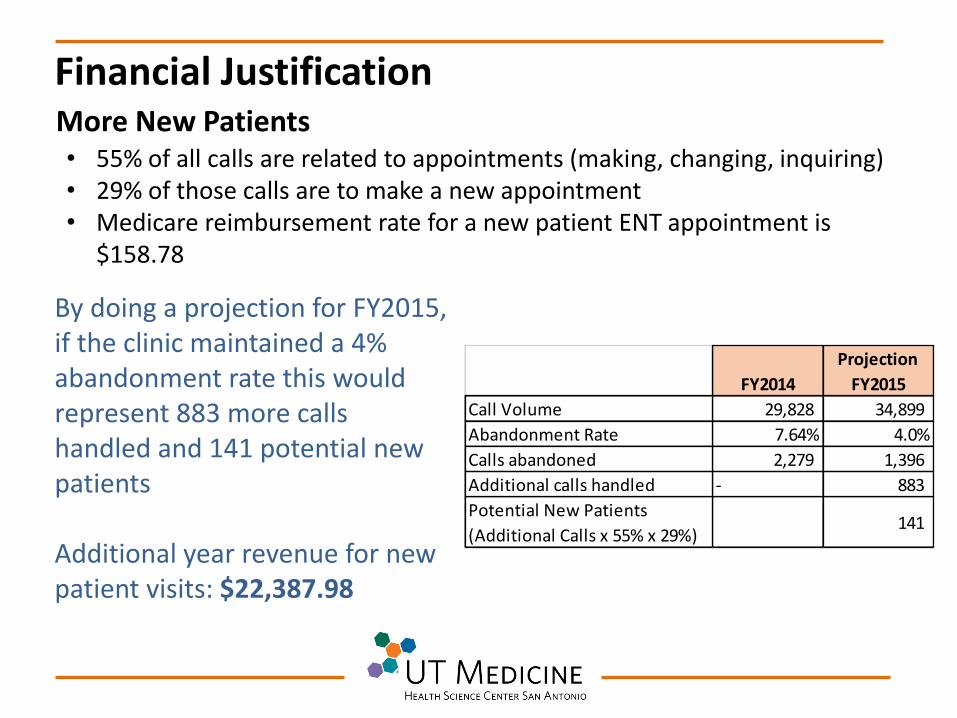
Financial Justification
• 55% of all calls are related to appointments (making, changing, inquiring) • 29% of those calls are to make a new appointment • Medicare reimbursement rate for a new patient ENT appointment is
$158.78
More New Patients
FY2014
Projection
FY2015
Call Volume 29,828 34,899
Abandonment Rate 7.64% 4.0%
Calls abandoned 2,279 1,396
Additional calls handled - 883
Potential New Patients
(Additional Calls x 55% x 29%)141
By doing a projection for FY2015, if the clinic maintained a 4% abandonment rate this would represent 883 more calls handled and 141 potential new patients Additional year revenue for new patient visits: $22,387.98

Financial Justification
Patient experience tied to future Medicare reimbursements
• Healthcare reform legislation passed by Congress requires patient ratings be considered for inclusion on the “Physician Compare” web site.
• The Value-Based Modifier program (VBM) is designed to assess both
quality of care and the cost of that care under the Medicare Physician Fee Schedule.
• At least 16.7% of value-based dollars will be based on these scores as part of Value-Based Modifier program (VBM)1.
1. http://www.pressganey.com/researchResources/governmentInitiatives/CGCAHPS/faqs.aspx#payment
Financial Justification
Improved Employee Engagement
“ It’s not hectic anymore. We actually have time to talk with patients without distractions. Also, now that we’re in the call center our patients can hear us better because there’s less noise” –Daniela Victorino “When I first started it was pretty overwhelming. Now we have time now to focus on our patients checking in and out and we don’t feel rushed.” – Kimberly Ornelas “I’m so happy! Do you see this smile on my face?” – Lizette Vela
Gallup researchers have found that “work units in the top quartile in
employee engagement outperformed bottom-quartile units by 10% on customer ratings,
22% in profitability, and 21% in productivity.”2
2. http://www.gallup.com/businessjournal/163130/employee-engagement-drives-growth.aspx

ACT

Next Steps
• Sustain! • Continue to produce weekly reports and
provide feedback to staff on weekly meetings

ENT Team - December 2014