reducing river export of nutrients and eutrophication in
TRANSCRIPT

Downloaded from http://iwby Wageningen Universion 29 September 2021
Reducing river export of nutrients and eutrophication
in Lake Dianchi in the future
© 2020 The Authors Blue-Green Systems Vol 2 No 173 doi: 10.2166/bgs.2020.923
Chuan Maa, Maryna Strokala, Carolien Kroezea, Mengru Wanga, Xiaolin Lib,Nynke Hofstrac and Lin Mad,*
a Water Systems and Global Change Group, Wageningen University & Research, P.O. Box 47, 6700 AA, Wageningen,The Netherlands
b Southwest Forestry University, College of Ecology and Soil & Water Conservation, Kunming, China
c Environmental Systems Analysis Group, Wageningen University & Research, P.O. Box 47, 6700 AA, Wageningen,The Netherlands
d Key Laboratory of Agricultural Water Resources, Center for Agricultural Resources Research, Institute of Genetic andDevelopmental Biology, The Chinese Academy of Sciences, 286 Huaizhong Road, Shijiazhuang 050021, Hebei, China
*Corresponding author. E-mail: [email protected]
Abstract
Lake Dianchi is severely polluted with nitrogen (N) and phosphorus (P). The effects of implementing environ-mental policies and technologies on future lake quality are not well understood. We analyse effects ofenvironmental policies and technologies on future river export of nutrients into Lake Dianchi. We develop scen-arios for 2050 and analyse these with the existing MARINA-Lakes model (Model to Assess River Inputs of Nutrientto lAkes). The scenarios differ in assumptions about future nutrient management in agriculture, sewage systemsand mining. In the SSP3 (Shared Socio-economic Pathway 3) scenario, river export of nutrients to Lake Dianchi isprojected to increase 1.4–4.4 times between 2012 and 2050. In the Current Policies scenario, rivers may exportfewer nutrients than in SSP3, but this may not avoid eutrophication. Effects of improved nutrient management onriver export of nutrients differ among nutrient forms, sub-basins and sources (e.g., urbanization in the north,agriculture in the middle and south). Pollution levels can be reduced below the 2012 level in an Optimisticscenario assuming advanced wastewater treatment, improved nutrient management in agriculture and nomining. However, even this may not completely prevent eutrophication. Preventing eutrophication requireseven more efforts, for example, in implementing circular-oriented management options.
Key words: eutrophication, Lake Dianchi, MARINA-Lakes model, scenarios
INTRODUCTION
Lake Dianchi is located in Yunnan province, China. Lake Dianchi is the sixth largest lake in Chinaand the largest freshwater lake in Yunnan. The lake is an important source of drinking water for manycities. Water from the lake is also used for industrial and agricultural activities (Gu et al. 2016). How-ever, the water quality of the lake has been deteriorating since the 1970s (Liu & Qiu 2007). As a result,the lake has been suffering from serious eutrophication problems such as harmful algal blooms overthe past years. Algal blooms happen frequently in this lake due to high concentrations of phosphorus(P) and nitrogen (N) (Tong et al. 2017).
This is an Open Access article distributed under the terms of the Creative Commons Attribution Licence (CC BY-NC-ND 4.0), which permits
copying and redistribution for non-commercial purposes with no derivatives, provided the original work is properly cited (http://
creativecommons.org/licenses/by-nc-nd/4.0/).
aponline.com/bgs/article-pdf/2/1/73/868277/bgs0020073.pdfty & Research – Library user
Blue-Green Systems Vol 2 No 174 doi: 10.2166/bgs.2020.923
Downloaded from http://iwby Wageningen Universion 29 September 2021
High concentrations of N and P in the lake are largely related to intensive human activities on land.These human activities include residential and industrial sewage, fertilizers usage in agriculture and Pmining (Huang et al. 2014; Li et al. 2019). Rivers export these nutrients to Lake Dianchi. However,large amounts of nutrients stay in the lake because of the limited outflow from the lake. As a result,eutrophication in the lake has occurred (Huang et al. 2014; Zhou et al. 2014; Gao et al. 2015; Wanget al. 2016).Many studies have been carried out for Lake Dianchi. They mainly focus on monitoring and mod-
elling the current water quality status (Liu et al. 2004, 2009; Gao et al. 2014; Zhou et al. 2015).However, few studies exist on how river export of nutrients from sub-basins influence the waterquality of the lake in the future. A study quantified river export of nutrients by source fromsub-basins to Lake Dianchi for the year 2012 (Li et al. 2019). However, future trends in riverexport of nutrients are not well studied. In addition, the effects of implementing environmental pol-icies and technologies on the lake quality in the future are not well understood.The national and local government have introduced a number of policy documents to reduce the
eutrophication problem of the lake. The lake is included in a national environmental project called‘Three rivers and three lakes’ since 1996. National plans are published every five years. Theseplans set goals to improve the water quality of the lake to meet the national standard of Water qualityfor Surface Water (GB3838-2002) (Liu & Wang 2016). In 1999, a local policy ‘Zero o’clock action’was published to control wastewater emissions from companies around the lake watershed (Zhanget al. 2014). Since 2006, projects such as wastewater collection and treatment, and sediments dredginghave been introduced to improve the water quality of the lake. These projects amounted to about 2.8billion USD (Liu & Wang 2016).The Chinese government has already realized the importance of controlling nutrient inputs towater sys-
tems fromagriculture. For example, in 2015, theMinistryofAgriculture published a policy ‘ZeroGrowth inFertilizer Use by 2020’ to reduce over-fertilization of cropland and increase recycling of animal manure toreplace fertilizers (MOA2015). In 2018, KunmingCity introduced a local policy ‘The implementation planof the three-year action on the protection and management of Lake Dianchi’. This plan is valid from 2018to 2020. Approximately 2.05 billion USD is set to be invested in the plan. A better understanding of theeffects of these environmental policies on the lake quality is still required.Several models exist to quantify nutrient flows from land to rivers, seas and lakes in China (Lewis et al.
2007; Ma et al. 2010; Gao et al. 2014; Strokal et al. 2016). Water quality models exist with different spatialand temporal levels of detail (e.g., SWAT, SPARROW, IMAGE-GNM) (Parton et al. 1998; Beusen et al.2015). The Global NEWS-2 model (Nutrient Export fromWaterSheds) is an example that quantifies riverexport of N and P by source for over 6,000 rivers in the world (Mayorga et al. 2010; Seitzinger et al. 2010).Another example is the MARINA model (Model to Assess River Inputs of Nutrients to seAs), developedfor China based on the modelling approaches of Global NEWS-2 (Strokal et al. 2016). The MARINAmodel quantifies past and future river export of nutrients at the sub-basins scale for large Chineserivers. MARINA has been used for the future analysis of coastal eutrophication.Recently, the MARINA-Lakes model has been implemented to Lake Dianchi for the year 2012 (Li
et al. 2019). MARINA-Lakes has been used to better understand the impact of nutrient loadings onthe lake in a spatially explicit way. This has been done for different nutrient forms: dissolved inorganic(DIN, DIP) and dissolved organic (DON, DOP) N and P. Results of the MARINA-Lakes model indi-cate that agriculture, urbanization and mining are important causes of the lake pollution withnutrients today. There is a need for future analyses to reduce this pollution.The main objective of this study is to analyse the effects of environmental policies and technologies
to reduce river export of nutrients to Lake Dianchi in 2050. To this end, we develop five scenarios andimplement them into the MARINA-Lakes model for 2050. We analyse future trends in river export ofnutrients by source from sub-basins to Lake Dianchi for the period of 2012–2050. Our analyses
aponline.com/bgs/article-pdf/2/1/73/868277/bgs0020073.pdfty & Research – Library user

Blue-Green Systems Vol 2 No 175 doi: 10.2166/bgs.2020.923
Downloaded from http://iwby Wageningen Universion 29 September 2021
focus on river export of DIN (dissolved inorganic N), DIP (dissolved inorganic P), DON (dissolvedorganic N) and DOP (dissolved organic P).
METHODS
Study area
Lake Dianchi is located in southwest of China in Yunnan province. The lake is surrounded by highlyurbanized areas, intensive agricultural and mining activities. The surface area of the lake is about309 km2, with 39 km of length and 13.5 km of width. The annual average depth of the lake is4.9 m. The maximum depth is 10.1 m, and the volume of the lake is around 13.9 billion m3 ofwater (Li et al. 2019). The watershed area of the lake comprises 15 sub-basins (Gao et al. 2014).These 15 sub-basins are used in the MARINA-Lakes model (see below). In this study, we define Pan-long, Caohai, Daqing, Haihe, Baoxiang sub-basins as the northern sub-basins, Xian, Maliao, Luolong,Laoyu, Nanchong and Yuni sub-basins as the middle sub-basins, and Gucheng, Dongda, Cigang andBaiyu sub-basins as the southern sub-basins (Figure 1).
The MARINA-Lakes model
MARINA-Lakes quantifies annual river export of DIN, DIP, DON and DOP by source from 15 sub-basins to Lake Dianchi. This is done as a function of human activities on land taking into account sub-basin characteristics (e.g., land use, hydrology) and nutrient retentions in soils and rivers. Full expla-nations and equations are in Appendix A and Li et al. (2019).The main equation of the MARINA-Lakes model is:
MF,y,j ¼ RSF:y,j � FEriv:F:outlet:j � FEriv:F:mouth:j (1)
where,F is the form of nutrients: dissolved inorganic (DIN, DIP) and dissolved organic (DON, DOP)
nitrogen (N) and phosphorus (P).MF,y,j is the annual river export of nutrient form F by source y from sub-basin j (kg/year).RSF:y,j is the input of nutrient form F to rivers by source y from sub-basin j (kg/year). RSF:y,j is
divided into diffuse (RSdi fF,y,j) and point (RSpntF:y:j) sources.FEriv:F:outlet:j is the fraction of nutrients exported to the outlet of sub-basin j (0–1).FEriv:F:mouth:j is the fraction of nutrients exported from sub-basin outlets to the river mouth
(into the lake) (0–1).
• Nutrient inputs to rivers from diffuse sources (RSdi fF,y,j, kg=year)
Diffuse sources include the use of synthetic fertilizers, animal manure and human waste on land.These are diffuse sources of DIN, DON, DIP and DOP in rivers. Atmospheric N deposition and bio-logical N2 fixation by vegetation are diffuse sources of DIN in rivers. Weathering of P-containedminerals and P mining are diffuse sources of DIP in rivers. Leaching of organic matter from soils isa diffuse source of DON and DOP in rivers (Table 1). RSdi fF,y,j is the sum of nutrient inputs torivers in the sub-basins from all diffuse sources (kg/year, see Equation (2)).
RSdi fF,y,j ¼ RSdi fant:F,y,j þ RSdi fexpl:ant:F,y,j þ RSdi fexpl:nat:F,y,j þ RSdi fDIP,min,j þ RSdi fnat,F,y,j (2)
where,RSdi fant:F,y,j is the input of nutrient form (F: DIN, DON, DIP or DOP) to rivers from anthropogenic
(ant) diffuse (dif) source y in sub-basin j (kg/year). These diffuse sources include the use of synthetic
aponline.com/bgs/article-pdf/2/1/73/868277/bgs0020073.pdfty & Research – Library user
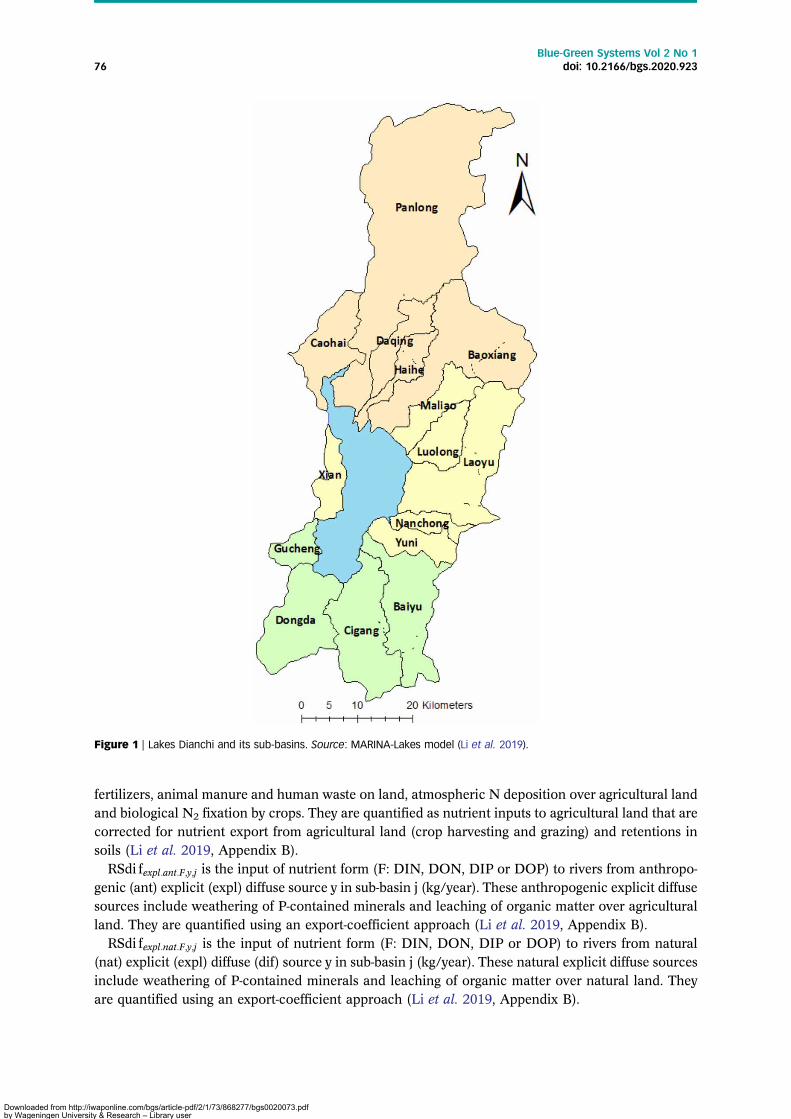
Figure 1 | Lakes Dianchi and its sub-basins. Source: MARINA-Lakes model (Li et al. 2019).
Blue-Green Systems Vol 2 No 176 doi: 10.2166/bgs.2020.923
Downloaded from http://iwby Wageningen Universion 29 September 2021
fertilizers, animal manure and human waste on land, atmospheric N deposition over agricultural landand biological N2 fixation by crops. They are quantified as nutrient inputs to agricultural land that arecorrected for nutrient export from agricultural land (crop harvesting and grazing) and retentions insoils (Li et al. 2019, Appendix B).RSdi fexpl:ant:F,y,j is the input of nutrient form (F: DIN, DON, DIP or DOP) to rivers from anthropo-
genic (ant) explicit (expl) diffuse source y in sub-basin j (kg/year). These anthropogenic explicit diffusesources include weathering of P-contained minerals and leaching of organic matter over agriculturalland. They are quantified using an export-coefficient approach (Li et al. 2019, Appendix B).RSdi fexpl:nat:F,y,j is the input of nutrient form (F: DIN, DON, DIP or DOP) to rivers from natural
(nat) explicit (expl) diffuse (dif) source y in sub-basin j (kg/year). These natural explicit diffuse sourcesinclude weathering of P-contained minerals and leaching of organic matter over natural land. Theyare quantified using an export-coefficient approach (Li et al. 2019, Appendix B).
aponline.com/bgs/article-pdf/2/1/73/868277/bgs0020073.pdfty & Research – Library user
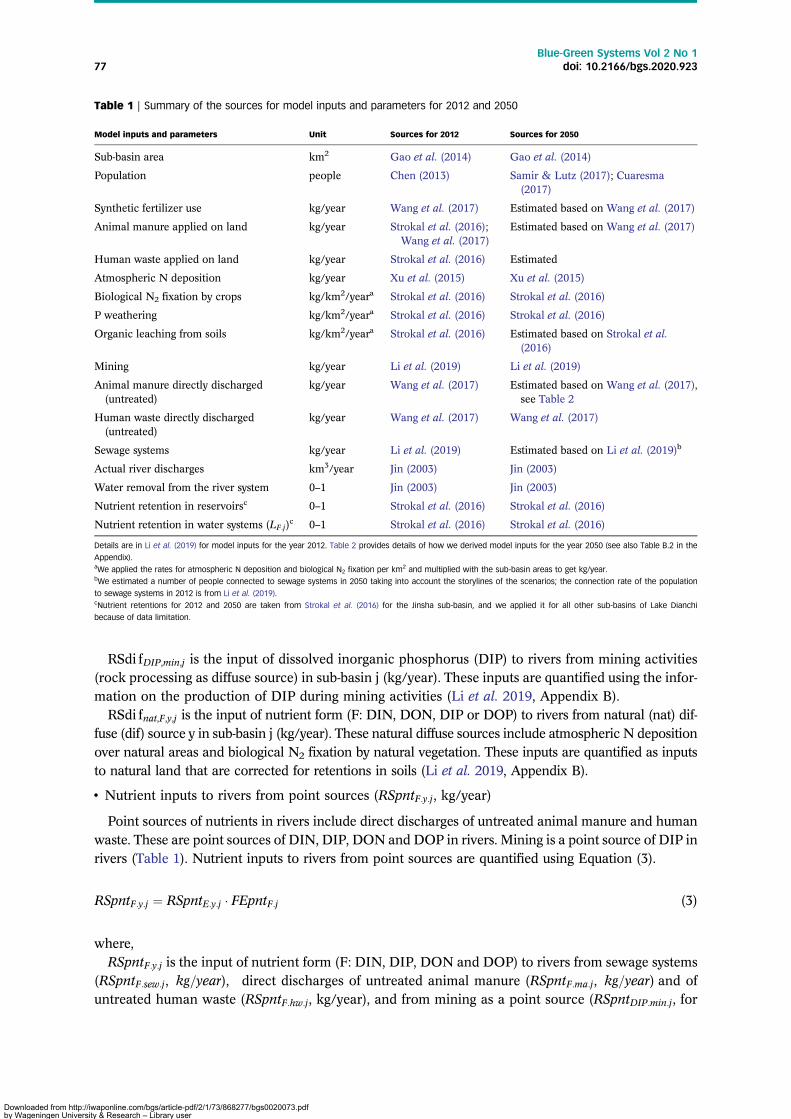
Table 1 | Summary of the sources for model inputs and parameters for 2012 and 2050
Model inputs and parameters Unit Sources for 2012 Sources for 2050
Sub-basin area km2 Gao et al. (2014) Gao et al. (2014)
Population people Chen (2013) Samir & Lutz (2017); Cuaresma(2017)
Synthetic fertilizer use kg/year Wang et al. (2017) Estimated based on Wang et al. (2017)
Animal manure applied on land kg/year Strokal et al. (2016);Wang et al. (2017)
Estimated based on Wang et al. (2017)
Human waste applied on land kg/year Strokal et al. (2016) Estimated
Atmospheric N deposition kg/year Xu et al. (2015) Xu et al. (2015)
Biological N2 fixation by crops kg/km2/yeara Strokal et al. (2016) Strokal et al. (2016)
P weathering kg/km2/yeara Strokal et al. (2016) Strokal et al. (2016)
Organic leaching from soils kg/km2/yeara Strokal et al. (2016) Estimated based on Strokal et al.(2016)
Mining kg/year Li et al. (2019) Li et al. (2019)
Animal manure directly discharged(untreated)
kg/year Wang et al. (2017) Estimated based on Wang et al. (2017),see Table 2
Human waste directly discharged(untreated)
kg/year Wang et al. (2017) Wang et al. (2017)
Sewage systems kg/year Li et al. (2019) Estimated based on Li et al. (2019)b
Actual river discharges km3/year Jin (2003) Jin (2003)
Water removal from the river system 0–1 Jin (2003) Jin (2003)
Nutrient retention in reservoirsc 0–1 Strokal et al. (2016) Strokal et al. (2016)
Nutrient retention in water systems (LF:j)c 0–1 Strokal et al. (2016) Strokal et al. (2016)
Details are in Li et al. (2019) for model inputs for the year 2012. Table 2 provides details of how we derived model inputs for the year 2050 (see also Table B.2 in the
Appendix).aWe applied the rates for atmospheric N deposition and biological N2 fixation per km2 and multiplied with the sub-basin areas to get kg/year.bWe estimated a number of people connected to sewage systems in 2050 taking into account the storylines of the scenarios; the connection rate of the population
to sewage systems in 2012 is from Li et al. (2019).cNutrient retentions for 2012 and 2050 are taken from Strokal et al. (2016) for the Jinsha sub-basin, and we applied it for all other sub-basins of Lake Dianchi
because of data limitation.
Blue-Green Systems Vol 2 No 177 doi: 10.2166/bgs.2020.923
Downloaded from http://iwby Wageningen Universion 29 September 2021
RSdi fDIP,min,j is the input of dissolved inorganic phosphorus (DIP) to rivers from mining activities(rock processing as diffuse source) in sub-basin j (kg/year). These inputs are quantified using the infor-mation on the production of DIP during mining activities (Li et al. 2019, Appendix B).RSdi fnat,F,y,j is the input of nutrient form (F: DIN, DON, DIP or DOP) to rivers from natural (nat) dif-
fuse (dif) source y in sub-basin j (kg/year). These natural diffuse sources include atmospheric N depositionover natural areas and biological N2 fixation by natural vegetation. These inputs are quantified as inputsto natural land that are corrected for retentions in soils (Li et al. 2019, Appendix B).
• Nutrient inputs to rivers from point sources (RSpntF:y:j, kg/year)
Point sources of nutrients in rivers include direct discharges of untreated animal manure and humanwaste. These are point sources of DIN, DIP, DON and DOP in rivers. Mining is a point source of DIP inrivers (Table 1). Nutrient inputs to rivers from point sources are quantified using Equation (3).
RSpntF:y:j ¼ RSpntE:y:j � FEpntF:j (3)
where,RSpntF:y:j is the input of nutrient form (F: DIN, DIP, DON and DOP) to rivers from sewage systems
(RSpntF:sew:j, kg=year), direct discharges of untreated animal manure (RSpntF:ma:j, kg=year) and ofuntreated human waste (RSpntF:hw:j, kg/year), and from mining as a point source (RSpntDIP:min:j, for
aponline.com/bgs/article-pdf/2/1/73/868277/bgs0020073.pdfty & Research – Library user

Blue-Green Systems Vol 2 No 178 doi: 10.2166/bgs.2020.923
Downloaded from http://iwby Wageningen Universion 29 September 2021
DIP only, kg/year). Details about the equations to quantify these point source inputs to rivers aregiven in Appendix B (see also Li et al. 2019).RSpntE:y:j is the input of nutrient element (E: N or P) to rivers from point source y in sub-basin j
(kg/year).FEpntF:j is the fraction of nutrient element that enters rivers from point sources in form F (DIN,
DIP, DON and DOP) (0–1).
• Nutrient retentions in rivers (FEriv:F:outlet:j � FEriv:F:mouth:j, 0� 1)
The nutrient export fractions are quantified using Equation (4).
FEriv:F:outlet:j ¼ (1� LF:j) � (1�DF:j) � (1� FQremj) (4)
where,LF:j is the fraction of nutrient form (F: DIN, DIP) retained in and lost from river systems in sub-basin
j due to denitrification (for DIN) and sedimentation (for DIP) (0–1).DF:j is the fraction of nutrient form (F: DIN, DIP) retained in reservoirs in sub-basin j (0–1).FQremj is the fraction of nutrient form (F: DIN, DIP, DON, DOP) removed from sub-basin j
through water consumption (0–1). Details are in Li et al. (2019).In Lake Dianchi, all sub-basins drain directly into the lake, thus FEriv:F:mouth:j ¼ 1.
• Model inputs
The nutrient export to Lake Dianchi in 2012 is quantified using the MARINA-Lakes model from Liet al. (2019). The model inputs and their sources are provided by Li et al. (2019) for 2012 (see alsoTable B.1 in the Appendix). Here, we summarize the sources of the main model inputs and par-ameters for Lake Dianchi in Table 1. Table 2 gives more details on how we derive model inputsfor 2050 (see section on scenarios below).
Scenarios
SSP3 (Shared Socio-economic Pathway 3) is used as a worst-case for Lake Dianchi (O’Neill et al.2014; Fujimori et al. 2017; Riahi et al. 2017). Four alternative scenarios are developed based onthe SSP3 scenario: CP, AT, IAM and OPT scenarios. These four alternative scenarios are describedbelow. Table 2 summarizes the main descriptions of the scenarios.SSP3 was interpreted for the Chinese food system for 2050 (Wang et al. 2017). For Lake Dianchi,
SSP3 assumes that population will increase relatively fast until 2030. However, by 2050 the total popu-lation may decrease, reaching the level of 2012. Population in China is expected to decrease between2030 and 2050 as the net effect of the ‘One-Child’ policy (Goodkind 2017; Zhang 2017). The pro-duction of animal manure is projected to increase by 90% between 2012 and 2050 in all sub-basins.This is because more people will move to cities, the demand for food in cities might increase. Peopleare expected to have more preferences for meat products (Wang et al. 2017). In this scenario, policiesfor nutrient management in agriculture, sewage systems and mining are not effectively implemented. Asa consequence, synthetic fertilizer use on land is expected to increase by 26% (Wang et al. 2017)between 2012 and 2050 for all sub-basins (Table 2). Manure recycling rates will stay at the level of2012 (52% of the total excretion). Fractions of direct discharges of manure to rivers in this scenarioare expected to stay as in 2012. The same holds for untreated human waste. The same fraction ofthe urban and rural population will be connected to sewage systems in 2050 as in 2012 with thehigher number of people in cities. Wastewater treatment technologies might not be improved largelycompared to the level of 2012. Mining activities will continue as in 2012.The CP scenario reflects implementation of the Current environmental Policies for agriculture,
mining and urbanization (Table 2). In this scenario, implementation of the following national
aponline.com/bgs/article-pdf/2/1/73/868277/bgs0020073.pdfty & Research – Library user

Table 2 | Description of the five scenarios to quantify nutrient export by rivers from sub-basins to Lake Dianchi in 2050
Human activities 2012
Scenarios for 2050
SSP3 CP AT IAM OPT
Agriculture Manure excretion (ton/km2/year) 3 for N and 1.5 for P 90% increasebetween 2012and 2050a
As SSP3 As SSP3 As SSP3 As SSP3
Manure recycling on land(% of the total excretion)
52%a for N1 and P As 2012 57% for N1 and P As SSP3 62% for N1 and P As IAM
Manure discharges to rivers(% of the total excretion)
10% As 2012 5%1 As SSP3 0%1 As IAM
Synthetic fertilizer use (ton/km2/year) 8.5 for N and 1.3 for P 26% increasebetween 2012and 2050a
At the level of2020
As SSP3 30% decreasebetween 2012and 2050
As IAM
Sewagesystems
Human waste directly discharged to rivers(untreated) from urban and rural population(% of the total human excretion)
For N: 13% for urban and 23% for ruralpopulation; For P: 13% for urban and47% for rural population
As 2012 As 2012 As SSP3 As SSP3 As 2012
Total population (103 people) 103 urban and 368 rural As 2012b As SSP3 As SSP3 As SSP3 As SSP3People connected to sewage systems(% of the population)
94% for urbanc and 55% for ruralc As 2012 97% for urbanand 60% forrural
99% forurban, 70%for rural
As SSP3 AS AT
Nutrient removal efficiencies (%) 35% for Nc, 67% for Pc As 2012 65% for N, 83%for P2
90% for Nand 95%for P
As SSP3 AS AT
Mining Mining activities (ton/year) 28 ton of DIPc As 2012 Ban As SSP3 As CP As IAM
SSP3 is Shared Socio-economic Pathway 3. CP assumes the full implementation of the Current Policies relative to SSP3. AT assumes more urbanization and the full implementation of Advanced Technologies to treat wastewater relative to SSP3.
IAM assumes the full implementation of Improved nutrient management in Agriculture and banned Mining relative to SSP3. OPT is an optimistic scenario combining the AT and IAM scenarios. Source: MARINA-Lakes model (see Methods section).aWang et al. (2017).bSamir & Lutz (2017); Cuaresma (2017).cLi et al. (2019).1Manure recycling rates are quantified as the amount of recycled manure on land divided by the amount of the total manure excretion. The recycled manure is quantified from the total manure excretion that is corrected for N losses to air and
direct discharges to rivers. N losses to air are from Li et al. (2019). The fraction of direct manure discharges for 2012 is from Li et al. (2019) and assumed for 2050 depending on scenario. For CP scenario, we assumed that manure recycling will be
increased as a result of decreased direct manure discharges to rivers compared to 2012. For IAM scenario, we assumed that direct discharges to rivers will be fully avoided. As a result, more animal manure will be applied on land.2This nutrient removal efficiencies are derived using literature on the advanced technologies A²/O and ICEAS (Liu et al. 2007; Zhang et al. 2008) implemented by a wastewater treatment company in Kunming City, we assumed that the whole sub-
basin will implement this technology by 2050 in CP scenario (see also Appendix C for more information about policies and technologies).
Blue-G
reenSystem
sVol2
No1
79doi:
10.2166/bgs.2020.923
Downloaded from http://iwaponline.com/bgs/article-pdf/2/1/73/868277/bgs0020073.pdfby Wageningen University & Research – Library useron 29 September 2021

Blue-Green Systems Vol 2 No 180 doi: 10.2166/bgs.2020.923
Downloaded from http://iwby Wageningen Universion 29 September 2021
policy is assumed for agriculture: ‘Zero growth in Synthetic Fertilizers Use by 2020’ (MOA 2015). Thiscurrent policy also calls for a 60% recycling rate of manure on land. Thus, we assume that the percen-tage of direct manure discharges to rivers will decrease to 5% in 2050 (Table 2, see also Appendix C).As a result, the amount of manure use on land will increase in 2050 compared to SSP3. The amount ofsynthetic fertilizers will stay at the level of 2020. The total population will stay at the level of 2012 as inSSP3. However, the fraction of urban (97% in 2050) and rural (60% in 2050) population connected tosewage systems will increase; this is in line with the ‘Lake Dianchi protection regulations in Yunnanprovince’ (KLDA 2013). Improved technologies to treat wastewater will be implemented. This impliesthat nutrient removal efficiencies will be higher in 2050 than in 2012: 65% for N and.80% for P in allsub-basin. All mining activities will be banned (KGO 2017). More information about policies andtechnologies are in Appendix C (Tables C.1 to C.5).The AT scenario assumes the full implementation of Advanced Technologies for wastewater treat-
ment. In this scenario, the population size, urbanization, economy and agricultural activities are thesame as in SSP3. The only difference from SSP3 is in advanced technologies for wastewater treatmentand in an increasing number of people connected to sewage systems. Some technologies could alsoreach very high nutrient removal efficiencies in theory, such as reverse osmosis (RO) and anaerobicammonium oxidation (anammox). RO is a pressure driven membrane process to separate dissolvedcomponents in permeates, and is more important in industrial applications (Kucera; Wenten 2016).Anammox is a process which directly oxidizes ammonium to dinitrogen gas under anoxic condition,it is promising for N removal from wastewater (Tang et al. 2017) (see also Table C.4 in the Appendix).The connection rate of population to sewage systems will be 99% for urban people and 70% for ruralpeople. The nutrient removal efficiencies are 90% and 95% for N and P, respectively (Table 2).The IAM scenario assumes Improved nutrient use efficiencies in Agriculture and stopping Mining
activities. Improved nutrient management in agriculture implies high animal manure recycling onland and less synthetic fertilizer use with the same socio-economic development as in SSP3. This scen-ario differs from the CP scenario in that it has well-implemented policies in agriculture and miningindustry (KPGOYP 2008; MOA 2015; KGO 2017). These policies are extended with advanced tech-nologies to manage manure and nutrients in agriculture. Examples are injection of manure to avoidlosses of nutrients to the environment during application (Wang et al. 2017). These nutrient manage-ment options can increase N and P use efficiencies in food production and thus reduce losses of Nand P to rivers. For the sub-basins of Lake Dianchi, all available animal manure is assumed to berecycled on land (100% for N and P). Thus, direct discharges of manure will be avoided. Syntheticfertilizer use on land will be reduced by 30% compared to 2012 to avoid over-fertilization(Table 2). All mining activities along Lake Dianchi are assumed to be stopped.The OPT scenario combines assumptions of the AT and IAM scenarios. OPT assumes an optimistic
world with improved nutrient management in agriculture, no mining activities and implemented bestavailable technologies. The population, urbanization and economy growth will stay as in SSP3.Almost all urban and over two-thirds of the rural population will be connected to sewage systems.Nutrient removal efficiencies will be high in wastewater treatment plants (90% for N, 95% for P).The use of synthetic fertilizer is expected to reduce by 30% in 2050 compared to 2012, andmanure cycling rates could increase as in IAM. Mining activities will be forbidden in 2050.
RESULTS
Future trends in river export of nutrients by source
In 2012, rivers exported large amounts of nutrients to Lake Dianchi (Figure 2). We quantify that about5,000 ton of DIN and over 1,000 ton of DON were exported to the lake from 15 sub-basins (Figure 1).
aponline.com/bgs/article-pdf/2/1/73/868277/bgs0020073.pdfty & Research – Library user
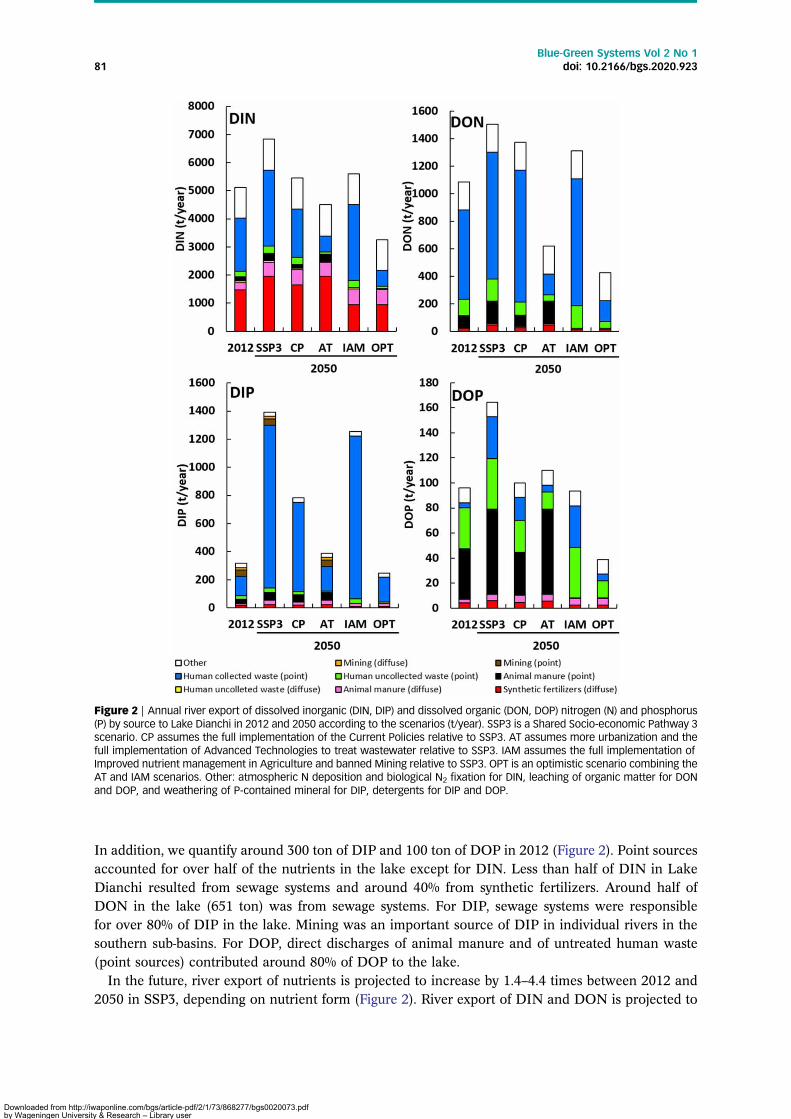
Figure 2 | Annual river export of dissolved inorganic (DIN, DIP) and dissolved organic (DON, DOP) nitrogen (N) and phosphorus(P) by source to Lake Dianchi in 2012 and 2050 according to the scenarios (t/year). SSP3 is a Shared Socio-economic Pathway 3scenario. CP assumes the full implementation of the Current Policies relative to SSP3. AT assumes more urbanization and thefull implementation of Advanced Technologies to treat wastewater relative to SSP3. IAM assumes the full implementation ofImproved nutrient management in Agriculture and banned Mining relative to SSP3. OPT is an optimistic scenario combining theAT and IAM scenarios. Other: atmospheric N deposition and biological N2 fixation for DIN, leaching of organic matter for DONand DOP, and weathering of P-contained mineral for DIP, detergents for DIP and DOP.
Blue-Green Systems Vol 2 No 181 doi: 10.2166/bgs.2020.923
Downloaded from http://iwby Wageningen Universion 29 September 2021
In addition, we quantify around 300 ton of DIP and 100 ton of DOP in 2012 (Figure 2). Point sourcesaccounted for over half of the nutrients in the lake except for DIN. Less than half of DIN in LakeDianchi resulted from sewage systems and around 40% from synthetic fertilizers. Around half ofDON in the lake (651 ton) was from sewage systems. For DIP, sewage systems were responsiblefor over 80% of DIP in the lake. Mining was an important source of DIP in individual rivers in thesouthern sub-basins. For DOP, direct discharges of animal manure and of untreated human waste(point sources) contributed around 80% of DOP to the lake.In the future, river export of nutrients is projected to increase by 1.4–4.4 times between 2012 and
2050 in SSP3, depending on nutrient form (Figure 2). River export of DIN and DON is projected to
aponline.com/bgs/article-pdf/2/1/73/868277/bgs0020073.pdfty & Research – Library user
Blue-Green Systems Vol 2 No 182 doi: 10.2166/bgs.2020.923
Downloaded from http://iwby Wageningen Universion 29 September 2021
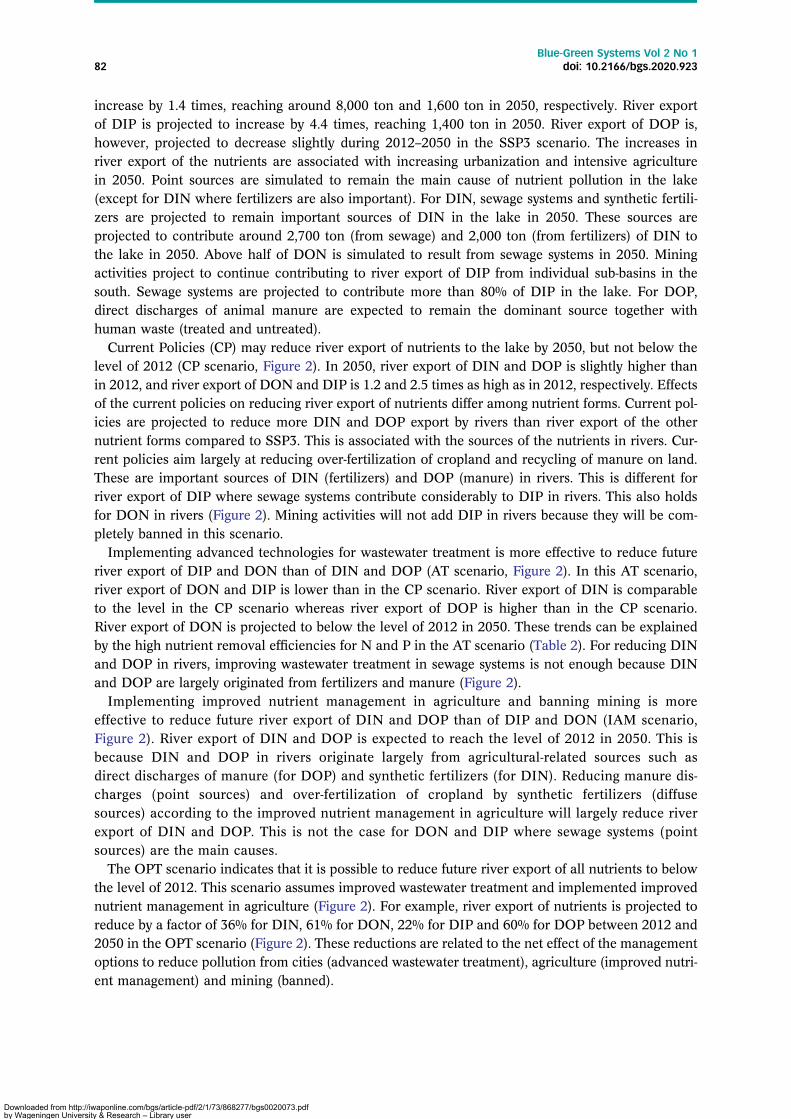
increase by 1.4 times, reaching around 8,000 ton and 1,600 ton in 2050, respectively. River exportof DIP is projected to increase by 4.4 times, reaching 1,400 ton in 2050. River export of DOP is,however, projected to decrease slightly during 2012–2050 in the SSP3 scenario. The increases inriver export of the nutrients are associated with increasing urbanization and intensive agriculturein 2050. Point sources are simulated to remain the main cause of nutrient pollution in the lake(except for DIN where fertilizers are also important). For DIN, sewage systems and synthetic fertili-zers are projected to remain important sources of DIN in the lake in 2050. These sources areprojected to contribute around 2,700 ton (from sewage) and 2,000 ton (from fertilizers) of DIN tothe lake in 2050. Above half of DON is simulated to result from sewage systems in 2050. Miningactivities project to continue contributing to river export of DIP from individual sub-basins in thesouth. Sewage systems are projected to contribute more than 80% of DIP in the lake. For DOP,direct discharges of animal manure are expected to remain the dominant source together withhuman waste (treated and untreated).Current Policies (CP) may reduce river export of nutrients to the lake by 2050, but not below the
level of 2012 (CP scenario, Figure 2). In 2050, river export of DIN and DOP is slightly higher thanin 2012, and river export of DON and DIP is 1.2 and 2.5 times as high as in 2012, respectively. Effectsof the current policies on reducing river export of nutrients differ among nutrient forms. Current pol-icies are projected to reduce more DIN and DOP export by rivers than river export of the othernutrient forms compared to SSP3. This is associated with the sources of the nutrients in rivers. Cur-rent policies aim largely at reducing over-fertilization of cropland and recycling of manure on land.These are important sources of DIN (fertilizers) and DOP (manure) in rivers. This is different forriver export of DIP where sewage systems contribute considerably to DIP in rivers. This also holdsfor DON in rivers (Figure 2). Mining activities will not add DIP in rivers because they will be com-pletely banned in this scenario.Implementing advanced technologies for wastewater treatment is more effective to reduce future
river export of DIP and DON than of DIN and DOP (AT scenario, Figure 2). In this AT scenario,river export of DON and DIP is lower than in the CP scenario. River export of DIN is comparableto the level in the CP scenario whereas river export of DOP is higher than in the CP scenario.River export of DON is projected to below the level of 2012 in 2050. These trends can be explainedby the high nutrient removal efficiencies for N and P in the AT scenario (Table 2). For reducing DINand DOP in rivers, improving wastewater treatment in sewage systems is not enough because DINand DOP are largely originated from fertilizers and manure (Figure 2).Implementing improved nutrient management in agriculture and banning mining is more
effective to reduce future river export of DIN and DOP than of DIP and DON (IAM scenario,Figure 2). River export of DIN and DOP is expected to reach the level of 2012 in 2050. This isbecause DIN and DOP in rivers originate largely from agricultural-related sources such asdirect discharges of manure (for DOP) and synthetic fertilizers (for DIN). Reducing manure dis-charges (point sources) and over-fertilization of cropland by synthetic fertilizers (diffusesources) according to the improved nutrient management in agriculture will largely reduce riverexport of DIN and DOP. This is not the case for DON and DIP where sewage systems (pointsources) are the main causes.The OPT scenario indicates that it is possible to reduce future river export of all nutrients to below
the level of 2012. This scenario assumes improved wastewater treatment and implemented improvednutrient management in agriculture (Figure 2). For example, river export of nutrients is projected toreduce by a factor of 36% for DIN, 61% for DON, 22% for DIP and 60% for DOP between 2012 and2050 in the OPT scenario (Figure 2). These reductions are related to the net effect of the managementoptions to reduce pollution from cities (advanced wastewater treatment), agriculture (improved nutri-ent management) and mining (banned).
aponline.com/bgs/article-pdf/2/1/73/868277/bgs0020073.pdfty & Research – Library user

Blue-Green Systems Vol 2 No 183 doi: 10.2166/bgs.2020.923
Downloaded from http://iwby Wageningen Universion 29 September 2021
Future trends in river export of nutrients by sub-basin
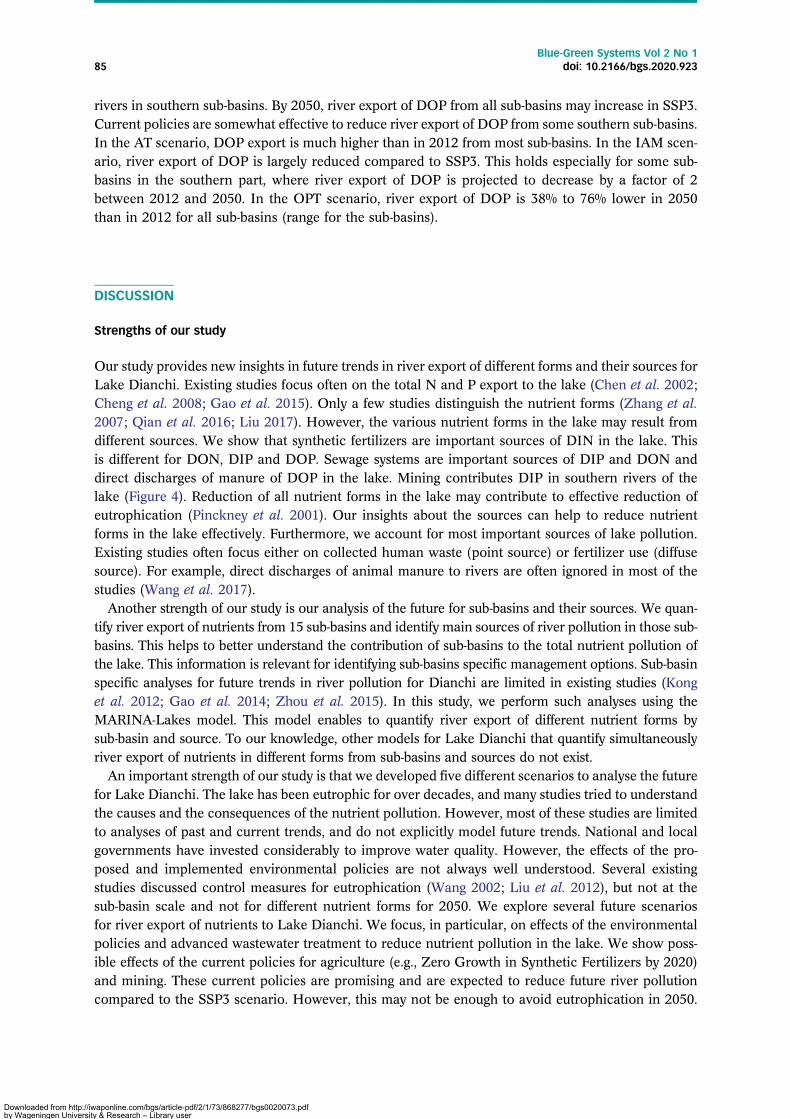
River export of nutrients differs among sub-basins and nutrient forms (Figures 3 and 4). Caohai andDaqing sub-basins (north) are the two most polluted sub-basins (Figure 1). For example, they exported0.3–10 times higher DIN to the lake in 2012 than the other sub-basins (except for the Panlong sub-basin). This also holds for other scenarios for 2050 (Figures 3 and 4).River export of DIN is projected to increase by 2050 in SSP3 (see the previous section). However,
the sources of DIN in rivers differ among sub-basins in SSP3 (Figures 1 and 3). DIN is mainly fromsynthetic fertilizers and manure use on land in middle and southern sub-basins in 2050 SSP3. In thenorthern sub-basins, DIN in rivers is largely from sewage systems. In the CP scenario, all sub-basinsare projected to export lower amounts of DIN compared to SSP3, but higher amounts of DIN com-pared to 2012 in 2050. In the AT scenario, improved sewage systems is more effective to reduce DINfrom the northern sub-basins (Caohai and Daqing, Figure 3). In the IAM scenario, improved nutrientmanagement in agriculture is effective to reduce DIN export from middle and southern sub-basins. Inthe OPT scenario, DIN reductions in river export from all sub-basins are higher compared to the otherscenarios. For example, river export of DIN is projected to reduce by 20–65% (range for sub-basins) inOPT between 2012 and 2050.Likewise, sources of DON in rivers differ among sub-basins (Figure 3). In SSP3, DON in rivers is
mainly from sewage systems in northern sub-basins. In rivers of southern sub-basins, DON is largelyfrom sewage systems and animal manure (untreated) (Figures 1 and 3). In the CP scenario, DONexport is not effectively reduced. In this scenario, lower river export of DON is projected from
Figure 3 | Annual river export of dissolved inorganic (DIN) and dissolved organic (DON) nitrogen (N) by sub-basin (kg/km2 of thesub-basin area/year) and the share of the sources in annual river export of DIN and DON (0–1) in 2012 and 2050 according to thescenarios. SSP3 is a Shared Socio-economic Pathway 3 scenario. CP assumes the full implementation of the CurrentPolicies relative to SSP3. AT assumes more urbanization and the full implementation of Advanced Technologies to treatwastewater relative to SSP3. IAM assumes the full implementation of Improved nutrient management in Agriculture and bannedMining relative to SSP3. OPT is an optimistic scenario combining the AT and IAM scenarios. Source: MARINA-Lakes model (seeMethods section).
aponline.com/bgs/article-pdf/2/1/73/868277/bgs0020073.pdfty & Research – Library user

Figure 4 | Annual river export of dissolved inorganic (DIP) and dissolved organic (DOP) phosphorus (P) by sub-basin (kg/km2 of thesub-basin area/year) and the share of the sources in annual river export of DIP and DOP (0–1) in 2012 and 2050 according to thescenarios. SSP3 is a Shared Socio-economic Pathway 3 scenario. CP assumes the full implementation of the Current Policiesrelative to SSP3. AT assumes more urbanization and the full implementation of Advanced Technologies to treat wastewater relativeto SSP3. IAM assumes the full implementation of Improved nutrient management in Agriculture and banned Mining relative to SSP3.OPT is an optimistic scenario combining the AT and IAM scenarios. Source: MARINA-Lakes model (see Methods section).
Blue-Green Systems Vol 2 No 184 doi: 10.2166/bgs.2020.923
Downloaded from http://iwby Wageningen Universion 29 September 2021
only a few sub-basins compared to SSP3. This is because more efforts are needed to reduce directmanure discharges and improve wastewater treatment in the CP scenario. In the AT scenario,DON in rivers of sub-basins in the middle-northern part (Figure 1) is expected to reduce in 2050 com-pared to SSP3. This is because sewage systems in those sub-basins contribute largely to the riverpollution. Advanced wastewater treatment in the AT scenario may reduce river pollution in thosesub-basins. This is different for southern sub-basins (e.g., Cigang and Baiyu) where improved nutrientmanagement in agriculture (IAM scenario) is more effective to reduce river pollution compared toSSP3. In the OPT scenario, river export of DON is projected to reduce from all sub-basins.DIP in rivers of northern sub-basins is mainly from sewage systems in SSP3. Mining activities lar-
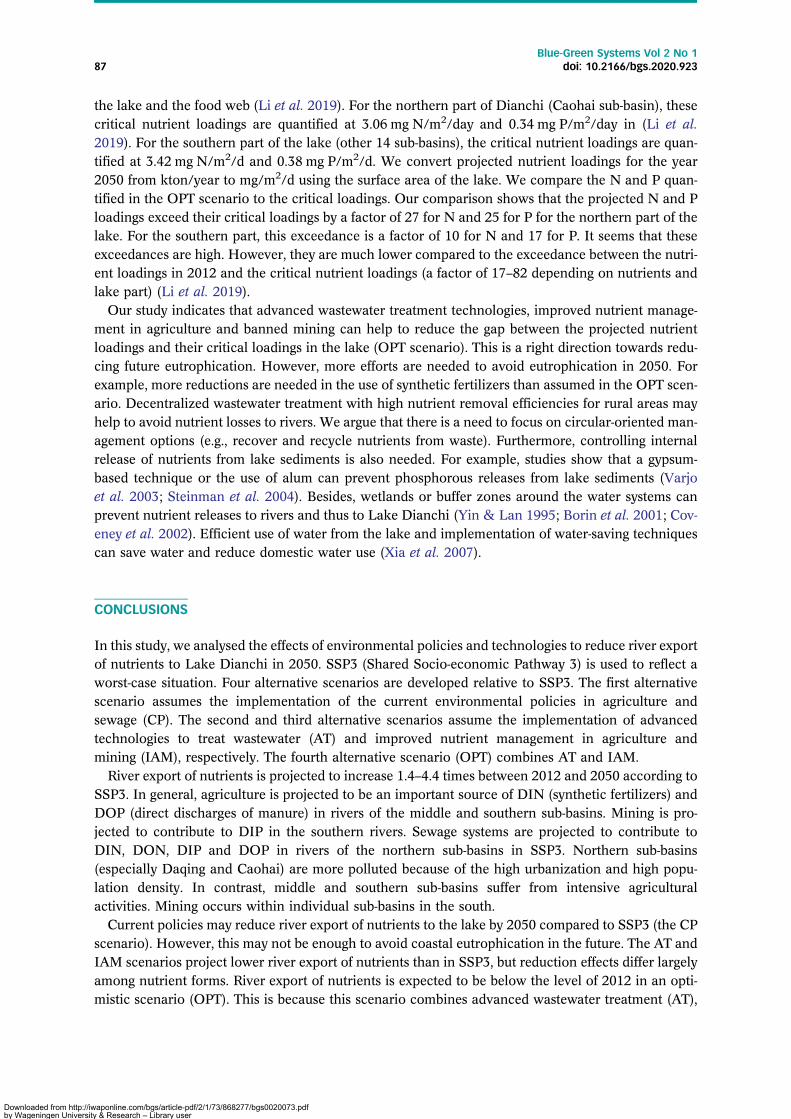
gely contribute to DIP in rivers of southern sub-basins in SSP3. Direct discharges of animal manureare important sources of DIP in rivers of southern sub-basins in SSP3. Overall, the CP scenario is lesseffective in reducing river export of DIP from most sub-basins. Exceptions are rivers of some southernsub-basins that may export less DIP to the lake. This is because CP assumes some improvements innutrient management in agriculture and banning of mining that are sources of DIP in those rivers.In the AT scenario, river export of DIP from northern sub-basins (Figure 1) is a factor of 3–6 lowercompared to SSP3 and CP. In the IAM scenario, policies (KPGOYP 2008; MOA 2015; KGO 2017)for better agricultural management and banning mining reduce river export of DIP from the southernsub-basins (Figure 4). In the OPT scenario, river export of DIP from all sub-basins is projected to belower in 2050 than in 2012.River export of DOP from southern sub-basins is generally higher than from northern sub-basins
(Figure 4). This is different for other nutrient forms (see above). The main sources of DOP in riversare untreated human excreta in northern sub-basins and direct discharges of animal manure to
aponline.com/bgs/article-pdf/2/1/73/868277/bgs0020073.pdfty & Research – Library user
Blue-Green Systems Vol 2 No 185 doi: 10.2166/bgs.2020.923
Downloaded from http://iwby Wageningen Universion 29 September 2021
rivers in southern sub-basins. By 2050, river export of DOP from all sub-basins may increase in SSP3.Current policies are somewhat effective to reduce river export of DOP from some southern sub-basins.In the AT scenario, DOP export is much higher than in 2012 from most sub-basins. In the IAM scen-ario, river export of DOP is largely reduced compared to SSP3. This holds especially for some sub-basins in the southern part, where river export of DOP is projected to decrease by a factor of 2between 2012 and 2050. In the OPT scenario, river export of DOP is 38% to 76% lower in 2050than in 2012 for all sub-basins (range for the sub-basins).
DISCUSSION
Strengths of our study
Our study provides new insights in future trends in river export of different forms and their sources forLake Dianchi. Existing studies focus often on the total N and P export to the lake (Chen et al. 2002;Cheng et al. 2008; Gao et al. 2015). Only a few studies distinguish the nutrient forms (Zhang et al.2007; Qian et al. 2016; Liu 2017). However, the various nutrient forms in the lake may result fromdifferent sources. We show that synthetic fertilizers are important sources of DIN in the lake. Thisis different for DON, DIP and DOP. Sewage systems are important sources of DIP and DON anddirect discharges of manure of DOP in the lake. Mining contributes DIP in southern rivers of thelake (Figure 4). Reduction of all nutrient forms in the lake may contribute to effective reduction ofeutrophication (Pinckney et al. 2001). Our insights about the sources can help to reduce nutrientforms in the lake effectively. Furthermore, we account for most important sources of lake pollution.Existing studies often focus either on collected human waste (point source) or fertilizer use (diffusesource). For example, direct discharges of animal manure to rivers are often ignored in most of thestudies (Wang et al. 2017).Another strength of our study is our analysis of the future for sub-basins and their sources. We quan-
tify river export of nutrients from 15 sub-basins and identify main sources of river pollution in those sub-basins. This helps to better understand the contribution of sub-basins to the total nutrient pollution ofthe lake. This information is relevant for identifying sub-basins specific management options. Sub-basinspecific analyses for future trends in river pollution for Dianchi are limited in existing studies (Konget al. 2012; Gao et al. 2014; Zhou et al. 2015). In this study, we perform such analyses using theMARINA-Lakes model. This model enables to quantify river export of different nutrient forms bysub-basin and source. To our knowledge, other models for Lake Dianchi that quantify simultaneouslyriver export of nutrients in different forms from sub-basins and sources do not exist.An important strength of our study is that we developed five different scenarios to analyse the future
for Lake Dianchi. The lake has been eutrophic for over decades, and many studies tried to understandthe causes and the consequences of the nutrient pollution. However, most of these studies are limitedto analyses of past and current trends, and do not explicitly model future trends. National and localgovernments have invested considerably to improve water quality. However, the effects of the pro-posed and implemented environmental policies are not always well understood. Several existingstudies discussed control measures for eutrophication (Wang 2002; Liu et al. 2012), but not at thesub-basin scale and not for different nutrient forms for 2050. We explore several future scenariosfor river export of nutrients to Lake Dianchi. We focus, in particular, on effects of the environmentalpolicies and advanced wastewater treatment to reduce nutrient pollution in the lake. We show poss-ible effects of the current policies for agriculture (e.g., Zero Growth in Synthetic Fertilizers by 2020)and mining. These current policies are promising and are expected to reduce future river pollutioncompared to the SSP3 scenario. However, this may not be enough to avoid eutrophication in 2050.
aponline.com/bgs/article-pdf/2/1/73/868277/bgs0020073.pdfty & Research – Library user

Blue-Green Systems Vol 2 No 186 doi: 10.2166/bgs.2020.923
Downloaded from http://iwby Wageningen Universion 29 September 2021
We argue that more effort might be needed in reducing both agricultural and urbanization related pol-lution. Our study may serve as an inspiration for further research on future trends.
Limitations of our study
Our study also has four main limitations. First, we may not include all existing environmental policiesand technologies. Policies are often generic without explicit targets. Plenty of technologies exist andtheir nutrient removal efficiencies vary greatly (Oller et al. 2011; Foged et al. 2012; Jie et al. 2017).Local conditions (e.g., the capacity and the maintenance of the wastewater treatment plants) caninfluence the removal efficiencies. However, we believe that we considered most relevant environ-mental policies and accounted for most recent advanced technologies that are relevant for thestudy area.Second, the MARINA-Lakes model has uncertainties. The sources of the uncertainties are largely
associated with model inputs and parameters. For example, some model parameters (e.g., fractions ofmanure discharges) are generic for all sub-basins and based on expert knowledge and some literature.MARINA-Lakes has recently been implemented for Lake Dianchi for the year 2012 (Li et al. 2019).The model has been validated against observations for nutrients in the lake. Validation results arepromising and indicate that the model can be used to analyse river export of nutrients to Dianchi(Li et al. 2019). We implemented the existing MARINA-Lakes model (Li et al. 2019) for 2050.Third, a few sources might be missing in the MARINA-Lakes model. These include, for example,
direct atmospheric N and P deposition on the lake. We account for atmospheric N deposition onland, but not on the lake water. Atmospheric deposition of N and P on water can potentially be alarge source of nutrients in coastal water systems (Jassby et al. 1994; Paerl et al. 2002). However,atmospheric N and P deposition on the lake may not be a primary pollution source. However, thisneeds more investigation (Ren et al. 2019).Fourth, future trends are uncertain. We developed five scenarios that have the same socio-economic
development, but differ in nutrient management in agriculture, cities and mining. Socio-economicdevelopment is based on the existing SSP3 scenario (O’Neill et al. 2014; Fujimori et al. 2017; Riahiet al. 2017). For nutrient management, we interpreted relevant policies based on literature andexpert knowledge. We assumed the full implementation of the policies and advanced technologiesfor wastewater treatment plants in all sub-basins in our OPT scenario. Such combinations of policiesand the best technologies are simplified in the MARINA-Lakes model. In reality there may be syner-gies and conflicts that affect reduction options for different nutrient forms. One synergy could be thatthe recycling of animal manure leads to even more reductions in synthetic fertilizers than assumed inour IAM scenario, and thus fewer nutrients will be exported to rivers. Conflicts might happen whenthe implementation of advanced wastewater treatment technologies requires additional financial sup-port on top of other management options (e.g., in our AT scenario). Implementing policies andadvanced technologies in our optimistic scenario might, thus, be challenging. However, China hasbeen developing fast over past decades, opening an opportunity for further implementation of theeffective environmental policies and technologies. We quantify the technical feasibility of implement-ing solutions. Future research may focus on the political, societal and economic feasibility.
Implications for policies to reduce future eutrophication
Our study shows that it will be difficult to reduce coastal eutrophication in the future, even under theOPT scenario. We compare our quantified nutrient loadings to Lake Dianchi in 2050 with the criticalnutrient loadings in 2012 (Li et al. 2019). These critical nutrient loadings are the levels of nutrientsbelow which eutrophication may not occur. The critical nutrient loadings were quantified using thelake ecosystem model (PCLake) (Janse et al. 2008) and take into account the nutrient cycling in
aponline.com/bgs/article-pdf/2/1/73/868277/bgs0020073.pdfty & Research – Library user
Blue-Green Systems Vol 2 No 187 doi: 10.2166/bgs.2020.923
Downloaded from http://iwby Wageningen Universion 29 September 2021
the lake and the food web (Li et al. 2019). For the northern part of Dianchi (Caohai sub-basin), thesecritical nutrient loadings are quantified at 3.06 mg N/m2/day and 0.34 mg P/m2/day in (Li et al.2019). For the southern part of the lake (other 14 sub-basins), the critical nutrient loadings are quan-tified at 3.42 mg N/m2/d and 0.38 mg P/m2/d. We convert projected nutrient loadings for the year2050 from kton/year to mg/m2/d using the surface area of the lake. We compare the N and P quan-tified in the OPT scenario to the critical loadings. Our comparison shows that the projected N and Ploadings exceed their critical loadings by a factor of 27 for N and 25 for P for the northern part of thelake. For the southern part, this exceedance is a factor of 10 for N and 17 for P. It seems that theseexceedances are high. However, they are much lower compared to the exceedance between the nutri-ent loadings in 2012 and the critical nutrient loadings (a factor of 17–82 depending on nutrients andlake part) (Li et al. 2019).Our study indicates that advanced wastewater treatment technologies, improved nutrient manage-
ment in agriculture and banned mining can help to reduce the gap between the projected nutrientloadings and their critical loadings in the lake (OPT scenario). This is a right direction towards redu-cing future eutrophication. However, more efforts are needed to avoid eutrophication in 2050. Forexample, more reductions are needed in the use of synthetic fertilizers than assumed in the OPT scen-ario. Decentralized wastewater treatment with high nutrient removal efficiencies for rural areas mayhelp to avoid nutrient losses to rivers. We argue that there is a need to focus on circular-oriented man-agement options (e.g., recover and recycle nutrients from waste). Furthermore, controlling internalrelease of nutrients from lake sediments is also needed. For example, studies show that a gypsum-based technique or the use of alum can prevent phosphorous releases from lake sediments (Varjoet al. 2003; Steinman et al. 2004). Besides, wetlands or buffer zones around the water systems canprevent nutrient releases to rivers and thus to Lake Dianchi (Yin & Lan 1995; Borin et al. 2001; Cov-eney et al. 2002). Efficient use of water from the lake and implementation of water-saving techniquescan save water and reduce domestic water use (Xia et al. 2007).
CONCLUSIONS
In this study, we analysed the effects of environmental policies and technologies to reduce river exportof nutrients to Lake Dianchi in 2050. SSP3 (Shared Socio-economic Pathway 3) is used to reflect aworst-case situation. Four alternative scenarios are developed relative to SSP3. The first alternativescenario assumes the implementation of the current environmental policies in agriculture andsewage (CP). The second and third alternative scenarios assume the implementation of advancedtechnologies to treat wastewater (AT) and improved nutrient management in agriculture andmining (IAM), respectively. The fourth alternative scenario (OPT) combines AT and IAM.River export of nutrients is projected to increase 1.4–4.4 times between 2012 and 2050 according to
SSP3. In general, agriculture is projected to be an important source of DIN (synthetic fertilizers) andDOP (direct discharges of manure) in rivers of the middle and southern sub-basins. Mining is pro-jected to contribute to DIP in the southern rivers. Sewage systems are projected to contribute toDIN, DON, DIP and DOP in rivers of the northern sub-basins in SSP3. Northern sub-basins(especially Daqing and Caohai) are more polluted because of the high urbanization and high popu-lation density. In contrast, middle and southern sub-basins suffer from intensive agriculturalactivities. Mining occurs within individual sub-basins in the south.Current policies may reduce river export of nutrients to the lake by 2050 compared to SSP3 (the CP
scenario). However, this may not be enough to avoid coastal eutrophication in the future. The AT andIAM scenarios project lower river export of nutrients than in SSP3, but reduction effects differ largelyamong nutrient forms. River export of nutrients is expected to be below the level of 2012 in an opti-mistic scenario (OPT). This is because this scenario combines advanced wastewater treatment (AT),
aponline.com/bgs/article-pdf/2/1/73/868277/bgs0020073.pdfty & Research – Library user

Blue-Green Systems Vol 2 No 188 doi: 10.2166/bgs.2020.923
Downloaded from http://iwby Wageningen Universion 29 September 2021
improved nutrient management in agriculture and banned mining (IAM). However, even under theseoptimistic assumptions, eutrophication will be difficult to completely avoid. This is because the pro-jected nutrient inputs in 2050 exceed their critical loadings. This exceedance is, however, muchlower than for 2012. Our results indicate that more efforts are needed in reducing both agriculturaland urbanization related nutrient pollution to avoid eutrophication of Lake Dianchi in the future. Cir-cular-oriented management options such as recover and recycle nutrients from waste could help toavoid nutrient losses to rivers. Controlling internal nutrient loadings from lake sediments may alsobe important in combination with the other policies.Insights of our study can support the formulation of management options to reduce future pollution
of the lake. For example, improving treatment is important to reduce pollution from the northern sub-basins whereas improving nutrient management in agriculture may be important to reduce pollutionfrom the middle and southern sub-basins. Our study can serve as an example for other lakes experi-encing similar environmental problems.
SUPPLEMENTARY MATERIAL
The Supplementary Material for this paper is available at https://dx.doi.org/10.2166/bgs.2020.923.
REFERENCES
Beusen, A., Van Beek, L., Bouwman, L., Mogollón, J. & Middelburg, J. 2015 Coupling global models for hydrology and nutrientloading to simulate nitrogen and phosphorus retention in surface water–description of IMAGE–GNM and analysis ofperformance. Geoscientific Model Development 8 (12), 4045–4067.
Borin, M., Bonaiti, G. & Giardini, L. 2001 Controlled drainage and wetlands to reduce agricultural pollution. Journal ofEnvironmental Quality 30 (4), 1330–1340.
Chen, Y. D. 2013云南统计年鉴 (Yunnan Statistical Yearbook). Yunnan Bureau of Statistics, Yunnan Province, China. Availablefrom: http://www.stats.yn.gov.cn/tjsj/tjnj/201901/t20190121_834601.html.
Chen, J.-n., Zhang, T.-z. & Du, P.-f. 2002 Assessment of water pollution control strategies: a case study for the Dianchi Lake.Journal of Environmental Sciences 14 (1), 76–78.
Cheng, W., Shi, J., Xia, Y. & Zhang, N. 2008 Farmland runoff of nitrogen and phosphorus in Dianchi watershed. Journal of Soiland Water Conservation 5, 52–55.
Coveney, M., Stites, D., Lowe, E., Battoe, L. & Conrow, R. 2002 Nutrient removal from eutrophic lake water by wetlandfiltration. Ecological Engineering 19 (2), 141–159.
Cuaresma, J. C. 2017 Income projections for climate change research: a framework based on human capital dynamics. GlobalEnvironmental Change 42, 226–236.
Foged, H., Flotats Ripoll, X., Bonmatí Blasi, A., Palatsi Civit, J., Magrí Aloy, A. & Schelde, K. M. 2012 Inventory of ManureProcessing Activities in Europe.
Fujimori, S., Hasegawa, T., Masui, T., Takahashi, K., Herran, D. S., Dai, H., Hijioka, Y. & Kainuma, M. 2017 SSP3: AIMimplementation of shared socioeconomic pathways. Global Environmental Change 42, 268–283.
Gao, W., Howarth, R., Hong, B., Swaney, D. & Guo, H. 2014 Estimating net anthropogenic nitrogen inputs (NANI) in the LakeDianchi basin of China. Biogeosciences, 11,16(2014-08-28), 11 (3), 4577–4586.
Gao, W., Howarth, R. W., Swaney, D. P., Hong, B. & Guo, H. C. 2015 Enhanced N input to Lake Dianchi Basin from 1980 to2010: drivers and consequences. Science of the Total Environment 505, 376–384.
Goodkind, D. 2017 The astonishing population averted by China’s birth restrictions: estimates, nightmares, and reprogrammedambitions. Demography 54 (4), 1375–1400.
Gu, L.-p., Huang, B., Zhao, S.-m., Yang, X.-x. & Pan, X.-j. 2016 Twenty-eight polychlorinated biphenyls in surface sediments ofDianchi Lake and its Estuaries, China. Journal of Water and Environment Technology 14 (3), 115–124.
Huang, C., Wang, X., Yang, H., Li, Y., Wang, Y., Chen, X. & Xu, L. 2014 Satellite data regarding the eutrophication response tohuman activities in the plateau lake Dianchi in China from 1974 to 2009. Science of the Total Environment 485, 1–11.
Janse, J. H., Domis, L. N. D. S., Scheffer, M., Lijklema, L., Van Liere, L., Klinge, M. & Mooij, W. M. 2008 Critical phosphorusloading of different types of shallow lakes and the consequences for management estimated with the ecosystem modelPCLake. Limnologica-Ecology and Management of Inland Waters 38 (3–4), 203–219.
Jassby, A. D., Reuter, J. E., Axler, R. P., Goldman, C. R. & Hackley, S. H. 1994 Atmospheric deposition of nitrogen andphosphorus in the annual nutrient load of Lake Tahoe (California-Nevada). Water Resources Research 30 (7), 2207–2216.
aponline.com/bgs/article-pdf/2/1/73/868277/bgs0020073.pdfty & Research – Library user
Blue-Green Systems Vol 2 No 189 doi: 10.2166/bgs.2020.923
Downloaded from http://iwby Wageningen Universion 29 September 2021
Jie, Y., Buisonjé, F. & Melse, R. 2017 Livestock Manure Treatment Technology of the Netherlands and Situation of China: WhitePaper.
Jin, X. 2003 Experience and lessons learned brief for Lake Dianchi. Environmental Science 1, 1–36.KGO 2017 关于滇池流域和西山重点保护区域采石采砂点关停和治理修复的通知 (Notice on Closure, Management and
Restoration of Stone and Sand Quarries in Lake Dianchi Valley and Xishan Key Protected Areas). Kunming GovernmentOffice, Kunming City, Yunnan Province, China. Available from: http://xs.km.gov.cn/c/2017-08-02/1890300.shtml.
KLDA 2013 云南省滇池保护条例 (Lake Dianchi Protection Regulations in Yunnan Province). Kunming Lake DianchiAuthority, Kunming City, Yunnan Province, China. Available from: http://dgj.km.gov.cn/c/2013-03-06/1514732.shtml.
Kong, W., Rao, W., Wang, C., Peng, M., Dong, L., Yang, S., Luo, T. & Li, Q. 2012 基于PSR 模型的滇池流域农村生活污水空间分
布特征和控制研究 (Spatial distribution characteristics and control of rural domestic sewage in Lake Dianchi sub-basinbased on PSR model). 农业环境科学学报 31 (7), 1393–1403.
KPGOYP 2008 滇池流域 ‘五矿区’ 重点区域植被恢复指导意见 (Guiding Opinions on Vegetation Restoration in Key Areas of the‘Five Mining Areas’ in Dianchi Watershed). Kunming People’s Government of Yunnan province, Kunming City, YunnanProvince, China. Available from: http://www.meiyiolive.com/article.asp?id=263.
Lewis, G. N., Auer, M. T., Xiang, X. & Penn, M. R. 2007 Modeling phosphorus flux in the sediments of Onondaga Lake: insightson the timing of lake response and recovery. Ecological Modelling 209 (2–4), 121–135.
Li, X., Janssen, A. B., de Klein, J. J., Kroeze, C., Strokal, M., Ma, L. & Zheng, Y. 2019 Modeling nutrients in Lake Dianchi(China) and its watershed. Agricultural Water Management 212, 48–59.
Liu, P. 2017 Simulation on Agricultural Non-Point Source Pollution Under Different Fertilization Scenarios in Lake DianchiBasin Based on SWAT Model 基于SWAT 模型的滇池流域不同施肥情景下农业非点源污染模拟研究. Doctoral dissertation,Yunan Normal University.
Liu, W. & Qiu, R. 2007 Water eutrophication in China and the combating strategies. Journal of Chemical Technology &Biotechnology: International Research in Process, Environmental & Clean Technology 82 (9), 781–786.
Liu, X. & Wang, H. 2016 Dianchi Lake, China: geological formation, causes of eutrophication and recent restoration efforts.Aquatic Ecosystem Health & Management 19 (1), 40–48.
Liu, Y., Chen, J. & Mol, A. P. 2004 Evaluation of phosphorus flows in the Dianchi watershed, Southwest of China. Populationand Environment 25 (6), 637–656.
Liu, Y., Liu, R. & Li, H. 2007 ICEAS 工艺脱磷除氮的影响因素 (Influence factors of phosphorus and nitrogen removal ofICEAS). 水处理技术 33 (4), 57–59.
Liu, Z., Liu, X., He, B., Nie, J., Peng, J. & Zhao, L. 2009 Spatio-temporal change of water chemical elements in Lake Dianchi,China. Water and Environment Journal 23 (3), 235–244.
Liu, Y., Yang, P. & Sheng, H. 2012 Watershed pollution prevention planning and eutrophication control strategy for LakeDianchi. Huanjing Kexue Xuebao 32 (8), 1962–1972.
Ma, L., Ma, W., Velthof, G., Wang, F., Qin, W., Zhang, F. & Oenema, O. 2010 Modeling nutrient flows in the food chain ofChina. Journal of Environmental Quality 39 (4), 1279–1289.
Mayorga, E., Seitzinger, S. P., Harrison, J. A., Dumont, E., Beusen, A. H., Bouwman, A., Fekete, B. M., Kroeze, C. & Van Drecht,G. 2010 Global nutrient export from WaterSheds 2 (NEWS 2): model development and implementation. EnvironmentalModelling & Software 25 (7), 837–853.
MOA 2015到 2020年化肥使用量零增长行动方案 (Zero Growth in Synthetic Fertilizer Use After 2020). Ministry of Agriculture ofthe People’s Republic of China, Beijing, China. Available from: http://jiuban.moa.gov.cn/zwllm/tzgg/tz/201503/t20150318_4444765.htm.
Oller, I., Malato, S. & Sánchez-Pérez, J. 2011 Combination of advanced oxidation processes and biological treatments forwastewater decontamination – a review. Science of the Total Environment 409 (20), 4141–4166.
O’Neill, B. C., Kriegler, E., Riahi, K., Ebi, K. L., Hallegatte, S., Carter, T. R., Mathur, R. & van Vuuren, D. P. 2014 A newscenario framework for climate change research: the concept of shared socioeconomic pathways. Climatic Change 122 (3),387–400.
Paerl, H. W., Dennis, R. L. &Whitall, D. R. 2002 Atmospheric deposition of nitrogen: implications for nutrient over-enrichmentof coastal waters. Estuaries 25 (4), 677–693.
Parton, W. J., Hartman, M., Ojima, D. & Schimel, D. 1998 DAYCENT and its land surface submodel: description and testing.Global and Planetary Change 19 (1–4), 35–48.
Pinckney, J. L., Paerl, H. W., Tester, P. & Richardson, T. L. 2001 The role of nutrient loading and eutrophication in estuarineecology. Environmental Health Perspectives 109 (suppl. 5), 699–706.
Qian, W. B., Zhang, L., Wang, S. R., Cao, C. C., Yan-Ping, L. I., Cheng, J., Yang, J. C. & Wen-Zhang, L. I. 2016 Compositionalcharacteristics of sediment dissolved organic nitrogen in typical lakes and its relationship on water trophic status.Spectroscopy & Spectral Analysis 36 (11), 3608–3614.
Ren, J., Jia, H., Jiao, L., Wang, Y., Yang, S., Wu, Q., Gao, Q., Cui, Z. & Hao, Z. 2019 Characteristics of nitrogen and phosphorusformation in atmospheric deposition in Dianchi Lake and their contributions to lake loading. Huan jing ke xue=Huanjingkexue 40 (2), 582–589.
Riahi, K., Van Vuuren, D. P., Kriegler, E., Edmonds, J., O’neill, B. C., Fujimori, S., Bauer, N., Calvin, K., Dellink, R. & Fricko, O.2017 The shared socioeconomic pathways and their energy, land use, and greenhouse gas emissions implications: anoverview. Global Environmental Change 42, 153–168.
aponline.com/bgs/article-pdf/2/1/73/868277/bgs0020073.pdfty & Research – Library user
Blue-Green Systems Vol 2 No 190 doi: 10.2166/bgs.2020.923
Downloaded from http://iwby Wageningen Universion 29 September 2021
Samir, K. & Lutz, W. 2017 The human core of the shared socioeconomic pathways: population scenarios by age, sex and levelof education for all countries to 2100. Global Environmental Change 42, 181–192.
Seitzinger, S., Mayorga, E., Bouwman, A., Kroeze, C., Beusen, A., Billen, G., Van Drecht, G., Dumont, E., Fekete, B. & Garnier,J. 2010 Global river nutrient export: a scenario analysis of past and future trends. Global Biogeochemical Cycles 24 (4),1–16.
Steinman, A., Rediske, R. & Reddy, K. R. 2004 The reduction of internal phosphorus loading using alum in Spring Lake,Michigan. Journal of Environmental Quality 33 (6), 2040–2048.
Strokal, M., Kroeze, C., Wang, M., Bai, Z. & Ma, L. 2016 The MARINA model (Model to assess river inputs of nutrients toseAs): model description and results for China. Science of the Total Environment 562, 869–888.
Tang, C., Duan, C., Yu, C., Song, Y., Chai, L., Xiao, R., Wei, Z. & Min, X. 2017 Removal of nitrogen from wastewaters byanaerobic ammonium oxidation (ANAMMOX) using granules in upflow reactors. Environmental Chemistry Letters 15 (2),311–328.
Tong, Y., Zhang, W., Wang, X., Couture, R.-M., Larssen, T., Zhao, Y., Li, J., Liang, H., Liu, X. & Bu, X. 2017 Decline in Chineselake phosphorus concentration accompanied by shift in sources since 2006. Nature Geoscience 10 (7), 507.
Varjo, E., Liikanen, A., Salonen, V.-P. & Martikainen, P. J. 2003 A new gypsum-based technique to reduce methane andphophorus release from sediments of eutrophied lakes::(Gypsum treatment to reduce internal loading). Water Research37 (1), 1–10.
Wang, R. 2002 滇池水体富营养化特征分析及控制对策探讨 (Analysis of the eutrophication characteristics and the controlstrategy of the Lake Dianchi). 地理科学进展 21 (5), 500–506.
Wang, Y., Tanaka, T. S., Li, K. & Inamura, T. 2016 Decreasing input–output balance by reducing chemical fertilizer inputwithout yield loss in intensive cropping system in the Coastal Area of southeast Lake Dianchi, Yunnan Province, China.Plant Production Science 19 (1), 81–90.
Wang, M., Kroeze, C., Strokal, M. & Ma, L. 2017 Reactive nitrogen losses from China’s food system for the sharedsocioeconomic pathways (SSPs). Science of the Total Environment 605, 884–893.
Wenten, I. 2016 Reverse osmosis applications: prospect and challenges. Desalination 391, 112–125.Xia, J., Zhang, L., Liu, C. & Yu, J. 2007 Towards better water security in North China. Water Resources Management 21 (1),
233–247.Xu, W., Luo, X., Pan, Y., Zhang, L., Tang, A., Shen, J., Zhang, Y., Li, K., Wu, Q. & Yang, D. 2015 Quantifying atmospheric
nitrogen deposition through a nationwide monitoring network across China. Atmospheric Chemistry and Physics 15 (21),12345–12360.
Yin, C. & Lan, Z. 1995 The nutrient retention by ecotone wetlands and their modification for Baiyangdian Lake restoration.Water Science and Technology 32 (3), 159–167.
Zhang, J. 2017 The evolution of China’s one-child policy and its effects on family outcomes. Journal of Economic Perspectives31 (1), 141–160.
Zhang, D., Tang, L., Chen, Y., Zhu, Y., Yang, Y. & Zhu, Z. 2007 滇池流域典型城郊村镇排放污水氮, 磷特征分析 (Characteristicsof Nitrogen and Phosphorus in Typical Suburban Villages and Towns in Lake Dianchi sub-Basins).
Zhang, H. M., Zhang, J. & Xiao, J. N. 2008 Study of denitrification phosphorus removal in A∼ 2O-MBR. Journal of DalianUniversity of Technology 48 (4), 490–495.
Zhang, T., Zeng, W., Wang, S. & Ni, Z. 2014 Temporal and spatial changes of water quality and management strategies ofDianchi Lake in southwest China. Hydrology and Earth System Sciences 18 (4), 1493–1502.
Zhou, J., Liu, Y., Guo, H. & He, D. 2014 Combining the SWAT model with sequential uncertainty fitting algorithm forstreamflow prediction and uncertainty analysis for the Lake Dianchi Basin, China.Hydrological Processes 28 (3), 521–533.
Zhou, J., He, D., Xie, Y., Liu, Y., Yang, Y., Sheng, H., Guo, H., Zhao, L. & Zou, R. 2015 Integrated SWAT model and statisticaldownscaling for estimating streamflow response to climate change in the Lake Dianchi watershed, China. StochasticEnvironmental Research and Risk Assessment 29 (4), 1193–1210.
First received 25 May 2019; accepted in revised form 15 October 2019. Available online 2 January 2020
aponline.com/bgs/article-pdf/2/1/73/868277/bgs0020073.pdfty & Research – Library user