Reducing Sugary Drink Consumption: A Public …...Reducing Sugary Drink Consumption: A Public Health Priority December 2013 Christina Goette, MPH Community Health Equity and Promotion
18
Reducing Sugary Drink Consumption: A Public Health Priority December 2013 Christina Goette, MPH Community Health Equity and Promotion
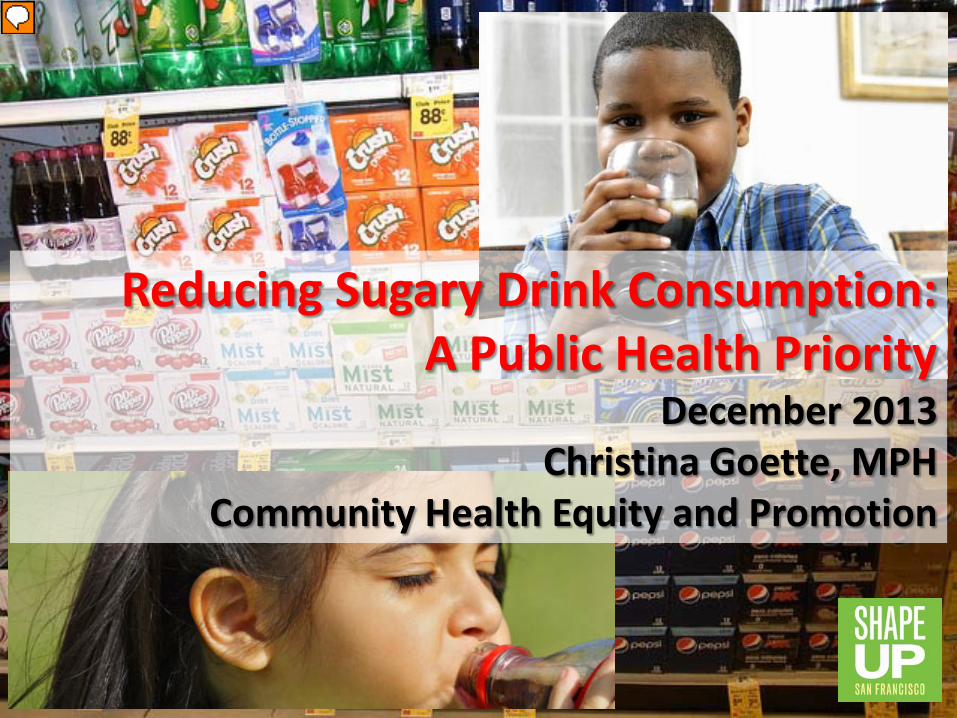
Reducing Sugary Drink Consumption: A Public Health Priority
December 2013 Christina Goette, MPH
Community Health Equity and Promotion
Presenter
Presentation Notes
Here to talk to you today about why we’ve made sugary drinks a priority since 2008 Science Health Industry tactics
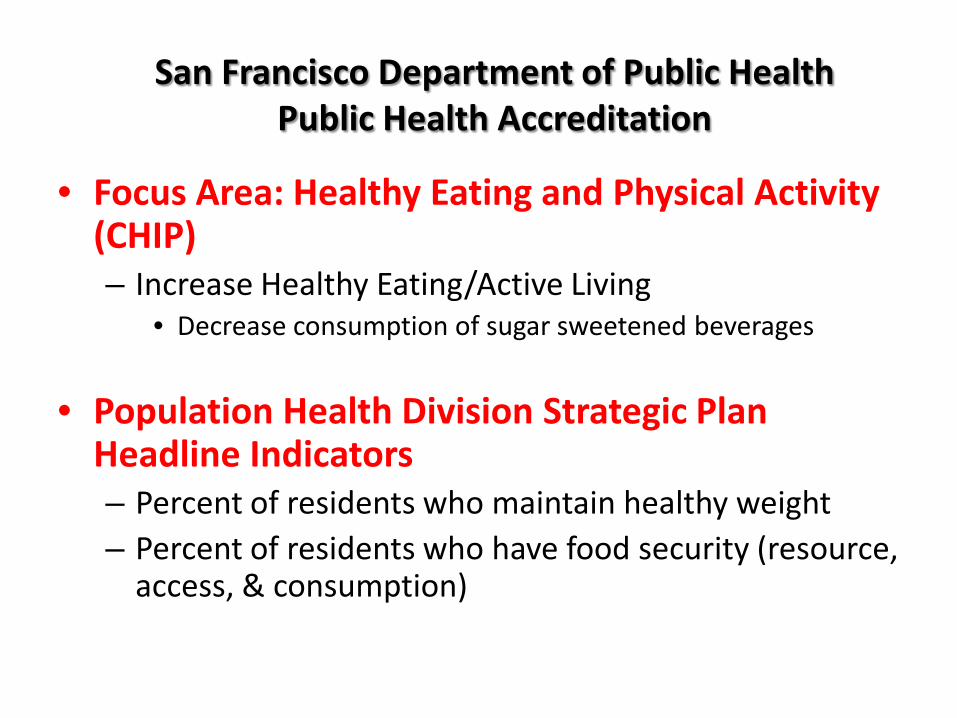
• Focus Area: Healthy Eating and Physical Activity (CHIP) – Increase Healthy Eating/Active Living
• Decrease consumption of sugar sweetened beverages
• Population Health Division Strategic Plan Headline Indicators – Percent of residents who maintain healthy weight – Percent of residents who have food security (resource,
access, & consumption)
San Francisco Department of Public Health Public Health Accreditation
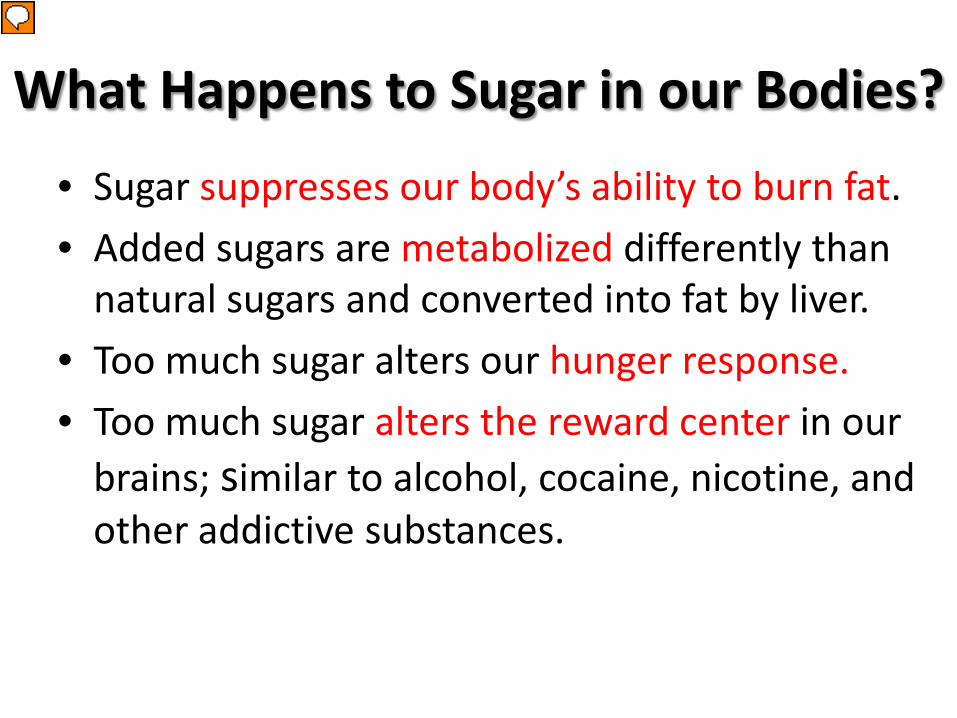
• Sugar suppresses our body’s ability to burn fat.
• Added sugars are metabolized differently than natural sugars and converted into fat by liver.
• Too much sugar alters our hunger response.
• Too much sugar alters the reward center in our brains; similar to alcohol, cocaine, nicotine, and other addictive substances.
What Happens to Sugar in our Bodies?
Presenter
Presentation Notes
The research on how sugar works on our bodies ahs evolved dramatically over the past several years. Our bodies prioritize burning sugar. So when we consume sugar in high quantities, our bodies are busy burning sugar and too busy to metabolize other sources of energy. When sugar is available in the blood, our bodies shift metabolism to burn it. If I have a frapaccino with breakfast (bagel and cream cheese), my body will prioritize burning up the added sugars from the frapaccino before it burns up the fat from my cream cheese or the sugars from the bagel. By lunch time, say I have a soda, burger and fries - again my body will work on burning the added sugars from the soda before metabolizing my food, and it may not have even gotten to metabolizing breakfast. There are 3 main ways our bodies treat ADDED sugar differently from sugar naturally occurring in our food. The first is in the way it is METABOLIZED. When added sugars are consumed in large quantities and quickly (i.e. when we drink it!), it is metabolized by our liver and most of it is converted into fat. O/O as you know is a risk factor for chronic diseases like diabetes. Excessive sugar consumption also impacts our HUNGER RESPONSE. We think we are starving when we are not. Why? The hormone, leptin, which is produced by fat cells, regulates hunger and signals to the brain that we are full. O/O people develop leptin resistance (much like people with type 2 diabetes develop insulin resistance) and their brains doesn’t get the leptin signal and leads to overeating. Sugar also alters the REWARDS CENTER in our brains. Most addictive drugs increase dopamine release in our brains, and sugar is the same. Sugar down regulates the same receptors in the brain as cigarettes, alcohol, and even cocaine. And like these drugs, the more sugar we consume, the greater the tolerance so we crave more sugar but are less satisfied. In fact, there is a well-known study that found that rats preferred sugar water over cocaine. ------------------------------------------- Metabolism - Fructose is metabolized by the liver and converted into fat. Hunger Hormone leptin tells our body when we’re full. Flood of insulin blocks leptin. Rewards - Sugar turns off the same dopamine (pleasure) receptors in the reward center of the brain as alcohol, cocaine, nicotine, and other addictive substances. Metabolism: A calorie is not just a calorie. Our bodies metabolize sugars from food (with fiber, etc)differently than they do added sugars in beverages. All calories are not created equal. Sugar = added sugar. E.g. table white sugar is 50/50 glucose and fructose, High fructose corn syrup is 45%glucose and 55% fructose. Fructose is much sweeter than glucose. Glucose is metabolized by every cell in the body and is needed for energy. Fructose—especially when consumed in larger quantities and consumed quickly (e.g.. Drinking it)-- is metabolized by the liver, is more work for the liver, and the liver converts it mostly to fat. (unless you’re an elite athlete). http://ideas.time.com/2012/12/27/what-you-need-to-know-about-sugar/ Biochemistry: The skinny on obesity: http://www.youtube.com/watch?v=Xn1cI8FNU6M&list=PL39F782316B425249&index=4 Hunger Response: Leptin regulates hunger. It’s a hormone that goes from your fat cells to your brain and tells your brain you’ve had enough to eat and to exercise. It limits what you eat and let’s you exercise because you want to. When you are obese, you have high levels of leptin (because it comes from the fat cell), but our brains aren’t getting the message from leptin and that’s called leptin resistance. Insulin blocks leptin at the brain and we have high levels of insulin due to our industrial global diet—esp added sugar in our food (75% of all formulated foods have added sugars). So, when you don’t get the leptin signal, your brain thinks you are starving. Reward Center: Sugar down regulates the same receptors in the reward center of the brain as does alcohol, cocaine, nicotine and other addictive substances. The brains of obese people are biochemically different than those who are not obese --- want sugar but don’t feel satisfied– craving, tolerance, withdrawal--- “living with an urge you can’t satisfy.” (skinny on obesity) “No one can exert will power over a biochemical drive….” Lustig in the Skinny on Obesity. In one well-known study, sugar water was more preferable/addictive to rats than cocaine. Sweet taste surpassed cocaine (rats) http://www.plosone.org/article/info:doi/10.1371/journal.pone.0000698
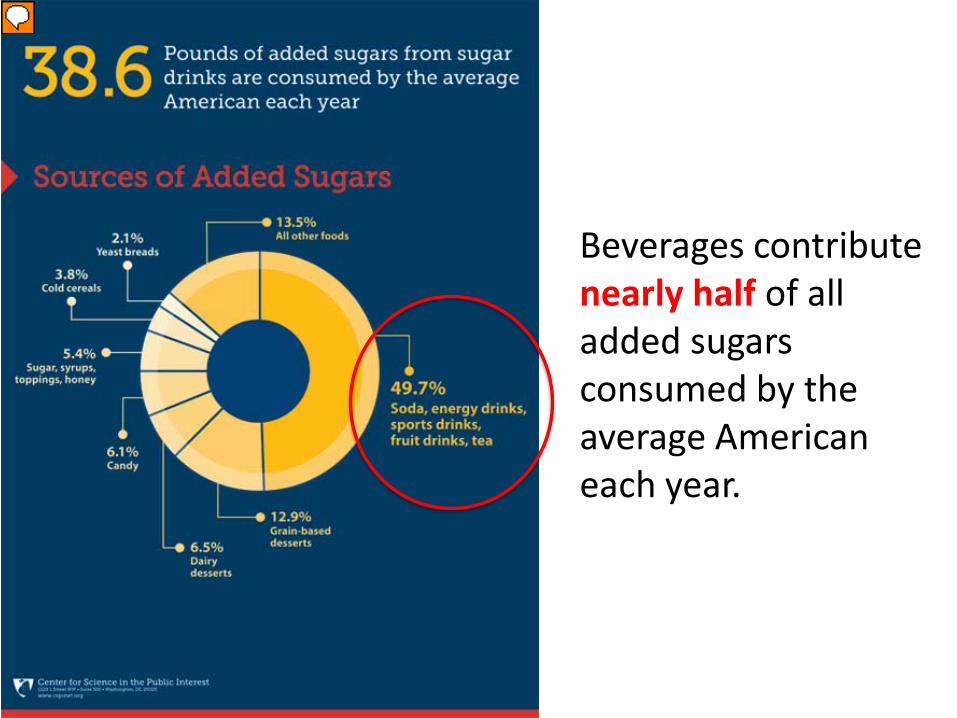
Beverages contribute nearly half of all added sugars consumed by the average American each year.
Presenter
Presentation Notes
Beverages are the single largest source of added sugars in our diets. In fact, the average American consume nearly 40 pounds of added sugars each year from sugary drinks alone.
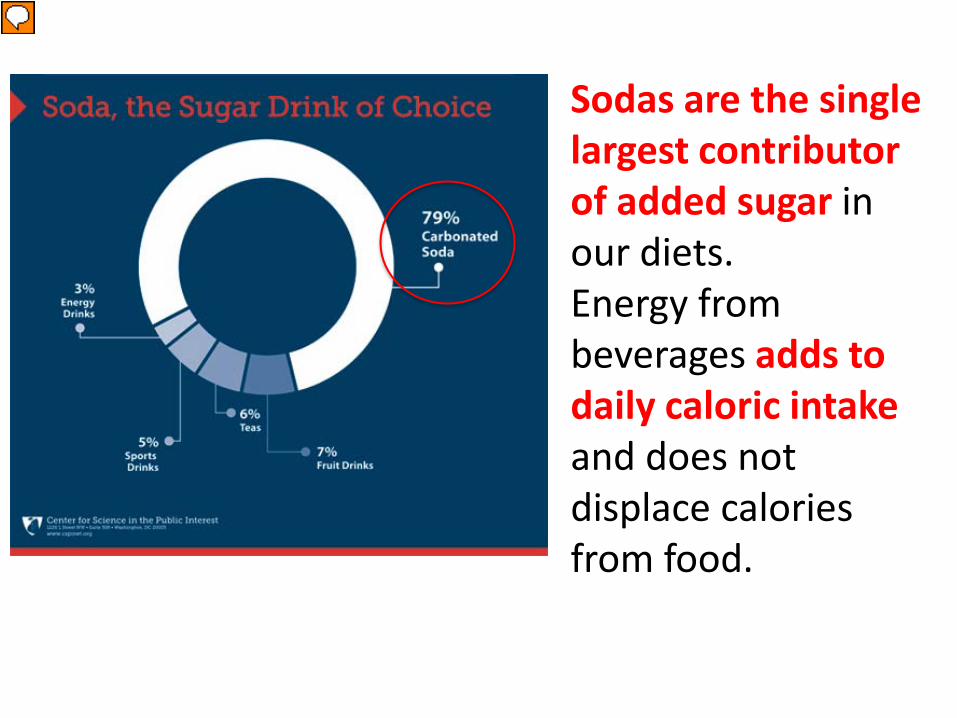
Sodas are the single largest contributor of added sugar in our diets. Energy from beverages adds to daily caloric intake and does not displace calories from food.
Presenter
Presentation Notes
And sodas are the drink of choice. Energy from beverages adds to daily caloric intake and does not displace calories from food. In other words, if I drink this 20 oz bottle of coke, I just added 240 calories to my total caloric intake for the day. Because it doesn’t make me feel full, I won’t eat 240 calories less to compensate, so I’m just increasing my caloric intake. Bodies respond to CSBs differently than water. Act like it’s food. Body focuses first on burning off sugar (bc its like a toxin to the system) and then will work on the fat and other foods. SO if a CSB is consumed at breakfast it may be that the fatty foods from breakfast haven’t yet been processed yet by lunch Daily calories increase with amount of soda consumed. (CSFII 1994; Harnack L., 1999) This is one main reason public health is targeting SSBs.
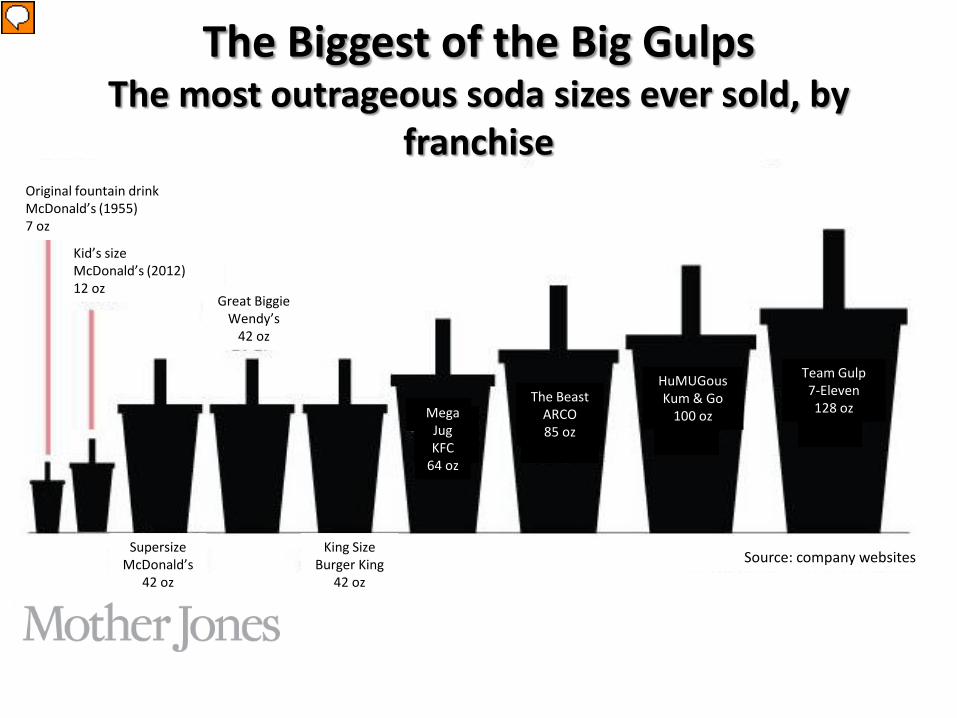
The Biggest of the Big Gulps The most outrageous soda sizes ever sold, by
franchise Original fountain drink McDonald’s (1955) 7 oz
Data sources: National Soft Drink Association, Beverage World (Jacobson, 2001) and Center for Weight and Health, University of California, Berkeley
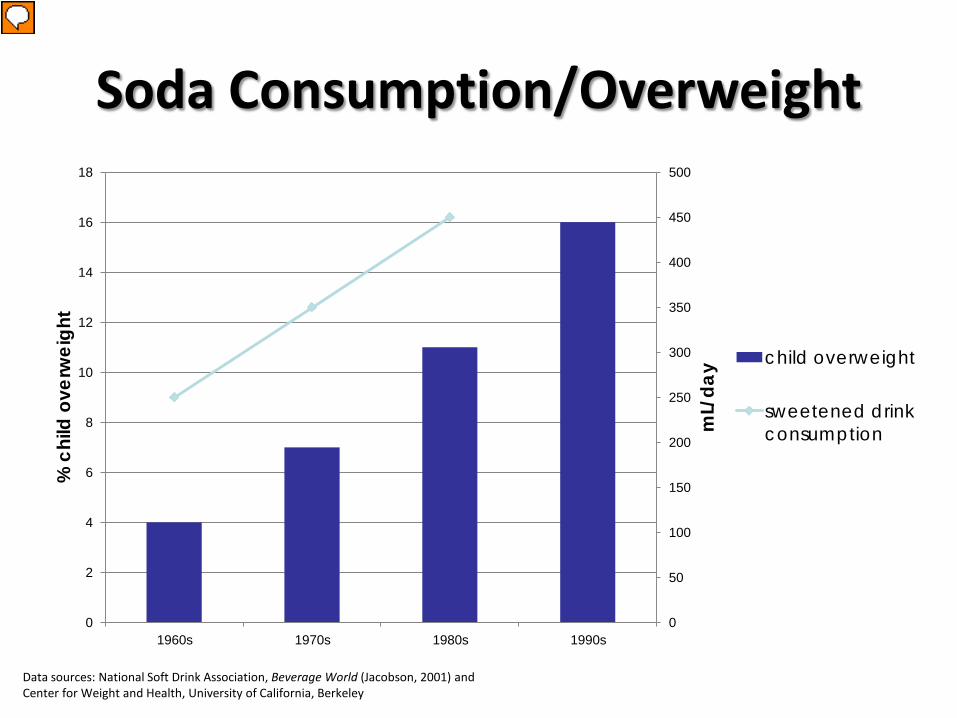
Soda Consumption/Overweight
Presenter
Presentation Notes
This graph illustrates two trends: The bars show the percent of children overweight from the 60’s to the 90s. The blue line shows the mL of sweetened drink consumption per day. As childhood overweight increases, so has sweetened drink consumption. Americans have not always consumed SSBs at this high level. Over the past decade, per capita consumption has increased by nearly 30 percent (2). The dramatic increase in consumption mirrors the increasing prevalence of obesity and diabetes in the United States. (Malik, VS, Schulze, MB and Hu, FB. Intake of sugar--‐sweetened beverages and weight gain: a systematic review. American Journal of Clinical Nutrition, 2006, Vol. 84, pp. 274--‐88.)
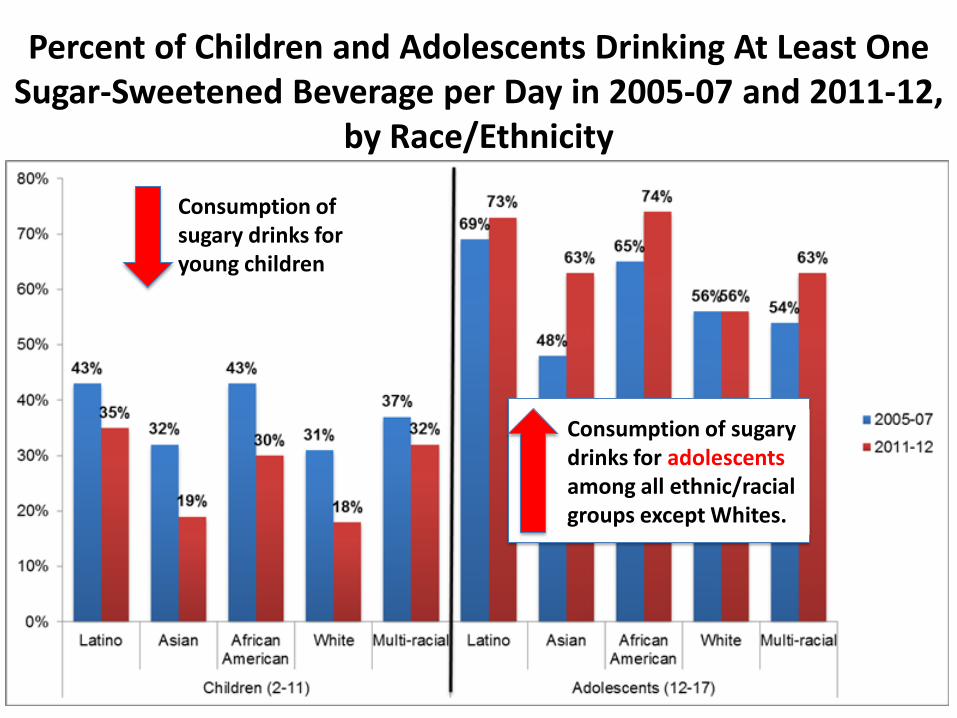
Percent of Children and Adolescents Drinking At Least One Sugar-Sweetened Beverage per Day in 2005-07 and 2011-12,
by Race/Ethnicity
Consumption of sugary drinks for young children
Consumption of sugary drinks for adolescents among all ethnic/racial groups except Whites.
Presenter
Presentation Notes
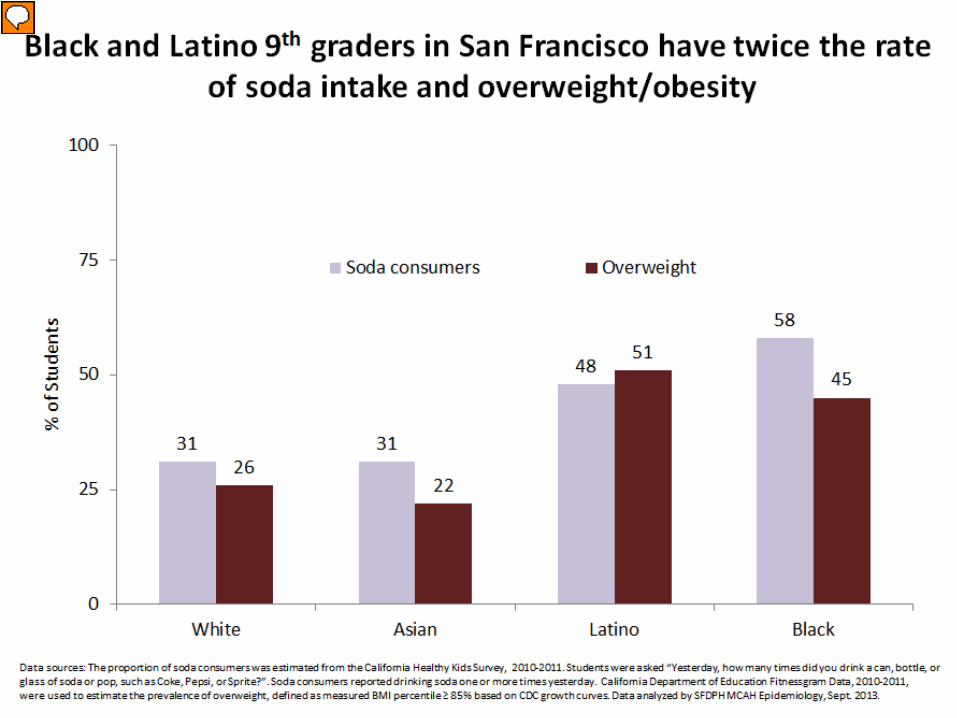
In SF we have disparate health outcomes and we see it starting in youth. This slide shows that AA and L both drink more SSB and are also heavier.
50%
29%
43%
29%
55%
75%
29%
68%
43%
60%
0%
10%
20%
30%
40%
50%
60%
70%
80%
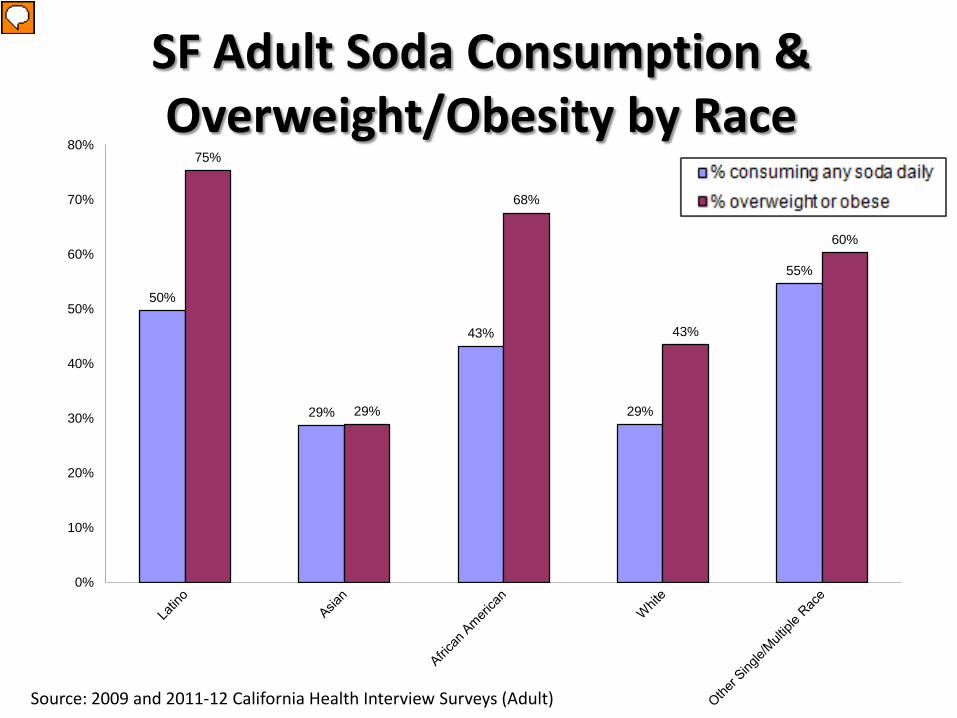
Source: 2009 and 2011-12 California Health Interview Surveys (Adult)
SF Adult Soda Consumption & Overweight/Obesity by Race
Presenter
Presentation Notes
When we look at adult data, the trend continues. Supporting the research that shows that more than half overweight children are likely to be overweight as adults.
Mission
Tenderloin
Visitacion Valley
Excelsior
Bayview
Soda Expenditures, Percent of Total Expenditures, National Rank by Tract (2011)
Presenter
Presentation Notes
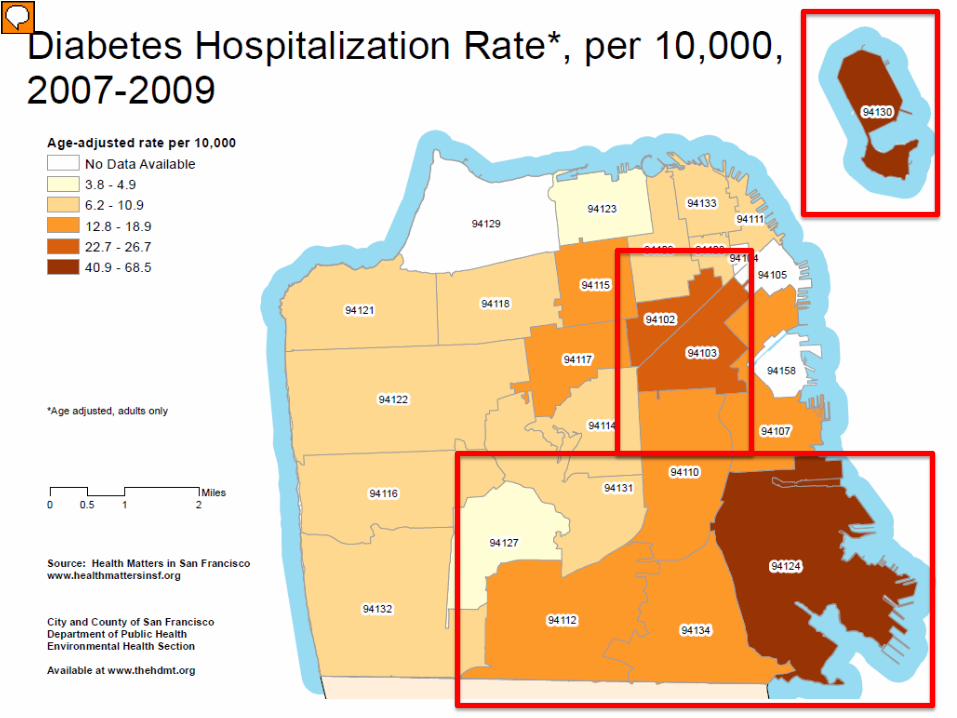
Correlation b/t ssb and diabetes
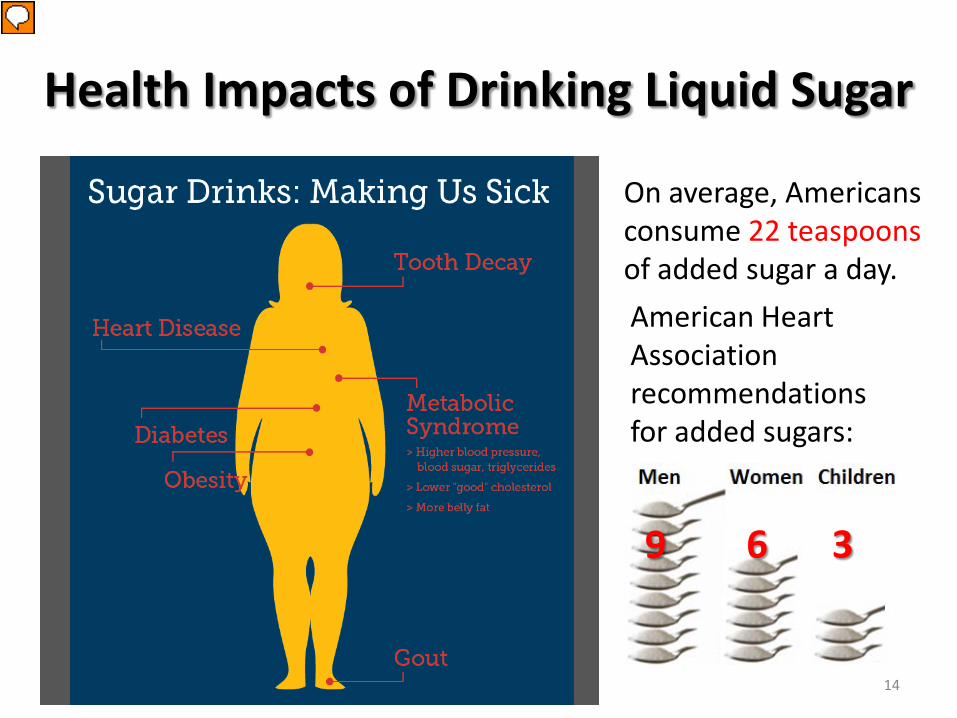
Health Impacts of Drinking Liquid Sugar
14
On average, Americans consume 22 teaspoons of added sugar a day.
American Heart Association recommendations for added sugars:
9 6 3
Presenter
Presentation Notes
There are many health problems from drinking all this liquid sugar. The average American consumes 22 tsp of added sugars a day. FDA currently has NO regulations on sugar however, the American Heart Association recommends no more than 6 teaspoons a day of added sugar for women and no more than 9 teaspoons a day for men. Recent research links SSB to type 2 diabetes. Drinking 1-2 SSB/Day increases risk of type 2 diabetes by over 25%. Obesity epidemic Dental caries and erosion Type 2 diabetes Cardiovascular disease Elevated blood pressure Pancreatic cancer Kidney disease Reduced cognitive functioning Type 2 diabetes and Metabolic Syndrome Compared to non-drinkers, individuals who drink 1–2 sugar-sweetened beverages per day have a 26% higher risk for developing type 2 diabetes and a 20% higher risk of developing metabolic syndrome. Source: Malik VS, Popkin BM, Bray GA, Despres JP, Willett WC, Hu FB. Sugar-sweetened beverages and risk of metabolic syndrome and type 2 diabetes: a meta-analysis. Diabetes Care. Nov 2010;33(11):2477-2483.�Emerging research, looking at added sugar and diabetes rates internationally, is linking added sugar in the food supply independently to diabetes. Source: Basu S, Yoffe P, Hills N, Lustig RH (2013) The Relationship of Sugar to Population-Level Diabetes Prevalence: An Econometric Analysis of Repeated Cross-Sectional Data. PLoS ONE 8(2): e57873. doi:10.1371/journal.pone.0057873 Available at: www.plosone.org/article/info%3Adoi%2F10.1371%2Fjournal.pone.0057873 Heart Disease Women who drink more than 2 servings daily have a 35% higher risk of heart disease. Fung TT, Malik V, Rexrode KM, Manson JE, Willett WC, Hu FB. Sweetened beverage consumption and risk of coronary heart disease in women. Am J Clin Nutr. Apr 2009;89(4):1037-1042. High levels of fat in the blood, liver, and abdominal region, which increase one’s risk for heart disease and diabetes, can develop after very short periods of high sugar-sweetened beverage consumption. After only 2 weeks, young men and women who drink 3 cans of soda daily show a 20% increase in levels of bad cholesterol and triglycerides in the blood. Stanhope KL, Bremer AA, Medici V, et al.Consumption of fructose and high fructose corn syrup increase postprandial triglycerides, LDL-cholesterol, and apolipoprotein-B in young men and women. J Clin Endocrinol Metab. Oct 2011;96(10):E1596-1605. After 6 months, men and women consuming 3 sodas daily display increased cholesterol, visceral fat, and fatty liver .Source: Maersk M, Belza A, Stodkilde-Jorgensen H, et al. Sucrose-sweetened beverages increase fat storage in the liver, muscle, and visceral fat depot: a 6-mo randomized intervention study. Am J Clin Nutr. Feb 2012;95(2):283-289 Additional from Tekeshe’s slides: Elevated blood pressure, Pancreatic cancer, Kidney disease, Reduced cognitive functioning Gout: fructose-sweetened sodas was significantly associated with newly diagnosed gout in the Nurses' Health Study. Fructose, unlike other sugars, increases uric acid levels in the blood. Participants in a 22-year study who reported drinking one sugary soda per day were 74 percent more likely than those who said they drank less than one per month to develop incident gout – an inflammatory condition caused by elevated levels of uric acid in the blood that deposits in the joints – according to Dr. Hyon Choi of Boston University and colleagues. The findings were published in the Journal of the American Medical Association. Looking only at sugar-sweetened cola beverages, participants who drank two or more per day were 97 percent more likely to develop incident gout than those who consumed less than one per month. They noted that, although gout has been a predominantly male disease, it strikes women too, particularly those older than 70.
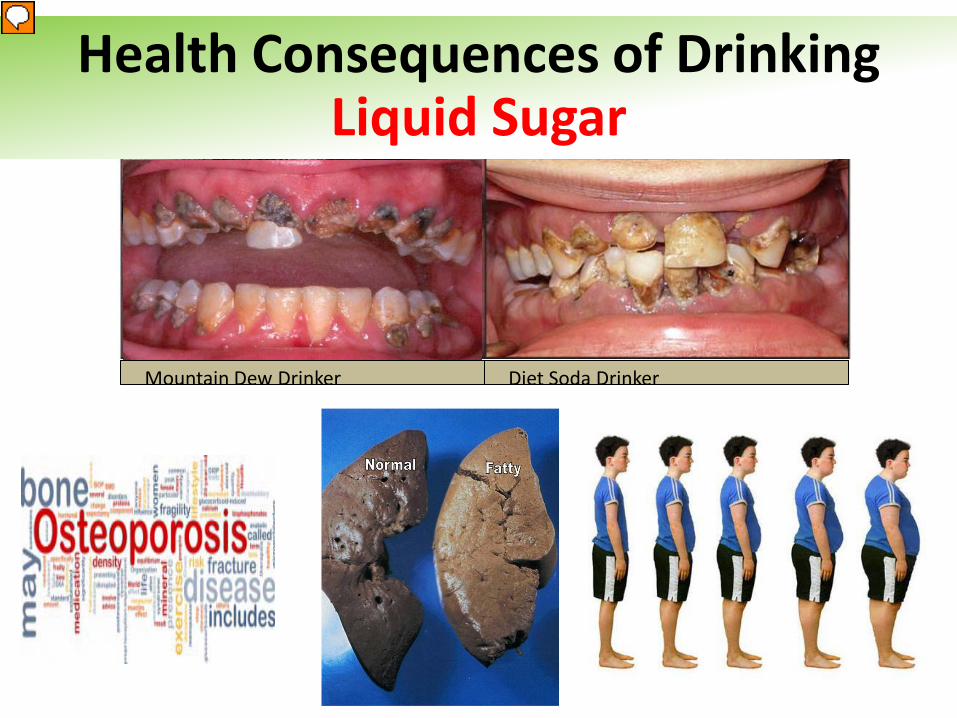
Mountain Dew Drinker Diet Soda Drinker
Health Consequences of Drinking Liquid Sugar
Presenter
Presentation Notes
The main functions of the liver are to process nutrients from food, cleans your blood, makes bile, remove toxins from the body and build proteins. It filters all the fluids you consume, which is why alcohol damages the liver. A growing number of liver transplants performed at UCSF are due to NAFLD! It used to be related to alcohol. OSTEOPOROSIS Double whammy for adolescents and teens – who are among the biggest consumers of sugary drinks: Bone building years for teens Soda displacing healthy drinks, like milk. Teens today drink twice as much soda as milk. 30 years ago, the opposite was true.
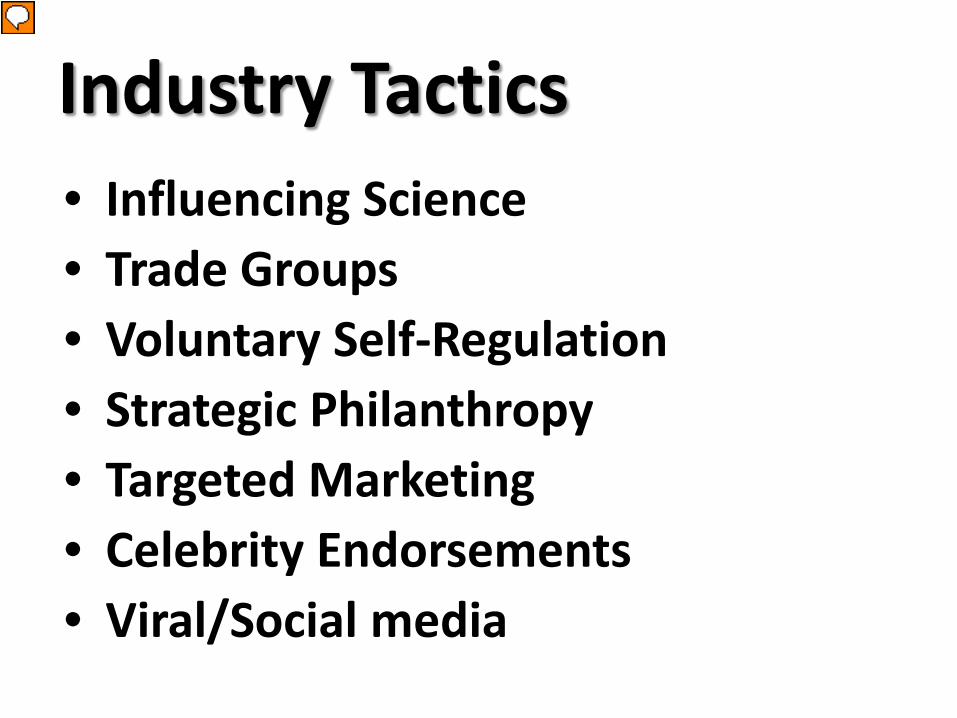
Industry Tactics • Influencing Science • Trade Groups • Voluntary Self-Regulation • Strategic Philanthropy • Targeted Marketing • Celebrity Endorsements • Viral/Social media
Presenter
Presentation Notes
It describes how Big Sugar used Big Tobacco tactics to ensure that government agencies would dismiss the health claims against their products. They did this by developing an award winning marketing campaign and bankrolling researchers to conduct studies that kept the harmful effects of sugar inconclusive. And they were successful... Still today, sugar is on the FDA’s GRAS list. The USDA still uses weak language such as “reduce intake” of sugar despite the growing body of research that links sugar consumption to a variety of chronic diseases including obesity, heart disease, type 2 diabetes... Philanthropy (12 M$ to HEAL funding; 2B$ advertising) Link their brands to health and wellness Create partnerships with respected health and minority Garner public trust and goodwill Court growing minority populations to increase sales and profits Targeted Marketing Black youth saw 80% to 90% more ads compared with white youth. From 2008 to 2010, Hispanic children saw 49% more ads for sugary drinks and energy drinks, and teens saw 99% more ads Hispanic preschoolers saw more ads for Coca-Cola Classic, Kool-Aid, 7 Up and Sunny D than older Hispanic children or Hispanic teens did. Celebrity Endorsements Celebrity Endorsements targeting kids or different ethnicities…
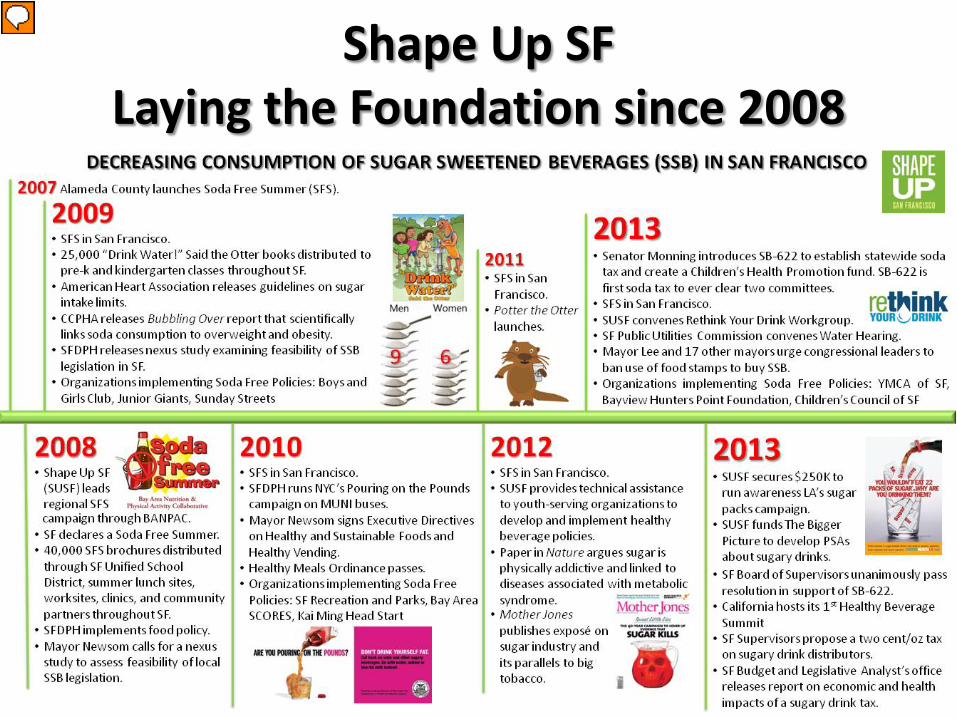
Shape Up SF Laying the Foundation since 2008
Presenter
Presentation Notes
Changing the Beverage Environment in San Francisco Decreasing consumption of SSB has been a priority for Shape Up SF since 2008. Here is a timeline that captures just a snapshot of the building momentum here in SF.
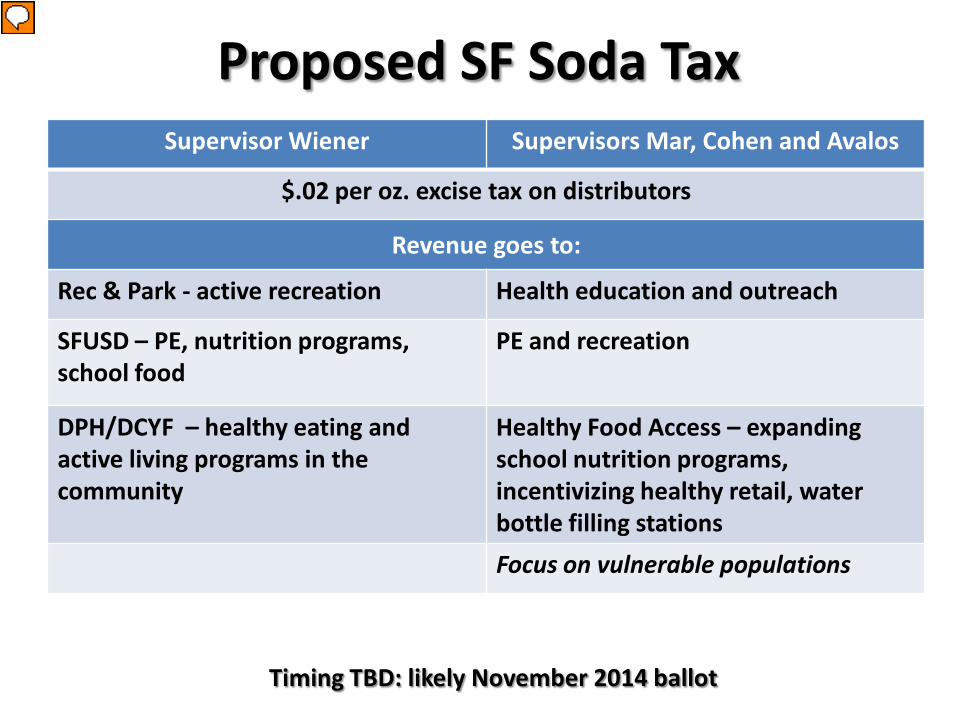
Proposed SF Soda Tax Supervisor Wiener Supervisors Mar, Cohen and Avalos
$.02 per oz. excise tax on distributors
Revenue goes to:
Rec & Park - active recreation Health education and outreach
SFUSD – PE, nutrition programs, school food
PE and recreation
DPH/DCYF – healthy eating and active living programs in the community
Healthy Food Access – expanding school nutrition programs, incentivizing healthy retail, water bottle filling stations
Focus on vulnerable populations
Timing TBD: likely November 2014 ballot
Presenter
Presentation Notes
Are currently collaborating to create a single measure; A single measure will be brought to committee in January Process: Community input? Collaboration between Supervisors? Timing: June or November 2014? How: 2 cents per ounce or ½ cent per gram of sugar? Benefit: Allocation of revenue? Priorities? Structure?