reduction in muscle fibre number during the adaptive radiation of notothenioid fishes
TRANSCRIPT

In teleost fish, postembryonic growth of the myotomalmuscle involves the recruitment and expansion of musclefibres, a process that continues during juvenile and adult stages(Rowlerson and Veggetti, 2001; Johnston, 2001). Initially,muscle fibres are produced from discrete germinal zones bystratified hyperplasia (Rowlerson and Veggetti, 2001). Themajor mechanism for expanding fibre number in most speciesis mosaic hyperplasia, which involves the activation and
proliferation of myogenic precursor cells that are widelyscattered throughout the myotome (Rowlerson et al., 1995;Johnston et al., 1999). Myogenic cells withdraw from the cellcycle and fuse to form myotubes on the surface of existingmuscle fibres (Koumans and Akster, 1995). In each of 10species of freshwater fish that have been studied, mosaichyperplasia was shown to cease at around 44% of themaximum body length, and the final stages of growth were
2595The Journal of Experimental Biology 206, 2595-2609© 2003 The Company of Biologists Ltddoi:10.1242/jeb.00474
The fish fauna of the continental shelf of the SouthernOcean is dominated by a single sub-order of Perciformes,the Notothenioidei, which have unusually large diameterskeletal muscle fibres. We tested the hypothesis that in fastmyotomal muscle a high maximum fibre diameter (FDmax)was related to a reduction in the number of muscle fibrespresent at the end of the recruitment phase of growth. Wealso hypothesized that the maximum fibre number(FNmax) would be negatively related to body size, and thatboth body size and size-corrected FNmax would showphylogenetic signal (tendency for related species toresemble each other). Finally, we estimated ancestralvalues for body size and FNmax. A molecular phylogenywas constructed using 12S mitochondrial rRNAsequences. A total of 16 species were studied from theBeagle Channel, Tierra del Fuego (5–11°C), Shag Rocks,South Georgia (0.5–4°C), and Adelaide Island, AntarcticPeninsula (–1.5 to 0.5°C). The absence of muscle fibres ofless than 10·µm diameter was used as the criterion for thecessation of fibre recruitment. FDmax increased linearlywith standard length (SL), reaching 500–650·µm in mostspecies. Maximum body size was a highly significantpredictor of species variation in FNmax, and both body sizeand size-corrected FNmax showed highly significantphylogenetic signal (P<0.001). Estimates of trait values at
nodes of the maximum likelihood phylogenetic tree wereconsistent with a progressive reduction in fibre numberduring part of the notothenioid radiation, perhaps servingto reduce basal energy requirements to compensate for theadditional energetic costs of antifreeze production. Forexample, FNmax in Chaenocephalus aceratus(12·700±300,mean ± S.E.M., N=18) was only 7.7% of the value foundin Eleginops maclovinus (164·000±4100, N=17), whichreaches a similar maximum length (85·cm).Postembryonic muscle fibre recruitment in teleost fishnormally involves stratified followed by mosaichyperplasia. No evidence for this final phase of growthwas found in two of the most derived families(Channichthyidae and Harpagiferidae). The divergence ofthe notothenioids in Antarctica after the formation of theAntarctic Polar Front and more recent dispersal northwould explain the high maximum diameter and low fibrenumber in the derived sub-Antarctic notothenioids.These characteristics of notothenioids may well restricttheir upper thermal tolerance, particularly forChampsocephalus esoxand similar Channichthyids thatlack respiratory pigments.
Key words: Antarctic teleosts, growth, muscle fibre recruitment,Notothenioid fishes, phylogeny, skeletal muscle.
Summary
Introduction
Reduction in muscle fibre number during the adaptive radiation of notothenioidfishes: a phylogenetic perspective
Ian A. Johnston1,*, Daniel A. Fernández1,†, Jorge Calvo2, Vera L. A. Vieira1, Anthony W. North3,Marguerite Abercromby1 and Theodore Garland, Jr4
1Gatty Marine Laboratory, Division of Environmental and Evolutionary Biology, School of Biology, University of StAndrews, St Andrews, Fife, KY16 8LB, Scotland, UK, 2Centro Austral de Investigaciones Cientificas (CADIC),
Consejo Nacional de Investigaciones Cientificas y Tecnicas (CONICET) CC92, Ushuaia, 9410, Tierra del Fuego,Argentina, 3British Antarctic Survey, High Cross, Madingley Road, Cambridge, CB3 OET, UKand 4Department of
Biology, University of California, Riverside, CA 92521, USA*Author for correspondence (e-mail: [email protected])
†Present address: Biology Department, Wesleyan University, Hall-Atwater and Shanklin Laboratories, Middletown, 06459, CT, USA
Accepted 30 April 2003

2596
entirely supported by fibre hypertrophy (Weatherley et al.,1988). The maximum diameter of each muscle fibre type isrelated to ultimate body size and is probably limited bydiffusional constraints reflecting metabolic demand andtemperature (Archer and Johnston, 1991).
The fish fauna of the continental shelf of the Southern Oceanis dominated by a single sub-order of Perciformes, theNotothenioidei, which comprises at least 125 species dividedinto eight families (Eastman and Eakin, 2000). Several authorshave reported that Antarctic notothenioids have unusuallylarge diameter fibres, which can reach 100·µm in slow muscleand 500·µm in fast muscle (Smialovska and Kilarski, 1981;Dunn et al., 1989; Battram and Johnston, 1991). Slow musclefibres have relatively high densities of mitochondria (Johnston,1987; Archer and Johnston, 1991; O’Brien et al., 2003),reaching 50% of fibre volume in some Channichthyids(haemoglobin-less icefishes) (Johnston, 1989). However,mitochondria are found in the central zone of even the largest-diameter slow fibres (Johnston, 1987; Archer and Johnston,1991), consistent with the maintenance of adequate tissueoxygenation at the low body temperature of these species(Egginton et al., 2002). Fast muscle fibres with diameters of400·µm have also been reported in sub-Antarctic notothenioidsfrom the Beagle Channel, although a relatively restricted sizerange of fish was studied (Fernández et al., 2000).
The ancestral form of the notothenioids is generallyconsidered to have been a temperate bottom-living specieswithout a swim bladder (Eastman, 1993). The success of theradiation of the Antarctic notothenioids has been attributed tothe evolution of glycopeptide and peptide antifreezes, whichenabled them to adjust to the climatic cooling that occurredfollowing the opening of the Drake passage andestablishment of the Antarctic Polar Front (APF) some 20–25million years ago (Cheng and DeVries, 1991; Eastman,1993; Clarke and Johnston, 1996). The Bovichtidae,Pseudaphritidae and Eleginopidae are the most basalnotothenioid families and, except for a single Antarcticspecies of bovichtid, are represented by non-Antarctic specieswith the plesiomorphic condition of lacking antifreezes(Eastman and Eakin, 2000).
Members of six families of notothenioids are found outsidethe Antarctic in the Beagle Channel, Patagonian Shelf, alongthe Pacific Coast of South America and in the sub-Antarcticwaters of New Zealand (Eastman, 1993). One bathypelagicspecies, the Patagonian toothfish Dissostichus eleginoides(Nototheniidae), grows to 2·m total length and occurs on bothsides of the Polar Front, from a latitude of 40°S off the coastsof S. America to 60°S south in the Antarctic. The distributionof D. eleginoidesis circum-Antarctic and its range overlapswith a sister species D. mawsonithat is found around theAntarctic continental shelf (Fisher and Hureau, 1985).Evidence from a molecular phylogeny estimated usingmitochondrial 12S and 16S rRNA DNA sequences suggeststhat many sub-Antarctic species evolved subsequent to themain radiation of the group, as recently as 7–9 million yearsago (Bargelloni et al., 2000; Stankovic et al., 2001).
It has been suggested that the radiation of the Antarcticnotothenioids has been associated with a loss of characters orevolutionary function (disaptation) followed by subsequentadaptive recovery (Montgomery and Clements, 2000). Withinthe notothenioids, the family Channichthyidae (icefishes) isnotable for the loss of haemoglobin, which is thought to haveresulted from a single mutational event that deleted the entireβ-globin gene and the 5′ end of the linked α-globin gene(Cocca et al., 1995). Loss of respiratory pigments is associatedwith a suite of compensatory adaptations in the heart andperipheral circulatory system (Tota et al., 1997). These includea relatively large ventricular muscle mass (Johnston et al.,1993), a high blood volume (Acierno et al., 1995), coupled toa high output cardiac pump operating at low frequencies andpressures (Tota et al., 1997). Six of the 15 species of icefishesalso lack myoglobin in their heart muscle (Moylan and Sidell,2000), involving at least three independent mechanismsincluding a 5-nucleotide insertion leading to prematuretermination in Champsocephalus gunnari, an aberrantpolyadenylation signal in Pagetopsis macropterus(Vayda etal., 1997), and a duplicated TATAAAA sequence thatinterferes with transcription in Chaenocephalus aceratus(Small et al., 2003). Some notothenioids have undergone anecological diversification to feed in the water column involvingchanges in body shape, colour, and the attainment of nearneutral buoyancy through decreased mineralisation of theskeleton and the accumulation of lipids (Eastman, 1993, 1997;Klingenberg and Ekau, 1996). In some cases secondarypelagicism is associated with the retention of larvalcharacteristics into adult stages (Eastman, 1993; Montgomeryand Clements, 2000), The resulting detrimental changes to thelateral line sensory system have been compensated for bychanges in central processing mechanisms and behaviour(Montgomery and Clements, 2000).
The first aim of the present study was to test the hypothesisthat a high maximum fibre diameter in notothenioid fisheswas related to a reduction in the number of muscle fibres atthe end of the recruitment phase of growth (FNmax). We thenused phylogenetically based statistical methods to testwhether fibre number was negatively related to body size andwhether either body size or size-corrected fibre numbershowed significant phylogenetic signal. Finally, we estimatedancestral values for body size and fibre number to explorewhere during the evolutionary radiation reductions in fibrenumber occurred. A total of 16 species of Notothenioideifrom three geographical provinces were studied, includingrepresentatives with benthic and secondarily pelagiclifestyles, and an independent phylogeny was constructedusing sequence information from mitochondrial 12S rRNAgenes.
Materials and methodsFish
Fish of the suborder Notothenioidei (order Perciformes)were caught in three geographical regions; near Ushuaia,
I. A. Johnston and others

2597Muscle growth in Antarctic fishes
Beagle Channel, and Atlantic coast Tierradel Fuego, Argentina (54°49′S, 68°13′W),Shag Rocks, South Georgia (54°33′S,42°02′W) and Rothera Research Station,Adelaide Island, Antarctic Peninsula(67°34′S, 68°08′W) (Fig.·1). All fish werecaptured during the austral summer(December–February). Fish from the BeagleChannel were obtained in 1999, 2000 and2001 using a mixture of baited traps andtrammel nets. The following species werestudied: Eleginops maclovinus Cuvierin Cuvier and Valenciennes 1830,Patagonotothen tessellataRichardson 1845,Patagonotothen longipesspecies complexSteindachner 1876, Patagonotothen simaRichardson 1844; Cottoperca gobioGünther 1861, Champsocephalus esoxGünther 1861, Harpagifer bispinisSchneider in Bloch and Schneider 1801 andParanotothenia magellanicaForster inBloch and Schneider 1801. Specimens wereusually processed immediately or within afew hours of capture. Most of the largerspecimens of E. maclovinuswere caughtalong the northern Atlantic coast of Tierradel Fuego using trammel nets and were heldon ice for up to 24·h prior to processing.Fish were obtained at Shag Rocks, SouthGeorgia from the 2000–2001 ‘GroundfishSurvey’ conducted for the Government ofSouth Georgia and the South SandwichIslands and were caught by bottom trawl at200·m depth. The species studied werethe Patagonian toothfish, DissostichuseleginoidesSmitt 1898, Chaeonocephalusaceratus Lönnberg 1906 andChampsocephalus gunnariLönnberg 1905.They were killed with a blow to the head,sealed in plastic bags, and shipped on ice viathe Falkland Islands to the UK, where theywere processed on the sixth day aftercapture. The Antarctic species studied wereNotothenia rossii Richardson 1844,Notothenia coriicepsRichardson 1844, Trematomus newnesiBoulenger 1902, Harpagifer antarcticusNybelin 1947 andPagothenia borchgrevinkiBoulenger 1902. They were caughtusing a combination of traps, trammel nets and SCUBA divers.Antarctic fish were transported to the UK in cold aquariaaboard the RRS James Clarke Ross and maintained for up to3 months in St Andrews at –0.5°C (12·h:12·h light:dark). Theywere fed ad libitum on squid and Antarctic krill. Fish werekilled by a sharp blow to the head followed by pithing of thecentral nervous system. The numbers, size range andmaximum-recorded length of the fish studied are shown inTable·1. Data on the Harpagifer species has been reported in
a preliminary publication (Johnston et al., 2002). The satelliteimages in Fig.·1 for summer and winter show typical meanmonthly sea surface temperatures between 1971 and 2001 atthe study sites for February and September) (Website:http://iridl.ldeo.columbia.edu/SOURCES/.IGOSS/.nmc/.Reyn_SmithOIv1/.climatology/.sst/) (see Reynolds and Smith,1994).
Histology
A 0.5·cm transverse steak of the trunk was prepared at 0.7standard length (SL) using a sharp knife. The steak was eitherphotographed using a digital camera and macro lens or traced
55° S
60° S
65° S
55° S
60° S
65° S
70° W
–2 0 2 4 6 8 10
70° W 60° W 50° W 40° W
55° S
60° S
65° S
70° W 60° W 50° W 40° W
Summer Winter
60° W
Temperature (°C)
50° W 40° W
Fig.·1. Sample sites in relation to the Polar Frontal Zone and summer and winter seasurface temperatures represented by the mean of satellite observations between 1971 and2001 for February and September.

2598
onto an acetate sheet in triplicate. The total area of fastmuscle was digitised (TCA). The steak was divided into aseries of up to 12 blocks (25·mm2), depending on the size ofthe fish, so as to representatively sample all areas of the fastmuscle. The number of blocks was adjusted to sample25–50% of one half of the steak. Blocks were frozenin isopentane (2-methyl butane) cooled to near its freezingpoint in liquid nitrogen (–159°C). Frozen sections werecut on a cryostat at 7·µm thickness. Preliminaryimmonohistochemical investigations confirmed the identityof muscle fibre types on the sections. Briefly, sections werestained using standard methods (Johnston et al., 1999) withthe S-58 and F-59 antibodies (Crow and Stockdale, 1986),which have been shown to identify slow and fast musclemyosin, respectively, in a wide range of fish species (Devotoet al., 1996; M. Abercromby, unpublished results) (seeFig.·2A,B). For the routine quantification of fibre number,sections were stained with Haematoxylin–Eosin. The cross-sectional areas of 1000 muscle fibres were measured per fish,sampled equally between the blocks and the equivalent fibrediameter computed. The total number of muscle fibres pertrunk cross-section was estimated as previously described;reproducibility was approximately 3% (Johnston et al., 1999).Smooth distributions were fitted to the measurements of fibrediameter using a kernel function as previously described(Johnston et al., 1999). Values for the smoothing coefficientsshowed no systematic variation between species and were
within the range 0.085–0.25. The occurrence of muscle fibrerecruitment was determined on the basis of the presence offibres less than 10·µm diameter. The final number of fastmuscle fibres (FNmax) was the mean ±S.E.M. of the fibrenumber estimate for all the fish in which fibre recruitmentwas complete.
Estimation of a molecular phylogeny
Sixteen species of notothenioids belonging to five familieswere analysed. Partial 12S mitochondrial rRNA sequences often notothenioid species were retrieved from GenBank (E.maclovinus, AF145426, 341·bp; D. eleginoides, AF145425,340·bp; P. borchgrevinki, PBU90411, 390·bp; T. newnesi,TNU27527, 374·bp; P. tessellata, AF145433, 343·bp; N.coriiceps, NCMT12SG, 373·bp; N. rosii, AF145432, 341·bp;C. aceratus, CAMT12SG1, 373·bp; C. gunnari, AF145424,330·bp; H. antarcticus, U37137, 373·bp). cDNAs from sixother species were cloned for this study: C. gobio, P. sima, P.longipes, P. magellanica, C. esox and H. bispinis. Two of thesequences (from C. gobio, CGU87414, 250·bp, and C. esox,CES307046, 309·bp) were already available in GenBank butlonger sequences were required to improve the quality of thealignment. The new sequences of 12S mitochondrial rRNAcloned were submitted to GenBank [accession numbersAY22775 (C. gobio), AY227776 (C. esox), AY227777 (H.bispinis), AY227778 (P. sima), AY227779 (P. longipes) andAY227780 (P. magellanica)].
I. A. Johnston and others
Table 1. Number, size range and maximum length of the 16 species of notothenioid fish studied
Size range Maximum-recorded Species Number Standard length (cm) Body mass (g) length (cm)
Tierra del FuegoCottoperca gobio 2 13.6, 22.8 47.3, 282.9 501
Eleginops maclovinus 57 4.4–64.1 1.05–4183 852
Paranotothenia magellanica 23 9.3–33.9 19.8–928 432
Patagonotothen tessellata 22 3.3–27.6 0.54–446 282
Patagonotothen sima 8 4.5–12.0 1.4–30.9 123
Patagonotothen longipessp. 9 17.5–27.8 81.3–347 283
Harpagifer bispinis 21 2.5–7.1 0.36–7.2 71
Champsocephalus esox 1 28.2 200.1 351
South GeorgiaDissostichus eleginoides 25 25.7–62.4 200–3500 2001
Chaenocephalus aceratus 17 21.7–72.0 58–4183 844
Champsocephalus gunnari 19 15.6–36.8 28–494 624
Antarctic PeninsulaNotothenia rossii 1 21.5 234.5 924
Notothenia coriiceps 14 6.2–35.0 4.1–819 581
Pagothenia borchgrevinki 4 18.0–22.5 85.8–112.1 261
Trematomus newnesi 4 11.1–20.8 26.4–193.8 211
Harpagifer antarcticus 13 0.84–10.1 0.008–24.8 124
1Gon and Heemstra (1990). 2Fernández et al. (2000). 3J. Calvo, unpublished results.4British Antarctic Survey Archives.

2599Muscle growth in Antarctic fishes
Reverse transcriptase–polymerase chain reaction
Total muscle RNA was isolated using Qiagen Rneasy Miniand Midi Kits. First-strand cDNA synthesis was carried outusing 3′ rapid amplification of cDNA ends system (RACE,Gibco BRL, Life Technologies, Gaitheisburg, USA).Polymerase chain reaction (PCR) was performed usingtwo sets of primers. The first set was Forward 5′-AAAAAGCTTCAAACTGGGATTAGATACCCCACTAT-3′and Reverse 5′-TGAGTCAGAGGGTGACGGGGCGGTGT-3′ (Ritchie et al., 1997). The second set was Forward 5′-GCGTAAAGGGTGGTTAGG-3′ and Reverse 5′-TCTTA-CTGCTAAATCCTCC-3′ (Stankovik et al., 2001). The PCRcycles used for the first primer set were 94°C for 2·min fordenaturation, 35 cycles of 94°C for 30·s, 61°C for 30·s and72°C for 1·min and elongation at 72°C for 5·min. The PCRcycles used for the second primer set were 94°C for 2·min fordenaturation, 35 cycles of 94°C for 30·s, 49°C for 30·s and72°C for 1·min and elongation at 72°C for 5·min. In all PCRsa proof-reading TAQ polymerase was used (Pfu from Promega
UK, Southampton, UK). DNA sequencing was performed intriplicate by The Sequencing Service (School of Life Sciences,University of Dundee, Scotland; http://DNASEQ.biocehm.dundee.ac.uk) using DYEnamic ET terminator chemistry(Amersham Biosciences, Chalfont St Giles, Bucks, UK) onApplied Biosystems automated DNA sequencers.
Alignment
The DNA sequences were put together in a FASTA fileusing BioEdit (Hall, 1999) and aligned using ClustalWat EMBL (http://www.ebi.ac.uk/clustalw/) with defaultparameters. The alignment was checked by eye using BioEditin order to be sure the automatic process was correct, andfinally reduced to the part of the alignment where most of thespecific sequences were represented. The final alignment of the16 species was 383·bp long. The alignment was used as theinput for the phylogenetic analysis. The database wasbootstrapped 100 times using SEQBOOT (Phylip packageversion 3.6). Maximum likelihood (ML) analysis with
a molecular clock assumption to assessdivergence times was performed usingDNAMLK (Phylip package version 3.6). Theanalysis was carried out using the followingparameters previously calculated in PUZZLEversion 5.0: transition/transversion ratio: 2.41,gamma distribution parameter alpha=0.24. The
Fig.·2. Phases of growth observed in the myotomalmuscle of Antarctic and sub-Antarctic notothenioidfish. (A–G) Transverse sections through the trunkstained with Haematoxylin–Eosin (A) Section fromNotothenia coriiceps, 11.2·cm standard length (SL),stained with the antibody S58, showing the presenceof a superficial layer of slow muscle fibres (arrows)dorsal to the major horizontal septum.(B) Trematomus newnesi, 13.3·cm SL, sectionstained with S58 showing the slow muscle fibresadjacent to the lateral line nerve (arrows). The fastmuscle fibres were counterstained withHaematoxylin–Eosin. (C) Dorsal region of the trunkin a juvenile Notothenia coriiceps,6.0·cm SL. Thearrowheads indicate zones of stratified hyperplasiacontaining fibres of smaller diameter than thesurrounding tissue. (D) The start of mosaichyperplasia (arrowheads) in the fast muscle of ajuvenile Notothenia coriiceps,6.7·cm SL. Note thatsmall diameter satellite fibres are not uniformlydistributed through the field of view. (E) The patternof fibre diameters characteristic of mosaichyperplasia was still present in E. maclovinusof37.5·cm SL. (F) Active mosaic hyperplasia(arrowheads) in the fast muscle of a juvenileEleginops maclovinus,4.7·cm SL. (G) The smallestspecimen of Paranotothenia magellanicacaptured,9.3·cm SL, showed a mosaic pattern of fibrediameters (arrowheads). s, slow muscle; f, fastmuscle; sk, skin; ms, myosepta. Scale bars, 200·µm(A–C,E); 100·µm (D,F,G).

2600
consensus tree was assembled using CONSENSE (Phylippackage version 3.6). The node heights and branch lengths forthe final tree used are given in the Appendix.
Statistical analyses
We used both conventional and phylogenetically basedstatistical analyses. For the latter, the phylogenetic topologyestimated as described above (and shown in Fig.·8) was used,and two different sets of branch lengths were considered(see next paragraph). We tested whether log10SLmax andlog10FNmax exhibit significant phylogenetic signal (a tendencyfor related species to resemble each other; Blomberg andGarland, 2002) using the randomization test and associatedMatLab program (PHYSIG.M) described in Blomberg et al.(2003) and 1000 permutations. Because log10FNmax wasstrongly related to log10SLmax, we also tested for phylogeneticsignal in a size-corrected value of FNmax. Following Blomberget al. (2003), we first determined the allometric scalingexponent for the log–log relationship using phylogeneticallyindependent contrasts (Felsenstein, 1985), calculated with thePDTREE program of Garland et al. (1999). We then dividedthe value for FNmax by SLmax raised to the appropriate scalingexponent (b=0.722 for real branch lengths, b=0.964 forconstant branch lengths), and then took the log of this value.We used the K statistic of Blomberg et al. (2003) as adescriptor of the amount of phylogenetic signal present intraits. A value of unity indicates that a trait has exactly theamount of signal expected under Brownian motion evolutionalong the specified topology and branch lengths, whereasvalues less than unity indicate less signal than expected, andvalues of K greater than unity indicate more.
As discussed elsewhere, the branch lengths used forphylogenetic analyses need to be tested for statistical adequacyand can have a large effect on the results of analyses (e.g. seeGarland et al., 1992, 1999; Diaz-Uriarte and Garland, 1998;Freckleton et al., 2002). The phylogenetic tree estimated asdescribed above includes estimates of branch lengths. Thesebranch lengths may be referred to as ‘real’ because they arederived from data. However, they are derived from data onDNA sequence divergence, whereas phylogenetically basedstatistical methods require branch lengths in units proportionalto expected variance of character evolution for the actualcharacters (e.g. body size, fibre number) under study (e.g. seeFelsenstein, 1985; Garland et al., 1992; Freckleton et al., 2002;Blomberg et al., 2003). Therefore, such ‘real’ branch lengthsmay or may not perform well for statistical analyses. Hence,as an alternative set of branch lengths, we set all segments tobe equal in length (i.e. each segment was set to equal a valueof unity). We then compared the statistical performance ofthese two alternate sets of branch lengths by three criteria.First, we used the diagnostic check suggested by Garland et al.(1992) (see also Diaz-Uriarte and Garland, 1998), whichinvolves plotting the absolute values of standardizedphylogenetically independent contrasts (Felsenstein, 1985)versustheir standard deviations and calculating the correlationcoefficient (not through the origin). A correlation closer to zero
implies a better fit of the branch lengths to the data. Second,we calculated the mean squared error (MSE) in a generalizedleast-squares analysis (equivalent to the variance of thestandardized contrasts) using PHYSIG.M of Blomberg et al.(2003). Again, a smaller MSE implies a better fit. Weconsidered the foregoing two statistics for log10 maximumlength (SLmax: data reported in Table·1) because it is theprimary independent variable in the analysis and because fibrenumber was expected to be strongly correlated with SLmax.Finally, we examined the independent contrasts regression(through the origin) of log10FNmax on log10SLmax. Here, ahigher r2 implies a better fit of the branch lengths to the data(assuming that the data appear to fit the line well, e.g. linearity,homoscedasticity of residuals, lack of outliers or influentialpoints).
We used PDTREE (Garland et al., 1999) to estimateancestral values and 95% confidence limits for both log10SLmax
and log10size-corrected FNmax. A clear sister group to thenotothenioids has not been identified, although characters maybe polarised relative to the Bovichtidae, and this family hasoften been used as a ‘functional outgroup’ (Eastman, 1993).We therefore compared node 2 in the phylogenetic tree (seeFig.·8), which represents the ancestor of the Eleginopinae,Nototheniidae, Channichthyidae and Harpagiferidae, withnode 6, which is the ancestor of the Channichthyidae.Comparison of the 95% confidence limits (c.l.) allowed us totest whether either trait showed a significant change betweenthe two nodes.
ResultsPatterns of muscle growth
The stratified hyperplasia stage of growth is characterised bylayers of fibres of relatively uniform diameter arising fromdiscrete germinal zones (Fig.·2C). This pattern of growth wasfound in the smallest specimens of N. coriiceps, 6–7·cmstandard length (SL), in which distinct layers of small diameter(<10·µm) fast fibres were observed adjacent to myosepta at thedorsal (Fig.·2C) and the ventral apices of the trunk (notillustrated). Active stratified hyperplasia was not observed inany of the other species for which juvenile stages wereavailable (E. maclovinus, 4.4·cm SL and P. tessellata, 3.3·cmSL). In the remaining species studied, with the exception of thethree channichthyids and two Harpagifer spp., new smalldiameter fibres were found on the surface of existing fibreseither in restricted zones (illustrated for a juvenile N. coriicepsin Fig.·2D) or throughout the myotome (Fig.·2E). Themyotomes of juvenile E. maclovinus(5–7·cm SL) showed fibreaddition throughout the myotomal cross-section giving rise toa pattern of fibre diameters typical of mosaic hyperplasia(Fig.·2F). Fibre recruitment in E. maclovinus ceased atapproximately 26·cm SL, equivalent to 31% of the maximumattainable length (SLmax) (Table·1). Even in the largestspecimen caught (64.1·cm SL), the characteristic mosaicpattern of fibre diameters was still discernible (not illustrated).
Another species showing a prolonged period of mosaic
I. A. Johnston and others

2601Muscle growth in Antarctic fishes
hyperplasia was D. eleginoides. Muscle fibres <10·µmdiameter were present in specimens 35.6·cm SL or less, butabsent from fish over 52·cm SL. It was not possible to establishthe precise length at which fibre recruitment ceased in thisspecies. The complete range of juvenile and adult stages wasstudied for P. tessellata(3.3–27.6·cm SL). Fibres less than10·µm in diameter were only present in the four smallestspecimens 3.3–3.5·cm SL. This suggests that fibre recruitmentceased between 3.5 and 7.7·cm SL, which is equivalent to12.6–27.9% of the maximum-recorded length. The fast muscleof the smallest specimen of P. magellanicastudied (9.5·cm SL)showed the characteristic mosaic pattern of fibres (Fig.·2G),but there were no fibres less than 10·µm diameter (not shown),indicating fibre recruitment had already ceased at 22% SLmax.Only the smallest N. coriicepsstudied had muscle fibres lessthan 10·µm diameter, suggesting recruitment had ceased atapproximately 16.8% of SL.
For all the other species, muscle growth was by fibrehypertrophy alone for the length ranges studied. ForChannichthyidae (Chaenocephalus aceratus, Champsocephalusesoxand C. gunnari) and the two Harpagiferspp., the fibres inparticular regions of the myotome were of relatively uniformdiameter (illustrated for C. aceratusin Fig.·3A). Thus the patternof fibre diameter characteristic of mosaic hyperplasia wasabsent, which suggests that postembryonic growth was largelyor entirely dependent on stratified hyperplasia.
In the largest individuals of N. coriiceps (Fig.·3B), P.tessellata(Fig.·3C) and P. longipes(not illustrated) the fibresappeared to be undergoing splitting. The connective tissuesheath surrounding each fibre appeared to infiltrate andsubdivide the fibre into 2–6 smaller daughter fibres(Fig.·3B,C), and in some cases there were aggregations ofnuclei (arrowheads in Fig.·3C). Intermediate stages in thisprocess were also occasionally observed (not shown). Theincidence of ‘split fibres’ in the largest fish remained low(1–3%) and was not sufficient to make a material difference tothe estimate of fibre number.
Distribution of muscle fibre diameters
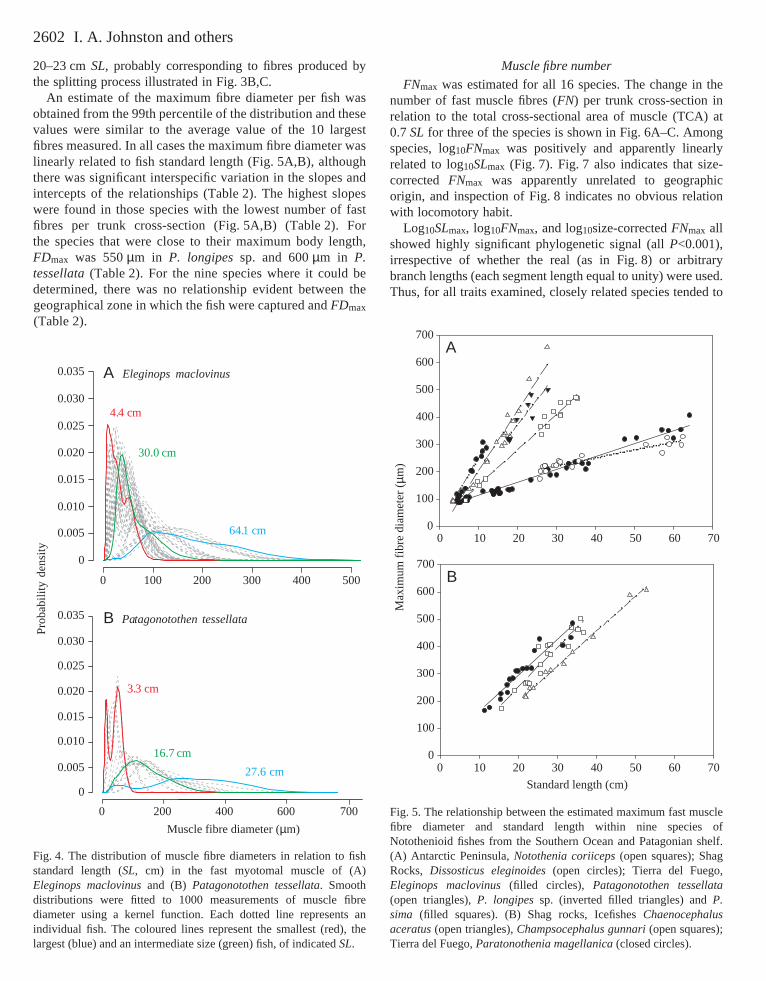
Smooth distributions were fitted to measurements of800–1000 muscle fibres per fish using a kernel function(Fig.·4A,B). The distributions of fast muscle fibre diameters inthe juvenile E. maclovinusstudied were unimodal with a peakdensity that increased from 10–40·µm diameter over the lengthrange 4.4 (red line in Fig.·4A) to 18.6·cm SL. Some evidencefor a bimodal distribution of fibre size was observed in fish of23.4–28·cm SL(Fig.·4A). In individuals greater than 26·cm SLthere were no small diameter fibres, and in the biggestspecimens there was a broad unimodal distribution of fibresizes with a peak ranging from 100 to 200·µm diameter (blueline in Fig.·4A). In contrast, fast fibre diameters in the smallestspecimens (3.3–8.6·cm SL) of P. tessellatawere bimodal (redline in Fig.·4B), with the distribution becoming unimodal andbroader with increasing SL (green and blue lines in Fig.·4B).Fibres less than 10·µm diameter were not present in fish of8.6·cm SLor larger. In an individual, 27.6·cm SL, close to the
maximum size reported for this species (Table·1), there was abroad peak to the distribution from 250 to 500·µm diameter(blue line in Fig.·4B). There was also a distinct right-hand peakof fibres 20–100·µm diameter, which was not present in fish
ms
A
B
C
Fig.·3. Phases of growth observed in the myotomal muscle ofAntarctic and sub-Antarctic notothenioid fish that have a relativelylow final muscle fibre number. (A) Transverse section through thetrunk stained with Haematoxylin–Eosin from an adult icefishChaenocephalus aceratus, 27.6·cm standard length (SL). Note therelatively uniform distribution of large diameter (approx. 200·µm)muscle fibres. (B) Transverse section of a region of fast muscle fibresfrom an adult Notothenia coriiceps, 35.5·cm SL, stained with ScarabRed to visualise collagen fibrils. The arrowheads show the apparentsplitting of a fibre into smaller daughter fibres each surrounded by aconnective tissue sheath. (C) Transverse section of a region of fastmuscle fibres from an adult Patagonotothen longipessp. (27.8·cmSL) showing the apparent splitting of a fibre into smaller daughterfibres. Arrowheads indicate the position of myonuclei. ms, myosepta.Scale bars, 200·µm (A,B); 100·µm (C).
2602
20–23·cm SL, probably corresponding to fibres produced bythe splitting process illustrated in Fig.·3B,C.
An estimate of the maximum fibre diameter per fish wasobtained from the 99th percentile of the distribution and thesevalues were similar to the average value of the 10 largestfibres measured. In all cases the maximum fibre diameter waslinearly related to fish standard length (Fig.·5A,B), althoughthere was significant interspecific variation in the slopes andintercepts of the relationships (Table·2). The highest slopeswere found in those species with the lowest number of fastfibres per trunk cross-section (Fig.·5A,B) (Table·2). Forthe species that were close to their maximum body length,FDmax was 550·µm in P. longipessp. and 600·µm in P.tessellata(Table·2). For the nine species where it could bedetermined, there was no relationship evident between thegeographical zone in which the fish were captured and FDmax
(Table·2).
Muscle fibre number
FNmax was estimated for all 16 species. The change in thenumber of fast muscle fibres (FN) per trunk cross-section inrelation to the total cross-sectional area of muscle (TCA) at0.7·SL for three of the species is shown in Fig.·6A–C. Amongspecies, log10FNmax was positively and apparently linearlyrelated to log10SLmax (Fig.·7). Fig.·7 also indicates that size-corrected FNmax was apparently unrelated to geographicorigin, and inspection of Fig.·8 indicates no obvious relationwith locomotory habit.
Log10SLmax, log10FNmax, and log10size-corrected FNmax allshowed highly significant phylogenetic signal (all P<0.001),irrespective of whether the real (as in Fig.·8) or arbitrarybranch lengths (each segment length equal to unity) were used.Thus, for all traits examined, closely related species tended to
I. A. Johnston and othersPr
obab
ility
dens
ity
0.035
0.030
0.025
0.020
0.015
0.010
0.005
0
0.035
0.030
0.025
0.020
0.015
0.010
0.005
0
0 100 200 300 400 500
0 200 400 600 700
Muscle fibre diameter (µm)
A
4.4 cm
30.0 cm
64.1 cm
Eleginopsmaclovinus
3.3 cm
16.7cm
27.6 cm
Patagonotothen tessellataB
Fig.·4. The distribution of muscle fibre diameters in relation to fishstandard length (SL, cm) in the fast myotomal muscle of (A)Eleginops maclovinusand (B) Patagonotothen tessellata. Smoothdistributions were fitted to 1000 measurements of muscle fibrediameter using a kernel function. Each dotted line represents anindividual fish. The coloured lines represent the smallest (red), thelargest (blue) and an intermediate size (green) fish, of indicated SL.
Fig.·5. The relationship between the estimated maximum fast musclefibre diameter and standard length within nine species ofNotothenioid fishes from the Southern Ocean and Patagonian shelf.(A) Antarctic Peninsula, Notothenia coriiceps(open squares); ShagRocks, Dissosticus eleginoides(open circles); Tierra del Fuego,Eleginops maclovinus(filled circles), Patagonotothen tessellata(open triangles), P. longipessp. (inverted filled triangles) and P.sima (filled squares). (B) Shag rocks, Icefishes Chaenocephalusaceratus(open triangles), Champsocephalus gunnari(open squares);Tierra del Fuego, Paratonothenia magellanica(closed circles).
0
100
200
300
400
500
600
700
Standard length (cm)
0 10 20 30 40 50 60 70
0 10 20 30 40 50 60 70
Max
imum
fib
re d
iam
eter
(µm
)
0
100
200
300
400
500
600
700A
B

2603Muscle growth in Antarctic fishes
have phenotypes that were more similar than for specieschosen at random from the tree.
All three criteria suggested that setting all branch segmentsequal to unity in length was preferable for statistical analysesas compared with use of the real branch lengths. Forlog10SLmax, the correlation between the absolute values ofthe standardised contrasts and their standard deviationswas –0.478 for the real branch lengths versus 0.190 forconstant branch lengths. The corresponding MSE values were0.162 and 0.109. Finally, r2 in the independent contrastsregression of log10FNmax on log10SLmax was 0.763 versus0.845. Thus, we used constant branch lengths in the followinganalyses.
The independent contrasts linear regression (constant branchlengths) was:
log10FNmax = 3.17 + log10SLmax × 0.964 (F1,14=35.0, P<0.0001; r2=0.71)
With constant branch lengths, the K statistic was 0.76 forlog10SLmaxand 2.81 for log10size-corrected FNmax. The formervalue is typical for measures of body size of a variety oforganisms as compiled in Blomberg et al. (2003), but the latteris higher than any of the 35 values for morphologicaltraits (size-corrected when necessary) that they report(range=0.29–2.22). Thus, log10size-corrected FNmax shows arelatively strong tendency for related species to resemble eachother.
Finally, we tested the hypothesis that size-corrected FNmax
was significantly lower at node 6 (supported by 88 out of 100bootstraps) than at node 2 (supported by 100 out of 100bootstraps), which would indicate an overall reduction in fibrenumber in the lineages leading to node 2. Because FNmax isstrongly related to SLmax (see above and Fig.·7), we alsocompared SLmax at node 6 and node 2. The calculated 95%c.l. assuming constant branch lengths are shown in Table·3.
The 95% c.l. of log10SLmax at node 2 overlapped with that fornode 6, indicating no significant difference in the estimatednodal values. However, the 95% c.l. at node 2 for size-corrected log10FNmax do not overlap those for node 6, and sovalues at the two nodes can be considered significantlydifferent. Thus, there has been a trend for the reduction ofsize-corrected FNmax but not SLmax in the lineages leading tonode 6.
DiscussionSkeletal muscle fibres are differentiated multicellular
structures specialised for contraction. It is generally acceptedthat the mechanism for increasing fibre number during thepostembryonic stages involves the activation of myogenicprecursor cells, which proliferate before leaving the cell cycle
Table·2. Regression statistics for the linear regression of muscle fibre diameter on standard length, and the estimated maximumfibre diameter
Species d.f. residual Intercept a Slope b r2 Significance (P) FDmax (µm)
Tierra del FuegoEleginops maclovinus 48 67.8±3.1 4.7±0.13 0.96 <0.001 490Paranotothenia magellanica 20 26.0±15.7 13.4±0.8 0.94 <0.001 500Patagonotothen tessellata 16 –16.3±19.7 22.1±1.3 0.95 <0.001 600Patagonotothen sima 6 9.2±23.8 24.3±2.5 0.94 <0.0001 300Patagonotothen longipessp. 6 –2.8±72.3 18.7±3.3 0.84 <0.002 550
South Georgia Dissosticus eleginoides 17 135.2±11.4 2.90±0.3 0.87 <0.0001 350Chaenocephalus aceratus 9 –55.2±12.4 12.8±0.4 0.99 <0.0001 600Champsocephalus gunnari 16 –35.7±35.6 14.4±1.3 0.89 <0.0001 500
Antarctic PeninsulaNotothenia coriiceps 13 20.9±12.7 13.0±0.5 0.98 <0.0001 550
d.f., degrees of freedom.FD, fibre diameter; FDmax, maximum fibre diameter, where FD=a+b(FDmax).Values of a and b are means ±S.E.M.
Table·3. Estimated ancestral values of log10 maximumstandard length (SLmax) and body size-corrected maximumfibre number (FNmax) at nodes 2 and 6 of the phylogenetic
tree estimated for notothenioid fishes
Node Lower 95% c.l. Value Upper 95% c.l.
log10SLmax
2 1.58 1.90 2.226 1.27 1.58 1.89
log10body size-corrected FNmax
2 3.01 3.20* 3.406 2.28 2.47 2.66
Branch lengths were set equal to unity for these analyses (seetext).
c.l., confidence limit.*Significantly different at the P<0.05 level.

2604
and fusing to form new myotubes (Koumans and Akster,1995; Johnston, 2001). However, some early studies failed tofind candidate myogenic cells and it was proposed that in fishadditional muscle fibres could also be produced by a processof splitting or budding in the mullet Mugil cephalus(Carpenéand Veggetti, 1981) and European eel Anguilla anguilla(Willemse and Lieuwma-Noordanaus, 1984). This suggestion
remains highly controversial, and cells with theultrastructural characteristics of myogenic precursors weresubsequently reported in the European eel (Romanello et al.,1987) and other species (Stoiber and Sänger, 1996). In thepresent study, we found that fast muscle fibres becamesubdivided in the largest specimens of three species ofnotothenioid studied, leading to a small increase in fibrenumber (Fig.·3B,C). The appearance of these subdividedfibres, which were surrounded by a network of collagenfibrils, was quite distinct from the pattern of fibre diametersobserved following either stratified or mosaic hyperplasia.Subdivision was not restricted to fibres that had reached themaximum diameter and further investigation is required todetermine whether ‘fibre splitting’ is a normal growth processor related to some pathological phenomenon such as aparasitic infection.
The notothenioid fishes comprise 8 families, 48 genera and139 species (Balushkin, 2000) or, more conservatively, 8families, 43 genera and 122 species (Eastman and Eakin,2000). Cladistic analysis of osteological features hascontributed to resolving notothenioid familial relationships(Iwami, 1985). There have been several phylogenies based onnucleotide sequencing of mitochondrial 12S and 16S rRNA(Bargelloni et al., 1994; Ritchie et al., 1997) and nuclear 28SrRNA (Lecointre et al., 1997). These molecular phylogeniesimplied extensive paraphyly, especially in the Bovichtidae andNototheniidae. Bovichtid species were placed at the base of thetree in the sub-Antarctic zone whilst the ‘core’ notothenioidsare largely Antarctic (Bargelloni et al., 2000). Based onmtDNA sequences, the diversification of this clade is estimatedat 15–20 million years (my) ago and after the formation of the
I. A. Johnston and others
0
1×10⁴
2×10⁴
3×10⁴
4×10⁴
5×10⁴
0 10 20 30 40 500
4.0×10⁴
8.0×10⁴
1.2×10⁵
1.6×10⁵
2.0×10⁵
Muscle TCA (mm2)
0 2 4 6 8 10 12 14 16
0 2 4 6 8 10 12 14 16
Fib
re n
umbe
r
0
5×10³
10×103
15×103
20×103
25×103
A
B
C
Fig.·6. (A–C). The relationship between the number of muscle fibresand the total cross-sectional area (TCA) of fast muscle at 0.7standard length (SL). (A) Eleginops maclovinus, (B) Patagonotothentessellata and (C) Notothenia coriiceps. The broken lines representthe estimate of FNmax.
Fig.·7. The relationship between log10 maximum fibre number(FNmax; data from Fig.·8) and log10 maximum standard length(SLmax; data from Table·1) among 16 species of notothenioid fishesfrom Tierra del Fuego (filled circles), Shag Rocks, South Georgia(open triangles) and the Antarctic Peninsula (open circles). Aconventional least-squares linear regression was fitted to the data.The equation was: log10FNmax=2.53+log10SLmax×1.12 (F1,14=30.8,P<0.0001; r2=0.69).
log10SLmax
0.6 0.8 1.0 1.2 1.4 1.6 1.8 2.0 2.2 2.4
log 1
0FN
max
3.0
3.5
4.0
4.5
5.0
5.5

2605Muscle growth in Antarctic fishes
Antarctic Polar Front and climatic cooling (Bargelloni et al.,2000). The phylogeny reported in Fig.·8 was in broadagreement with previous studies and assumed that C. gobiowas the most basal of the species studied. The bootstrapsupport values from the Phylip analysis are shown in Fig.·8.The family Nototheniidae is probably paraphyletic, whereasHapagiferidae and Channichthyidae are monophyletic.
The Antarctic continental shelf waters have been less than5°C for about 12·my and today approach –1.86°C all the yeararound (Clarke and Crame, 1989). Notothenioids comprise55% of fish species from the continental shelf and uppercontinental slope of Antarctica and often represent in excess of90% of the species collected (Eastman, 1993; Eastman andEakin, 2000; Clarke and Johnston, 1996; Montgomery and
Clements, 2000). It has been argued that the low competitiveenvironment under which the notothenioid radiation hasoccurred has allowed a higher tolerance of disaptation(evolutionary loss of function) than in other species flocks(Clarke and Johnston, 1996; Montgomery and Clements,2000). Examples of disaptation include the loss of respiratorypigments in channichthyids and the incomplete canalformation in the lateral line associated with secondarypelagicism and paedomorphosis (Montgomery and Clements,2000).
The present study has shown that the radiation of the grouphas also been associated with a progressive loss in the bodysize-specific maximum number of fast fibres in the myotomalmuscles (FNmax) of the more derived species, e.g. node 6
Fig.·8. Maximum likelihood phylogenetic tree estimated from 12S mitochondrial rRNA sequences and the trait values for the final number offast muscle fibres (FNmax) for the notothenioid fishes studied using Phylip. Values are means ±S.E.M. (number of individuals). The bootstrapsupport values obtained from the Phylip analysis are shown italicised in parentheses by the nodes (see text for details). The branch lengths andnode heights for the tree are given in the Appendix. The size of the fish gives some indication of their relative sizes, but they are not drawn toscale. The locomotory habit of each species is also shown: D, demersal; D/P, demerso-pelagic and P, pelagic. The colours on the right-handside show the geographical zone of capture for each species: Beagle Channel (green), Shag Rocks, South Georgia (light blue) and AntarcticPeninsula (dark blue). The colours on the left-hand side indicate the current taxonomic families, some of which are not monophyletic.

2606
versusnode 2 in Fig.·8. The maximum standard length (SLmax)was a good predictor of FNmax, explaining about 70% ofthe variation observed among the 16 species studied (Fig.·7).Both log10SLmax and the size-corrected values of log10FNmax
showed highly significant phylogenetic signal (P<0.001), andthe amount of phylogenetic signal was unusually high for thelatter trait. Thus, considering all 16 species in the study, relatedspecies tended to resemble each other with respect to bothtraits. However, the 95% c.l. for the estimated ancestral valueof log10SLmax at node 2, representing the ancestor at thebase of the notothenioid radiation, overlapped with node 6,representing the ancestor of the Channichthyidae, one of themore derived families (Fig.·8). This suggests that there hasbeen no general trend for a reduction in body size during theradiation of the group. Indeed, the ancestral condition isgenerally thought to have been a small benthic species(Eastman, 1993). In contrast, there was statistical evidence fora reduction in log10size-corrected FNmax between node 2 andnode 6, consistent with a general trend for reduced fibrenumber in the more derived species. Thus, one of the largestspecies studied, Chaenocephalus aceratus, which reaches85·cm SLmax, had only 12·700 fast muscle fibres per trunkcross-section, or 7.7% of the 164·000 fibres in E. maclovinus,which reaches a similar size (Fig.·8). For comparison, Atlanticsalmon (Salmo salarL.) (Salmonidae) of 50–70·cm SL have550·000–1200·000 fast muscle fibres per trunk cross-section(Johnston et al., 2000).
An important consequence of the reduction in fibre numberin the more derived lineages of notothenioid fish is an increasein their maximum diameter, which can reach 600·µm in somespecies depending on their final body size (Fig.·5). Aerobicmuscle fibre types (slow muscles) that depend on oxygendelivery to support their contractile activity also havecorrespondingly high maximum diameters in some Antarcticfish, and can reach 100·µm (Archer and Johnston, 1991;Smialovska and Kilarski, 1981). Whether the maximumnumbers of slow and fast muscle fibres show a parallelreduction across the group remains to be determined. ForAtlantic cod, fibres attain a maximum diameter of 50·µm inslow and 130·µm in fast muscle at 83·cm SL (Greer-Walker,1970). FDmax is approx. 220·µm in Atlantic salmon and isattained at around 50·cm SL and (Johnston et al., 2000). Themaximum muscle fibre diameter in the highly active tropicaltop predator, the Pacific Blue Marlin (Makaira nigricansLacopóde 1803), is 50·µm for slow and 120·µm for fastmuscle, even in fish exceeding 100·kg total mass (I. A.Johnston, unpublished observations). Although thecomparative data are limited, the large maximum diameter ofmuscle fibres in notothenioid fish does appear to beexceptional.
Interestingly, the pattern of fibre diameters observed in thejuvenile and adult stages of two recently diversified families ofnotothenioids, the Channichthyidae and the Harpagiferidae,was not consistent with the involvement of the mosaichyperplasia phase of muscle fibre recruitment. This wasconfirmed using laboratory reared H. antarcticus. Fibre
number was found to increase only twofold between the yolk-sac larvae and adult stages, and postembryonic muscle growthwas entirely supported by fibre recruitment from localisedgerminal zones (stratified hyperplasia) (Johnston et al., 2002).Several characteristics of notothenioids, including the longpelagic larval stage of many Antarctic species, the attainmentof sexual maturity at a large proportion of maximum size, thelack of haemoglobin in channichthyids, the lack of scalesin channichyids and many bathydraconids (reviewed inMontgomery and Clements, 2000) and the reliance ofembryonic and stratified hyperplasia during for growth in adultstages, indicate that paedomorphy has been important innotothenioid evolution.
Basic geometry dictates that an evolutionary increase inmuscle fibre diameter will decrease the surface-to-volumeratio of muscle fibres. This can be expected to decrease basalenergy requirements because of the concomitant reduction inmembrane leak pathways, which would mean that fewerenergy-utilising pumps were required to maintain ionicequilibria (Hochachka, 1986). It has been estimated that up to40% of basal energy requirements are required to maintainionic gradients (Jobling, 1994). Clarke and Johnston (1999)summarised literature data on the metabolic rate of differentfish taxa and found a significant curvilinear relationshipwith temperature. However, there was no evidence thatnotothenioids departed from the general trend of metabolicrate with temperature in Perciformes (Johnston et al., 1991;Clarke and Johnston, 1999; Steffensen, 2002). Notothenioidfish have additional energy costs compared with otherPerciformes associated with the synthesis of glycopeptideantifreezes, which are present at high concentrations in theplasma and other body fluids (Cheng and DeVries, 1991). Itis possible that reductions in other aspects of basalmetabolism, e.g. in relation to the loss of fibre number, serveto compensate for the additional energy costs associated withantifreeze production.
Several ‘core’ notothenioid species, including the icefish C.esoxand species from the genus Patagonotothen, are foundoutside the Antarctic, mainly in Patagonian waters (DeWitt etal., 1976). The theory of an Antarctic origin for sub-Antarcticnotothenioids is supported by the distribution of antifreezegenes among representative species (Cheng, 2000). It has beensuggested that the presence of closely related species on eitherside of the APF represents ‘jump dispersal’ associated withepisodes of climatic change rather than passive vicariance(Bargelloni et al., 2000). However, it is noteworthy thatseveral species of notothenioids, including C. gunnari, whichoccur in the Antarctic, are also found at some islandsimmediately to the north of the APF (Fisher and Hureau,1985). The relatively recent origin of the derived sub-Antarctic notothenioids (Notothenidae and Channichthyidae)would then explain why they have a relatively low musclefibre number and high maximum diameter, traits thatoriginated in a colder and more stenothermal environment. E.maclovinusand C. gobiohave a greater size-corrected FNmax
than the other notothenioids studied, indicating that they are
I. A. Johnston and others

2607Muscle growth in Antarctic fishes
probably the least derived species. Thus E. maclovinusand C.gobioprobably diverged from the other notothenioids with theseparation of South America from Antarctica around 25–20million years ago, and did not subsequently invade fromAntarctica. This is probably the general case for Bovichtidae,Pseudaphritidae and Eleginopidae, since they are allrepresented by non-Antarctic species that lack antifreezes,except for a single Antarctic species of bovichtid (Eastmanand Eakin, 2000).
The rate of oxygen delivery to aerobic muscle fibres is afunction of the fibre diameter and factors that affect diffusionrate (Egginton et al., 2002). The latter include temperature, thedistribution of mitochondria and lipid droplets within the fibre,and overall metabolic demand (Desaulniers et al., 1996;Londraville and Sidell, 1990; Egginton et al., 2002; O’Brienet al., 2003). The temperature-dependence of the state 3respiration rate of isolated mitochondria with pyruvate assubstrate was described by a single quadratic relationship forall Perciformes studied, with no significant upregulation of themaximum rate of oxygen uptake per mg mitochondrial proteinin Antarctic and sub-Antarctic species (Johnston et al., 1998).Adequate oxygen delivery to large-diameter muscle fibres isprobably only possible because of the very low metabolicdemand in polar fishes at low temperature (Johnston et al.,1991; Clarke and Johnston, 1997; Steffensen, 2002).Modelling studies indicate that a low fibre number and highmaximum fibre diameter does not limit adequate oxygen fluxat low body temperatures (–2 to +5°C) in notothenioids(Egginton et al., 2002). There is evidence that heat death inAntarctic fish is linked to an oxygen limitation, resulting froma mis-match in oxygen delivery and consumption at the tissuelevel (Pörtner, 2002; Mark et al., 2002). Thus, a high FDmax
may well constrain the upper thermal limit of notothenioids,particularly in the case of the icefish C. esox and otherChannichthyids that lack respiratory pigments (Egginton et al.,2002).
AppendixThe phylogenetic tree was constructed using the Maximum
Likelihood method with molecular clock using Phylip version3.6a2.1. Empirical base frequencies were: A, 0.27453; C,0.25691; G, 0.24153; T(U), 0.22702. Transition/transversionratio=2.410000.
Discrete approximation to gamma distributed rates
Coefficient of variation of rates = 2.040000 (α=0.240292).
State in HMM Rate of change Probability
1 0.358 0.8982 6.315 0.0993 21.297 0.0024.
Ln Likelihood = –1352.86178.HMM, hidden Markov model.
Node
Ancestor Node Height Length
Root 1313 Cgob-BOV 0.25669 0.2566913 2 0.20168 0.201682 Emac-NOT 0.25669 0.055012 12 0.20438 0.00270
12 Dele-NOT 0.25669 0.0523112 1 0.20444 0.000061 9 0.22476 0.020329 10 0.24728 0.02252
10 Pbor-NOT 0.25669 0.0094110 Tnew-NOT 0.25669 0.009419 8 0.24873 0.023978 Ptes-NOT 0.25669 0.007968 15 0.25268 0.00395
15 Psim-NOT 0.25669 0.0040115 Plon-NOT 0.25669 0.004011 4 0.22386 0.019424 5 0.23644 0.012585 Pmag-NOT 0.25669 0.020255 14 0.24895 0.01251
14 Ncor-NOT 0.25669 0.0077414 Nros-NOT 0.25669 0.007744 3 0.22938 0.005523 6 0.24280 0.013426 Ceso-CHA 0.25669 0.013896 11 0.24741 0.00461
11 Cace-CHA 0.25669 0.0092811 Cgun-CHA 0.25669 0.009283 7 0.25544 0.026057 Hbis-HAR 0.25669 0.001257 Hant-HAR 0.25669 0.00125
This work was supported by a grant (GR3/12550) from theNatural Environment Research Council of the UK and by theAntorchas Foundation, Argentina. D.F. was in receipt ofsupport from CONICET, Argentina, an Antorchas-BritishCouncil award for studies in the UK and from the RussellTrust Development Fund, University of St Andrews. T.G. wassupported by US National Science Foundation grant DEB-0196384. We thank Dr F. E. Stockdale, Stanford Universityfor kindly providing the S-58 and F-59 antibodies. We aregrateful to Dr Inigo Everson for his help in obtaining fishfrom South Georgia.
ReferencesAcierno, R., MacDonald, J. A., Agnisola, C. and Tota, B. (1995). Blood
volume in the haemoglobinless Antarctic teleost Chionodraco hamatus(Lonnberg). J. Exp. Zool. 272, 407-409.
Archer, S. D. and Johnston, I. A. (1991). Density of cristae and distributionof mitochondria in the slow muscles of Antarctic fish. Physiol. Zool. 64,242-258.
Balushkin, A. V. (2000). Morphology, classification, and evolution ofnotothenioid fishes of the Southern Ocean (Notothenioidei, Perciformes). J.Ichthyol. 40 (Suppl. 1), S74-S109.
Bargelloni, L., Ritchie, P. A., Patarnello, T., Battaglia, B., Lambert, D. M.and Meyer, A. (1994). Molecular evolution at subzero temperatures:mitochondrial and nuclear phylogenies of fishes from Antarctica (suborder

2608
Notothenioidei), and the evolution of antifreeze glycopeptides. Mol. Biol.Evol. 11, 854-863.
Bargelloni, L., Marcato, S., Zane, L. and Patarnello, T. (2000).Mitochondrial phylogeny of notothenioids: a molecular approach toAntarctic fish evolution and biogeography. Syst. Biol. 49, 114-129.
Battram, J. C. and Johnston, I. A. (1991). Muscle growth in the Antarcticteleost, Notothenia neglecta(Nybelin). Antarct. Sci. 3, 29-33.
Blomberg, S. P. and Garland, T., Jr (2002). Tempo and mode in evolution:phylogenetic inertia, adaptation and comparative methods. J. Evol. Biol. 15,899-910.
Blomberg, S. P., Garland, T., Jr and Ives, A. R. (2003). Testing forphylogenetic signal in comparative data: behavioural traits are more labile.Evolution57, 717-745.
Carpenè, E. and Veggetti, A. (1981). Increase in muscle fibres in the lateralismuscle (white portion) of Mugilidae (Pisces, Teleostei). Experentia37, 191-193.
Cheng, C. C. and DeVries, A. L. (1991). The role of antifreeze glycopeptidesand peptides in the freezing avoidance of cold-water fish. In Life UnderExtreme Conditions: Biochemical Adaptation(ed. G. di Prisco), pp. 1-14.Berlin and Heidelberg: Springer-Verlag.
Cheng, C. H. C. (2000). Antifreeze glycoprotein genes in temperate waternotothenioid fish infer an Antarctic origin of speciation. Am. Zool. 40, 972-973.
Clarke, A. and Crame, J. A. (1989). The origin of the Southern Ocean marinefauna. In Origins and Evolution of the Antarctic Biota. Geological SocietySpecial Publication No. 47 (ed. J. A. Crame), pp. 253-268. London:Geological Society of London.
Clarke, A. and Johnston, I. A. (1996). Evolution and adaptive radiation ofAntarctic fishes. Trends Ecol. Evol. 11, 212-218.
Clarke, A. and Johnston, N. M. (1999). Scaling of metabolic rate with bodymass and temperature in teleost fish. J. Animal Ecol. 68, 893-905.
Cocca, E., Ratnayake-Lecamwasam, M., Parker, S. K., Camardella, L.,Ciaramella, M., diPrisco, G. and Detrich, III, H. W. (1995). Genomicremnants of a-globin genes in the hemoglobinless Antarctic icefishes. Proc.Natl. Acad. Sci. USA92, 1817-1821.
Crow, M. T. and Stockdale, F. E. (1986). Myosin expression andspecialization among the earliest muscle fibres of the developing avian limb.Dev. Biol. 113, 238-254.
Desaulniers, N., Moerland, T. S. and Sidell, B. D.(1996). High lipid contentenhances the rate of oxygen diffusion through fish skeletal muscle. Am. J.Physiol. 271, R42-R47.
Devoto, S. H., Melacon, E., Eisen, J. S. and Westerfield, M. (1996).Identification of separate slow and fast muscle precursor cells in vivo, priorto somite formation. Development122, 3371-3380.
DeWitt, H., McCleave, J. D. and Dearborn, J. H. (1976). Ecological studiesof fishes and echinoderms during ARA Islas Orcadus cruise 5. Antarct. J.US11, 49-53.
Díaz-Uriarte, R. and Garland, T., Jr (1998). Effects of branch length errorson the performance of phylogenetically independent contrasts. Syst. Biol.47, 654-672.
Dunn, J. S. D., Archer, S. D. and Johnston, I. A. (1989). Muscle fibre typesand metabolism in postlarval and adult stages of Notothenioid fish. PolarBiol. 9, 213-223.
Eastman, J. T. (1993). Antarctic Fish Biology: Evolution in a UniqueEnvironment.322p. San Diego: Academic Press.
Eastman, J. T. (1997). Phyletic divergence and specialization for pelagic lifein the Antarctic notothenioid fish Pleuragramma antarcticum. Comp.Biochem. Physiol. 118A, 1095-1101.
Eastman, J. T. and Eakin, R. R. (2000). An updated species list fornotothenioid fish (Perciformes; Notothenioidei), with comments onAntarctic species. Arch. Fish. Mar. Res.48, 11-20.
Egginton, S., Stilbeck, C., Hoofd, L., Calvo, J. and Johnston, I. A. (2002).Peripheral oxygen transport in skeletal muscle of Antarctic and sub-Antarctic notothenioid fish. J. Exp. Biol.205, 769-779.
Felsenstein, J. (1985). Phylogenies and the comparative method. Am. Nat.125, 1-15.
Fernández, D. A., Calvo, J., Franklin, C. E. and Johnston, I. A. (2000).Muscle fibre types and size distribution in sub-Antarctic notothenioid fishes.J. Fish Biol. 56, 1295-1311.
Fisher, W. and Hureau, J. C. (1985). FAO Species Identification Sheets forFishery Purposes, Southern Ocean, vol 2. Rome, Italy: FAO.
Freckleton, R. P., Harvey, P. H. and Pagel, M. (2002). Phylogenetic analysisand comparative data: a test and review of evidence. Am. Nat. 160, 712-726.
Garland, T., Jr, Harvey, P. H. and Ives, A. R. (1992). Procedures for theanalysis of comparative data using phylogentically independent contrasts.Syst. Biol.41, 18-32.
Garland, T., Jr, Midford, P. E. and Ives, A. R. (1999). An introduction tophylogenetically based statistical methods, with a new method forconfidence values on ancestral values. Am. Zool. 39, 374-388.
Gon, O. and Heemstra, P. C. (ed.) (1990). In Fishes of the SouthernOcean. Grahamstown, South Africa: J. L. B. Smith Institute ofIchthyology.
Greer-Walker, M. G. (1970). Growth and development of the skeletal musclefibres of the cod (Gadus morhuaL.). J. Cons. Perm. Int. Explor. Mer.33,228-244.
Hall, T. A. (1999). BioEdit: a user-friendly biological sequence alignmenteditor and analysis program for Windows 95/98/NT. Nucl. Acids. Symp. Ser.41, 95-98.
Hochachka, P. W. (1986). Defense strategies against hypoxia andhypothermia. Science231, 234-241.
Iwami, T. (1985). Osteology and relationships of the family Channichthyidae.Mem. Natl. Inst. Polar Res. Ser. E, pp. 1-69.
Jobling, M. (1994). Fish Bioenergetics.London: Chapman and Hall.Johnston, I. A. (1987). Respiratory characteristics of muscle fibres in a fish
(Chaenocephalus aceratus) that lacks respiratory pigments. J. Exp. Biol.133, 415-428.
Johnston, I. A. (1989). Antarctic fish muscles-structure, function andphysiology. Antarct. Sci.1, 97-108.
Johnston, I. A. (2001). Genetic and environmental determinants of musclegrowth patterns. In Muscle Development and Growth. Fish Physiology, vol.18 (ed. I. A. Johnston), pp. 141-186. San Diego: Academic Press.
Johnston, I. A., Calvo, J., Guderley, H., Fernández, D. A. and Palmer, L.(1998). Latitudinal variation in the abundance and oxidative capacities ofmuscle mitochondria in Perciform fishes. J. Exp. Biol.210, 1-12.
Johnston, I. A., Clarke, A. and Ward, P. (1991). Temperature and metabolicrate in sedentary fish from the Antarctic, North Sea and Indo-West PacificOcean. Mar. Biol. 109, 191-195.
Johnston, I. A., Fitch, N., Zummo, G., Wood, R. E., Harrison, P. and Tota,B. (1993). Morphometric and ultrastructural features of the ventricularmyocardium of the haemoglobin-less icefish, Chaenocephalus aceratus.Comp. Biochem. Physiol. 76A, 475-480.
Johnston, I. A., Manthri, S., Robertson, B., Campbell, P., Mitchell, D. andAlderson, R. (2000). Family and population differences in muscle fibrerecruitment in farmed Atlantic salmon (Salmo salar). Basic Appl. Myol. 10,291-296.
Johnston, I. A., Strugnell, G., McCraken, M. L. and Johnstone, R. (1999).Muscle growth and development in normal-sex-ratio and all-female diploidand triploid Atlantic salmon. J. Exp. Biol.202, 1991-2016.
Johnston, I. A., Vieira, V. L. A., Fernández, D. A., Abercromby, M.,Brodeur, J. C., Peck, L. and Calvo, J. (2002). Muscle growth in polar fish:a study of Harpagifer species with sub-Antarctic and Antarctic distributions.Fish. Sci. 68 Suppl. II, 1023-1028.
Klingenberg, C. P. and Ekau, W. (1996). A combined morphometric andphylogenetic analysis of an ecomorphological trend: pelagization inAntarctic fishes (Perciformes; Notothenioidei). Biol. J. Linn. Soc. 59, 143-177.
Koumans, J. T. M. and Akster, H. A. (1995). Myogenic cells in developmentand growth of fish. Comp. Biochem. Physiol. 110A, 3-20.
Lecointre, G., Bonillo, C., Ozouf-Costaz, C. and Hureau, J. C. (1997).Molecular evidence for the origins of Antarctic fishes: paraphyly of theBovichtidae and no indication of monophyly of the Notothenioidei(Teleostei). Polar Biol. 18, 193-208.
Londraville, R. L. and Sidell, B. D. (1990). Ultrastructure of aerobic musclein Antarctic fishes may contribute to diffusive fluxes. J. Exp. Biol.150, 205-220.
Mark, F. C., Bock, C. and Pörtner, H. O. (2002). Oxygen-limited thermaltolerance in Antarctic fish investigated by MRI and 31P-MRS. Am. J.Physiol. Regul. Integr. Comp. Physiol.283, R1254-R1262.
Montgomery, J. and Clements, K. (2000). Disaptation and recovery in theevolution of Antarctic fishes. Trends Ecol. Evol. 15, 267-271.
Moylan, T. J. and Sidell, B. D. (2000). Concentrations of myoglobin andmyoglobin mRNA in heart ventricles from Antarctic fishes. J. Exp. Biol.203, 1277-1286.
O’Brien, K. M. O., Skilbeck, C., Sidell, B. D. and Egginton, S.(2003).Muscle fine structure may maintain the function of oxidative fibres inhaemoglobinless Antarctic fishes. J. Exp. Biol.206, 411-421.
Pörtner, H. O. (2002). Physiological basis of temperature-dependent
I. A. Johnston and others

2609Muscle growth in Antarctic fishes
biogeography: trade-offs in muscle design and performance in polarectotherms. J. Exp. Biol.205, 2217-2230.
Reynolds, R. W. and Smith, T. M. (1994). Improved global sea surfacetemperature analyses. J. Climate 7, 929-948
Ritchie, P. A., Lavoue, S. and Lecointre, G. (1997). Molecular phylogeneticsand the evolution of Antarctic notothenioid fishes. Comp. Biochem. Physiol.118, 1009-1025.
Romanello, M. G., Scapolo, P. A., Luprano, S. and Mascarello, F. (1987).Post-larval growth in the lateral white muscle of the eel, Anguilla anguilla.J. Fish Biol. 30, 161-172.
Rowlerson, A., Mascarello, F., Radaelli, G. and Veggetti, A. (1995).Differentiation and growth of muscle in the fish Sparus aurata(L.): IIHyperplastic and hypertrophic growth of lateral muscle from hatching toadult. J. Mus. Res. Cell Motil. 16, 223-236.
Rowlerson, A. and Veggetti, A. (2001). Cellular mechanisms of post-embryonic muscle growth in aquaculture species. In Muscle Developmentand Growth. Fish Physiology, vol. 18 (ed. I. A. Johnston), pp. 103-140. SanDiego: Academic Press.
Small, D. J., Moylan, T., Vayda, M. E. and Sidell, B. D. (2003). Themyoglobin gene of the Antarctic icefish, Chaenocephalus aceratus, containsa duplicated TATAAAA sequence that interferes with transcription. J. Exp.Biol. 206, 131-139.
Smialowska, E. and Kilarski, W. (1981). Histological analysis of fibers in
myotomes of Antarctic fish (Admiralty Bay, King George Island, SouthShetland Islands). I. Comparative analysis of muscle fiber size. Pol. PolarRes. 2, 109-129.
Stankovic, A., Spalik, K., Kamler, E., Borsuk, P. and Weglenski, P. (2001).Recent origin of sub-Antarctic notothenioids. Polar Biol. 25, 203-205.
Steffensen, J. F. (2002). Metabolic cold adaptation of polar fish based onmeasurements of aerobic oxygen consumption: fact or artefact? Artefact!Comp. Biochem. Physiol. 132A, 789-795.
Stoiber, W. and Sänger, A. M. (1996). An electron microscopic investigationinto the possible source of new muscle fibres in teleost fish. Anat. Embryol.194, 569-579.
Tota, B., Cerra, M. C., Mazza, R., Pellegrino, D. and Icardo, J. (1997).The heart of the antarctic icefish as paradigm of cold adaptation. J. Therm.Biol. 22, 409-417.
Vayda, M. E., Small, D. J., Yuan, M., Costello, L. and Sidell, B. D. (1997).Conservation of the myoglobin gene among Antarctic notothenioid fishes.Mol. Mar. Biol. Biotechnol. 6, 207-216.
Weatherley, A. H., Gill, H. S. and Lobo, A. F. (1988). Recruitment andmaximum diameter of axial muscle fibres in teleosts and their relationshipto somatic growth and ultimate size. J. Fish Biol. 33, 851-859.
Willemse, J. J. and Lieuwma-Noordanus, C. (1984). The generation of‘new’ white muscle fibres by budding in the lateral musculature of elvers,Anguilla anguilla(L.) during normal development. Experientia40, 990-992.

Inside JEB2527
THE JOURNAL OF EXPERIMENTAL BIOLOGY 206 (15)
Since the Antarctic Polar Front developedmore then 20 million years ago,temperatures in the southern-mostcontinent have fallen, forcing many of thespecies trapped there to adapt as theclimate hardened. Notothenioid fishcomprise more then 50% of the species inAntarctica’s waters, and one of theirresponses to the harsher conditions hasbeen to increase their muscle fibre size.Could the fishes’ larger muscle fibres be aderived feature that emerged asNotothenioid species diverged? IanJohnston was intrigued by the enormousmuscle fibres, but to get to the bottom ofthe evolutionary question, he says ‘youcan’t just look at the fish in the context oftoday’s environment’ because not all of thefish have stayed firmly trapped inAntarctica’s icy conditions; some havereturned to the warmer waters near Tierradel Fuego. So the species that passed timein Antarctica experienced very differentclimatic conditions to the Notothenioidsthat stayed put in warmer waters. If he wasgoing to be able to compare the fishes’
muscle structures, without interferencefrom the fishes’ confusing climatic past,Johnston would need to build theNotothenioid’s family tree (p. 2595.
But it took Johnston four years of traveland help from colleagues at the BritishAntarctic Survey before he had collected16 species of Notothenioid fish fromAntarctica, as well as the warmer watersaround Tierra del Fuego and in the BeagleChannel. Back in the lab, Johnston andhis coworkers analysed the fishes’ musclestructure, measuring the fibres’dimensions and counting the fibrenumbers. Then they constructed aphylogentic tree for the fish, based onmitochondrial 12S RNA, and comparedhow the muscle fibre size had changedsince the species began diverging. Fromthe tree, Johnston could see that the mostrecently derived species had the largestmuscle fibres but, more surprisingly, theyhad far fewer muscle fibres than theirdistant relatives. The loss in fibres alsofollowed a phylogentic trend.
Johnston suggests that the increase in fibrediameter could reduce the fishes’ energycosts. As the fibre’s diameter increases, itssurface-to-volume ratio decreases, and sothe fibre requires fewer energetically costlyion-pumping proteins to maintain its ionicbalance. By reducing the number of pumpsin the fibre’s membrane the fish willpotentially conserve energy, which they canthen divert to other metabolic demandssuch as antifreeze production to protectthemselves from Antarctica’s perishingconditions.
10.1242/jeb.00491
Johnston, I. A., Fernández, D. A., Calvo, J.,Vieira, V. L. A., North, A. W., Abercromby,M. and Garland, T., Jr (2003). Reduction inmuscle fibre number during the adaptiveradiation of notothenioid fishes: aphylogenetic perspective. J. Exp. Biol.206,2595-2609.
Kathryn [email protected]
© 2003 The Company of Biologists Ltd
Pete Jeffs is an illustrator living in Paris
FISH FIBRES FOLLOW PHYLOGENY