reduction of medicaid expenditures from state prescription programs in illinois and wisconsin
DESCRIPTION
Reduction of Medicaid Expenditures from State Prescription Programs in Illinois and Wisconsin. Donald S Shepard, PhD* Desiree Koh, * Cindy Thomas, PhD* Grant Ritter, PhD* Daniel Gilden,+ William Stason, MD,MS* Christine Bishop, PhD* *Brandeis University; +JEN Associates - PowerPoint PPT PresentationTRANSCRIPT

Reduction of Medicaid Expenditures from State Prescription Programs in
Illinois and Wisconsin
Donald S Shepard, PhD* Desiree Koh, * Cindy Thomas, PhD*Grant Ritter, PhD* Daniel Gilden,+ William Stason, MD,MS*
Christine Bishop, PhD*
*Brandeis University; +JEN Associates
Supported by the Centers for Medicare & Medicaid Services under Contract No. CMS 500-00-0031/T.O. #2 to Brandeis
University
AcademyHealth Annual Research Meeting,June 8-10, 2008

22
Framework
Prescription coverage
Better use of drugs
and medical services
Maintain health Lower
nursing home use
Less Medicaid
entry

33
Past research
Rector (2004), Safran (2005), Leung (2005) – About 30% of low income people skip some prescribed medications
Soumerai et al. (1991) –Limiting drugs to vulnerable population increased nursing home admissions
Gilman (2004) – Members of Prescription Assistance Programs (PAP) skip fewer doses than comparable controls
Shepard (2006) – SeniorCare halved risk of skimping
Leung (2005) – Risk is related to individual characteristics

44
Program background In mid-2002, Illinois and Wisconsin initiated
“SeniorCare” (SC) pharmacy assistance programs (PAPs) that provide low-income persons aged 65+ with publicly funded prescription drug assistance.
Maximum co-payments per prescription are generally $4 in IL and $15 in WI.
Enrollees with incomes up to 200% of the federal poverty limit (FPL) are funded under a Medicaid waiver designed to help seniors improve prescription drug use, maintain health and reduce financial vulnerability due to prescription costs.

55
Three strata studied 68,292 Wisconsin members, who were all
new enrollees (1,189 interviewed), 121,000 Illinois members previously in
Circuit Breaker, a limited PAP that excluded mental health and gastro-intestinal drugs and automatically rolled over into SC (termed ‘IL rollovers, 374 interviewed);
47,782 Illinois members not previously in this PAP (termed ‘IL new,’ 664 interviewed).

66
Skimping by Income Group

77
Study Design for Medicaid Analysis
Ohio served as the comparison state. Using Medicare claims and zip codes,
matched Illinois and Wisconsin enrollees exactly on demographic and disease categories to similar Ohio Medicare beneficiaries.
Used propensity scores to match closely on disease severity and socio-economic characteristics based on census information and Social Security benefits.

88
Population Studied
Needed precise matching on income for examining Medicaid entry
Limited this analysis to buy-in Medicare beneficiaries in the three states Received subsidies for Medicare premiums
and deductibles Qualified Medicare Beneficiaries, QMB Special Low Income Medicare Beneficiaries,
SLMB We matched 7,699 Illinois and 1,798
Wisconsin buy-in beneficiaries to comparable buy-in Ohio controls.
99
Research Objective:Evaluate First Year Impacts on
Nursing home entry Medicaid entry Medicaid expenditures

1010
Approach
Descriptive analysis Multivariate analysis

1111
Nursing Home Entry among Wisconsin Buy-in Beneficiaries and Matched Ohio Controls

1212
Medicaid Entry amongWisconsin Buy-in Beneficiaries and
Matched Ohio Controls

1313
Hazard Function for Nursing Home Entry, Wisconsin, part 1
Variable Parameter Estimat
e
Standard Erro
r
Statistical Signifi-cance
Hazard Rati
o
Inpatient 0-3 Months of Index 0.858 0.289 0.003 2.357
Home Health 0-3 Months of Index 0.055 0.544 0.919 1.057
SNF 0-3 Months of Index 0.179 0.824 0.828 1.196
2001 JAI Morbidity Score 0.097 0.065 0.136 1.102
2001 Indicator for a Arthritis diagnosis 0.013 0.243 0.957 1.013
2001 Indicator for a Chronic heart disease diagnosis
-0.244 0.251 0.332 0.784
2001 Indicator for a Congestive heart failure diagnosis
0.364 0.309 0.238 1.439
2001 Indicator for a COPD diagnosis -0.393 0.272 0.149 0.675
2001 Indicator for a Cerebrovascular disease diagnosis
0.205 0.332 0.536 1.228
2001 Indicator for a Diabetes diagnosis -0.284 0.261 0.277 0.753

1414
Hazard Function for Nursing Home Entry, Wisconsin, part 2
Variable Parameter Estimat
e
Standard Erro
r
Statistical Signifi-cance
Hazard Rati
o
SSA Dept Count=1; SSA Pym (in 1,000s) 0.016 0.037 0.670 1.016
SSA Dept Count>1 -3.186 3.131 0.309 0.041
SSA Dep Count>1 * SSA Pymt (in 1,000s) 0.212 0.218 0.331 1.237
% Census Block: Income $0-$10,000 -0.267 1.233 0.829 0.766
% Census Block: Income $10,000-$20,000 -0.214 1.157 0.853 0.807
% Census Block: Income $20,000-$30,000 0.745 1.234 0.546 2.107
% Census Block: Income $30,000-$40,000 -2.037 1.498 0.174 0.130
% Census Block: Income >$40,000 0.952 1.132 0.400 2.591
% Census Block: HMO Participant -0.295 0.224 0.188 0.745
State Rx Enrollee -0.658 0.217 0.002 0.518
1515
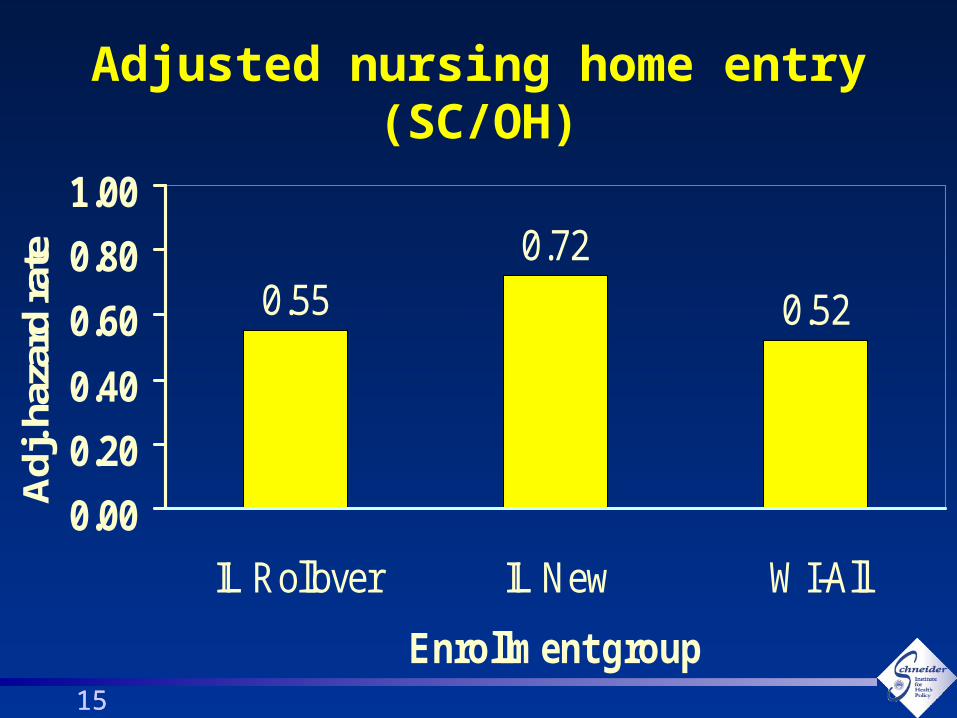
Adjusted nursing home entry (SC/OH)
0.550.72
0.52
0.00
0.20
0.40
0.60
0.80
1.00
IL Rollover IL New WI-All
Enrollment group
Adj
. haz
ard
rate

1616
Crude risk ratio forMedicaid entry (SC/OH)
1.60
0.94
0.51
0.00
0.50
1.00
1.50
2.00
IL Rollover IL New WI-All
Enrollment group
Ris
k ra
tio

1717
Relative spending per entrant (SC/OH)
0.26 0.28
0.38
0.00
0.10
0.20
0.30
0.40
0.50
IL Rollover IL New WI-All
Enrollment group
Ris
k r
ati
o

1818
Relative spending per enrollee (SC/OH)
0.41
0.260.19
0.00
0.10
0.20
0.30
0.40
0.50
IL Rollover IL New WI-All
Enrollment group
Ris
k r
ati
o

1919
Illinois summary Due to preexisting PAP, SeniorCare did not reduce
Medicaid entry, but did reduce nursing home entry and spending.
Cumulative rate of nursing home entry of Illinois SeniorCare buy-in beneficiaries (2.4%) was half the rate of the matched Ohio controls (4.4%).
Medicaid spending over the first year when averaged over all Illinois buy-in SeniorCare members (with standard errors of the mean) was $631 ($26) vs. $1,605 ($83) for matched buy-in Ohio controls
Per enrollee savings $974 ($87) or 61%. Savings in Illinois did not quite equal the state’s share of
first-year program costs per enrollee year ($1,394).

2020
Wisconsin summary
SeniorCare buy-in enrollees had half the rate Medicaid entry in the first year (11%) than matched Ohio controls (22%)
Wisconsin SC had half the rate of nursing home entry (2.2%) compared to Ohio controls (4.5%)
Had $1,190 ($163) or 81% lower Medicaid spending per buy-in enrollee.
Wisconsin savings on buy-ins were greater than the state’s share of first-year program costs per enrollee year ($1,032).

2121
Extrapolation possible?
Question: Do the data allow examining impacts on nursing home and Medicaid for all SeniorCare enrollees?
Answer: No Why not? Ascertainment of income

2222
Medicaid entry by family incomeMedicaid entry by family income, marital status, and state
0%
2%
4%
6%
8%
10%
12%
14%
16%
18%
20%
Marital status, state, and family income quintile (1 = poorest)
% E
ntr
y in
to M
edic
aid
.
1, Poorest 2 3 4 5, Richest
1, Poorest 17.9% 12.0% 8.6% 5.9%
2 11.5% 5.4% 6.7% 3.3%
3 5.6% 3.6% 4.6% 2.9%
4 3.7% 2.9% 3.2% 2.4%
5, Richest 2.3% 2.1% 2.1% 1.6%
Unmarrried, IL Marrried, IL Unmarrried, WI Marrried, WI

2323
Approximate probability of Medicaid entry
Illustrative model of Medicaid entry as a function of family income (assuming income threshold of $8000)
0%
1%
2%
3%
4%
5%
6%
7%
8%
9%
10%
11%
10 15 20 25 30
Family income ($1000)
Med
icai
d e
ntr
y p
rob
abili
ty in
on
e ye
ar
Unmarried, IL (elasticity=-0.9)
Married, IL (elasticity=-1.9)
Unmarried, WI (elasticity=-0.9)
Married, WI (elasticity=-1.4)

2424
Household incomes by neighborhood
Distribution of household incomes in neighborhood
0%
10%
20%
30%
40%
50%
60%
70%
80%
90%
100%
State, group, and maximum household income in stratum
Cu
mu
lati
ve %
of
hou
seh
old
s .
>$40,000 29% 27% 26% 29%
<$40,000 13% 13% 14% 13%
<$30,000 19% 20% 20% 21%
<$20,000 24% 25% 26% 24%
<$10,000 14% 14% 13% 12%
IL Enrollees, median $26,100
OH (matched to IL), median $25,300
WI Enrollees, median $25,300
OH (matched to WI), median $26,400

2525
Neighborhood: weak predictor of family income
Family income by marital status, neighborhood income and state
0%
5%
10%
15%
20%
25%
30%
Neighborhood income
% o
f fa
mil
ies
in lo
wes
t q
uin
tile
Missing 1, Poorest 2 3 4 5, Richest
Missing 24.5% 26.8% 25.8% 26.4%
1, Poorest 24.3% 22.8% 23.3% 21.4%
2 19.9% 19.2% 20.8% 23.2%
3 19.7% 19.1% 20.4% 21.1%
4 17.0% 16.8% 18.6% 17.1%
5, Richest 17.6% 18.3% 15.1% 15.5%
Unmarried, IL Married, IL Unmarried, WI Married, WI

2626
Unsuccessful extrapolation beyond buy-ins
0.92
0.93
0.94
0.95
0.96
0.97
0.98
0.99
1.00
1 2 3 4 5 6 7 8 9 10 11 12 13 14 15 16
Follow-up Months
Pro
po
rtio
n N
ot
En
teri
ng
Med
icai
d
Illinois SeniorCare
Ohio Comparisons
IL:Rollover Enrollees
IL:Later Month Enrollees

2727
Conclusions
50% reductions in skimping applied to all SeniorCare enrollees
Comparable declines in nursing home entry among buy-ins.
First year savings in buy-in population not quite enough to pay for the program costs in Illinois
These savings were more than sufficient in Wisconsin.
Prescription drug coverage for vulnerable populations pays off with less nursing home entry and lower costs.

2828
Limitations
Differences in nursing home and Medicaid policies among states could confound interpretation

2929
Strength: Consistent improvements in
Self reported behavior (skimping) Costly services (nursing home entry) Medicaid expenditures

3030
Research implications
Observations and natural experiments very powerful.
Must understand and control for selection effects.
Stay within the data.
3131
Policy implications
Enrollment of needy elders in both states benefited from outreach, straightforward design, and federal subsidies that extended to 200% of the FPL.
These findings show the value of completing “coverage” with access to prescription drugs.
