reductionof mill scale by coal- kinetic …
TRANSCRIPT

REDUCTION OF MILL SCALE BY COAL-
KINETIC STUDY AND EFFECT OF PROCESS
VARIABLES.---"--
A ~he~Js submitted tc "[heDepa~~ment otMetallurgIcal EngineerIng, :Bangladesh Unlversl"CY 0:
:ulIllment of :1',e req,llrements for the de"ree of
M"'SI:ETSof ,,:Clence ill Englneering'.MetallUl;-glcal).
A. K. M. Matiur Rahman !
_M~yr 1993.1111111111111111111111111111111
11186084'
BANGLADESH UNIVERSITY OF ENGINEERING ANDTECHNOLOGY, DHAKA, BANGLADESH.
•
'.

iI
The undersigned recommend to the Department of Metallurgical
Engineering of Bangladesh University of Engineering and Technology
MILL SCALE BY COAL-KINETIC STUDY AND EFFECT OF PROCESS VARIABLES"
(BUET), Dhaka, the acceptance of the thesis ent~tled "REDUCTIONOF•,,
,I
,r,
\ 'I ',I \
~.,'.. ~,~\'",
Chairman( Supervisor)
Associate Professor,Dept. of Het. Eogy.BOET, Dhaka.
in Engineering (Metallurgical).
submitted by A.R.M. Matiur Rahman, B.Sc.Engg.{Het.), in partial
1. Dr. A.A. Md. Rezaul Haque
fulfilment of the requirement for the degree of Masters of Science
2. Prof. ASW KuroyMember
Head,Dept. of Met. Eogg.BUET, Dhaka.
-c: ~W-3. Prof. Ehsa 1 HaqueMember
Dept. of Het. Engg.BUET, Dhaka.
~-w-r--e-4. Dr. Mirza Khairuzzaman
Member(External)
Managing Director,National Tubes Ltd.Tongi.
\ -.

CONTENTS
DECLARA.TION
ACKNOWLEDGEMENTABSTRACT
CHAPTER -ONE
INTRODUCTION
CHAPTER-TWO
LITERATURE REVIE
2.1. Direct reductlon processes2 .1.1. Reformed natural gas based processes
2.1.1.1. Mldrex process
2.1.1.2. HYL process
2.1.1.3. FIOR process
2.1.1.4. Purofer process2.1.2. Coal based processes
2.1.2.1. Krupp process
2.1.2.2. SL/RN process
2.1.2.3. ACeAR process2.2. Analysis of kinetic data
2.2.1. Introduction
2.2.2. Isothermal klnetJ.c
2.3.3. DeterminatJ.on of kinetic parameters2.2.4. Reduced time plots
PAGE
1
3
3
5
6
6
7
8
10
11
12
,.14
15
18

CHAPTER-THREE 20
EXPERIMENTAL
3.0. Rawm.,terlals "od procedures 20
3.1. Estlmation of Total iron 22
3 • 2 • EstImation of degree of reduction 22
f"
CHAPTER-FOUR
RESULTS AND DISCUSSIONS4.0. PrelIminary selectlon of process parameters4.1. KInetIC study4.2. Effect of process varlables
4.2.1. Range of process varlables4.2.2. Effect of reactIon temperature
4 .2.3. Effect of average particle SIze
4 .2.4. Effect of coal/mlll scale ratlo4.2.5. Effect of bed depth
4.2.6. Overall correlations
4.3. OptIcal microscopyCHAPTER-FIVE
CONCLUSIONS
SUGGESTIONS FOR FUTURE WORKSREFERENCES
APPENDIX-l
24
24
25
27
27
28
2930
31
32
34
35
36
37
40

i
DECLARATION
I do, hereby declare that this work has been carried out by the
author under the supervision of Dr. A. A. Md. Rezaul Haque,
Associate Professor, Depilrtment of Metallurgical Englneering, BUET,
Dhaka, and it has not been submitted elsewhere for the award of any
other degree or diploma.
Countersigned
Supervisor Signature of the Author

ACKNOWLEOOEMENTS
The author expresses hlS deep Indebtnes5 and sincere gratltute toDr. A. A. Md. Rezaul Haque, l'Ssoclate Professor. Department of
Metallurgical Engineerlng, Bangladesh Unlverslty of Englneering andTechnology, Dhaka, Bangladesn, for hlS lnspiring guidance and
constant encouragement in all sLags:> of the study as well as in
preparIng thlS thesis.
The author is grateful to ali the teachers of the deparcment fortheir Inspiratlon and help in all aspects of the study. The autho'r
15 also grateful to Dr. MonlIDul Haque, ASSOCIate Professor.Department of Chemistry. BUE'!'. for illS suggestlons in chemical
analysis.
Thanks are also due to all the offIcers and staffs of thedepartment for their help in various sti.'lgesof the study. Theauthor is thankful to the authority of Ch~t~agong Steel M~lls Ltd.for supplying mill scales for the study.
.,
BUET, Dhaka. The Author
ABSTRACT
Mill scale from Chitta gong Steel Mills Ltd. (CSM), Bangladesh and
coal from India were used to study the effects of reactlon
temperature, coal/mill scale ratio in the reduction mlxture,
average particle size of mill scale/coal and bed depth of the
mixture on reduction kinetics. Isothermal studies were carrled out
at four different temperature levels from 1173 to 1323 K The
kinetic data of reduction flt the Ginstilng-Brounsthelll reactlonmodel
G(a) eo (1-2/3 (I) - (I-a)"
where a is the degree of reductlon.
An empirical lntegrated rate equation describlng the relationshipbetween the process variables was obtalned WhlCh can be used
conveniently to estimate the tlme for a partlcular degree of
reduction ln the range of 0.5 to 0.8. The activatIon energy for the
reduction reaction was found to be 147 kJ fmol. Within the range of
variables studIed an Increase In reactIon temperature and
coal/mill scale ratIo of the mixture results In high reduction
rate, whereas, an increase in average partIcle size and bed depth
decreases the reductIon rate.
OptIcal micrographs of the reduced masses show distinct appearance
of the metalllC phase and dlsappearance of wustite phase with tlme
and temperature.

1
CHAPTER-l
INTRODUCTION
Generally iron is produced from iron ore in blast furnaces which 15known as conventional method of lranmaking. Alternatively Iron can
be produced by direct reduction (DR) process. In this process, the,metallIC Iron IS produced by the reductIon of iren ore or other
iron oxide below the melting temperatu~e of any of the materials
involved. The product IS known as dIrect reduced Iron (DRI) cr
/ sponge iron because of its porous character, WhIChresult:; from the
manner in which the reduction is performed.
Iron oxide can be reduced by solid carbon or by a gaseous
intermediate, reformed natural gas or carbon monOXIde formed by thegasification of carbon. The former process, called direct
reduction, lS said to begin at the pOlnts of contact between theiron oxide and carbon particles. As reduction proceeds the isletsof iron, formed on the oxide surface, join together to form a shellaround the oxide core. It is assumed that the reaction progressesfurther by solution of carbon In the metallic phase to themetal/oxide interface. However, it is now universally accepted thatthe latter process i.e, indirect reductlon plays the major role ofiron oxide . ,reduct lon-.

2
In Bangladesh, there is no reserve of iron ore but large quant~tiesof mill scale are produced in the re-rolling mills every year. Onlyin Chittagong Steel Mills Ltd.(CSH}, 3600 tons of mill scale are
produced every yearl, Most of these scales are wasted. Since the
rnl11 scale is a high grade iron oxide, there is a great scope to
develop a process by which DRr can be produced frem these mIll
scales. The reduced mass (DRI) can be used as a substItute of scrapIII steelmaklng.
Although in Bangladesh there is suffIcient reserve of natural gas,
it can not be uS8d as a reducing agent without reforming. To avoid
the difficulties of reforming, coal was used as a reducing agent in•
the present study. Coal used are fInes, which are generallyproduced during transportation and storage. These fines are usuallywasted. The present study is under taken wlth a view to study theklnetic of reduction of mlll scale by coal and to studysystematically the effect of var~ous process parameters onreduction I!:lneticsand to optimise these parameters to ma.:umise theeatent of reduction. Another alm of the study is to establish anempirlcal correlation which can be convenlently used to estimatetime for a range of the degree of reduction under different processvariables such as temperature, coal/mill scale ratio, averageparticle size and bed depth. The data obtained from the study couldbe useful In the design and operation of large scale reduction
reactors.

3
CHAPTER-2
LITERATURE REVIEW
ThlS chapter deals with relevant information of DR (Direct
Reduction) processes and the analysis of KInetic Data.
2.1. Direct reduction process:
Since 1920, about 100 DR processes have been developed. Some of theprocesses are coal based whIle others are based on natural gas orreformed gas. Th•• gas based processes have certaIn advantages over
coal based proce;;ses], namely, higher producti '11ty. easier process
control, better product, higher c.:trbon content etc. Countries
haVIng resources of natural gas have gene only for gas based
processes such as HYL, Hidrex, Pureier, FIOR etc. On the other
hand, gas starved countries have to depend on coal based processessuch as SL/RN, ACCAR, Krupp etc, despite their limitations. Some ofthe important DR processes are described here.
2.1.1 Reformed natural gas based processes:
Iron oxide can be reduced by CO or H, which can be represented bythe following equations:
f

4
3Feh • CO " 2Fep~ • CO, ---------2.1
rep, • CO " 3FeO • CO, ---------:2,2,
FoO • co " Fe • CO, --------;2.3,
3 Fep, • H , 2Fe,Oj • H,O -------- 2.4, •
Fep! • H, , 3FeO • HiD -------- 2.5,FeO • H. , Fe • HiD --------3-.6,
The reformed gas, which 1S rich in co and Hi is produced by
reforming natural gas primarily methane, in catalyst filled
reformer tubes. The COand H~are gener:;ted in CHI-steam reformIng
processes according to the reaction:
3H., 2.7
High steam/carbon ratIos were once requIred to prevent carbon
formatIon in the reformer tubes and catalyst deterioration, The
resultant redUCIng gas then had to be cooled to remove excess watervapour and reheated, before the redUCIng gas could be used toreduce iron oxide. However, modern catalysts now permIt operationwith stearn/carbon ratios approaching the stoichiornetrl.c ratio, this
producing a mixture of Hi and CO of 95%purity (wet basis). Thus
energy saving is achieved by lower steam usage and eliminatlon of
reheating of the reducing gas.

5
2.1.1.1 Kidrex process ( Hidrex corporation)H
The principle of this process 1S the reduction of iron ore 1n a
shaft furnace by reducing gases in accordance with the counterflow
prlilClple. The main components of the process are the shaft
furnace, the gas reformer, and the 0001109-ga5 system. Solid and
gas flows are monltored so that the process varlables can be
controlled within operating limits. The temperature _andcompositIon
of each gas stream to the shaft furnace are controlled within
spec:Lficat1on limi ts, to maintain bed temperature fer reductlon,
•degree of rnetalllzation, carburlzation level (Fe.C content), and to
ensure the most efficient utll1zation of the reducing gas.
The furnace is a steel vessel wlth an lnternal ~efractcry llDlng,
The solids are Charged continuously into the tap of the furnace
through seal legs. The reduction furnace lS designed for uniform
movement of the burden by gravlty feed, through the preheat,
reduction and coollng zones of the furnace. The cooled DRI is
continuously discharged through seal legs at the bottom of the
furnace. Insert gas is injected into the seal legs to prevent
escape of process gases. On discharge from the shaft, the DRI lS
screened for removal of flnes. The fines may be finally briquet ted
to make them a usable DRI product,
I

6
2.1.1.2 HYL( Hojalata Y Lamina, Steel company of Monetary " ,Hexico) ,
In the HYLprocess, reducing gas (rich in CO and H,) is generated,
typically by nickel-based catalytic reforming of natural gas, WhlCh
is mixed with steam before enterlng the reformer. Commercial H71
operatlons use excess steam over stolC!llOmetrlc requirements, a3
shown in equation 2.8, to prevent carbon formatlon and to promote
long catalyst life.=CO+3H.Q , 2.8
The reducing section consists of a set of four reactors, three ofWhlChare ill operation, while the fourth lS engaged in dlschargi:q9
and charging operations. The HYL process lS a cyclical batch
oper"tion, and the three on-Ilne reactors operate in series. The
reduction of the charge lS performed in two stages, an lnitlal
-reduction stage and a main reduction stage. Cooling and
carburlzation, and the flnal adjustment of metalllzation are
performed in the third stage. Each stage of operatlon takes about
three hours. An intricate system of valves permlts the reactors to
be connected in any desired order, $0 that anyone reactor can be
connected In its correct process stage.
2.1.1.3. The FIOR [Fluidized Iron Ore Reduction)processl
The FIOR process reduces iron are fines In a series of four fluid-
bed reactors. The two other major components of the FIOR process

7
are a reformer to produce the fresh reducing gas and 11briquet tedsection in which the reduced iron ore fines are compacted. The ore
is fed contInuously into the preheatlng reactor, where residual
water is driven off and the ore is heated to about aooie, The
combustion products are used to fluidize and heat the ore. As theore level builds up In the preheater, it overflows luta the first
of the three reduction reactors. Compressed reducing gas enters U.e
bottom of the lowest re"ctor and flows countercurrent to the
descending ore. Reactor top gas leaves the fIrst-stage reduction
reactor and is scrubbed and cooled to remove dust and most of thewater produced In the reduction reactIon. Dlrect-reduced iron flnes
are discharged from the flnal reactor into the briquettlng press.
2.1.1,4,. The Purofer process ( Thyssen Purofer, West Germany)" ,11
Countercurrent reduc'tlon of ores In a shaft furnace wi th gases
_obtained by reforming hydrocarbons with oxidlzlng gas is the basic
princlple of thls process. The Purofer process utilizes a shaft
furnace as the reduction reactor. The shaft furnace is charged with
lump ore or pellet. The reduclng gas lS produced by reforming
natural gas, coke oven gas or the like with recycled top gas in
regenerative gas reformers and is fed directly into the shaft
furnace. If fuel oil or coal lS used the cold gas produced in a
gasiflcation plant lS heated up in a recuperator.

are should be
8
2.1.2 Coal-based processes:
Rotary-k:Lln processes are the only commercially available coal
based DRprocesses currently operating. The main components of
these rotary-kIln systems consist of a solid-feed system, the
rotary kiln. a product cooler screen, magnetic separators, and off
gas cleaners. The baSIC technology for rotary~klln reductIonemphasizes the importance of correct select.lon of raw materials.
The Iron oxide feed (lump ore or pellets) should fulill certain
requirements regarding chemical compOSItIon, SIze, distribution and
behaviour under reducing conditIons In the rotary kiln. The feed
should have a high iron content (above 65% and preferably close to67% fer heamatite ores), and correspond1ngly the gangue content
should be low, so that cost for further processing in the eleC1::'-lc
furnace are kept as low as possible. Sulfur and phosphorus content
should also be low. The minimum s.~ze ,:,f feed
controlled also.
In rotary-kiln DRprocesses, the coal, any flux required, and the
iron oxide are charged into the high end of the inclined rotary
kiln. The burden travels through the rotary kiln by the rotat1on of
the kiln and by gravity. The burden first passes through a
preheating zone where devolatil1zat1on of coal occurs, flux is
calcined and the charge is heated to the operating temperature for
reduction. In the reductlon zone, iron oxide is reduced either by
solid carbon or COgas as represented by the following reactions

It is now universally accepted that the reductIon of iron o)l:ide
takes place by CO rather than C.At the elevated bed temperature, part of the COl reacts wlth the
carbon J.nthe char by the reaction:
9
3FePl ,C ~ 2Fepj , CO ~-----------~~9Fep! • C ~ 3FeO , CO -----------~~~OFeO ,C ~ Fe • CO -- -- - -----:2.,.'=:1:
3Fe,Q1 , CO ~ 2 Fe,Oj ,CO, -------------2.12, . ,
FePl ,CO ~ 3 FeO ,CO: ------ - - - - -2-...i3
"0 ,CO ~ " , CO. ---------~A_4,
c ,,,,\,II,,
};,
I)
\I !I ', '
"i---------------------:2.15co. + C=ZCO,In an all-coal DR process, pulverIzed coal is supplied to theburner, Fuel oil and natural gas, however, "Ire viable alternatives,
The burner operates WIth a deficiency of air tc maintain a redUCIng
atmosphere In the kIln. Additional process heat IS supplied by
.combustion of the volatile matter arid CO emerging from the kiln
bed, Combustion air 1S supplied through ports spaced along the
length of the rotary k1ln. The air flow is controlled to maint,lln
a uniform temperature profile in the reduction zone and a neutral
or slightly redUCing atmosphere above the bed. The gas flow runs
countercurrent to the flow of the solids. The solids discharged
from the rotary kiln are cooled, then screened and separated
magnetically. t,,{ ,r ",,,,
I,

102.1.2.1. Krupp cadir process( Krupp industries, West Germany}'U:
The coal-ore, direct-iron-reduction (Codir) process, marketed by
Krupp Industries of West Germany, is based on Krupp's experience In
rotary-kiln reduction dating from the 19306. Lump ore or oxide
pellets, along with SOlId reductant, dolomite or limestone as flux1£ needed, and recycled char are charged from the bins into therotary kiln. The feed size of the solids IS closely controlled toexpedite separation later in the process. TYPIcally, the preheating
zone extends from 25% to 40% along the Cadir process kiln.Primary heat IS supplied to the kiln by the combustion of finely
pulverized coal injected at the salld discharge end of the kil~.
Secondary heat is supplied by supplled air into the kiln gas space
through tubes spaced along the entire length of the klln. The
seconda~y alr 15 introduced aXlally (along the kiln centerllne) ln
the direction of the kiln gas flow and serves to burn combustibles
released from the bed. In this way, a unlform charge-temperature
profile between 950 and i05Qle is achieved 1n the reduction zone of
the kiln.
The DRr, char, coal ash, and spent flux are discharged via an
enclosed chute from the rotary kiln burner hood into a sealed
rotary cooler. Coollng is accompllshed by spraying a controped
amount of water directly on to the hot solids and by spraYlng
additional water on the outside of the cooler shell. The reduced
mass is separated from the char and ash by magnetic separation.
I i\•l •
f)(
I\,I,

11
2.1.2.2. SL/RN(Stelco-Lurgi/Republic steel-National lead}., "
Process""-
The SL/RN processes are based on research wotk carried outse~arately by two groups of companies.The 31 process was or1g1nally developed with the alm of producIngsponge iron for steel maklng furnaces, using ores rich in iron. If
ores with a low iron content were present, the ferruginous materlal
were separated from the gangue before reduction. In the RN
process(Republi::: ~teel- Natl-onal lead), the emphasls was on heat
treatment of ores, with a low iron content which were divided into
their constItuents parts-metallIC iron and gangue-after reduction.In this process, reduction of iron oxides takes place in a rotarykIln wlth a solld r~ducir;g agents.
Th~ main unit lS t.he rotary kiln, tje characteristlc feature of
which lS the serles of shell burners disposed along the length of
the kiln. These allow precise regulation of the reactlon
temperatures. The materlal discharged from the kiln lS cooled
indlrectly or directly in a cooling drum. Scr-eens and magnetic
separators are required for- the discharged material. A briquetted
press is sometimes needed for compacting the finer particles of
sponge lron.
:n" IC \,
II[,I

12
2.1.2.3. The ACCARprocess (Allis-Chalmers Corporation)l!
The Allis-Chalmers Controlled Atmosphere Reactor (ACCAR) producedhighly metallized DR! lil a ported rotary bin. Liquid, solid and
gaseous fuels, singly or lil combi~atlon. are used directly in thekiln. The ACCARkiln 1E equipped with an lntricate port system and
wlth valving arranged radially around the circumference of the kiln
and spaced uniformly along its length, for IHjUld and/or gaseous
fuel injection under the bed and for In)ection above It. The flewrates through the parts are closely controlled to malntain optimumtemperature profile and gas compoEltlon along the length of tr,e
klln. Coal and lump ore and/or oXlde pellets are charged luto thefeed end of the rotary kiln. The solids <lre heated to reductlontemperature by the countercurrent flow of hot gas. Volatile matteris released from the coal during heat-up and is carrled out In thekiln exhaust gas. As the coal and lron oXlde travel through thekiln, reduction is accomplished by the CO reduction mechanism.The final degree of reductlon is achieved by introduclng liquidand/or gaseous fuel through the kiln-shell ports near the productend of the klln as they pass under the solid bed. In passingthrough the bed, this fuel is cracked to form HJ and CO to completethe iron oXlde reduction and to provlde a protective atmosphere forthe highly metallized product. This method of fuel injectlonpermits operation without the excess of coal required to maintaina reducing atmosphere in the bed in other coal based DR processes .
•

13
Thus char recycling ~5 el1minated, Sallds are discharged from therotary kiln into a rotary cooler, where C0011Ugis accomplished
with external water spray. The DRr is separa~ed from the coal ashby magnetic separation, and is then screened to achieve coarse and
fine product separation.
•

14
2.2. ANALYSIS OF KINETIC DATA
2.2.1. Introduction
K~netic stud~es are aimed to determine the influence of variousprocess parameters on a reaction and also to explain the reactionmechanism. When a kinetic law is established and the variatlon of
the rate-constant with temperature is studied then It becomes
possible to obtain a value of activatlon energy which 15 said toindicate the reactlon mechanism. This. however, requires some
mathematical procedures and some of these are summar12ad In this
section.
2.2.2. Isothermal kinetics:
The main purpose of studying kinetiCS is to gain informatlon on the
mechanism of process and the associated kinetlc parameters.
Generally reaction rates increase e~ponentially with ~ncrease ~ntemperature. At any instant, the value of the specif~c reactionrate constant k for a process ~s the weighted mean of theindividual events that cause the transformation. If thecontribution made by the individual events changes as thetransformation proceeds then the value of k varies with theprogress of transformation or with change in temperature. Providedthat the temperature range is not too wide the temperature
15dependence of the rates of most react~ons obey the Arrhen~ous type
exponential equationll-;,.
k = A axp -!iR! ----------- 2.1€
This is often applicable to both homogeneous and heterogeneous
reactions. Whlle the so-callee. activation energy E is sa:Ld to
depend on the reaetloD mechanism, the pre-exponential factor A
depends on many factors, R is the gas constant and T is the
temperature 10 degree Kelvln.
2.2.3. Determination of kinetic parameters:
Integral Approach
During isothermal kinetic StUd:l8S the progress of a reaetloD 15
generally measured In terms of degree of converSlon which is
expressed as il and this a varies from "era to unity. <I, which IS
also known as degree of reduction means the ratio of oxygen removedfrom the feed to the total oxygen combined with iron in the feed.Values of a are plotted agaJ.nst time(t) for the given temperatures.Subsequently these data are fitted into an appropriate form ofintegrated kinetic equatJ.on. Integral expreSSJ.on of kineticequations for some reaction mechanisms are well known10. In theselaws an appropriate function of a, G(a), is shown to be

16
proportlonal to time(t). The reaction rate constant k 15 obtained
from the slope of the linear plot of G(a) versus time.
Isothermal experlments are carried out at different temperatures to
estimate the reactlon rate constants for 8i.'lch of these
temperatures. The temperature dependence of the rate constant is
then expressed as
In k " In A - E/RT -------2"'",1,'7
Hence a plot of In k against 1fT should give a straight llne whoseslape will be E/R. Thus, the slope of this linear plot glves the
value of the activation energy. The pre-exponential factor 1Sobtained from the intercept. This approach is called the lntegra!approach because it makes use of an integrated form of klnetic
equation.
Differential Approach
The integral approach calls for pr~or ident~f~cation of the
appropriate function G(a), which can only be identified by trial
and error methods. Then the reaction rate can be estimated after
linearising the basic kinetic data. This difficulty J.S not
encountered in another approach, where knowledge of the kinetic-
equation is not necessary.
At any given time the reaction rate is a function of temperature(T)
and a and, therefore , the general differential form of the rate
.. ..•... .'.'.
17
expression is expressed as
da/dt = k (Tl . f(al --------2.18where k(T) is the temperature dependent rate constant and f(a) is
an appropriate functlon of a.
substituting for k(T) from Eq. 2.16 in 2.18 we get:
da/dt "A. e::>:p -m,l .f(a)-----2.19
o Equation 2.19 can be wrltten as
J da/f(a) dt " A fJ
exp -,il.l dt 2.20
For any glven level of a the L.R.S. integral, wlth limits of zero.
and a, has a constant value. The R.H.S. integral has the value t,
Le. time required to obtaln the glven values of a at the glven
temperature.
"Thus It can be written as,
"• ----------- 2.21
or ln tl = constant + E/RT ----------;2.22
In other words plot of ln tl agalnst liT should be llnear. Again
there will be plots of various levels of a which make it possible
to calculate the activatlon energy at varlOUSstages of reactlon.
It should be noted that in the above differential approaches the
form of f(a) need not be known.However, f(a) itself maybe used to
describe the kinetics of reaetlon.

18
2.2.4. Reduced time plots
An important step in the analY616 of kinetic data of many reaetlansystems is the identificatlon of the reaction mecham.SID. In many
cases a prelimloary identification is P06S1ble uSlng the so calledreduced time plots1Ll1. Although such plots have wldely been used
in the analysis of solid state reaction but their applicatlon 10the chemical metallurgy has been l:Lffiltedn. This method can be used
to ascertain the reactlon mechanlsm and hence the appropriate
function G(a).
In reduced tlID8 plots, the kinetlc relatlonshlps are rewritten 10terms of dimenslonlss5 time uSlng the following procedureH.
we have 2.23
fraction reacted l,e a = 0.5 then g(0.5) = kt, ",' Dividing"
one obtains a modlfied form of Eq, 2,23by thl5,
Nowlet us suppose that, if to.: is. the time required to obtaln 0.5
Eq. 2.23
G(a) = G(a la'U . t/tu
G(a l = B (t/t'uJ
----------- 2.24
-----------2~ 25
where B is a constant dependent on the form of the functlon G(a).
Eq. 2.25 is dependent on the klnetic rate constant and lS
dimensionless. Thus for a particular reactlon mechanism, a single
equation of the type of Eq. 2.9 represents all kinetic data
lrrespective of the nature of the system, temperature or other
factors which affect the reactlon. Thus each mechanism has a unique
reduced time plot .
•
19
Keattach and Dollimorell have descrlbed the method of USl-ng the
reduced time plots and have given the values of t/ta.5 for different
~ values far some of the reaction mechanism.The method lnitlally lnvolved tabulation of the functlonal valuesG(o:) for varlOUS reactlon mechanisms for different a values. TheseG(a:j values are used to calculate the tIt",) values. Later plots of
the varlOUS reactlon mechanisms are obt,llned by plottlng the a
values agalnst the calculated values of tit,. ,. Reduced tlm6 plots" ,
of experimental data are superl-mposed on these master plots andthe mechaIllsm 15 identified by observlng which one of the
theoretical expression fit the experimental data.

CHAPTER-3
EXPERIMENTAL
3.0 Raw materlal and procedure:
Mlil scale from Chitta gong Steel Mliis (CSM)Ltd., Bangladesh and
coal from Indla were used In the study. The analYSls of mill scale
and coal are given In Table-l and 2 respectively. All reductlon
experlments were carr led out in mild steel crucibles of diameter
50mmand height 65 mm. Mill scale and coal of the same partlcle•
sizes were mixed thoroughly and the mixture poured into the
crUClbles. No load was applled ror compaction, only three ffilld
tapplngs were applied in each case. The crucIbles contalnlug the
reduction mlxture were heated lO an electrically heated muffle
furnace.
A reduclng atmosphere was maintalned by placing some crucibles full
of coal In the furnace. The temperature was controlled within ~5GC.
After predetermlned tlmes the samples were taken out from the
furnace and the crucibles were quenched in a water tray by placing
in such a way that they were half J.mmersed. To prevent reOltldatlon
the top of the crucibles were covered with mild steel sheets.
After cooling, the reduced masses were separated magnetJ.cally from
the charge. The reduced mass maycontain FelOI' FeO and Fe. Although
v

Fep! and Fe are magnetic.
21
FeO and FePl are non-magnet~c. Fe,O, was• •
absent in the mlll scale. Since all the different phases coeXl-st
10 each particle, the iron bearl-ng particles are easily separatedfrom char and ash. It was then crushed to -150 micron size and
analysed chemically to estimate the percentage of total iron using
standard methods'~ ,:1.
Table-l
Chemical Analysis of Mill scale used.
Element Wt. %
<t-F" 72.56
Fep! 52.60
F,O 44.36
SJ.°i 2.42
MnO 0.54Sand P o. as
Mill scale and analysis supplled by Chittagong Steel Mliis Ltd,
Chittagong and RRL, Bhubaneswar. India. respectively

22
Table-Z
The prOXImate analysis of coal used.
Element Wt.%
Moisture 3.57
Volatile Matter 34.08Fixed Carbon 52.60
Ash 9.75
3.1. EstImation of Total Iron:Total Iron was analysed by volumetric method USIng potassium
dichromate as titrating agent-and the results were verIfIed by amethod uiOlng potassium permanganate as titrating agent. Both
methods yield similar results. The methods are described InAppendix-l.
3.2. Estimation of the Degree of Reduction:Direct reduced iron (DRr) is generally characterized in terms of
degree of reduction, whIch is the ratio of weIght of oxygen removedto that of the initial total oxygen present in the oxide in
combination with Iron . when iron OXIde is reduced by a gaseous
reductant, the degree of reduction is obtained through simple

, .»'. "
23
measurement of weight loss. However, when the reductant is acarbonaceous solid, the weight loss of the charge 16 due to theremoval of o~ygen from iron o~ide as well as removal of carbon bygas1ficat1on of the carbonaceous material. It 16 not easy 1:0identify these welght losses separately and, therefore, it becomesnecessary to analyse the reduced oxide for varlOUS valence S1:acesof iron.Although standard volumetrlc methods for various valence states oflron are available, estimation of the degree of reduction uSlngthese methods suffer from several drawbacks. To avcld thedifficulties assoclated with these mult1step procedures, severalworkers have recommended some simple formula which can be used toobtaln the degree of reduction.Chernnyshev et all1 and Gonzales "et al'" have proposed a formula for
x 100
the est1mation of degree of reduction. The formula is~ Fete/ ~ % Fe;l/
~ = K (-------~-----------.-----)~ Fetel
l x % FetOtl 3.7
Where a 1S the degree of reduction, K is the ratio of weight ofiron to weight of oxygen ln mlll scale, % Felot1 and Feto/ are thepercentages of total iron in initial mlll scale and the total 1roo10 the reduced mass respectively. This equation was alsosuccessfully used by ather worker11,lu.
•

CHAPTER-4
RESULTS AND DISCUSSIONS
4.0. Preliminary selection of process parameters:
The process parameters of the present experiments were temperature,
;nill scale and coal particle Slze, coal/rolll scale ratIO and bed
dept:h. The experlmental ranges were selected after soma prelimlnary
studies. As shown In Fig. l{a) the rate of reduction decreases WIthan lncrease l-n average partlcle sIzes, WhIch IS shown in FI-g. l{a).
Flg.l(bl shOWSthat an increase in coal/mill scale ratio increases
the rate of reduction. Fig.l(c) shows that an increase in bed depthdecreases the rate of reductlon. From the above studies flnally anaverage partlcle size of 2.03 mm, coal/mill scale ratio of 0.8 and
bed depth of 38 mm were selected for the kinetic studies because aresonable degree of reduction can be ach~eved after reducing theoxides under given parameters. at 1273 K for 2 Hours. Furtherdecrease ~n particle sizes or increase ~n coal/mill scale ratiosmay not help to increase in degree of reduction significantly. Themain aim of the study was to establish a kinet~c law and calculate
the activation energy of the reaction.

25
4.1. Kinetic study:
To estab1l.sh the reaction mechanism, isothermal kinetic studies
were carr~ed out at four temperature levels namely, 1173, 1223,
1273 and 1323 K. The results are shown 10 Flg.2 . It shows plots ofthe degree of reduction in the mill scale-coal mixture
against time ( t ).
It was observed that the reaction mass took about 10 to 25 minutes
to reach the reactIons temperatures. Although the temperature
profile IS no~ truly isothermal in the initial stage of reaction,the kinetic plots seem to be quite smooth passing through origin.
This is due to the reason that from about SOOGconwards the coal
begIns to liberate volatile matter. It is well known that volatile
matter contributes to some reduction of iron oxides even at low
temperatures-l. Due to this compensating effect the plots are quite
smooth.
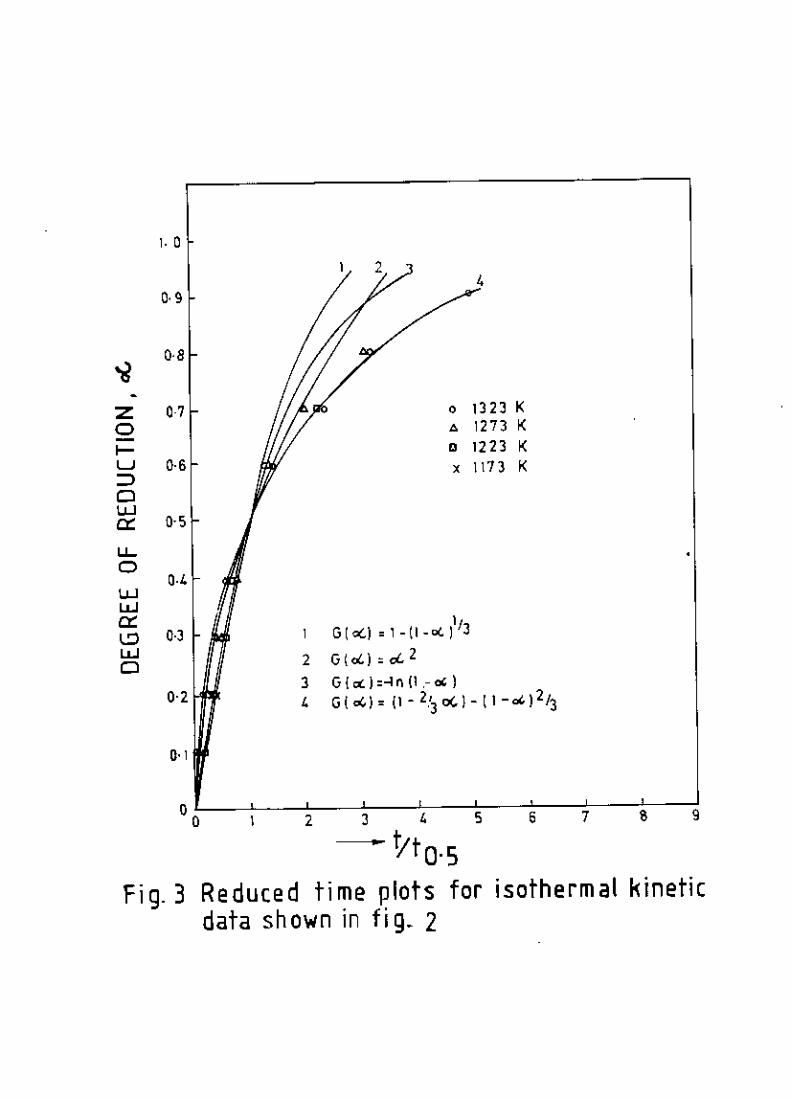
To get an :Ln:Lt:Lal:Ldea about the ku,etic law, reduced t:Lme plots
(sec. 2.2.4) were used which is shown in Fig.3. It can be seen that
four commonlysuggested models such as Spher:Lcal, Parabol:Lc, Pirst
order reaction and G:Lnstling-Brounsthe:Ln for iron oxide reduction,
the G:Lnstling~Brounsthe:Ln equation seems to be the appropr:Late one
to fit the data obtained :Lnthese studies.
Based on the findings from the reduced time plots, the data of
Fig.2 were plotted according to the Ginstling~Brounsthein equation.
G(a) " (1-2/3 a) - (l_a)li3 "kt.
The plots are shown in Fig. 4.
,

26
4.1.1. Evaluation of activation energy (E) value;
It has been prev~ously dIscussed in chapter-2 that the KInetIC datacan be analysed in two ways for the evaluation of the activationenergy (El. At fIrst, the Integral approach was used to estimate
the value of E. In this method, the reactIon rate constants of
various tempereLure were obtaIned f.nlffi the linearized plots of
Fig.4 and then were plotted accordlng to the Arrhenious type
equation. ThIS IS shown In Fig.5. The apparent activation energy ofthe process 15 thus estImated from the Arrhenious type plot (slope= -E/R) as 147 kJ/mol.The apparent actIvatIon energIes at dIfferent levels of reactionwere also estImated using differential approach. For this purposetl values at dIfferent levels of cr were estimated from the plots orFig.2 . Then In tl versus liT. K-1 plots were plotted, ."hICh areshown In Fig.6 The values of the apparent actIvatIon energIeswere in the range of 147 to 149 kJj.nol for a values in the rangeof 0.5 to 0.8. It IS thus found that apparent actIvatIon energyobtaIned by the different approaches are nearly identIcal. This maybe taken as an evidence to support the kInetic law IdentIfIed. ItIS also found that the varIation of E values with a is minor. Thisis due to the fact that the reaction mechanism remains practicallyunaltered as the reaction progress.

21
4.2 Effect of process variables:
In the present work, some additional experimental studIes were
carried out to establish quantitatIve relationship between time for
a given range of degree of reduction and various process variables.
The aim of the work is to develop an empirical correlation WhICh
can be used to estimate time for the range of 50%to 80%reduction
under dIfferent process variables. The process variables studied In
the present work are: reaction temperature (T), average particle
size (P), bed depth of the mixture (H) and coal/mIll scale ratio
(CI, similar approaches were used by other workers".
4.2.1 Range of process variables:
Table 3 summaries the ranges cf experimental conditions used III the
work. It has already been mentloned that these ranges were selected
on the basis of some preliminary pxperlments. Mill scale from
Chittagong steel Mills Ltd. and coal from lndla were used in the
experiments. Analysls of mill scale cmd coal used in the
experiments are Ilsted 1n Table 1 and 2 respectively.

28
Table-3Ranges of E~perlmental Conditions:
Parameter studied Ranges Fixed Parameters
Temperature T,K 1173- 1323
Coal/Mill scale Ratio, C 0.5- 1.0
AverageMill scale and 0.51- 2.87coal particle size, P mmBed depth of mixture, H mm 25- 51
4.2.2. Effect of reaction temperature:
T • 1273 Kc • 0.8,• 2.03 ~H • 38 ~~
Far this series of experiment, ffilll scale of 2.03 mmaverage
particle Slze were mixed wlth coal particles of same size to glve
a coal/mill scale ratio of 0.8. The mixtures were packed in the
crucibles to a bed depth of 38 mmfor each experlments. Reduction
studles were carried out at four temperature levels namely, 1173,1223,1273 and 1323 K. Fig.2 shows (f-t plots at d:Lfferent reaetl-on
temperatures. The times for various levels of a (a'0.H,gl, tg were
estimated from the plots of Fig. 2 and are presented In Fig. 7
according to Eqn 2.22 discussed earlier In chapter 2. USlng linear
regression, the time ( min.) requlred for various levels of degree
of reduction, a at the reaction temperature T {Kl are given by the
following equation:

, , '- '"
29
t,,~,S~ 2.37 , 10-: elmWil ------------- 4.1
tl,~.l ~ 3.26 , 10-5 ell1mm ------------ 4.2
tl'u.l ~ 5.57 ,10 -5 eH7i801RT ------------- 4. 3
8.79, el!j~H!Hl •••t"fi,8 ~ x 10 -------------
The act1vation energy for degree of reduct10n in the range of 0.5-0.8 15 found to vary from 147.03 to 149.67 kJ/mol over the
temperature range of 1173 to 1323 K. However, the average value,
148.04 kJ/mol 1S taken for the development of an integrated rate
equation. Fig.7 shews that the time required for a given 1I value
decreases w1th increase of reactlon temperature .
•. 2.3 Effect of average partic!e si~e:
For this series of experiments, a reaction temperature of 1273 K
and coal/mill scale ratio of O.S and bed depth of 38 rnrn were used.
Fig.S shows plot of a as a function of t for different particle
sizes. Time for various degrees of reduction, t, obtained from
these plots are presented in Fig.9. Fromthese log-log plots of t,
agalnst the average particle si~e (P), the following linear
relationship can be ohtalned for VarlOUSdegrees of reductlon.

" 23.21 pO.H6
" 35.1 p.,ill
= 50.63 pUlO
" 75.09 pUll
30
4. 5
4.6
4.7
4.8
Although the exponent of average partlcle Slze varies from 0.333 to0.466. in developing the lntegrated rate equation, the average
value, 0.41 has been taken. The results show that, wlthin the rangeof variables under study, an lncrease of average particle sl'je
decreases the rate of reductlon 1.8, time for a particular degreeof reduction increases, with increase in particle size.
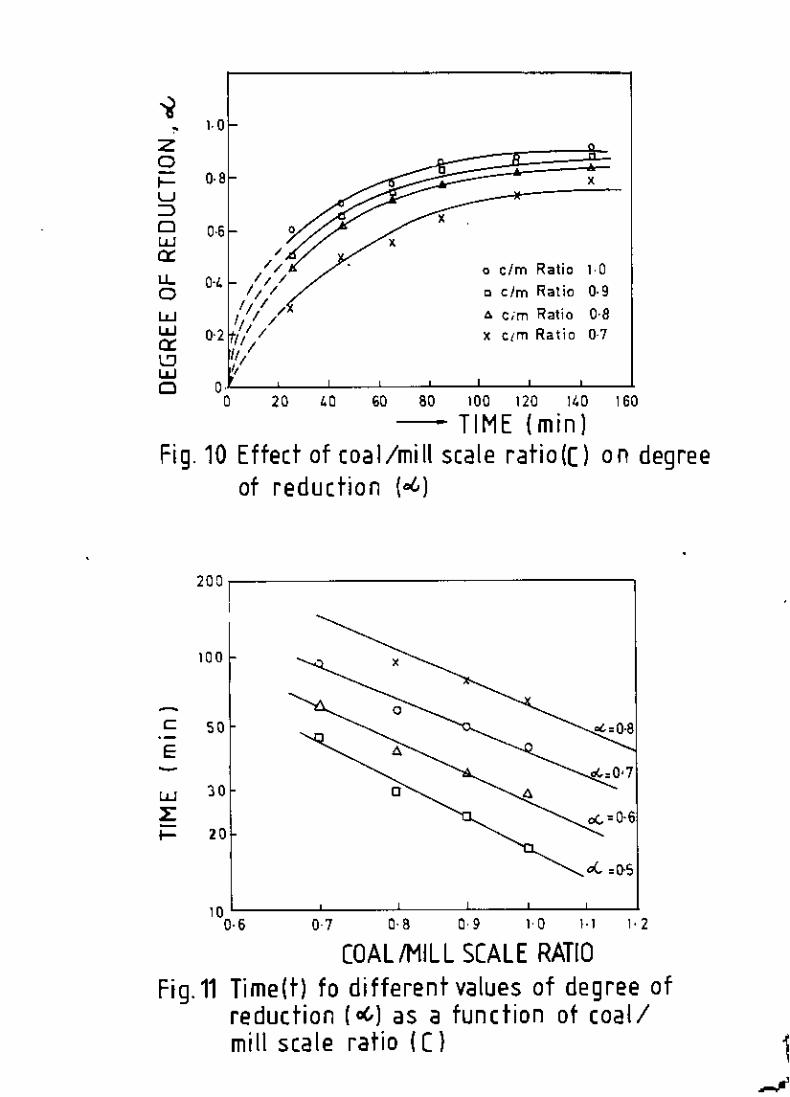
4.2.4 Effect of coal/mill scale ratlO:For these series of experiments, a reaction temperature of 1273 K,an average particle size of 2.03 mm and a bed depth of 38 mm wereused. Fig.IO shows a-t plots for different coai/rolil scale ratios.
Time for various degrees of reductlon, t., obtained from these
plots are presented in Flg.l1. The data points on a log-log plot
of tlagainst coal/mill scale ratio lie on straight lines which can
be expressed as
4.9
.' .. 4.10

31
----------------
------------------
4.11
4.12The exponent of coal/mill scale rat~o varies from -1.6 to ~3.08 anda average value of -2. 2.1 ~s taken for the development of the
integrated rate equation. Wlthin the range of coal/mill scale ratio
studles, the results show that an locrease of the ratlo increase
the rate of reductlon of mlll scale l,e the time requlred for apartlcular degree of reduction decreases IHth the increase in
coal/mill scale ratio,
4.2.5 Effect of bed depth:
Experimental parameters, p" 2.03 mm, C = 0.8. T = 1273 K were used
10 thiS series. The reqUJ.red tlmes for" values of,O.5-0.8 were
obtained from the (J-t plots shown 10 the Fig.12 . These t, values
were found to corral ate satisfactorl~Y with the bed depth (H) ofthe reduction mlxture. The followlng relationships are derived:
tl'u.5 , 0.088H1,!il --------------- 4.13
tl,u , 0.076 H1.ilO ---------------- 4.14
t"O.l, 4.43 Hij,m ----------------- 4.15
------------------ 4.16

32
Fig.13 shows a log-log plot of t, aga:Lllst H. Although the exponent
of bed depth varies from 0.725 to 1.820. Average value of 1.26 isselected for the development of the integrated rate equation. Theabove relationships show that within the range of variablesstudied, an lllcrease of the bed depth decreases the rate of
reduction.
4.2.6. OVerall correlatlons:
From the above stated correlations, it is now posslble to derive anempirical correlatlon that expresses the combined effect of
different process variables for a fixed values of a. Four suchequatlons for four values of a I a=O.5- 0.8) are stated below:
1--------------- 4.17
-----------------4.19
---------------- 4.18
t~'G_5 0 1.179 ,10') . M
,t~,u0 1.934 , 10-' . M
,t~'u.J 0 2.593 , 10-; . M
tl,o.g 0 3.974 x 10,) M. -----------------4.20where Mrepresents the term pUI HI,ll C-1,11emwm.F~g.14 shows the plots of to (a =0.5-0.8) against M for the
experimental resul ts obta~ned in four ser~es of experiments. The
four lines passed through the origin which ind~cates the val~dity
of these equations.

33
An attempt was made to develop a general lntegrated rate equationfrom the above four equations. For thlS purpose, a relationship
between various degree or reduction and respective k values wen~
obtained from the above four correlations. Flg.15 shows the log-log
plot of k, ag31nst degree of reductlon. The relationship is as
follows
4.21
Again based on the sixteen correlations obtained above namely,
equations 4.1 to 4.16 , an overall correlation was obtalned andcan be wrltten as follows:
t,j., O.5-0.ii = 6.77 X 10.1 . M. ----------- 4.22
where M"
Fig. 16 gives the plot of tl against (a"il.M) for all experlmental
results obtained in the above four series of experiments. The valueof K was evaluated to be 6.77 x 10!, whlch lS ,as expected, equalto the K value obtained by equation 4.21 . This overall correlatlonis the empirical integrated rate equation.
"

34
4.3. Optical mlcroscopy:
To study the phase changes of filII scale durlng reductlon, some ofthe particles of reduced mass were exam:ned microscoplcally.
Some optlcal micrographs of the reduced mass are snawn In Fig. 17
(a-d). The metallic phase lS seen as white areas. The grey area lS
wustlte (FeO). Pores are seen as dark areas. The lncrease of the
whlte areas are due to gradual metalllzatlon can be observed from
the micrographs. Metalllc phase and wustite are present at the
ini tlal stages of reductIon (FIg. a-c), At the later stages, there
IS little wustite and the ffilcrograph shows malnly metaillc phase
and pores ( Flg. dj
•
35
CHAPTER-5
CONCLUSIONS
The follo .•••ing cOncluSIons can be drawn from the results of thls
study;
1. The kinetic data of reductIon of mlll scale by coal fits theGinstling-Brounthein reactIon model.
G(a) • (1- 2/3 a) - (1- allil
2. The apparent actIvation energy for the reductIon of mill scalecoal mixture is 147 kJjmol.
3. The tlme reqUJ.red far reduction of mlll scale coal mixture for
a 1n the range of 0.5-0.8 IS given by the expreSSIontl'" 6.77 x 10-" al;l pell H,16 Rl1; e!lg'WIU
This is valid for the experimenta! conditIon given 1n Table 3.4. The time required for degree of reductIon (n) values 1n the
range of 0.5-0.8 decreases wIth increasing temperature and
coal/mill scale ratIo whereas it increases with increasingaverage particle size and bed depth.
5. Optical micrographs of the reduced masses show dlstlnctappearance of the metallic phase and dlsappearance of wustitephase with time and temperature.
•I
36
SUGGESTIONS FOR FUTURE WORKS
l~on oxides reduced by gaseous reductant are of superior qual~tythan that reduced by solid reductant. Bangladesh has an abundant
supply of natural gas, However, first it must be reformed so thatIt can be used as a reducing agent. This reformed gas can be usedfor both packed bed and fluldized bed reduction of iron oxide.
Study can be done on reductIon kinetics of these reductIon
processes and the effect of process varIables can also be studied.
FInally, an overall comparative study between these two processescan be dane.

37
REFERENCES:
1. Y.K. Rao: Metall. Trans .. 2, 1971,1439.
2. Production Report, Chlttagong Steel Mills Ltd .. Bangladesh,
April, 1990.
3. A. Chatterjee, R. Singh and B.D. Panday Steel India, 6,1983,57.
4. I.A. Mozer and G.H. Laferriere: Midrex direct reductlon plant.,International symposlum an the iron and steel industry. Brazil,October, 1973.
5. L.A. Te111er, I.A. Mozer and Turcotte: Direct reductlon andsteel maklng at sidbec- Dosco. Iron steel Eng., 1974, 33-39.
6. W, Karf: A new way from ore to steel US lUg the Mldrex directreduction process. 7th Annual meeting of the IISI, Johannsburg,8-10, october, 1973.
7. R.G. Quintero; New Technology, HYL publication, 1979.S. R.G. QUlntero: AIME Ironmaking Coni, 37, 1978, 137~148.9. H. Cooki: Met. Bull. Mon. June, 10(114) 1980, 29,30.10. Iron Age Metal Working International, 1966,38~39.11. H.D. Panke: The Purofer Process: Seminar on direct reductlon
of iron ores and its use in Latln America, 27 November, 1973 lnMexico Clty, Mexico.
12. F. Lucks, H. Serbent and G. Meyer: Techn. Mitt Krupp 19(4)1971, 189-195.
•

38
13. H . Serbent and H. Krainer: Techn. MItt Krupp,Forschnnqsberlchte{ Research Report), 23,1965, 49-68.
14. M.J. Fraser, C.R. Gn.gg: The EngineerIng Journal, June, 1965.
15. R.G. Meyer, Heltmana and W. Janke: Journal of Metals, June,
1966.
16. ACCAR Brochure: 1~77, MIlwaukee, wise, AllIs-chalmers Corp.17. H.S. Ray: Proc. Int. Conf. on Advances in ChemIcal Metallurgy,
Vol.2, ICMS-79, BARe Bombay, 1979, 43/11/1.
18. Rene cypres and Claire Soudan- MOInet: Fuel, 59,Jan. 1980,48.
19. Rene Cypres and ClaIre Soudan-Molnet: Fuel, 60, Jan. 1981, 33.20. S. Paul and S. Mukherjee: Non-isothermal and isothermal
reduction kInetics of iron ore agglomerates. Ironmaklng and
SteelmakiW:J, No.3, vol. 19,1992.
21. J.R. Sharp, G.W. Brindley and B.N. Narharl A char: J, Amer.
Ceram. sec. 46,1963, 364.
22. A. GleSS: J. Amar. Caram. Sec, 43,1963, 364.
23. H.S. Ray' Trans. lIM 36(11), 1983,11.
24. G.J. Keattach and D. Doillmore: An Introduction to
Thermogravlmetry. 2nd Ed. Heyden(London), Ch. 5. 1975.
25. G.E.F. Lundell, J.I. Hoffman and H.A. Brlght: Chemlcal Analysis
of iron and steel, 1950, Newyork, John Wlley and sons Inc. ,530.
26. R.S. Young; Chemical phase analysls,1974,London. Charles
Grifhn and CO.,42,49.
27. A.M. Chernnyshev, N.K. Karnilova, and ¥u.V. TerasenKo, Steel
USSR,7(13j,1977,133.

39
28. O.G. DarnGonzales and J.H.E. Jeffes: Iron makIng steel
maklng,14(5),1987 ,217.29. R. Haqus, H.S. Ray and A. Mukherjee: Proe. 7th Nat. syrup.:
Thermal analysis, Srinagar, India, 23-25 October, 198'1, Indian
Thermal Analysis Society.62,30. S. Mookherjee. A. MukherJee, B.K. Dhlndaw, and H.S. Ray, Trans.
151J, 1986, 26, 101.
31. S. Mookher]ee, H.S. Ray, and A. Mukherjee, Isothermal reductIon
of iron ore fines surrounded by coal or char fines. Ir-onmaklng
and steelmakIng, 13,1986, 229-235.
32. R. Haque, H.S. Ray and A. MukherJee: Packed bed reductlon of
iron ore fines by coal fines: effect of operating variables,
Iron makIng and steel maklng, vol.l, 1992, 31-35.
40
APPENDIX-l
VOLUMETRIC METMOD FOR ESTIMATION OF TOTAL IRON
1. Volumetric method using potassium d~chromate
0,5 gm sample was we~ghed out and d~ssolved in a 250 illl beaker with25 ml ( 1:1 ) Hel. After one hour digestion the solution was
cooled and diluted to a volume of 250 mI. 25 ml of the solutlon
was taken out 10 a conical flask and few drops of Hel were added.The solution was then heated to bOlllng. Stannous ehlorldesolution was added to It drop by dropwith constant shaking tlll theyellow colour changes to almost colourless. It was then cooled
quickly to avoid oXldation. 20 ml of HgC12solution was added. A
silky white precipitate was formed. Then again 20 ml acid mixture
was added. 2-3 drops of diphenylamine indicator was added and the
solution was titrated with O.lN KlCrp; solution. The end point was
indicated by the appearance of deep blue colour.
1 ml of 1M K.Cr..O. ,,0.05585 gm of Fe., ,.% FetDtal " 11.17 II: V (ml)

41The important reactions which take place during the determinationof total iron by this method are as follows:2 FeCI] + snCll = 2 Feel, + SuCl!
SnCI, + 2 HgClj = SnClj + H9,C1l
6 FeCI, + K;crpl + 14 Hel = 6 Feel] + 2 KCl + cr;Cli
Solution required:
3.1
3.2
t7H_03,3,
1. a.iN standard K1cr;Ol solution.
2. suCI, solution: 50 gm snCll was dlssolved in 200 ml cone. Hel and
then made upto 1 litre by adding water.3. A saturated solution of HgC1l 1-nwater at room temperature.
4. Diphenylamlne lndlcator; 1 grr, in 100 ml cone. HiSGI"
5. ACld mixture: HISG! + HjPO, + Hp (15:15;701
2. Volumetric method using potassium permanganate:
2 gms of sample was weighed out and dissolved it in lOOmi of dllute( 1:1) Hel in a beaker of 250 mI. The solutlon was warmed gently
and the heating was continued till the resldue was free from
coloured material. The solution was allowed to cool and flltered
through a hardened quantitative filter paper. The filtrate was
collected in a 250 ml volumetric flask. The solid residue on the
filter paper was then washed with very dllute Hel and allowed the
washing to pass into the flask. The solution was then made upto the
mark and shaked. 50 ml of the solution was taken out lnto a

42
conical flask and heated to bOlling. The solution was then treated
with stannous chloride to reduce into ferrous salt. The reduced
solution was poured into 400 ml of water containing 25 ml of theZimmermann-Reinhardt solution and titrated slowly with standard
a.lN Potassium permanganate to the first pInk colour which was
stable for 15 seconds.1 ml of IN KMn01" 0.05585 gIn af Fe.
% Fe. " 0.27925 x V ml,
The important reactions that tak.e place during determinatlon of
total Hon by thu; method are as follows.
2 FeCI, + snCli " 2 FeCI, t SnCl1 .1:4
Mn (III) + e " Mn(II) u
10 FeCI; + 16 Helt 2 KMnOj " 10 FeCI) + Z Kelt 2 MnCI, + 8 Hp 3.6
Solution Required:
1. Standard O.IN KMn01 solution.
2. Zimrnermann-Reinhardt's solution: 50 gm of crystalline manganesesulphate in 250 ml of water, adding a cooled mixture of 100 mlof conc. H1SOj and 30G ml of water followed by IGO ml of HlOj,
3. Snel, solutlon.
,

,
,,,,,
,
,
T,1273KC, 0,7H, 38mm
0.80
0,60
'Izo~~COow
'"~owIi'"wo , ,
-- PARTICLE SIZE, mmFig.1 (a) E~~ct of average particle size on the degree of reduction
, 0
,i
T,1273 KP,2-0)H, 38 mm
0.80
O-GO
0-. 0
"' 0'6 0-8 j,O 1-2
-- COALIMILL SCALE RATIOFig.1fbJEffr.~tof coal/mill scale ratio on the de ree of reduction'J
,,
,
T = 1273KC = 0 7P=203mm0.60
0.6 0
0-40
25 3----=-.-BED OEPnUnm 65
Fig.1{c)Effect of bed depth on the degree of reduction
zo~~coow
'"~ww
'"i3o
,.

-g- '.0
z0-•••• 08W::>Cl"-' 060: ,u.. ,0 0' ,
/
"-' ' , 0 13 23 K
"-' I / 6 1273 K0: o 1 ' / / a 1223 K
'" /,
"-' U, '173 K
Cl ",00 10 " 60 80 "0 '10 "0 "0
TIME,t(min)Fig.2 Kinetics of isothermal reduction of mill scale by coal
0'~
Z 07 0 1323 K0 • 1273 Ke- o 1223 Ku 0-' , \ \7 J K=>Dwcr: 0-5u..0 0-'WWcr: ';'" 0-' GI«:)='_(I_~13w 2 G(o::.)=c:l.2D , G{",)=.-1I'l(l ,-oG)
0-2 , G( 0::.) = (1 - 2"3 0<..) -11-",,)2'3
0-,
°0 2 3 , 5 6 7 e 9
• VtO-SFig_ 3 Reduced time plots for isothermal kinetic
data shown in fi g. 2

0.30
0.25 o 1323 K0
N-J:!' '" 1273 K1:1 1223 K-¥ o. 20 x 1173 K
I~- 0.15 •,-¥ .""mN 0I (l.05 0~- ,
oo 20 /'0 60 80 100 120 1/'0 160--TIME (mini
Fig.4 Plots for isothermal kinetic data accordingto Ginstling-Brounsthein reaction equation
60
65
10
75
85
80-
907.0 7.5 6.0 '?l.5 9.0 9.5
-~- 104fT K-1. ,Fig.5 Arrhenius type plots for kinetic data of fig. 4
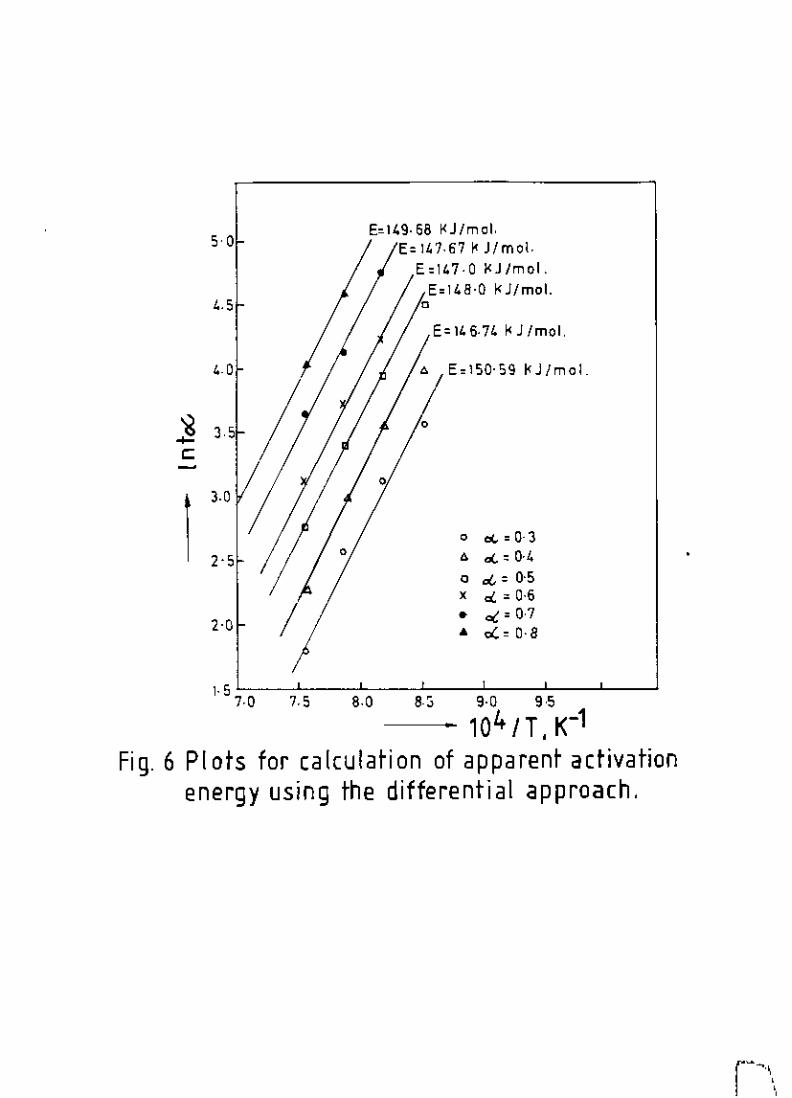
50 E~149.68~Jfmol.E= 10.67 ~ JlmoLE:I47.0 I<J/mol.E=14!1.Q k"llmal.
'5 0
E=146.74I<J/mol.
'0 • E=lSO.59I<J/mol.
j 35c:-
I J.O
0 0(,=0-3,., • .,(.=0.40 d." = 0-5, d.. = 0.6• oi = 0.7
H • 0(.=0.8
, 57.0 7.5 8.0 8.S 9.0 9.5
104/T K-1•Fig.6 Plots for calculation ot apparent activation
energy using the differential approach.

200
50
c;E•w
::E 20
••••
'0
5 ,.. 76 7 • '0 '.2 ,.,
Fig. 7 Time (t) for different values of degree ofreduction (06) as a function of temperature ITI.

, a
TlME,lmin)Fig.B Effect of average particle size IPI on degree
of reduction {o(,)
a.' n,,,u, 0 0,51 m m0.' II,II; /
0 "12 mm• 2'03 mm I 1\,N
0.2 If I , 2,87 mm I t" I/I
a I ta 20 " 60 80 >00 '20 '40 '60
0.8zoFu::>Clu.Ja:U-ou.Ju.Ja:'"u.JCl
200
>00
>00.3 0.5 2. 3 5
PARTICLE SIZE,mmFi g. 9 Time!t) for different values of degree of
reduction (01.) as a function of averageparticle size (PI
• '0
'60
on degree
,
6 Cim Ratio)( tim Ratio
" elm Ratio 1.0c elm Ratio 0.9
0807
o o 20 40 60 80 100 120 140
--TIME (min)Fig 10 Effect of coal/mill scale ratio(C)
of reduction (06)
zoI-u::Jowa::u..owwa::'"wo
200
'00
-c so ..:. = 0.8
E- =0-7w 30LI- 20
"0.' 07 o 8 o ,
Fig.11COALIMILL SCALERATIO
Time(t) fo different values of degree ofreduction (06) as a function of coal/mill scale ratio (C)

o 25.~ mmo 31.75 mm038-1 mm
x /'4./'5 mm
o o
0'
08
0.2
06
~ '.0
20 I,Cl 60 80 100 120 140 160
TIME (min)Fig.12 Effect of bed depth IH) on degree of
reduction (06)
za-,...u::0oLWa::u..aLWLWa::iilo
•
BED DEPTH,mmFig. 13.Time (t) for different va[ues of degree of
reduction (0/,) as a function of bed depth (H)
200
>00
- so
,31. 36 384030 J 22B26
0(:[}.8
0, 0(,=0.7, •,cf.,- [}.6
• 88 ,,(.: [).5
820
30
""
Ec:
-LW
:E,...

9•76;,32o 0
"" /d.' O.at: 0-7- '00c; /"1-
E- 80~•
w 60>:I-
40 -20
[ P. 041 eZ'Z1 H. 1.Z6 e 148043/RT J
Fig.14 Correlation tor 0(,=05,0.6,07 and 0.8

\toE-07
lE-07\
3\ E-07
'E-O?
\~ y-
>07
\1.!;.-07
o O.2~O.50 0.75 1,0 1-25 1.50 1.75,'" 2j1PO' 41 H.126 C: 221 e 146043 /RT J
Fig. 16 rrall correlation
._- .-
'00
-c 80.-E- 0
~ 50 00
wL•••••
40
20

( a )
--~
I c )
-~
{ b J
( d I
Fig'. 17. Optical r,licrographs of reduced massesproduced at .
{al 900°C after 70 min. (oG= 0'46 J x 600(b11000oC after 50 min. (0(.= 064 J x 600(c)1050°C after 50 min. (<t=078 J x600(dJ.1050't after 140 min. (0(,=0.96 J x600