ref. no. ivl 001/08/2021
TRANSCRIPT

0
]
Ref. No. IVL 001/08/2021
5 August 2021
The President
The Stock Exchange of Thailand
Subject: Submission of Quarterly Review of Financial Statements and the Management
Discussion and Analysis of Indorama Ventures Public Company Limited for the second quarter
ended June 30, 2021
We are pleased to submit:
1. Consolidated and Company only Quarterly Review of Financial Statements for the second
quarter of 2021 (a copy in Thai and English)
2. Management Discussion and Analysis (MD&A) for the second quarter of 2021 (a copy in Thai
and English)
3. Company's performance report, Form 45 for the second quarter of 2021 (a copy in Thai and
English)
Please be informed accordingly.
Sincerely yours,
Mr. Aloke Lohia
Group CEO
Indorama Ventures Public Company Limited
Company Secretary
Tel: +662 661 6661
Fax: +662 661 6664
1
2Q 2021 Performance Highlights
- Reported EBITDA of US$ 552M and Core EBITDA of US$ 477M - Reported net profit of THB 8,340M, a growth of 39% QoQ - Core net profit of THB 6,641M, a growth of 72% QoQ - Core ROCE of 12.9%, up 443bps QoQ and up 715 bps YoY - Project Olympus yielded US$ 116M in efficiency gains in 1H21, on track to our 2021 target of
US$ 287M - Acquisition of CarbonLite’s recycled PET asset in USA, making IVL the largest global producer
of rPET resin
Overview
We take this opportunity to appreciate the efforts of our colleagues across the globe who have been
working tirelessly and compassionately to ensure the safety and health of our IVL community. Our first
priority remains to ensure the wellbeing of our employees and their families as we together navigate
towards brighter times. We are proud of the way that our team has adapted and stepped up to the current
circumstances.
In our last report, we spoke to you of the positive sentiment taking hold globally, economies opening up
and the promise of vaccine efficacy fueling growth. With the exception of COVID resurgence in Asia,
the rest still holds true. Western economies are bouncing back, and consumer demand is booming. With
higher demand, Brent crude oil prices advanced, closing above $75/barrel in June, the first time since
2018.
IVL delivered standout results in 2Q21 and a record Core EBITDA of US$ 477M (IVOL $18M expenses
moved to extraordinary), bolstered by our global franchise, scale and leadership across our three business
segments. Our record quarterly performance includes solid operating earnings across regions. Americas
and EMEA yielded a record, performing 59% higher Core EBITDA in 1H21 as compared to 1H20,
while Asia grew by 15%. In 2020, IVL’s businesses passed the test of resiliency, and this first half of
the year has highlighted the value creation coming from our platform.
Demand for our products remained robust across all segments and all regions. We achieved higher
margins along our portfolio, leveraging on our integrated operating model and regional supply chain
advantage offsetting headwinds in the ecosystem such as shortages of key raw materials and logistics
constraints. In an environment of major disruption, IVL’s management has demonstrated agility in
responsibly navigating the ecosystem and continuing to provide value to customers.
The remainder of 2021 is expected to parallel the first half on the back of continued strong demand in
our products from opening up of travel with widespread vaccination and immunity. We anticipate
significantly improved IOD volumes with Lake Charles (IVOL) under commissioning, margins
enhancement due to strong shale gas economics and support for oxyfuel from increasing mobility.
Integrated PET margins will likely adjust to increase in supplies as container movement eases towards
year end. The semiconductor shortage is tempering some of our customer demand in the fibers segment
and the steep cost increase of polypropylene is leading to lag in pass through mechanisms for our hygiene
vertical. Overall, we see a strong 2H21 and 2022, anticipated to surpass our guidance given in the Capital
Market Day presentation in January 2021.
Organization Excellence
We continue to make steady progress on our transformation journey, comprising of various initiatives
across the organization, with two keystone programs: Project Olympus and ERP implementation.

2
Project Olympus, our company wide cost and business optimization program, remains on schedule to
achieving US$ 287M of efficiency gains in 2021, on our way towards our end target of US$ 610M by
2023. This quarter yielded US$28M incremental efficiency gains over last year, with the majority
coming from sales excellence & operational excellence initiatives. Since the program kicked off in 2020,
we have been able to achieve annual run rate of $168M total efficiency gains till 2Q21.
Our investment in one ERP system brings us one step closer to our vision of a stronger and leaner “One
IVL”. Our mission is to transform IVL’s multi-system landscape into an integrated digital core platform
that simplifies and standardizes our data, processes, and practices globally. The S4 HANA system makes
us an intelligent enterprise with smarter decision making and enables IVL’s future growth ambitions in
the digital era.
Our aim is not only to succeed at improving performance, but also to ensure our organization can sustain
these improvements over time. In this regard, our six corporate enabling functions continue to sharpen
their expertise to bring critical tools across our 3 segments in areas such as Communications,
Sustainability, Business Continuity and Digital. IVL’s transformation journey is resulting in empowered
and agile leadership across our 16 verticals.
ESG & Carbon Neutrality
Of note this quarter were three exciting developments in our carbon neutral journey.
First, IVL completed the acquisition of CarbonLite’s recycled PET asset in Texas, USA, a significant
producer of rPET in the country with long standing relationships with major brands. This site will recycle
more than 3 billion PET bottles per year, bringing IVL closer to our 2025 global target of recycling 50
billion bottles annually.
Second, the launch of IVL’s Carbon Neutral PET* pellet made with renewable energy, locally sourced
materials and low impact water transport, helping our customers on their own roadmaps towards a
carbon neutral footprint. This was launched on Deja, our sustainable brand platform, and we look
forward to introducing more innovative products later this year.
Finally, the announcement of a greenfield recycling facility in Karawang, Indonesia to process almost 2
billion PET bottles annually. It is part of IVL’s global commitment to divert post-consumer PET bottles
away from waste and back into the circular economy, supporting the Government of Indonesia’s
National Plan of Action on Marine Plastic Debris. This announcement continues our intention to build
key partnerships in the shared goal of closed-loop solutions. In the same light, in 2020 we announced
PetValue, our joint venture with Coca Cola to build the largest state of the art, bottle to bottle recycling
facility in the Philippines.
*This was mentioned in the 1Q21 MD&A as a post quarter event. Carbon Neutral PET was launched in
April 2021.
Corporate Strength and Strong Liquidity
Even after investing $246M in enhanced Working Capital needs, the strong operating cash flow &
favorable exchange rate has helped IVL to reduce Net Debt by $171M. This has resulted in a strong
liquidity position of US$ 2.02B.
Strong cash flow supported debt repayments, ensuring our deleveraging is on track. Net Operating D/E
ratio reduced to 1.06 in 2Q21, down 10bps QoQ and 26bps YoY. Our Net D/E ratio reduced to 1.27 in
June 2021 against 1.42 in December 2020 and is expected to go below 1.2 times by the end of the year.
Our deleveraging supports our growth strategy and M&A activities in our core business.

3
2Q21 Performance by our three Business Segments:
Combined PET (CPET)
Combined PET achieved a record Core EBITDA of US$ 319M in 2Q21, an increase of 23% QoQ and
42% YoY, and Reported EBITDA of US$ 403M.
CPET experienced steady demand across all products and regions due to economic rebound, improved
mobility indicators, and low pipeline inventories.
1H21 saw strong integrated PET
margins, supported by market
tightness arising from feedstock and
supply chain constraints. IVL’s
captive PTA and MEG supply
provided a major advantage in an
environment of raw material shortage
in Europe and the Americas,
highlighting IVL’s ability to respond
to customer needs with agility and
responsibility. In order to continue to
maintain reliability, we on purpose built up our inventory levels this quarter. 1H21 also experienced
improved shale gas economics and import parity adder due to rise in crude oil price.
While freight rates soared with container shortages and vessel availabilities, IVL was rightly positioned
with its geographical footprint to maximize its domestic realizations by pushing cost increases and
margins.
Major headwind this quarter came from higher Acetic Acid prices due to supply constraints, negatively
impacting the PTA business.
Second half of the year is expected to see stronger PET volumes as economies open up, especially in
Asia, and restocking of pipeline inventories, with margins being moderated by easing shipping costs.
PIA, within Specialty Chemicals, delivered very strong results this quarter due to robust demand in both
PET and Coatings end markets, supported by IVL’s ability to continue production in a disrupted supply
environment.
The recycling market continues to experience strong demand globally, with prices of recycled PET and
flakes increasing QoQ and YoY. This has resulted in higher margins, partially offset by especially high
bale prices in North America. Robust demand and rPET prices are expected to continue into Q3.
Integrated Oxides and Derivatives (IOD)
The IOD segment delivered the best quarterly results to date with a Core EBITDA of US$ 99M in 2Q21,
an improvement of 183% QoQ and 243% YoY. Reported EBITDA for the quarter was at US$ 81M. In
order to offer a fair analysis of our operating assets, management has reclassified Lake Charles Gas
Cracker (IVOL) performance to extraordinary item which is currently offline and in process of restart
in 3Q21.
IOD’s Upstream Portfolio
The upstream portion of IOD comprises of our two gas crackers in Port Neches and Lake Charles.
1H21 saw strong integrated PET
margins, supported by increasing

4
The first half of 2021 experienced strong crack margins due to tightness in ethylene supply, resulting in
2Q21 Core EBITDA of US$ 28M, up 16% QoQ, from the Port Neches facility. We foresee significant
upside in 2H21, in both volumes and margins, with the startup of our Lake Charles cracker, further
benefiting from an expected environment of strong crack margins. The shale gas advantage continues to
benefit our operations.
IOD’s Intermediates Portfolio
The intermediates portion of IOD comprises of the
MEG and MTBE businesses. This portfolio made
a negative EBITDA of US$ 5M this quarter, an
improvement of US$ 27M QoQ. This part of the
business has been the most negatively impacted by
COVID, and we are pleased to see the recovery in
performance coming from improved mobility,
increased demand and rising crude oil price. The
consequent improvement in shale gas economics
has brought back our cost advantage in North
America which is also reflected in improved
integrated MEG spreads. The successful
completion of catalyst change at one of our MEG
sites is expected to be an additional boost to
production in 2H21.
2021 has seen recovery in MTBE volumes and
prices coming from increased demand for
transportation fuels and the corresponding higher naphtha levels improving benchmark prices. The
rebound in MTBE spreads has been partially offset by unseasonably high prices of key raw materials,
butane and methanol. As economies open up and mobility increases, we see strong potential for MTBE
margins and volumes to continue to improve further.
IOD’s Downstream Portfolio
IOD’s downstream portfolio comprises of surfactants, propylene oxide (PO), propylene glycol (PG), and
purified EO. This sector delivered Core EBITDA of US$ 77M this quarter, an improvement of US$ 33M
QoQ. This portion of IOD has remained resilient to the impacts of COVID, and 2021 expected to show
more normalized performance.
The downstream products continued to experience very strong demand notably in applications for home
and personal care, agriculture, and oilfield. Healthy margins were seen across the entire portfolio and
across all geographies. This quarter we see the results of minimal production disruptions from
maintenance shutdowns and weather-related events, with all sites running full.
Propylene oxide (PO) has seen especially strong demand and margins this quarter. This is primarily
driven by high requirements of polyurethane from both the furniture and automotive industries. We see
this trend continuing well through the year.
The outlook for the downstream portfolio remains positive with continued strength in demand in 2H21
and into 2022.

5
Fibers
The Fibers segment achieved Core EBITDA of US$ 65M in 2Q21, a decrease of 10% QoQ and an
improvement of 77% YoY. Fibers achieved a Reported EBITDA US$76M in this second quarter
representing a record first half results for this segment.
Demand across all three fiber verticals has remained strong and steady since the end of 2020, however
there were certain headwinds experienced this quarter.
Lifestyle fiber volumes were negatively
impacted in Asia with lower demand
coming from the resurgence of COVID,
primarily in India and Indonesia. We
expect demand to improve as these
economies begin to open up. Raw
material supply disruptions have affected
the industry, however IVL’s captive PTA
availability has allowed our sites to
continue meeting customer needs.
Demand for mobility fibers has been
robust through the year, especially for tires in the replacement market. The semiconductor shortage has
limited new vehicle production, with some impact on automotive safety volumes. Mobility Fibers is
expecting improved demand in 2H21 coming from improved semiconductor supply to automotive
industry.
Demand for hygiene fibers has remained relatively steady in the second quarter, however this vertical
was impacted by negative lag in pass through of increased prices of key raw material, polypropylene.
This is likely to be reversed in the next quarter. Going forward, we expect to see some normalization of
hygiene fiber demand as vaccines are more widely administered and the COVID situation improves.
6
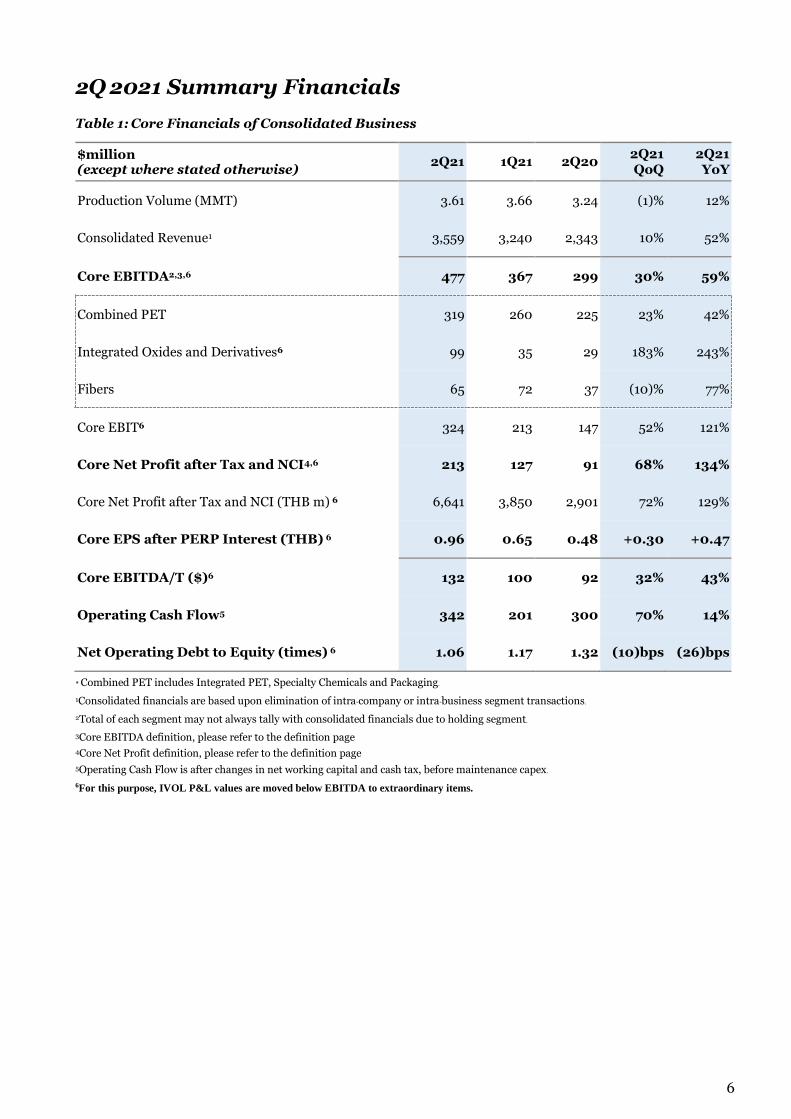
2Q 2021 Summary Financials
Table 1: Core Financials of Consolidated Business
$million (except where stated otherwise)
2Q21 1Q21 2Q20 2Q21 QoQ
2Q21 YoY
Production Volume (MMT) 3.61 3.66 3.24 (1)% 12%
Consolidated Revenue1 3,559 3,240 2,343 10% 52%
Core EBITDA2,3,6 477 367 299 30% 59%
Combined PET 319 260 225 23% 42%
Integrated Oxides and Derivatives6 99 35 29 183% 243%
Fibers 65 72 37 (10)% 77%
Core EBIT6 324 213 147 52% 121%
Core Net Profit after Tax and NCI4,6 213 127 91 68% 134%
Core Net Profit after Tax and NCI (THB m) 6 6,641 3,850 2,901 72% 129%
Core EPS after PERP Interest (THB) 6 0.96 0.65 0.48 +0.30 +0.47
Core EBITDA/T ($)6 132 100 92 32% 43%
Operating Cash Flow5 342 201 300 70% 14%
Net Operating Debt to Equity (times) 6 1.06 1.17 1.32 (10)bps (26)bps
* Combined PET includes Integrated PET, Specialty Chemicals and Packaging.
1Consolidated financials are based upon elimination of intra-company or intra-business segment transactions.
2Total of each segment may not always tally with consolidated financials due to holding segment. 3Core EBITDA definition, please refer to the definition page
4Core Net Profit definition, please refer to the definition page
5Operating Cash Flow is after changes in net working capital and cash tax, before maintenance capex. 6For this purpose, IVOL P&L values are moved below EBITDA to extraordinary items.

7
Business Segments Definitions
IVL now categorizes its businesses in three segments. This section of the document will discuss the performance of these three segments.
Combined PET
Integrated PET
Full PET value chain
PX (Paraxylene), PTA (Purified terephthalic acid), PET (Polyethylene terephthalate), and Recycling
Specialty Chemicals
Specialty PET-related chemicals (for medical, premium bottles, films and sheets); PIA (Purified Isophthalic Acid, for PET production, unsaturated polyester resins and coatings); NDC (Naphthalene Dicarboxylate, for optical displays and industrial/mobility uses)
Packaging PET preforms and packaging (e.g. bottles) for beverage and food end uses
Integrated Oxides and Derivatives
Includes Integrated EG, Integrated Purified EO, PO/MTBE and Integrated Surfactants including EOA, LAB and others
Fibers Polyester, Rayon, Nylon, Polypropylene, composites and worsted wool fibers, for three end-use segments:
Mobility (automotive parts e.g. airbags, tires, seatbelts), Lifestyle (apparel, active wear), and Hygiene (diapers, feminine care)
8
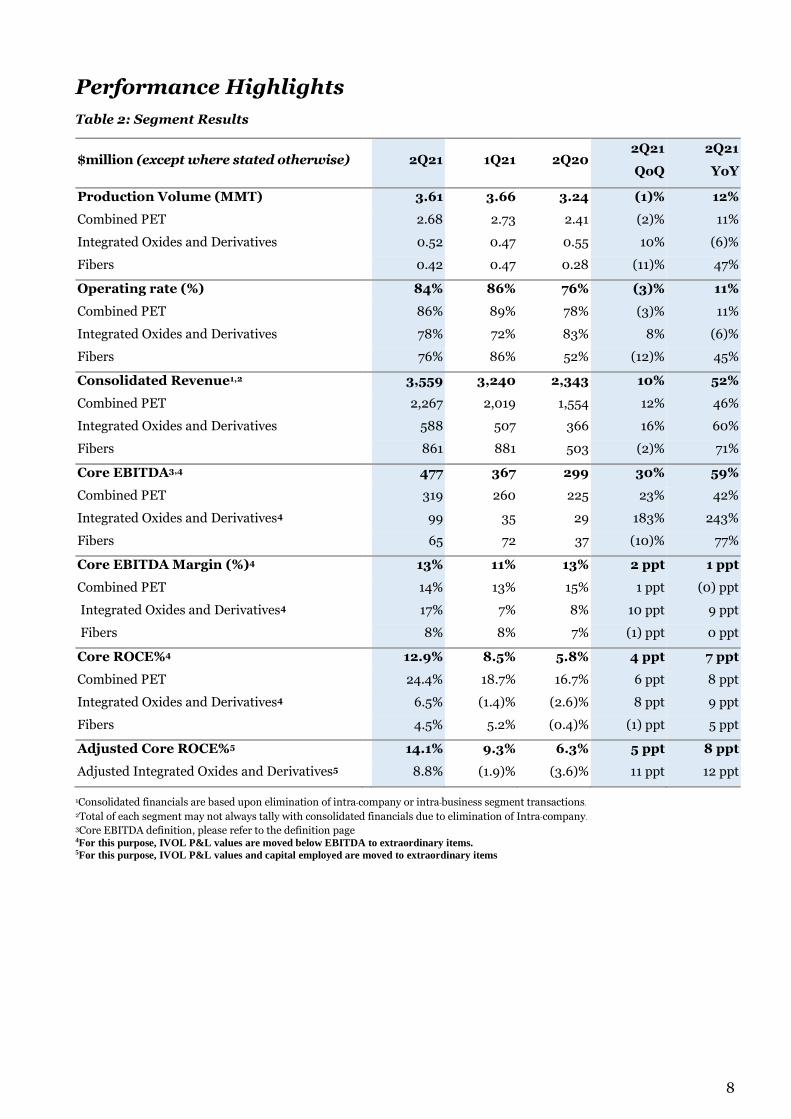
Performance Highlights
Table 2: Segment Results
$million (except where stated otherwise) 2Q21 1Q21 2Q20 2Q21
QoQ
2Q21
YoY
Production Volume (MMT) 3.61 3.66 3.24 (1)% 12%
Combined PET 2.68 2.73 2.41 (2)% 11%
Integrated Oxides and Derivatives 0.52 0.47 0.55 10% (6)%
Fibers 0.42 0.47 0.28 (11)% 47%
Operating rate (%) 84% 86% 76% (3)% 11%
Combined PET 86% 89% 78% (3)% 11%
Integrated Oxides and Derivatives 78% 72% 83% 8% (6)%
Fibers 76% 86% 52% (12)% 45%
Consolidated Revenue1,2 3,559 3,240 2,343 10% 52%
Combined PET 2,267 2,019 1,554 12% 46%
Integrated Oxides and Derivatives 588 507 366 16% 60%
Fibers 861 881 503 (2)% 71%
Core EBITDA3,4 477 367 299 30% 59%
Combined PET 319 260 225 23% 42%
Integrated Oxides and Derivatives4 99 35 29 183% 243%
Fibers 65 72 37 (10)% 77%
Core EBITDA Margin (%)4 13% 11% 13% 2 ppt 1 ppt
Combined PET 14% 13% 15% 1 ppt (0) ppt
Integrated Oxides and Derivatives4 17% 7% 8% 10 ppt 9 ppt
Fibers 8% 8% 7% (1) ppt 0 ppt
Core ROCE%4 12.9% 8.5% 5.8% 4 ppt 7 ppt
Combined PET 24.4% 18.7% 16.7% 6 ppt 8 ppt
Integrated Oxides and Derivatives4 6.5% (1.4)% (2.6)% 8 ppt 9 ppt
Fibers 4.5% 5.2% (0.4)% (1) ppt 5 ppt
Adjusted Core ROCE%5 14.1% 9.3% 6.3% 5 ppt 8 ppt
Adjusted Integrated Oxides and Derivatives5 8.8% (1.9)% (3.6)% 11 ppt 12 ppt
1Consolidated financials are based upon elimination of intra-company or intra-business segment transactions. 2Total of each segment may not always tally with consolidated financials due to elimination of Intra-company. 3Core EBITDA definition, please refer to the definition page 4For this purpose, IVOL P&L values are moved below EBITDA to extraordinary items. 5For this purpose, IVOL P&L values and capital employed are moved to extraordinary items

9
Capital Expenditure Program
IVL expects its balance sheet and cash flow from operations to remain strong, and sufficient to meet its
planned investments in future growth opportunities.
Table 3: Major Projects Update & Recycling Growth Plan
Project Business Expected Completion
Total Installed Capacity (KT)
Earnings & Returns Capex in $M
Olympus Cost Transformation Program
Corporate and all business segments 2020-2023 n/a EBITDA
$610M ~600-650
Corpus Christi PET/PTA Integrated PET 2024
PET: 367 kta
PTA: 433 kta Double digit
ROCE
~700-800 (till Jun’21:
430)
Recycling projects PET recycling 2021-2023 ~600kta ROCE 13-15% ~400-450
Adopting best in class international practices: Reference to our MD&A of 1Q21, we mentioned to adopt “Underlying EBITDA” in addition to Reported EBITDA in our future MD&A reports. We would like to update you that we are still in process of discussion and implementation internally first. Once this is completed we shall start reporting “Underlying EBITDA” in our MD&A also.
10
Forward-looking Statements
The statements included herein contain forward-looking statements” of Indorama Ventures Public Company Limited (the
Company”) that relate to future events, which are, by their nature, subject to significant risks and uncertainties. All statements,
other than statements of historical fact contained herein, including, without limitation, those regarding the future financial
position and results of operations, strategy, plans, objectives, goals and targets, future developments in the markets where the
Company participates or is seeking to participate and any statements preceded by, followed by or that include the words
target”, believe”, expect”, aim”, intend”, will”, may”, anticipate”, would”, plan”, could”, should, predict”, project”,
estimate”, foresee”, forecast”, seek” or similar words or expressions are forward-looking statements.
Such forward-looking statements involve known and unknown risks, uncertainties and other important factors beyond the
Company’s control that could cause the actual results, performance or achievements of the Company to be materially different
from the future results, performance or achievements expressed or implied by such forward-looking statements. These forward-
looking statements are based on numerous assumptions regarding the Company’s present and future business strategies and
the environment in which the Company will operate in the future and are not a guarantee of future performance. 2019 and
2021 projections are based on historical 2017-2018 performance and management forecast. The predicted volume is based on
legacy and new assets already committed, planned and announced.
Such forward-looking statements speak only as at the date of this document, and the Company does not undertake any duty or
obligation to supplement, amend, update or revise any such statements. The Company does not make any representation,
warranty or prediction that the results anticipated by such forward-looking statements will be achieved.
Definitions
Reported financials are from audited/reviewed financial statements.
Core EBITDA are EBITDA adjusted with net extraordinary expenses/(income) and inventory losses/(gains).
Core net profits are reported net profits adjusted with net extraordinary expenses/(income) and inventory losses/(gains)
post tax.
Inventory gains/losses in a period result from the movement in prices of raw materials and products from the end of the
previous reported period to the end of the current reported period. The cost of sales is impacted by inventory gains/losses
wherein inventory gains decrease the cost of sales and inventory losses increase the cost of sales.
Net Operating Debt is Net Debt (total debt less cash and current investments) less cash outflow for the various projects
underway which are not yet completed and have not yet started contributing to the earnings.
Organic growth is calculated as the change in production on a like-for-like asset footprint basis
Notes/Disclaimer
We recommend that investors always read the MD&A together with the published financial statements to get complete details
and understanding.
The consolidated financials are based on the elimination of intra-company (or intra-business segment transactions. For this
reason, the total of each segment may not always tally with consolidated financials. Similarly segments total may not always
match to total due to holdings segment.
The Polyester Chain businesses are generally traded in US$ and therefore the Company believes in helping its readers with
translated US$ figures. The Company’s reporting currency is THB. THB results are translated into US$ at the average exchange
rates and closing exchange rates where applicable.
The Company has presented the analysis in the MD&A in US$ as it believes that the business can be explained better in US$
terms. However, THB numbers are also given where needed. Readers should rely on the THB results only.
Please note that this MD&A has been normalized for our Lake Charles, Louisiana Ethylene Cracker (IVOL) which was not operating during the last calendar year of 2020 and till date in 2Q21. Starting late July 2021 IVOL is under commissioning for commercial startup within 3Q21. In order to make a fair assessment and analysis of our operating assets, management feels it appropriate to move the P&L values below EBITDA as extraordinary items including historical periods. Tables in the annexures give the reconciliations/adjustments to the P&L.
11
List of Tables
Table 1 Core Financials of Consolidated Business 6
Table 2 Segment Results (New segment) 8
Table 3 Major Projects Update & Recycling Growth Plan 9
Table 4 Cash Flow Statement 12
Table 5 Debt Profile 13
Table 6 IVL Consolidated Statement of Income ($ Million) 14
Table 7 Calculation of Core EBITDA ($ Million) 15
Table 8 Calculation of Core net profit ($ Million) 15
Table 9 IVL Consolidated Statement of Income (THB Million) 16
Table 10 Calculation of Core EBITDA (THB Million) 17
Table 11 Calculation of Core net profit (THB Million) 17
Table 12 IVL Consolidated Statement of Financial Position 18
List of Figures
Figure 1 Repayment Schedule of Long Term Debt 13

12
Table 4: Cash Flow Statement
$million 2Q21 1Q21 2Q20 Remarks
Profit for the period after Tax and NCI 267 198 5
Add: NCI 10 17 0
Add: Depreciation & Amortization 164 165 164
Add: Net finance costs 51 60 53
Add: Tax expense (income) 61 43 (18)
Add: Impairment loss of PPE 1 5 -
Less: Impairment loss reversal-TFRS 9 (1) 1 1
Less: Gains on bargain purchases - - 1
Add: Gain on disposal of PPE 1 (0) 0
Less: Loss on written-off of PPE 0 0 (0)
Add: Expense related to defined benefit plans,
unrealized items, share of JV, provisions etc. (19) (3) (35)
Add: Changes in operating assets and liabilities (133) (309) 143
Inventory (gains)/losses (55) (141) 103 Management Classification
Changes in Net working capital (78) (168) 40 Management Classification
Less: Taxes paid (61) 23 (13)
Operating Cash Flow 342 201 300
Net growth and investment capex1 (167) (97) (67)
Net working capital on acquired / sold assets (6) - 1
Maintenance capex (108) (44) (48)
Cash Flow After Strategic Spending 60 60 186
Net financial costs3 (69) (40) (72)
Dividends and PERP interest (87) (9) (69)
Proceed from perpetual debentures - - (0)
(Increase)/Decrease in Net Debt on cash
basis2 (95) 12 45
Exchange rate movement on Net Debt (Natural
Hedge against Assets) 117 137 (44)
(Increase)/Decrease in Net Debt as per
Balance Sheet 23 148 1
*Total of various accounts may not match with the grand total due to decimal round off
1 Includes net proceeds from disposals of PPE, other non-current investments and assumed net debt on acquisitions 2 Includes effect of FOREX changes on balance held in foreign currencies and on the net debt changes over the period of cash flow, due to the increase/decrease in net debt as per statement of financial position might be different 3 Finance cost in the cash flow statement may differ to the income statement on a quarterly basis due to certain payments which are made on an annual or six monthly basis as per conditions of the debt
13
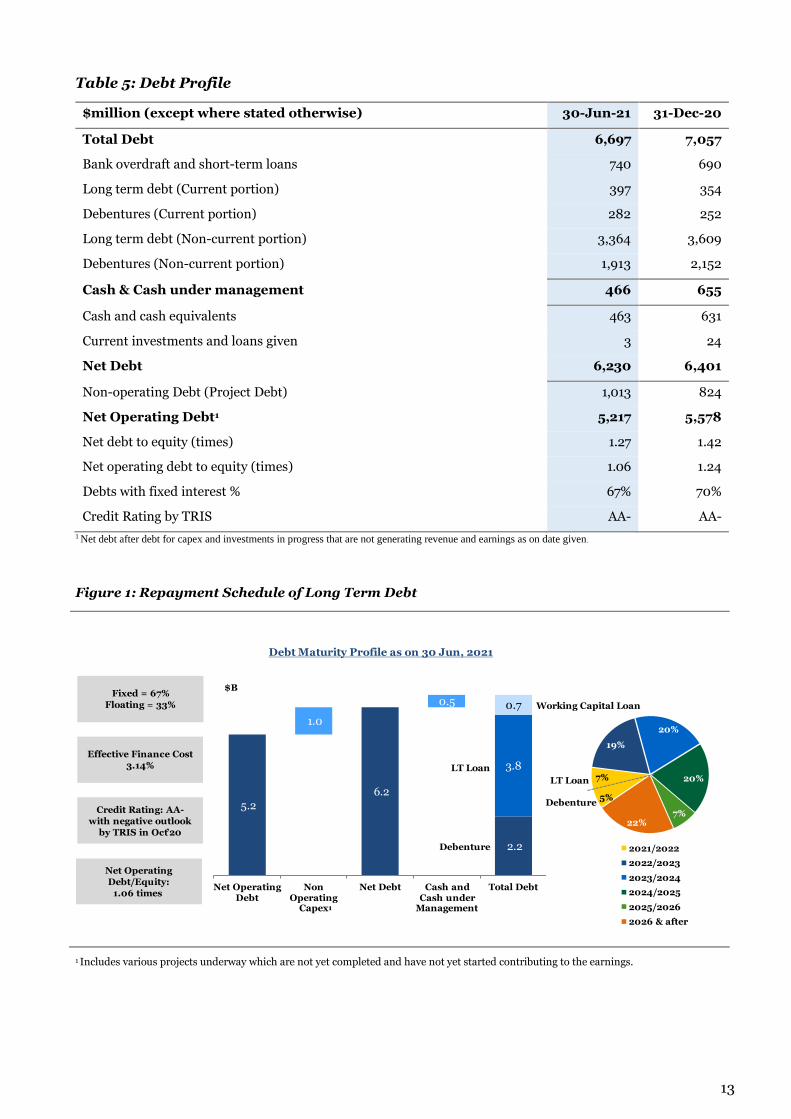
Table 5: Debt Profile
$million (except where stated otherwise) 30-Jun-21 31-Dec-20
Total Debt 6,697 7,057
Bank overdraft and short-term loans 740 690
Long term debt (Current portion) 397 354
Debentures (Current portion) 282 252
Long term debt (Non-current portion) 3,364 3,609
Debentures (Non-current portion) 1,913 2,152
Cash & Cash under management 466 655
Cash and cash equivalents 463 631
Current investments and loans given 3 24
Net Debt 6,230 6,401
Non-operating Debt (Project Debt) 1,013 824
Net Operating Debt1 5,217 5,578
Net debt to equity (times) 1.27 1.42
Net operating debt to equity (times) 1.06 1.24
Debts with fixed interest % 67% 70%
Credit Rating by TRIS AA- AA-
1 Net debt after debt for capex and investments in progress that are not generating revenue and earnings as on date given .
Figure 1: Repayment Schedule of Long Term Debt
1 Includes various projects underway which are not yet completed and have not yet started contributing to the earnings.
.2
.2
2.2
1.
.
.
.
Net OperatingDebt
NonOperatingCapex
Net Debt Cash andCash underManagement
Total Debt
Debt Maturity Profile as on un,
Fixed
Floating
Effective Finance Cost
Credit Rating: AA-
with negative outlook
by TRIS in Oct
Net Operating
Debt/E uity:
times
/
/
/
/
/
after
LT Loan
Debenture
LT Loan
Debenture
B
orking Capital Loan
14
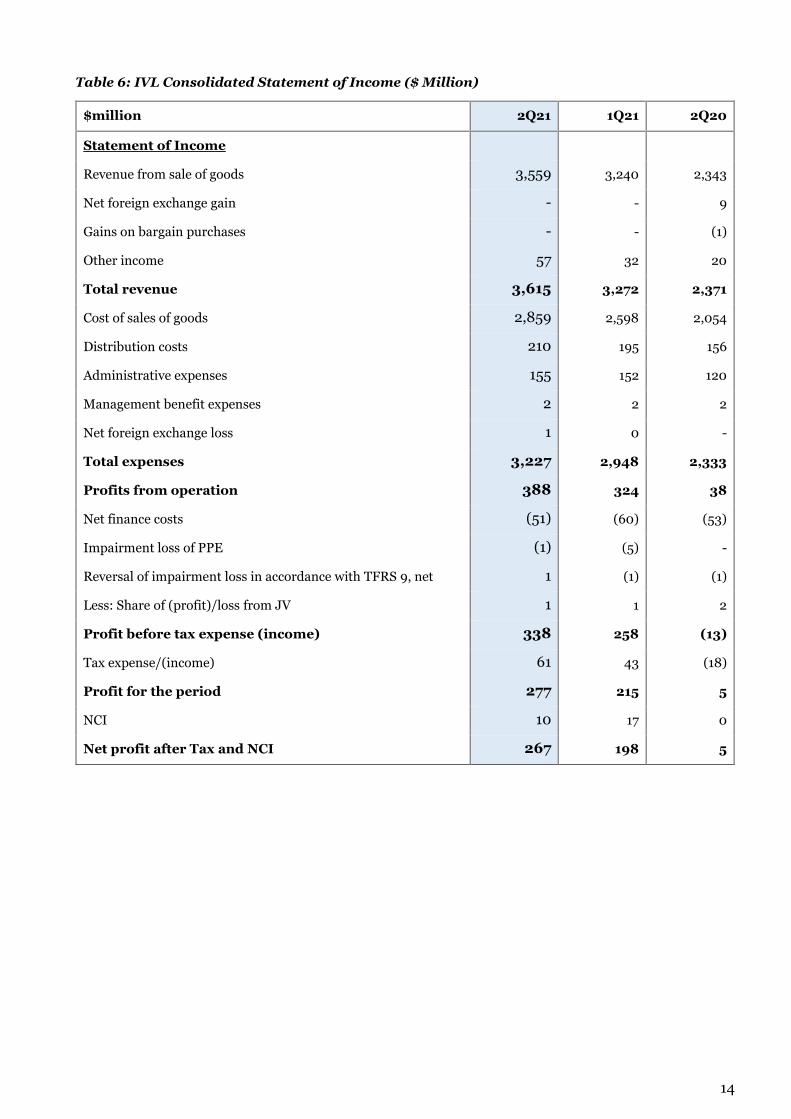
Table 6: IVL Consolidated Statement of Income ($ Million)
$million 2Q21 1Q21 2Q20
Statement of Income
Revenue from sale of goods 3,559 3,240 2,343
Net foreign exchange gain - - 9
Gains on bargain purchases - - (1)
Other income 57 32 20
Total revenue 3,615 3,272 2,371
Cost of sales of goods 2,859 2,598 2,054
Distribution costs 210 195 156
Administrative expenses 155 152 120
Management benefit expenses 2 2 2
Net foreign exchange loss 1 0 -
Total expenses 3,227 2,948 2,333
Profits from operation 388 324 38
Net finance costs (51) (60) (53)
Impairment loss of PPE (1) (5) -
Reversal of impairment loss in accordance with TFRS 9, net 1 (1) (1)
Less: Share of (profit)/loss from JV 1 1 2
Profit before tax expense (income) 338 258 (13)
Tax expense/(income) 61 43 (18)
Profit for the period 277 215 5
NCI 10 17 0
Net profit after Tax and NCI 267 198 5

15
Table 7: Calculation of Core EBITDA ($ Million)
$million 2Q21 1Q21 2Q20 Remarks
Net profit after Tax and NCI 267 198 5 Statement of income in FS
Add: Depreciation & Amortization 164 165 164 Cash flow in FS
Add: Net finance costs 51 60 53 Statement of income/
Cash flows in FS
Less: Share of (profit)/loss from JV (1) (1) (2) Statement of income in FS
Add: NCI 10 17 0 Statement of income in FS
Add: Tax expense (income) 61 43 (18) Statement of income in FS
EBITDA 552 483 202
Add: Impairment loss of PPE 1 5 - Statement of income/
Cash flows in FS
Less: Gains on bargain purchases - - 1 Statement of income/
Cash flows in FS
Less: Gain on disposal of PPE 1 (0) 0 Cash flows in FS
Add: Loss on written-off of PPE 0 0 (0) Cash flows in FS
Less: Insurance income related to PPE (1) (7) (0) Management classification
Add: Acquisition cost and pre-operative expense 2 1 8 Management classification
Add: Extra expenses related to PO/MTBE turnaround - - (0) Management classification
Add: Extra expenses related to natural calamities (Polar Vortex, Hurricanes and Lightning strikes) 3 29 - Management classification
Less: Lakes Charles cracker (IVOL) performance 18 (2) (5) Management classification
Less: Other extraordinaries (income)/expense (prior period income in Brazil in 2Q21) (43) 0 (9) Management classification
Less: Depreciation related to Extraordinary (0) (0) (0) Management classification
Add: Tax related to Extraordinary - - (0) Management classification
Less: Inventory (gains)/losses (55) (141) 103 Management classification
= Core EBITDA 477 367 299
Table 8: Calculation of Core net profit ($ Million)
$million 2Q21 1Q21 2Q20 Remarks
Net profit after Tax and NCI 267 198 5 Statement of income in FS
Add: Impairment loss of PPE 1 5 - Statement of income/
Cash flows in FS
Less: Gains on bargain purchases - - 1 Statement of income/
Cash flows in FS
Less: Gain on disposal of PPE 1 (0) 0 Cash flows in FS
Add: Loss on written-off of PPE 0 0 (0) Cash flows in FS
Less: Insurance income related to PPE (1) (7) (0) Management classification
Add: Acquisition cost and pre-operative expense 2 1 8 Management classification
Add: Extra expenses related to PO/MTBE turnaround - - (0) Management classification
Add: Extra expenses related to natural calamities (Polar Vortex, Hurricanes and Lightning strikes) 3 29 - Management classification
Less: Lakes Charles cracker (IVOL) performance 26 10 9 Management classification
Less: Other extraordinaries (income)/expense (prior period income in Brazil in 2Q21) (43) 0 (9) Management classification
Less: Inventory (gains)/losses (55) (141) 103 Management classification
Add: Tax on inventory gains/losses 13 33 (26) Management classification
= Core Net Profit after Tax and NCI 213 127 91
16
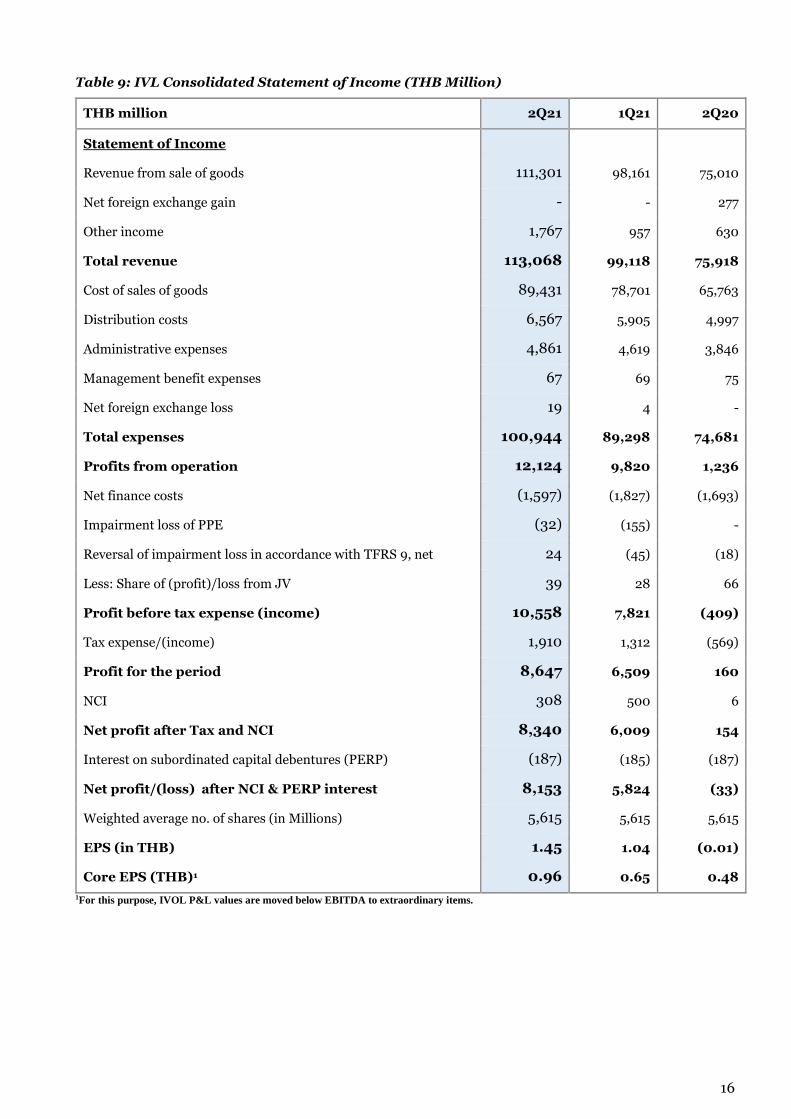
Table 9: IVL Consolidated Statement of Income (THB Million)
THB million 2Q21 1Q21 2Q20
Statement of Income
Revenue from sale of goods 111,301 98,161 75,010
Net foreign exchange gain - - 277
Other income 1,767 957 630
Total revenue 113,068 99,118 75,918
Cost of sales of goods 89,431 78,701 65,763
Distribution costs 6,567 5,905 4,997
Administrative expenses 4,861 4,619 3,846
Management benefit expenses 67 69 75
Net foreign exchange loss 19 4 -
Total expenses 100,944 89,298 74,681
Profits from operation 12,124 9,820 1,236
Net finance costs (1,597) (1,827) (1,693)
Impairment loss of PPE (32) (155) -
Reversal of impairment loss in accordance with TFRS 9, net 24 (45) (18)
Less: Share of (profit)/loss from JV 39 28 66
Profit before tax expense (income) 10,558 7,821 (409)
Tax expense/(income) 1,910 1,312 (569)
Profit for the period 8,647 6,509 160
NCI 308 500 6
Net profit after Tax and NCI 8,340 6,009 154
Interest on subordinated capital debentures (PERP) (187) (185) (187)
Net profit/(loss) after NCI & PERP interest 8,153 5,824 (33)
Weighted average no. of shares (in Millions) 5,615 5,615 5,615
EPS (in THB) 1.45 1.04 (0.01)
Core EPS (THB)1 0.96 0.65 0.48
1For this purpose, IVOL P&L values are moved below EBITDA to extraordinary items.

17
Table 10: Calculation of Core EBITDA (THB Million)
THB million 2Q21 1Q21 2Q20 Remarks
Net profit after Tax and NCI 8,340 6,009 154 Statement of income in FS
Add: Depreciation & Amortization 5,129 5,001 5,232 Cash flows in FS
Add: Net finance costs 1,597 1,827 1,693 Statement of income/Cash flows in FS
Less: Share of (profit)/loss from JV (39) (28) (66) Statement of income in FS
Add: NCI 308 500 6 Statement of income in FS
Add: Tax expense (income) 1,910 1,312 (569) Statement of income in FS
EBITDA 17,244 14,620 6,450
Add: Impairment loss of PPE 32 155 - Statement of income/Cash flows in FS
Less: Gains on bargain purchases - - 0 Statement of income/Cash flows in FS
Less: Gain on disposal of PPE 15 (4) 1 Cash flows in FS
Add: Loss on written-off of PPE 4 1 (0) Cash flows in FS
Less: Insurance income related to PPE (34) (218) (3) Management classification
Add: Acquisition cost and pre-operative expense 62 16 256 Management classification
Add: Extra expenses related to PO/MTBE turnaround - - 1 Management classification
Add: Extra expenses related to natural calamities (Polar Vortex, Hurricanes and Lightning strikes) 112 865 - Management classification
Less: Lakes Charles cracker (IVOL) performance 542 (65) (165) Management classification
Less: Other extraordinaries (income)/expense (prior period income in Brazil in 2Q21) (1,323) 11 (268) Management classification
Less: Depreciation related to Extraordinary (0) (0) (4) Management classification
Add: Tax related to Extraordinary - - (2) Management classification
Less: Inventory (gains)/losses (1,771) (4,273) 3,291 Management classification
= Core EBITDA 14,885 11,109 9,556
Table 11: Calculation of Core net profit (THB Million)
THB million 2Q21 1Q21 2Q20 Remarks
Net profit after Tax and NCI 8,340 6,009 154 Statement of income in FS
Add: Impairment loss of PPE 32 155 - Statement of income/Cash flows in FS
Less: Gains on bargain purchases - - 0 Statement of income/Cash flows in FS
Less: Gain on disposal of PPE 15 (4) 1 Cash flows in FS
Add: Loss on written-off of PPE 4 1 (0) Cash flows in FS
Less: Insurance income related to PPE (34) (218) (3) Management classification
Add: Acquisition cost and pre-operative expense 62 16 256 Management classification
Add: Extra expenses related to PO/MTBE turnaround - - 1 Management classification
Add: Extra expenses related to natural calamities (Polar Vortex, Hurricanes and Lightning strikes) 112 865 - Management classification
Less: Lakes Charles cracker (IVOL) performance 795 291 292 Management classification
Less: Other extraordinaries (income)/expense (prior period income in Brazil in 2Q21) (1,323) 11 (268) Management classification
Less: Inventory (gains)/losses (1,771) (4,273) 3,291 Management classification
Add: Tax on inventory gains/losses 408 998 (821) Management classification
= Core Net Profit after Tax and NCI 6,641 3,850 2,901

18
Table 12: IVL Consolidated Statement of Financial Position
THB million 30-Jun-21 31-Dec-20
Assets
Cash and current investments 14,916 19,390
Trade accounts receivable 46,917 33,422
Inventories 74,778 53,938
Other current assets 16,871 13,084
Total current assets 153,481 119,835
Investment 3,044 2,955
Property, plant and equipment 282,061 264,291
Right-of-use (ROU) 11,682 11,865
Intangible assets 49,633 46,616
Deferred tax assets 2,638 2,612
Other assets 4,095 4,998
Total assets 506,634 453,172
Liabilities and shareholder's equity
Liabilities
Bank OD and short-term loans from financial institutions 23,716 20,726
Trade accounts payable 82,231 57,783
Current portion of long-term loans 10,995 8,920
Current portion of debenture 9,048 7,584
Current portion of finance lease liabilities 1,732 1,714
Other current liabilities 22,597 20,436
Total current liabilities 150,320 117,161
Long-term loans from financial institutions 98,963 99,448
Debenture 61,333 64,625
Finance lease liabilities 8,869 8,944
Deferred tax liabilities 18,033 16,686
Other liabilities 11,596 10,699
Total liabilities 349,114 317,564
Shareholder's equity
Share capital 5,615 5,615
Share premium 60,331 60,331
Retained earnings & Reserves 65,846 45,804
Total equity attributable to shareholders 131,792 111,750
Subordinated perpetual debentures 14,905 14,905
Total equity attributable to equity holders 146,697 126,655
Non-controlling interests (NCI) 10,824 8,953
Total shareholder's equity 157,520 135,608
Total liabilities and shareholder's equity 506,634 453,172
