reference correlation for the viscosity of xenon from the
TRANSCRIPT
1
Reference Correlation for the Viscosity of Xenon
from the Triple Point to 750 K and up to 86 MPa
Danai Velliadou,1 Katerina Tasidou,1 Konstantinos D. Antoniadis,1 Marc J. Assael,1,a)
Richard A. Perkins2 and Marcia L. Huber2
1 Laboratory of Thermophysical Properties and Environmental Processes,
Chemical Engineering Department, Aristotle University, Thessaloniki 54636, Greece
2 Applied Chemicals and Materials Division, National Institute of Standards and Technology,
325 Broadway, Boulder, CO 80305, USA
A new wide-ranging correlation for the viscosity of xenon, based on the most recent theoretical
calculations and critically evaluated experimental data, is presented. The correlation is designed to be
used with an existing equation of state, and it is valid from the triple point to 750 K, at pressures up to
86 MPa. The estimated expanded uncertainty (at a coverage factor of k = 2) varies depending on the
temperature and pressure, from 0.2 % to 3.6 %. A term accounting for the critical enhancement is also
included. The correlation behaves in a physically reasonable manner when extrapolated to 200 MPa,
however care should be taken when using the correlations outside of the validated range.
Key words: transport properties; viscosity; xenon.
_________________________________________________
a) Author to whom correspondence should be addressed ([email protected])

2
1 Introduction
In a series of recent papers, reference correlations for the viscosity of selected common fluids [1-8] have
been developed that cover a wide range of temperature and pressure conditions, including the gas, liquid,
and supercritical phases. In this paper, the methodology adopted in the aforementioned papers is
extended to developing a new reference correlation for the viscosity of xenon.
The currently employed reference correlation for the viscosity of xenon was developed by Hanley
et al. [9] in 1974; it is based on the corresponding-states principle and covers a temperature range (165
– 500) K and pressures up to 20 MPa. The only other available correlation is the corresponding-states
model developed by Huber [10] and implemented in REFPROP v10.0 [11]; with 1 % uncertainty for the
gas-phase viscosity and 5 % for the liquid-phase viscosity up to 60 MPa and temperatures from (170 −
750) K.
The analysis that will be described is based on the most recent theoretical advances as well as the
best available experimental data for the viscosity. Thus, a prerequisite to the analysis is a critical
assessment of the experimental data. For this purpose, two categories of experimental data are defined:
primary data, employed in the development of the correlation, and secondary data, used simply for
comparison purposes. According to the recommendation adopted by the Subcommittee on Transport
Properties (now known as The International Association for Transport Properties) of the International
Union of Pure and Applied Chemistry, the primary data are identified by a well-established set of criteria
[12]. These criteria have been successfully employed to establish standard reference values for the
viscosity and thermal conductivity of fluids over wide ranges of conditions, with uncertainties in the
range of 1 %. However, in many cases, such a narrow definition unacceptably limits the range of the
data representation. Consequently, within the primary data set, it is also necessary to include results that
extend over a wide range of conditions, albeit with a higher uncertainty, provided they are consistent
with other lower uncertainty data or with theory. In all cases, the uncertainty claimed for the final
recommended data must reflect the estimated uncertainty in the primary information.
2 The Correlation
The viscosity η can be expressed [1, 4-7] as the sum of four independent contributions, as
( ) ( ) ( ) ( )( ) ( )0 1 c, Δ , Δ , = + + , (1)
where ρ is the density, T is the absolute temperature, and the first term, η0(Τ) = η(0,Τ), is the contribution
to the viscosity in the dilute-gas limit, where only two-body molecular interactions occur. The linear-in-
density term, η1(Τ) ρ, known as the initial density dependence term, can be separately established with
the development of the Rainwater-Friend theory [13-15] for the transport properties of moderately dense
gases. The critical enhancement term, Δηc(ρ,Τ), arises from the long-range density fluctuations that

3
occur in a fluid near its critical point, which contribute to divergence of the viscosity at the critical point.
This term for viscosity is significant only in the region very near the critical point, as shown in Vesovic
et al. [16] and Hendl et al. [17]. To calculate this enhancement term, the crossover theory of
Bhattacharjee and coworkers [18] may be used, provided there are adequate data to determine the
parameters. Finally, the term Δη(ρ,T), the residual term, represents the contribution of all other effects
to the viscosity of the fluid at elevated densities including many-body collisions, molecular-velocity
correlations, and collisional transfer.
The identification of these four separate contributions to the viscosity and to transport properties
in general is useful because it is possible, to some extent, to treat η0(Τ), η1(Τ), and Δηc(ρ,Τ) theoretically.
In addition, it is possible to derive information about both η0(Τ) and η1(Τ) from experiment. In contrast,
there is little theoretical guidance concerning the residual contribution, Δη(ρ,Τ), and therefore its
evaluation is based entirely on an empirical equation obtained by fitting experimental data.
Table 1 summarizes, to the best of our knowledge, the theoretical prediction/estimations as well as
the experimental measurements of the viscosity of xenon reported in the literature. Uncertainties given
in Table 1 are those provided by the original authors. As early as 1962, based on kinetic-theory
calculations, Svehla [19] proposed dilute-gas viscosity values covering the temperature range (100 –
5000) K. However, the first empirical correlation for the viscosity and thermal conductivity of xenon
based on the corresponding-states principle was proposed in 1974 by Hanley et al. [9] . The viscosity
correlation covered a temperature range from the triple point to 500 K and pressures up to 20 MPa with
an uncertainty of 5 %.
In 1983, Najafi et al. [20] employed an improved two-parameter corresponding-states scheme to
correlate the dilute-gas viscosity from (100 – 2000) K with an uncertainty of better than 2 %, while
Vargaftik and Vasilevskaya [21] proposed dilute-gas viscosity values based on kinetic-theory
calculations, covering a temperature range (800 – 5000) K with an uncertainty of up to 5 %.
In 1990, Bich et al. [22] proposed reference values for the viscosity of xenon from the triple point
to 5000 K at zero density and also at 0.101325 MPa, with an uncertainty ranging from 0.3 % to 2 % at
the highest temperatures.
In 1999, Berg et al. [23] reported viscosity data near the critical point of xenon from the Critical
Viscosity of Xenon (CVX) experiment. Data were measured with a low-frequency torsional viscometer
at frequencies from 1/32 Hz to 12.5 Hz on the ground and aboard the Space Shuttle in microgravity.
These exceptional data have an estimated uncertainty of 1.6 % and approach to within 0.1 mK of the
critical temperature along the critical isochore.
In 2007, May et al. [24] reported new very accurate measurements of the viscosity of xenon in
relation to that of helium, performed in a single-capillary viscometer at 298.15 K, and the reference
value for the viscosity of xenon, (23.026 ± 0.016) μPa‧s, at that temperature, was proposed. Furthermore,
a two-capillary viscometer was employed for the measurement of the viscosity of xenon over (202 –
298) K.

4
A critical assessment of 18 viscometers, carried out by Berg and Moldover [25] in 2012, resulted
in the proposition of the viscosity value of (23.0183 ± 0.0072) μPa‧s for xenon at 298.15 K and zero
density.
In 2016, Vogel [26] published low-uncertainty values of the viscosity of xenon at zero density over
the temperature range (295 – 650) K. These were based on a reevaluation of their oscillating-disk
measurements [27], employing a more recent value of the viscosity of argon for the calibration of the
instrument. Their work was expanded by Hellmann et al. [28], who produced reference values for the
dilute gas over a temperature range (100 – 5000) K with an uncertainty of 0.07 to 0.28 %, based on an
ab initio intermolecular potential energy and related spectroscopic and thermophysical properties data
for xenon.
In 2020, the combined use of experimental viscosity ratios together with ab initio calculations for
helium has driven significant improvements in the description of dilute gas transport properties [29].
Hence, Xiao et al. [29, 30] first used improvements to ab initio helium calculations [31] to update
previously measured viscosity ratios [24]. Subsequently, they used these improved values to get better
reference correlations for the dilute-gas viscosity of xenon and 9 other gases. The new reference dilute-
gas viscosity correlation for xenon covers the temperature range from (100 – 5000) K with a relative
uncertainty 0.2 %, and it will form the dilute-gas viscosity contribution of xenon in this work. We note
that the uncertainties in Xiao et al. [29, 30] are expressed as standard uncertainties corresponding to a
coverage factor of k = 1; in this work all uncertainties discussed are combined expanded uncertainties
with a coverage factor of k = 2.
The dilute-gas extrapolated viscosity measurements of Lin et al. [32], performed with an
uncertainty of 0.1 % with a double capillary calibrated with argon over the temperature range (298−
393) K, were included in the primary data set. The following seven atmospheric-pressure viscosity
investigators were also considered part of the primary data set:
- The 1972 and 1978 measurements of Kestin et al. [33, 34], with a 0.1-0.3 % uncertainty, over
the temperature ranges (298 – 973) K, and (298 – 778) K respectively, performed in an
oscillating-disk viscometer calibrated with noble gases,
- the measurements of Rigby and Smith [35] over (293− 972) K with an uncertainty of 0.3 %,
Dawe and Smith [36] over (300− 1600) K, and Clarke and Smith [37] over (176− 375) K with
an uncertainty of 0.5 % to 1 %, all performed with a capillary instrument calibrated with
nitrogen,
- the measurement of Thornton [38] performed in a Rankine viscometer with a 1 % uncertainty,
and
- the high-temperature, (1100 – 2000) K, measurements of Goldblatt and Wageman [39]
performed with a capillary viscometer, calibrated with xenon at 298 K, with an uncertainty of
0.5 %.

5
Table 1 Viscosity theoretical predictions and measurements of xenon
Investigators / Reference Technique
employeda
Purityb
(%)
Uncertainty
(%)
No. of
data
Temperature
range
(K)
Pressure
range
(MPa)
Reference Correlations/Values
Xiao et al. [29] Dil.Gas Reference Cor. - 0.2 - 100-5000 0
Hellmann et al. [28] Ab initio Calculations - 0.07-0.28 109 100-5000 0
Berg and Moldover [25] Recommended Value - 0.03 1 298.15 0
May et al. [24] Recommended Value - 0.07 1 298.15 0
Bich et al. [22]
Recommended values
-
0.3-2.0
0.3-2.0
92
92
165-5000
165-5000
0
0.1
Vargaftik and Vasilevskay [21] Kinetic Theory Calc. - 3-5 33 800-5000 0.1
Najafi et al. [20] CS Correlation - 2 - 100-2000 0
Hanley et al. [9] CS Correlation - 5 - 165-500 0.1-20
Svehla [19] Kinetic Theory Calc - na 50 100-5000 0.1
Primary Data
Lin et al. [32] Cap (cal Ar) 99.999 0.11 10 298-393 0
Vogel [26] OD (reeval Ar) 99.99 0.2-0.4 20 295-650 0
May et al. [24]
Single Cap
Double Cap
99.995
99.999
0.07
0.07
1
7
298.15
202-298
0
0
Berg et al. [23] (CVX) Torsion Oscill. 99.995 1.6 43 292-306 5.8-7.8
Kestin et al. [34] OD (cal NG 298 K) 99.995 0.1-0.3 9 298-778 0.1
Kestin et al. [33] OD (cal NG 298 K) 99.998 0.1-0.3 8 298-973 0.1
Ulybin and Makarushkin [40] Cap (abs) 99.894 1.4 68 170-293 0.1-54
Goldblatt and Wageman [39] Cap (cal Xe 283 K) 99.99 0.5 11 1100-2000 0.1
Dawe and Smith [36] Cap (cal N2 293 K) 99.998 0.5-1 15 300-1600 0.1
Clarke and Smith [37] Cap (cal N2 293 K) 99.998 0.5-1 9 176-375 0.1
Rigby and Smith [35] Cap (cal N2 av.val) 99.0 0.3 14 293-972 0.1
Trappeniers et al. [41] Cap (abs) na 0.5 23 273-348 1-86
Reynes and Thodos [42] Cap 99.99 na 48 323-473 7-83
Thornton [38] Rank (cal N2 291 K) 99.0 1 1 291 0.09
Secondary Data
Grisnik [43] Cap (abs) na 3 31 210-298 0.09-0.1
Malbrunot et al. [44] QuartzAtt na 25 7 161-180 0.08-0.2
Baharudin et al. [45] BB na 12 7 168-271 0.1-3.9
Strumpf et al. [46] OQ <40 ppm 3 182 287-303 5.5-8.6
Zollweg et al [47] LS na 3 EQ 285-289 5.3-5.9
Legros and Thomaes [48] Cap (cal Ar) 99.94 1 9 163-169 0.09-0.13
Kestin and Leidenfrost [49] OD (abs) 99.929 0.05 8 298 0.1-2.9 a abs, absolute; Ar, argon; av. val, average values; BB, Brillouin Bandwidth ; cal, calibrated; calc, calculated;
Cap, Capillary; CVX, Torsion Oscill., critical viscosity of xenon by Torsional Oscillator; LS, Light
scattering; NG, noble gases; N2, nitrogen; OD, Oscillating Disc; OQ, Oscillating Quartz; Quartz Att, Quartz-
attenuating technique; Rank, Rankine viscometer; reeval, reevaluated. b na. not available.

6
In relation to high-pressure measurements, Ulybin and Makarushkin [40] performed capillary
measurements with an uncertainty of 1.4 % in the temperature range (170 – 293) K and up to 54 MPa.
These were included in the primary data set, regardless of their relatively high uncertainty, as they extend
to high pressures. Trappeniers et al. [41] published capillary measurements with a 0.5 % uncertainty
over the temperature range (273 – 348) K and up to 86 MPa. This set was also part of the primary data
sets. We also included with some caution in the primary data set the measurements of Reynes and
Thodos [42], of unquoted uncertainty, as they extended to pressures of 83 MPa.
The remaining sets were not considered as primary sets as their quoted uncertainty was 3 % or
higher, with the exception of a) the earlier measurements by Kestin and Leidenfrost [49] that were
replaced by the more recent ones [33, 34], and b) the 1966 capillary measurements of Legros and
Thomaes [48] performed with a 1 % uncertainty in the limited temperature range of (163 – 169) K,
which were however about 3 % to 4 % higher than the other two primary sets that extend over a much
wider range of temperatures (170 −293) K, Ulybin and Makarushkin [40], and (176 – 375) K, Clarke
and Smith [37].
FIG. 1 Temperature-pressure ranges of the theoretical calculations and the primary experimental
viscosity data for xenon (temperature restricted to 1000 K as in the region up to 5000 K only dilute-gas
values exist). (–) saturation curve.

7
FIG. 2 Temperature-density ranges of the theoretical calculations and the primary experimental
viscosity data for xenon (temperature restricted to 1000 K as in the region up to 5000 K only dilute-gas
values exist). (–) saturation curve.
Figures 1 and 2 show the ranges of the theoretical calculations and primary measurements outlined
in Table 1, and the phase boundary may be seen as well. The development of the correlation requires
densities; Lemmon and Span [50] in 2006 developed an accurate, wide-ranging equation of state that is
valid from the triple point up to 750 K and 700 MPa. The equation of state has an uncertainty in density
of 0.2 % up to 100 MPa, rising to 1 % at higher pressures. We also adopt the values for the critical point
from their equation of state; the critical temperature, Tc, and the critical density, ρc, are 289.733 K and
1102.8612 kg m-3, respectively [50]. The triple-point temperature given by Lemmon and Span [50] is
161.405 K. We here adopt the value of 161.406 K given in 2005 by Hill and Steele [51] and recently
confirmed by Steur et al.[52]

8
2.1 The dilute-gas limit viscosity term
The dilute-gas limit viscosity, η0(Τ) in μPa s, can be analyzed independently of all other contributions
in Eq. 1. As already discussed in the previous section, Xiao et al. [29, 30] first used improvements to ab
initio helium calculations [31] to update previously measured viscosity ratios [24]. Following this, they
used these improved values to get better reference correlations for the dilute-gas viscosity of xenon and
9 other gases. The new reference dilute-gas viscosity correlation for xenon covers the temperature range
from (100 – 5000) K with an expanded combined (k = 2) uncertainty of 0.2 %, and it will form the
dilute-gas viscosity contribution of xenon in this work. The dilute-gas limit viscosity, η0 (μPa‧s) given
by Xiao et al. [29, 30] is,
11
0 0
1
( ) (298.15Κ) exp ln298.15 K
i
i
i
TT a
=
=
. (2)
For the viscosity at 298.15 K, η0(298.15 Κ), the value of (23.0183 ± 0.0072) μPa‧s, proposed by Berg
and Moldover [25] was adopted [29]. The coefficients ai (-), are shown in Table 2.
Table 2 Coefficients ai of Eq. 2 [29].
i ai
1 9.652 514×10-1
2 −5.237 199×10-2
3 −6.758 414×10-2
4 2.855 787×10-2
5 1.002 789×10-2
6 −9.639 621×10-3
7 1.329 770×10-3
8 1.114 305×10-3
9 −5.992 234×10-4
10 1.224 218×10-4
11 −9.584 978×10-6
9
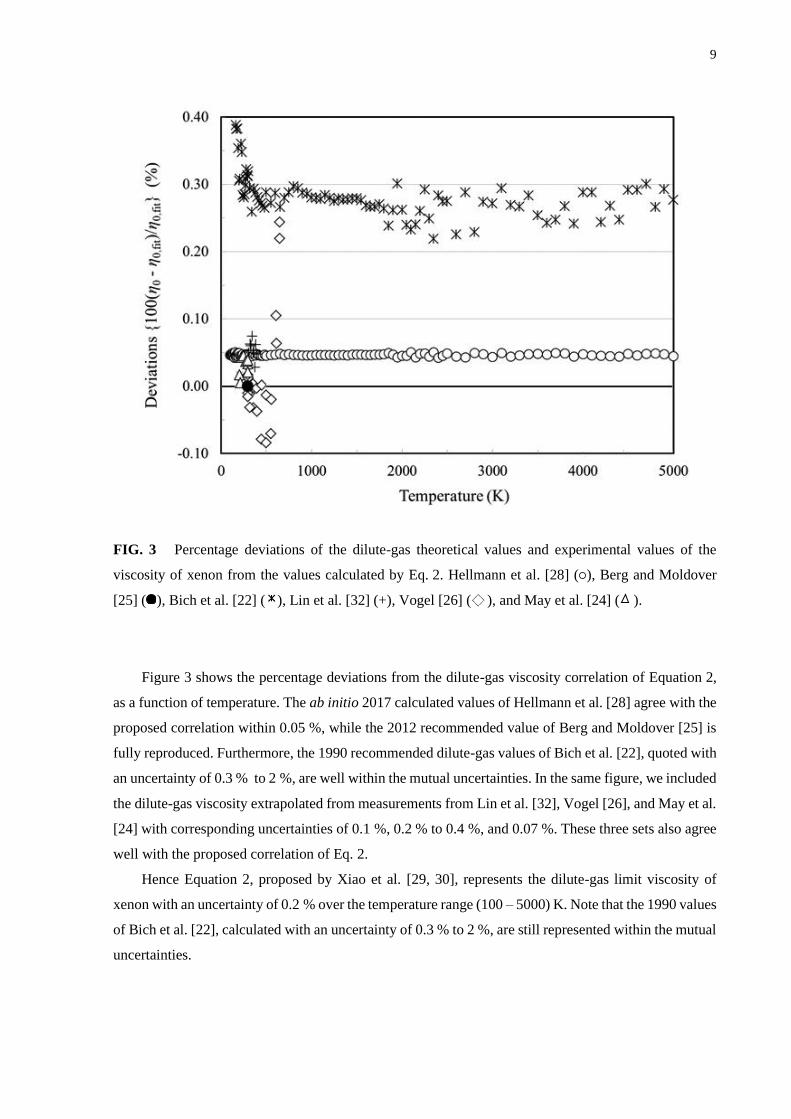
FIG. 3 Percentage deviations of the dilute-gas theoretical values and experimental values of the
viscosity of xenon from the values calculated by Eq. 2. Hellmann et al. [28] ( ), Berg and Moldover
[25] ( ), Bich et al. [22] ( ), Lin et al. [32] (+), Vogel [26] ( ), and May et al. [24] ( ).
Figure 3 shows the percentage deviations from the dilute-gas viscosity correlation of Equation 2,
as a function of temperature. The ab initio 2017 calculated values of Hellmann et al. [28] agree with the
proposed correlation within 0.05 %, while the 2012 recommended value of Berg and Moldover [25] is
fully reproduced. Furthermore, the 1990 recommended dilute-gas values of Bich et al. [22], quoted with
an uncertainty of 0.3 % to 2 %, are well within the mutual uncertainties. In the same figure, we included
the dilute-gas viscosity extrapolated from measurements from Lin et al. [32], Vogel [26], and May et al.
[24] with corresponding uncertainties of 0.1 %, 0.2 % to 0.4 %, and 0.07 %. These three sets also agree
well with the proposed correlation of Eq. 2.
Hence Equation 2, proposed by Xiao et al. [29, 30], represents the dilute-gas limit viscosity of
xenon with an uncertainty of 0.2 % over the temperature range (100 – 5000) K. Note that the 1990 values
of Bich et al. [22], calculated with an uncertainty of 0.3 % to 2 %, are still represented within the mutual
uncertainties.

10
2.2 The initial-density dependence viscosity term
The temperature dependence of the linear-in-density coefficient of the viscosity η1(T) in Eq. 1 is large
at subcritical temperatures and must be taken into account to obtain an accurate representation of the
behavior of the viscosity in the vapor phase. It changes sign from positive to negative as the temperature
decreases. Therefore, the viscosity along an isotherm should first decrease in the vapor phase and
subsequently increase with increasing density [53]. Vogel et al. [54] have shown that fluids exhibit the
same general behavior of the initial density dependence of viscosity, which can also be expressed by
means of the second viscosity virial coefficient Bη(T) in m3‧kg-1, as
1
0
( )( )
( )
= . (3)
Note that in the above equation, if the dilute-gas limit viscosity, η0(Τ), is expressed in μPa s, then the
initial-density viscosity, η1(Τ), will be expressed in μPa‧s‧m3‧kg-1. The second viscosity virial coefficient
can be obtained according to the theory of Rainwater and Friend [13, 14] as a function of a reduced
second viscosity virial coefficient, * *( ) , as
* *
3A
( )( )
M
N
= , (4)
where [14]
( ) ( ) ( )6 0.25 2.5 5.5
* * * * *7 8
0
( )i
ib T b T b T
− − −
=
= + + . (5)
In Eq. 4, M is the molar mass in g mol-1 given in Table 3, T* is the scaled temperature T/(ε/kB), and NA
is the Avogadro constant. The coefficients bi from Ref. [53] are given in Table 3, together with the
scaling parameters σ and ε/kB proposed by Bich et al. [22].
Table 3 Coefficients and parameters for Eqs. 4 and 5.
Molar mass
131.293 g‧mol-1
Scaling parameters
ε/kB = 250.0 Κ σ = 0.396 nm
Coefficients bi for Eq. 5 [53]
b0 = −19.572 881 b1 = 219.739 99 b2 = −1015.322 6
b3 = 2471.012 5 b4 = −3375.171 7 b5 = 2491.659 7
b6 = −787.260 86 b7 = 14.085 455 b8 = −0.346 641 58
11
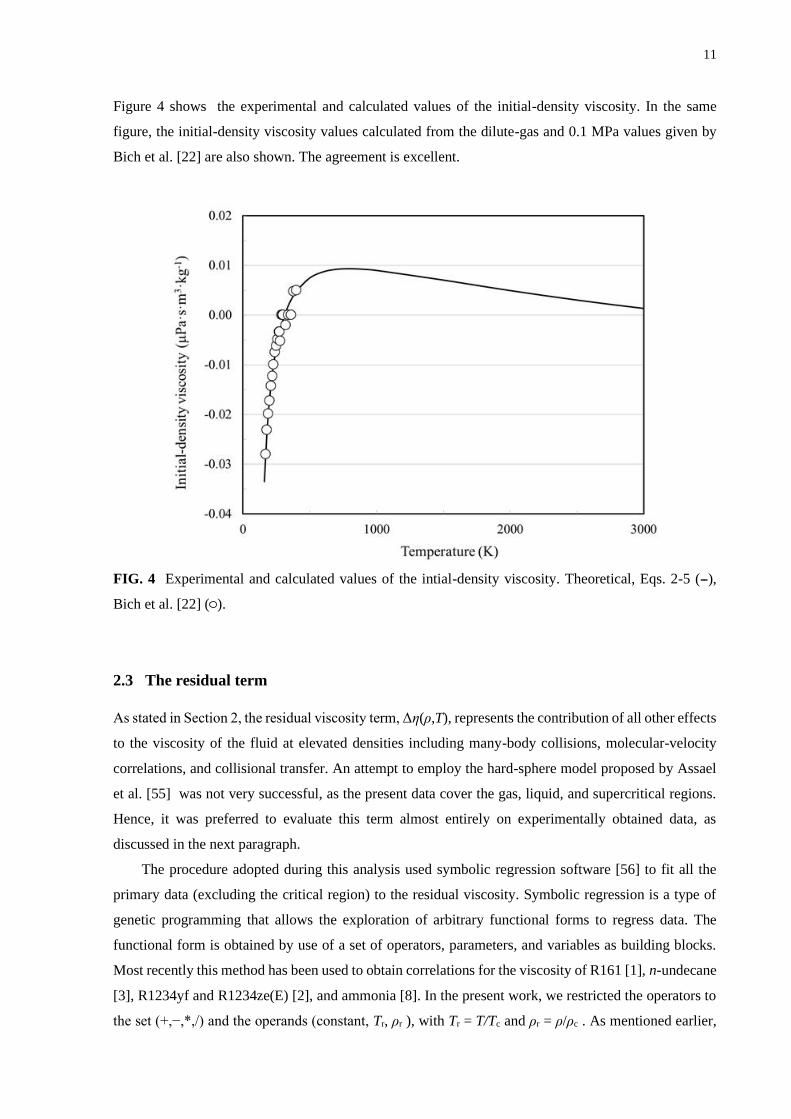
Figure 4 shows the experimental and calculated values of the initial-density viscosity. In the same
figure, the initial-density viscosity values calculated from the dilute-gas and 0.1 MPa values given by
Bich et al. [22] are also shown. The agreement is excellent.
FIG. 4 Experimental and calculated values of the intial-density viscosity. Theoretical, Eqs. 2-5 (--),
Bich et al. [22] ( ).
2.3 The residual term
As stated in Section 2, the residual viscosity term, Δη(ρ,T), represents the contribution of all other effects
to the viscosity of the fluid at elevated densities including many-body collisions, molecular-velocity
correlations, and collisional transfer. An attempt to employ the hard-sphere model proposed by Assael
et al. [55] was not very successful, as the present data cover the gas, liquid, and supercritical regions.
Hence, it was preferred to evaluate this term almost entirely on experimentally obtained data, as
discussed in the next paragraph.
The procedure adopted during this analysis used symbolic regression software [56] to fit all the
primary data (excluding the critical region) to the residual viscosity. Symbolic regression is a type of
genetic programming that allows the exploration of arbitrary functional forms to regress data. The
functional form is obtained by use of a set of operators, parameters, and variables as building blocks.
Most recently this method has been used to obtain correlations for the viscosity of R161 [1], n-undecane
[3], R1234yf and R1234ze(E) [2], and ammonia [8]. In the present work, we restricted the operators to
the set (+,−,*,/) and the operands (constant, Tr, ρr ), with Tr = T/Tc and ρr = ρ/ρc . As mentioned earlier,

12
the critical temperature Tc = 289.733 K and critical density ρc = 1102.8612 kg∙m-3 are from the equation
of state of Lemmon and Span [50]. In addition, we adopted a form suggested by the hard-sphere model
employed by Assael et al. [55], Δη(ρr,Tr)=(ρr2/3Tr
1/2)F(ρr,Tr), where the symbolic regression method was
used to determine the functional form for F(ρr,Tr). For this task, the dilute-gas limit and the initial density
dependence term were calculated for each experimental point, employing Eqs. 2-5, and subtracted from
the experimental viscosity to obtain the residual term, Δη(ρr,Tr). The density values employed were
obtained by the equation of state of Lemmon and Span [50]. The final equation obtained was
72/3 1/2 4 2 3 r1 rr r r 0 r r 2
r r
( )( , ) ( ) .
c ccT T T c T
T T
+ = + + +
(6)
Coefficients ci are given in Table 4, and Δη is in μPa‧s.
Table 4 Coefficients ci for Eq. 6.
i ci
0 1.396 328 251
1 5.418 871 011×10−4
2 4.478 809 952
3 2.491 698 858×10+1
2.4 Critical Enhancement
The viscosity of xenon in the critical region has been definitively studied by Berg and Moldover [57]
and Berg et al. [23] on earth and in microgravity. Measurements in microgravity allowed the critical
temperature to be approached much more closely along the critical isochore. It was found that xenon
exhibited viscoelasticity for reduced temperatures of t = (T−Tc)/Tc 10-5. The viscosity measurements
were made at frequencies from 1/32 to 12.5 Hz and the results reported from measurements at 2 Hz are
considered here. The relative repeatability of the viscosity measurements was about ±0.2 % and the
relative uncertainty of the viscometer calibration was ±1.6 % at a 2 confidence level.
These results for xenon in the critical region agreed well with the theory of Bhattacharjee and
coworkers [18, 58]. This critical enhancement theory has also been shown to work well for both water
[59, 60], and heavy water [61]. The critical enhancement is given by

13
( )c exp x Y = , (7)
where x is the critical exponent for viscosity and the function Y is defined for two ranges of correlation
length . For 0 0.06 nm
( ) ( ) ( )5 2 2
C D C C D
1 7651
5 504Y q q q q q
= − + −
, (8)
while for > 0.06 nm
( ) ( )( )
( ) ( )
( )( ) ( )
2
D D C D2
C C
3/22 2
C D C3
C
1 1 1 5sin 3 sin 2 1 sin
12 4 4
1 31 1 ( )
2
Y qq q
q q L wq
= − + −
− − − −
(9)
with
( )1
2 2 2
D Darccos 1 q −
= + (10)
and with the function L(w) given by
C
C
1ln , for 1
( ) 1
2 arctan , for 1
wq
L w w
w q
+
= −
. (11)
The variable w is defined by
12
C D
C
1tan
1 2
qw
q
− =
+ . (12)
The critical enhancement of viscosity given by Eqs. (7) – (12) is a function of the correlation length
calculated from the equation of state:
=
+
0
0 (13)
14
in terms of (≥ 0) which is defined by
−
=
T
T
p
T
p
T
TT
RR ),(),( . (14)
When calculated by Eq. (14) is less than zero, it must be set to zero for calculations to proceed.
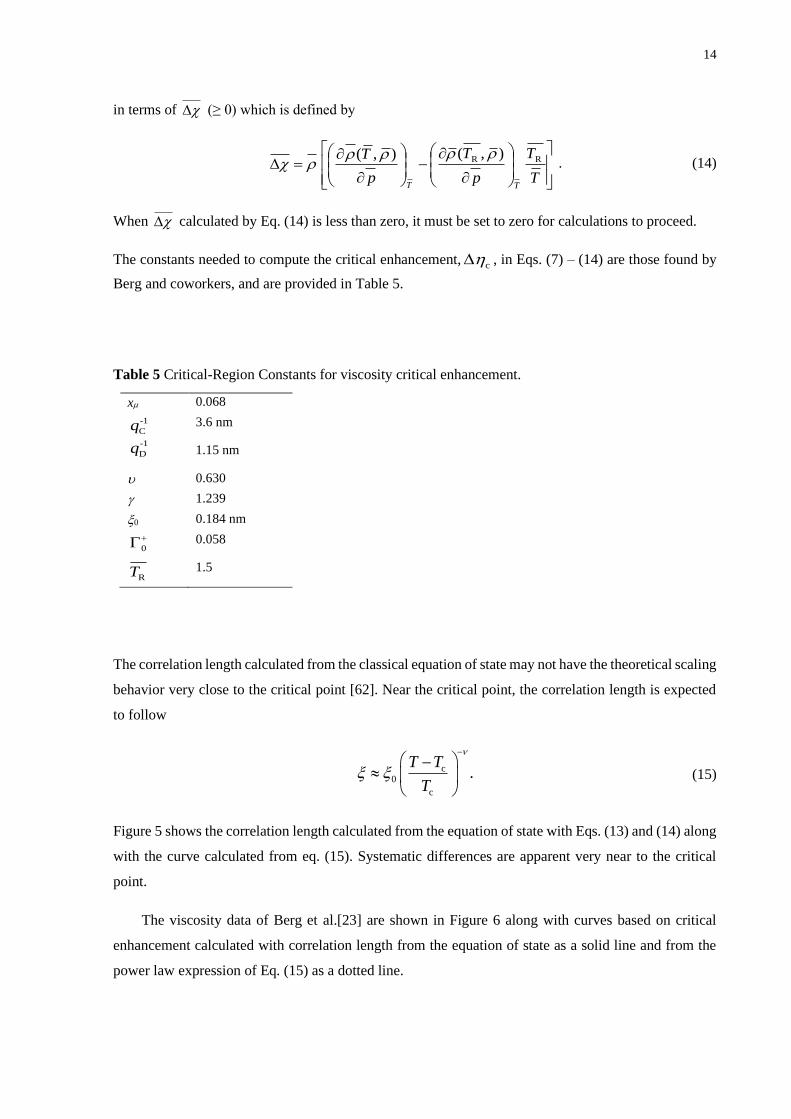
The constants needed to compute the critical enhancement,c , in Eqs. (7) – (14) are those found by
Berg and coworkers, and are provided in Table 5.
Table 5 Critical-Region Constants for viscosity critical enhancement.
x 0.068
-1
Cq 3.6 nm
-1
Dq 1.15 nm
0.630
1.239
0 0.184 nm
0
+ 0.058
RT 1.5
The correlation length calculated from the classical equation of state may not have the theoretical scaling
behavior very close to the critical point [62]. Near the critical point, the correlation length is expected
to follow
c
0
c
.T T
T
−
−
(15)
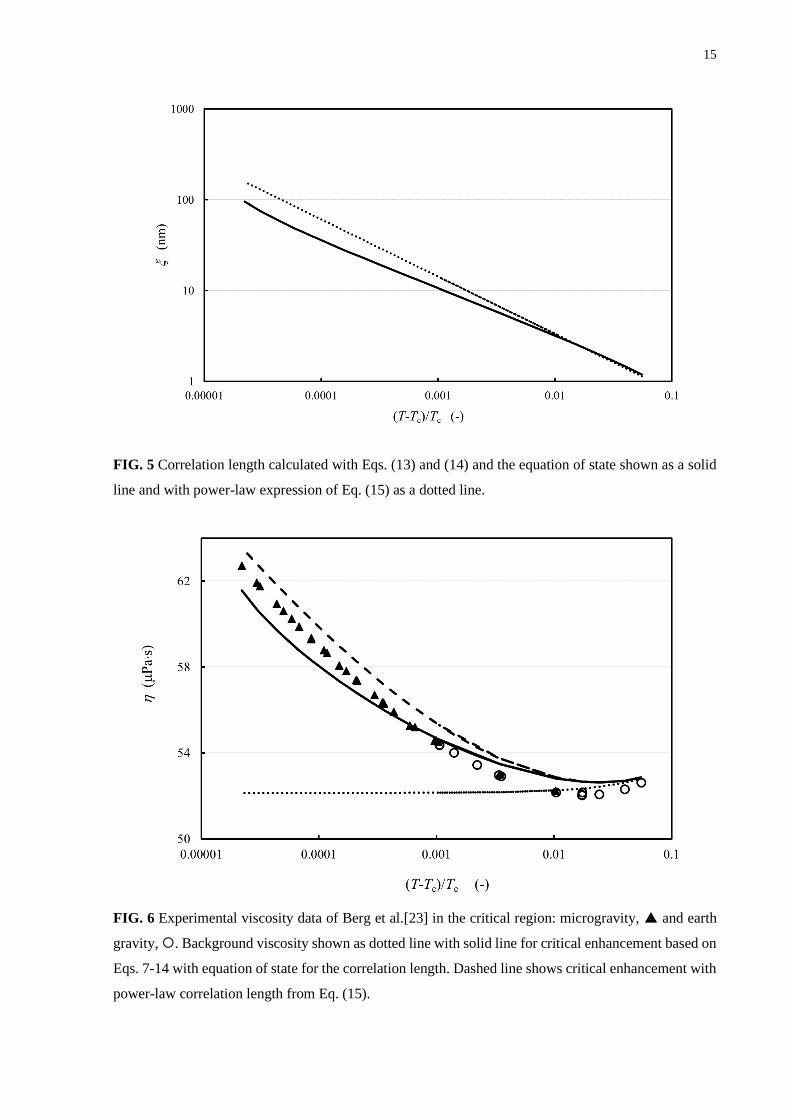
Figure 5 shows the correlation length calculated from the equation of state with Eqs. (13) and (14) along
with the curve calculated from eq. (15). Systematic differences are apparent very near to the critical
point.
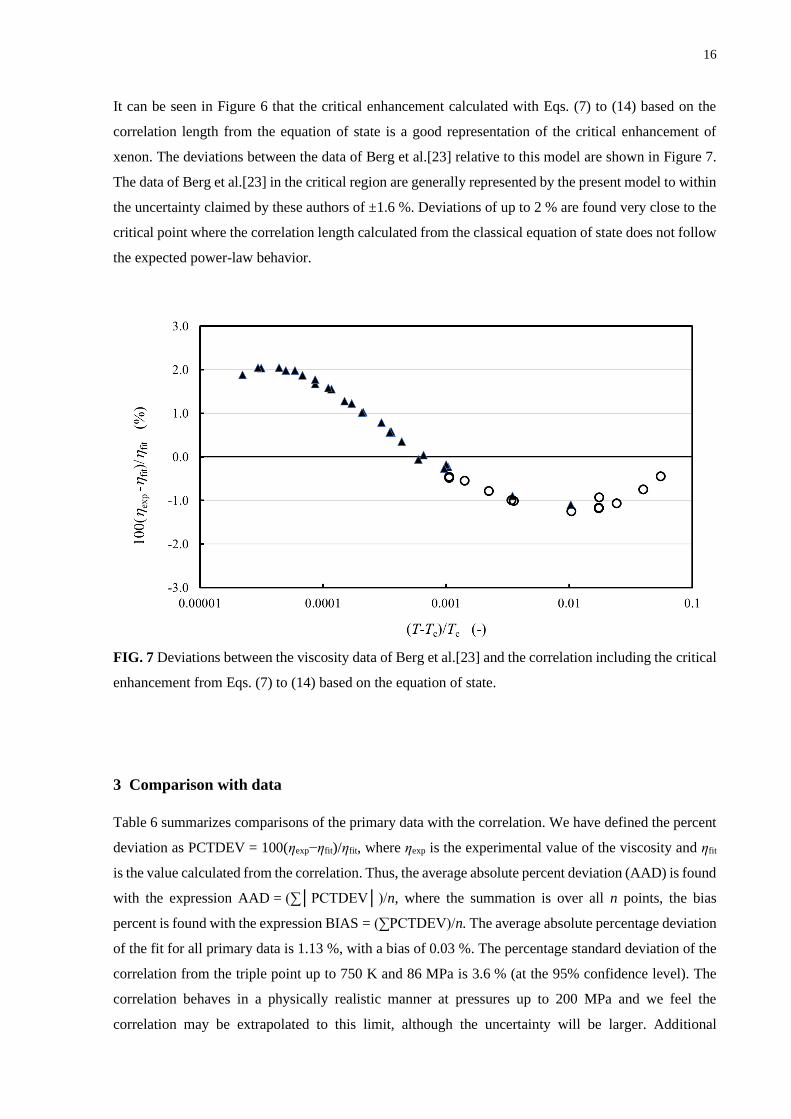
The viscosity data of Berg et al.[23] are shown in Figure 6 along with curves based on critical
enhancement calculated with correlation length from the equation of state as a solid line and from the
power law expression of Eq. (15) as a dotted line.
15
FIG. 5 Correlation length calculated with Eqs. (13) and (14) and the equation of state shown as a solid
line and with power-law expression of Eq. (15) as a dotted line.
FIG. 6 Experimental viscosity data of Berg et al.[23] in the critical region: microgravity, and earth
gravity, . Background viscosity shown as dotted line with solid line for critical enhancement based on
Eqs. 7-14 with equation of state for the correlation length. Dashed line shows critical enhancement with
power-law correlation length from Eq. (15).
16
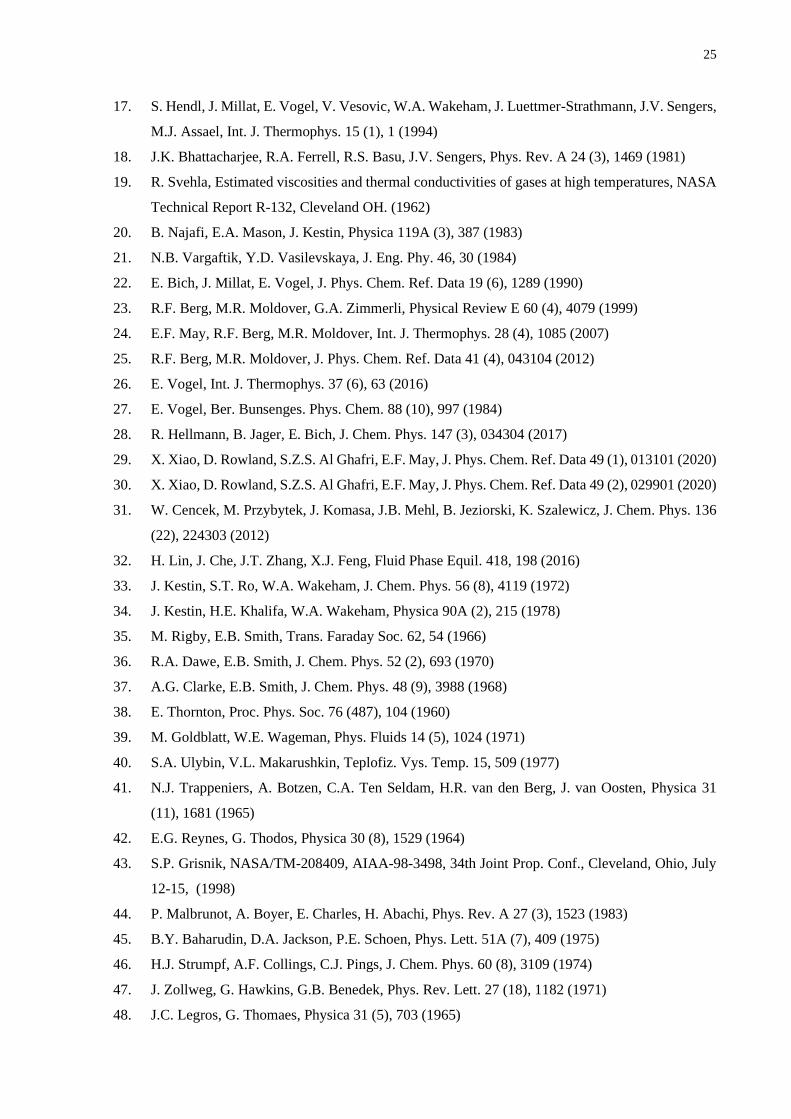
It can be seen in Figure 6 that the critical enhancement calculated with Eqs. (7) to (14) based on the
correlation length from the equation of state is a good representation of the critical enhancement of
xenon. The deviations between the data of Berg et al.[23] relative to this model are shown in Figure 7.
The data of Berg et al.[23] in the critical region are generally represented by the present model to within
the uncertainty claimed by these authors of ±1.6 %. Deviations of up to 2 % are found very close to the
critical point where the correlation length calculated from the classical equation of state does not follow
the expected power-law behavior.
FIG. 7 Deviations between the viscosity data of Berg et al.[23] and the correlation including the critical
enhancement from Eqs. (7) to (14) based on the equation of state.
3 Comparison with data
Table 6 summarizes comparisons of the primary data with the correlation. We have defined the percent
deviation as PCTDEV = 100(ηexp−ηfit)/ηfit, where ηexp is the experimental value of the viscosity and ηfit
is the value calculated from the correlation. Thus, the average absolute percent deviation (AAD) is found
with the expression AAD = (∑│PCTDEV│)/n, where the summation is over all n points, the bias
percent is found with the expression BIAS = (∑PCTDEV)/n. The average absolute percentage deviation
of the fit for all primary data is 1.13 %, with a bias of 0.03 %. The percentage standard deviation of the
correlation from the triple point up to 750 K and 86 MPa is 3.6 % (at the 95% confidence level). The
correlation behaves in a physically realistic manner at pressures up to 200 MPa and we feel the
correlation may be extrapolated to this limit, although the uncertainty will be larger. Additional

17
experimental data at high pressures are necessary to validate the correlation or make improved
correlations possible in the future.
Table 6. Evaluation of the xenon viscosity correlation for the primary data.
Investigators / Reference AAD
(%)
BIAS
(%)
Lin et al. [32] 0.05 0.05
Vogel [26] 0.38 −0.38
May et al. [24] 0.03 0.03
Berg et al. [23] 1.19 0.24
Kestin et al. [34] 0.99 0.91
Kestin et al. [33] 0.74 0.65
Ulybin and Makarushkin [40] 0.79 −0.40
Goldblatt and Wageman [39] 1.23 1.23
Dawe and Smith [36] 0.52 −0.18
Clarke and Smith [37] 0.58 −0.55
Rigby and Smith [35] 1.35 −1.35
Trappeniers et al. [41] 3.44 3.24
Reynes and Thodos [42] 1.63 −0.90
Thornton [38] 0.67 −0.67
Entire data set 1.13 0.03
Fig. 8 shows the percentage deviations of all primary viscosity data of xenon, excluding the critical
region data of Berg et al.[23], from the values calculated by Eqs. 1 - 6, as a function of temperature,
while Figs. 9 and 10 show the same deviations but as a function of the pressure and the density. The
deviations of the experimental data from the present correlation are within the uncertainty of the
correlation with only a few exceptions. One point from the data set of Trappeniers et al. [41] at 298.135
K and 6.799 MPa is off scale and is not shown.

18
FIG. 8 Percentage deviations of primary experimental data of xenon from the values calculated by the
present model as a function of temperature. Lin et al. [32] (♦), Vogel [26] ( ), May et al. [24] ( ),
Kestin et al. [33] ( ), Kestin et al. [34] ( ), Rigby and Smith [35] (+), Ulybin and Makarushkin [40] (
), Goldblatt and Wageman [39] ( ), Dawe and Smith [36] (□), Clarke and Smith [37] ( ),
Trappeniers et al. [41] (X), Reynes and Thodos [42] (▲), and Thornton [38] (o).

19
FIG. 9 Percentage deviations of primary experimental data of xenon from the values calculated by the
present model as a function of pressure. Lin et al. [32] (♦), Vogel [26] ( ), May et al. [24] ( ), Kestin
et al. [33] ( ), Kestin et al. [34] ( ), Rigby and Smith [35] (+), Ulybin and Makarushkin [40] ( ),
Goldblatt and Wageman [39] ( ), Dawe and Smith [36] (□), Clarke and Smith [37] ( ), Trappeniers
et al. [41] (X), Reynes and Thodos [42] (▲), and Thornton [38] (o).
\

20
FIG. 10 Percentage deviations of primary experimental data of xenon from the values calculated by
the present model as a function of density. Lin et al. [32] (♦), Vogel [26] ( ), May et al. [24] ( ), Kestin
et al. [33] ( ), Kestin et al. [34] ( ), Rigby and Smith [35] (+), Ulybin and Makarushkin [40] ( ),
Goldblatt and Wageman [39] ( ), Dawe and Smith [36] (□), Clarke and Smith [37] ( ), Trappeniers
et al. [41] (X), Reynes and Thodos [42] (▲), and Thornton [38] (o).
Table 7 shows the average absolute percent deviation (AAD) and the bias for the secondary data.
Finally, Fig. 11 shows a plot of the viscosity of xenon as a function of the temperature for different
pressures. The plot demonstrates the extrapolation behavior at pressures higher than 86 MPa, and at
temperatures that exceed the 750 K limit of the equation of state.

21
Table 7 Evaluation of the xenon viscosity correlation for the secondary data.
FIG. 11 Viscosity of xenon as a function of the temperature for different pressures.
Investigators / Reference AAD
(%)
BIAS
(%)
Grisnik [43] 1.62 1.19
Malbrunot et al. [44] 11.28 11.28
Baharudin et al. [45] 5.28 5.28
Strumpf et al. [46] 7.71 7.70
Zollweg et al [47] 2.73 −2.67
Legros and Thomaes [48] 5.53 5.53
Kestin and Leidenfrost [49] 1.96 −1.96

22
4 Recommended Values
In Table 8, viscosity values are given along the saturated liquid and vapor lines, calculated from the
present proposed correlations between (170 – 285) K, while in Table 9 viscosity values are given for
temperatures between (200 – 750) K at selected pressures. Saturation pressure and saturation density
values for selected temperatures, as well as the density values for the selected temperature and pressure,
are obtained from the equation of state of Lemmon and Span [50]. The calculations are performed at the
given temperatures and densities. For computer verification of values, the following points may be used
for the given T, ρ conditions: T = 300 K, ρ = 0 kg m-3, η = 23.1561 μPa‧s; T = 300 K, ρ = 6.0 kg‧m-3,
η = 23.3186 μPa‧s; T = 300 K, ρ = 2500.0 kg‧m-3, η = 206.449 μPa‧s. For checking the critical
enhancement, T = 292.711322 K, ρ = 0 kg m-3, η = 22.6125 μPa‧s; T = 292.711322 K, ρ = 1102.9 kg m-
3, η = 52.82074 μPa‧s.
Table 8 Viscosity values of xenon along the saturation line, calculated by the present scheme.
Τ
(Κ)
p
(MPa)
ρliq
(kg‧m−3)
ρvap
(kg‧m−3)
ηliq
(μPa‧s)
ηvap
(μPa‧s)
170 0.13343 2908.8 12.88 442.32 13.56
190 0.34774 2768.4 31.19 326.28 15.19
210 0.75025 2614.9 64.37 248.25 17.00
230 1.4155 2441.5 120.1 193.12 19.19
250 2.4229 2235.4 212.1 150.75 22.14
270 3.8623 1962.2 376.6 113.51 26.93
285 5.3025 1607.3 655.3 81.276 35.30

23
Table 9 Viscosity values of xenon at selected temperatures and pressures, calculated by the present
scheme.
p
(MPa)
T
(K)
ρ
(kg‧m−3)
η
(μPa‧s)
p
(MPa)
T
(K)
ρ
(kg‧m−3)
η
(μPa‧s)
0.1 200 8.032 15.80 50 200 2956.6 460.85
250 6.372 19.57 250 2706.5 276.72
300 5.291 23.31 300 2449.8 193.41
350 4.526 26.96 350 2190.7 147.31
400 3.956 30.51 400 1940.7 117.85
450 3.514 33.93 450 1713.6 98.60
500 3.161 37.23 500 1518.5 86.59
550 2.873 40.42 550 1356.5 79.49
600 2.633 43.49 600 1223.6 75.56
650 2.430 46.46 650 1114.6 73.64
700 2.256 49.33 700 1024.1 72.97
750 2.106 52.12 750 948.3 73.13
10 200 2762.2 317.4 80 200 3056.9 577.06
250 2375.5 176.2 250 2843.6 351.34
300 1744.0 92.16 300 2634.4 249.56
350 724.4 41.81 350 2431.1 196.21
400 501.1 39.59 400 2237.8 163.37
450 403.8 41.02 450 2058.5 140.81
500 344.5 43.25 500 1896.0 124.61
550 303.1 45.75 550 1751.2 112.93
600 271.9 48.34 600 1623.5 104.61
650 247.3 50.94 650 1511.4 98.79
700 227.2 53.54 700 1412.9 94.81
750 210.4 56.10 750 1326.3 92.21
5 Conclusions
A new wide-ranging correlation for the viscosity of xenon was developed based on critically evaluated
experimental data and theoretical results. In the dilute-gas range, the correlation incorporates the very
recent correlation of Xiao et al. [29, 30] with a quoted uncertainty of 0.2 %, while the initial-density
dependence viscosity is based on the scheme proposed by Vogel et al. [53]. The residual term is based
on a critically evaluated set of measurements. In the dilute-gas region the uncertainty is 0.2 %, while in
all other cases it is 3.6 % (in the 95% confidence level). The correlation is valid for temperatures from

24
the triple-point temperature to 750 K, a limit imposed by the validity of the equation of state, while its
pressure range extends to 86 MPa. The correlation behaves in a physically realistic manner at pressures
up to 200 MPa and we feel the correlation may be extrapolated to this limit, although the uncertainty
will be larger, and caution is advised. A critical enhancement term based on the data of Berg et al.[23]
has also been included for the near-critical region but is not necessary for industrial applications.
Finally, it is worth saying that the new correlation is characterized by a lower uncertainty than
previous correlations while at the same time covers the wide range of temperature and pressure of the
available measurements.
6 References
1. C.M. Tsolakidou, M.J. Assael, M.L. Huber, R.A. Perkins, J. Phys. Chem. Ref. Data 46 (2),
023103 (2017)
2. M.L. Huber, M.J. Assael, Int. J. Refrig. 71, 39 (2016)
3. M.J. Assael, T.B. Papalas, M.L. Huber, J. Phys. Chem. Ref. Data 46, 033103 (2017)
4. S. Avgeri, M.J. Assael, M.L. Huber, R.A. Perkins, J. Phys. Chem. Ref. Data 43 (3), 033103 (2014)
5. S. Avgeri, M.J. Assael, M.L. Huber, R.A. Perkins, J. Phys. Chem. Ref. Data 44 (3), 033101 (2015)
6. E.K. Michailidou, M.J. Assael, M.L. Huber, R.A. Perkins, J. Phys. Chem. Ref. Data 42 (3),
033104 (2013)
7. E.K. Michailidou, M.J. Assael, M.L. Huber, I.M. Abdulagatov, R.A. Perkins, J. Phys. Chem. Ref.
Data 43 (2), 023103 (2014)
8. S.A. Monogenidou, M.J. Assael, M.L. Huber, J. Phys. Chem. Ref. Data 47 (2), 023102 (2018)
9. H.J.M. Hanley, R.D. McCarty, W.M. Haynes, J. Phys. Chem. Ref. Data 3, 979 (1974)
10. M.L. Huber, Models for viscosity, thermal conductivity, and surface tension of selected fluids as
implemented in REFPROP v10.0, NISTIR 8209, DOI:10.6028/NIST.IR.8209. (2018)
11. E.W. Lemmon, I.H. Bell, M.L. Huber, M.O. McLinden, NIST Standard Reference Database 23,
NIST Reference Fluid Thermodynamic and Transport Properties Database (REFPROP): Version
10.0. (2018)
12. M.J. Assael, A.E. Kalyva, S.A. Monogenidou, M.L. Huber, R.A. Perkins, D.G. Friend, E.F. May,
J. Phys. Chem. Ref. Data 47 (2), 021501 (2018)
13. D.G. Friend, J.C. Rainwater, Chem. Phys. Lett. 107 (6), 590 (1984)
14. J.C. Rainwater, D.G. Friend, Phys. Rev. A 36 (8), 4062 (1987)
15. E. Bich, E. Vogel, Chap. 5.2, in Transport Properties of Fluids. Their Correlation, Prediction and
Estimation. (Cambridge University Press, Cambridge, 1996)
16. V. Vesovic, W.A. Wakeham, G.A. Olchowy, J.V. Sengers, J.T.R. Watson, J. Millat, J. Phys.
Chem. Ref. Data 19 (3), 763 (1990)
25
17. S. Hendl, J. Millat, E. Vogel, V. Vesovic, W.A. Wakeham, J. Luettmer-Strathmann, J.V. Sengers,
M.J. Assael, Int. J. Thermophys. 15 (1), 1 (1994)
18. J.K. Bhattacharjee, R.A. Ferrell, R.S. Basu, J.V. Sengers, Phys. Rev. A 24 (3), 1469 (1981)
19. R. Svehla, Estimated viscosities and thermal conductivities of gases at high temperatures, NASA
Technical Report R-132, Cleveland OH. (1962)
20. B. Najafi, E.A. Mason, J. Kestin, Physica 119A (3), 387 (1983)
21. N.B. Vargaftik, Y.D. Vasilevskaya, J. Eng. Phy. 46, 30 (1984)
22. E. Bich, J. Millat, E. Vogel, J. Phys. Chem. Ref. Data 19 (6), 1289 (1990)
23. R.F. Berg, M.R. Moldover, G.A. Zimmerli, Physical Review E 60 (4), 4079 (1999)
24. E.F. May, R.F. Berg, M.R. Moldover, Int. J. Thermophys. 28 (4), 1085 (2007)
25. R.F. Berg, M.R. Moldover, J. Phys. Chem. Ref. Data 41 (4), 043104 (2012)
26. E. Vogel, Int. J. Thermophys. 37 (6), 63 (2016)
27. E. Vogel, Ber. Bunsenges. Phys. Chem. 88 (10), 997 (1984)
28. R. Hellmann, B. Jager, E. Bich, J. Chem. Phys. 147 (3), 034304 (2017)
29. X. Xiao, D. Rowland, S.Z.S. Al Ghafri, E.F. May, J. Phys. Chem. Ref. Data 49 (1), 013101 (2020)
30. X. Xiao, D. Rowland, S.Z.S. Al Ghafri, E.F. May, J. Phys. Chem. Ref. Data 49 (2), 029901 (2020)
31. W. Cencek, M. Przybytek, J. Komasa, J.B. Mehl, B. Jeziorski, K. Szalewicz, J. Chem. Phys. 136
(22), 224303 (2012)
32. H. Lin, J. Che, J.T. Zhang, X.J. Feng, Fluid Phase Equil. 418, 198 (2016)
33. J. Kestin, S.T. Ro, W.A. Wakeham, J. Chem. Phys. 56 (8), 4119 (1972)
34. J. Kestin, H.E. Khalifa, W.A. Wakeham, Physica 90A (2), 215 (1978)
35. M. Rigby, E.B. Smith, Trans. Faraday Soc. 62, 54 (1966)
36. R.A. Dawe, E.B. Smith, J. Chem. Phys. 52 (2), 693 (1970)
37. A.G. Clarke, E.B. Smith, J. Chem. Phys. 48 (9), 3988 (1968)
38. E. Thornton, Proc. Phys. Soc. 76 (487), 104 (1960)
39. M. Goldblatt, W.E. Wageman, Phys. Fluids 14 (5), 1024 (1971)
40. S.A. Ulybin, V.L. Makarushkin, Teplofiz. Vys. Temp. 15, 509 (1977)
41. N.J. Trappeniers, A. Botzen, C.A. Ten Seldam, H.R. van den Berg, J. van Oosten, Physica 31
(11), 1681 (1965)
42. E.G. Reynes, G. Thodos, Physica 30 (8), 1529 (1964)
43. S.P. Grisnik, NASA/TM-208409, AIAA-98-3498, 34th Joint Prop. Conf., Cleveland, Ohio, July
12-15, (1998)
44. P. Malbrunot, A. Boyer, E. Charles, H. Abachi, Phys. Rev. A 27 (3), 1523 (1983)
45. B.Y. Baharudin, D.A. Jackson, P.E. Schoen, Phys. Lett. 51A (7), 409 (1975)
46. H.J. Strumpf, A.F. Collings, C.J. Pings, J. Chem. Phys. 60 (8), 3109 (1974)
47. J. Zollweg, G. Hawkins, G.B. Benedek, Phys. Rev. Lett. 27 (18), 1182 (1971)
48. J.C. Legros, G. Thomaes, Physica 31 (5), 703 (1965)
26
49. J. Kestin, W. Leidenfrost, Physica 25 (11), 1033 (1959)
50. E.W. Lemmon, R. Span, J. Chem. Eng. Data 51 (3), 785 (2006)
51. K.D. Hill, A.G. Steele, Metrologia 42 (4), 278 (2005)
52. P.P.M. Steur, P.M.C. Rourke, D. Giraudi, Metrologia 56 (1), 015008 (2019)
53. Ε. Vogel, C. Küchenmeister, Ε. Bich, A. Laesecke, J. Phys. Chem. Ref. Data 27 (5), 947 (1998)
54. E. Vogel, E. Bich, R. Nimz, Physica A 139 (1), 188 (1986)
55. M.J. Assael, J.H. Dymond, M. Papadaki, P.M. Patterson, Int. J. Thermophys. 13, 269 (1992)
56. EUREQA Formulize v.098.1 (Nutonian Inc, Cambridge MA, USA, 2012) - Commercial
equipment, instruments, or materials are identified only in order to adequately specify certain
procedures. In no case does such identification imply recommendation or endorsement by the
National Institute of Standards and Technology, nor does it imply that the products identified are
necessarily the best available for the purpose.
57. R.F. Berg, M.R. Moldover, J. Chem. Phys. 93 (3), 1926 (1990)
58. J.K. Bhattacharjee, R.A. Ferrell, Phys. Rev. A 27 (3), 1544 (1983)
59. M.L. Huber, R.A. Perkins, A. Laesecke, D.G. Friend, J.V. Sengers, M.J. Assael, I.N. Metaxa, E.
Vogel, R. Mares, K. Miyagawa, J. Phys. Chem. Ref. Data 38 (2), 101 (2009)
60. J.V. Sengers, R.A. Perkins, M.L. Huber, D.G. Friend, Int. J. Thermophys. 30 (2), 374 (2009)
61. M.J. Assael, S.A. Monogenidou, M.L. Huber, R.A. Perkins, J.V. Sengers, J. Phys. Chem. Ref.
Data, to be submitted (2021)
62. J.V. Sengers, R.A. Perkins, Fluids Near Critical Points, in Experimental Thermodyamics Volume
IX Advances in Transport Properties of Fluids. (Royal Society of Chemistry, Cambridge, 2014)