reference manual for ms sensor 3.0 software
TRANSCRIPT
Reference Manual for
MS Sensor 3.0 Software
Copyright 2014, Diablo Analytical, Inc.

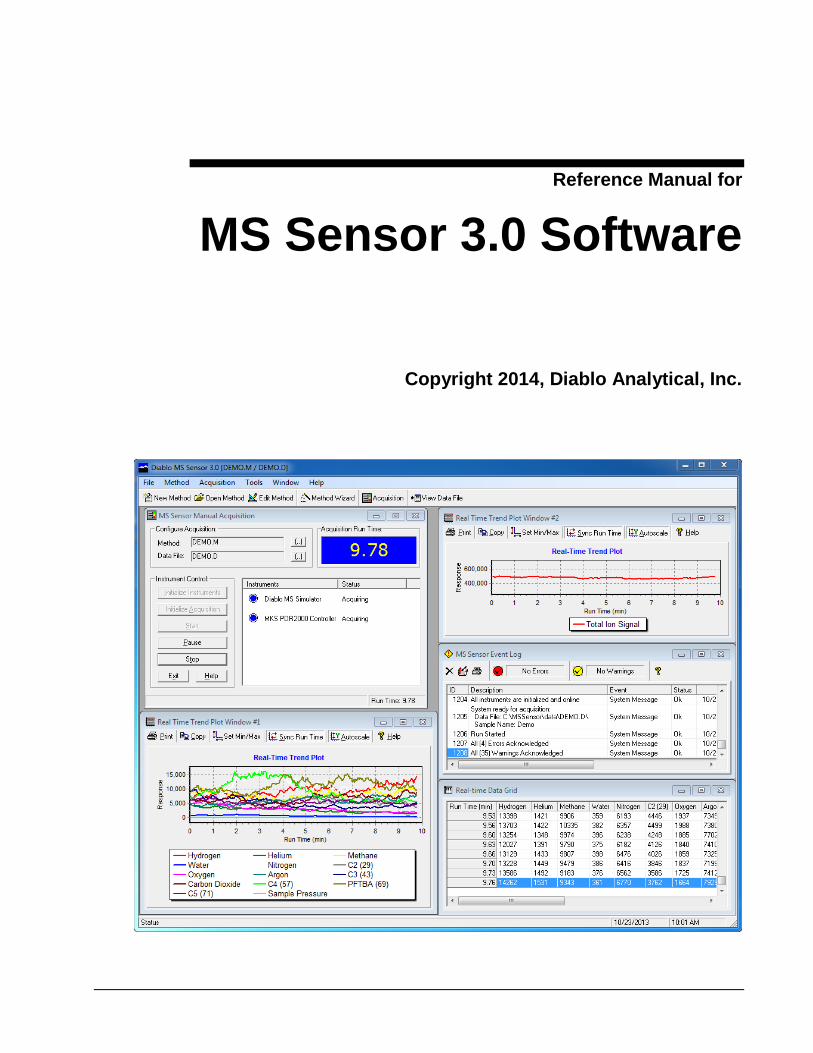
Diablo Analytical MS Sensor 3.0
Software Reference Manual
Copyright 2000-2014, Diablo Analytical, Inc. All Rights Reserved.
This software and documentation are copyrighted by Diablo Analytical, Inc. All other brands or
product names are trademarks or registered trademarks of their respective owners.
Diablo Analytical, Inc. 5141 Lone Tree Way
Antioch, CA 94531
Phone: 925-755-1005
Fax: 925-755-1007
E-mail: [email protected]
Home Page: www.diabloanalytical.com
Manual Revision 20140114-1446

DIABLO ANALYTICAL, INC. SOFTWARE LICENSE AGREEMENT AND LIMITED WARRANTY
LICENSE AGREEMENT
IMPORTANT: Please carefully read the License Agreement below before installing the software. The right to use this
software product is sold only on the condition that the customer agrees to the following license. INSTALLING THE
SOFTWARE INDICATES YOUR ACCEPTANCE OF THESE TERMS AND CONDITIONS.
In return for payment of the one-time license fee for this software product, Customer receives from Diablo Analytical,
Inc. (Diablo) a license to use the product subject to the following terms and conditions:
Use: The product may be used one computer or workstation. A separate license agreement and fee is required for each
additional computer or workstation on which the product is used. Customer may not reverse assemble, decompile, or
modify the software.
Copies: The software product may not be duplicated or copied except for archive purposes, program error verification,
or to replace defective media, and all copies made must bear the copyright notices contained in the original.
Ownership: Purchase of this license does not transfer any right, title or interest in the software product to Customer
except as specifically set forth in this License Agreement. Customer is on notice that the software product is protected
under copyright laws.
Transfer of Rights: This license and the software product may be transferred to a third party, with prior written consent
from Diablo, provided the third party agrees to all the terms of this License Agreement and the Customer does not retain
any copies of the software product.
Sublicensing and Distribution: Customer may not sublicense the software or distribute copies of the software to the
public in physical media or by telecommunication without the prior written consent of Diablo.
Termination: Diablo reserves the right to terminate this license upon breach. In event of termination, Customer will
either return all copies of the product to Diablo, or with Diablo's prior consent, provide Diablo with a certificate of
destruction of all copies.
Updates and Upgrades: Customer agrees that the software does not include updates and upgrades, which may be
available from Diablo in a separate support agreement.
Export Restrictions: Customer agrees not to export or re-export the software or any copy in violation of the U.S. Export
Administration regulations or other applicable regulation.
LIMITED WARRANTY
Limited Warranty: Diablo warrants that the original disks are free from defects for 90 days from the date of delivery of
the software.
No Other Warranties: To the maximum extent permitted by applicable law, Diablo expressly disclaims any warranty for
the software product. The software product and any related documentation is provided "as is" without warranty of any
kind, either express or implied, including, without limitation, the implied warranties or merchantability of fitness for a
particular purpose. The entire risk arising out of use or performance of the software product remains with the customer.
Limitation of Liability and Customer Remedies: Diablo's entire liability and the customer's exclusive remedy under this
license agreement shall be, at Diablo's option, either (a) return of the price paid for the software or (b) replacement of the
software that does not meet Diablo's Limited Warranty and which is returned to Diablo with a copy of the customer's
receipt. Any replacement software will be warranted for the remainder of the original warranty period, or 30 days,
whichever is longer. These remedies are not available outside the United States of America.

No Liability for Consequential Damages: To the maximum extent permitted by applicable law, in no event shall Diablo
be liable for any damages whatsoever (including, without limitation, damages for loss of business profit, business
interruption, loss of business information, or any other pecuniary loss) arising out of the use or inability to use the
product, even if Diablo has been advised of the possibility of such damages. Because some states/jurisdictions do not
allow the exclusion or limitation of liability for consequential or incidental damages, the above limitation may not apply
to you.
Reference Manual for MS Sensor 3.0 Software Contents v
Contents
Introduction 1
MS Sensor Overview ................................................................................................................. 1 MS Sensor System Requirements .............................................................................................. 1 Installation ................................................................................................................................. 2 Software License and Registration ............................................................................................ 2 About Diablo Analytical, Inc. .................................................................................................... 3 Software Support ....................................................................................................................... 3
Getting Started 5
Main Application Window ........................................................................................................ 5 Main Menu ................................................................................................................................ 6 Main Toolbar ............................................................................................................................. 7 Setting System Options .............................................................................................................. 7
Root Method Directory ................................................................................................ 7 Default Data Directory ................................................................................................ 8 Data File Viewing Application .................................................................................... 8
Method Overview ...................................................................................................................... 8 Method Components ................................................................................................... 8 Component Processing Flowchart ............................................................................... 9 Method Editor .............................................................................................................. 9
Acquiring Data......................................................................................................................... 10 Event Log ................................................................................................................................ 10
Viewing an Event ...................................................................................................... 12 Running the Demonstration Method ........................................................................................ 12
Methods 17
Default and Demo Methods ..................................................................................................... 17 Method Files ............................................................................................................................ 18 Opening Methods..................................................................................................................... 18 Creating New Methods ............................................................................................................ 19 The Method Editor ................................................................................................................... 19
The Method Editor Toolbar ....................................................................................... 20 Adding New Components to a Method ..................................................................... 21 Editing Method Parameters ....................................................................................... 21 Editing Method Components ..................................................................................... 21 Deleting Components from a Method ....................................................................... 21 Editing Process Monitoring Parameters .................................................................... 21
Method Components ................................................................................................................ 21 Instruments ................................................................................................................ 22 Signals ....................................................................................................................... 22 Calculations ............................................................................................................... 24 Formula Editor .......................................................................................................... 24 Data Channels ............................................................................................................ 27
vi Contents Reference Manual for MS Sensor 3.0 Software
Process Monitoring Parameters ................................................................................. 29 Signal Calibration .................................................................................................................... 33 The Method Wizard ................................................................................................................. 35
Acquisition 39
Manual Acquisition Control Panel........................................................................................... 39 Acquisition Method ................................................................................................... 39 Acquisition Data File ................................................................................................. 40 Instrument Control Buttons ....................................................................................... 41 Instrument Status Table ............................................................................................. 42
Trend Plot Window .................................................................................................................. 42 Trend Plot Toolbar .................................................................................................... 44 Setting the Trend Plot Axis Scale .............................................................................. 44
Real-time Data Grid ................................................................................................................. 45
Data Analysis 47
Overview of Data Analysis ...................................................................................................... 47 The MS Sensor Log Files ........................................................................................................ 47 Viewing Data Files .................................................................................................................. 48 The Agilent Technologies MS Data File ................................................................................. 48
Instruments 51
Instrument Overview ............................................................................................................... 51 Diablo MS Simulator ............................................................................................................... 52
Configuring the Diablo MS Simulator Instrument .................................................... 52 Supported Signal Types ............................................................................................. 52
Agilent 5973/75 Network MSD ............................................................................................... 53 MSD ChemStation Requirements ............................................................................. 53 Configuring the Instrument ....................................................................................... 53 Default Instrument Settings ....................................................................................... 54 Advanced Configuration ........................................................................................... 54 The MSD Tune Window ........................................................................................... 56 Tuning the MSD ........................................................................................................ 57 Data Acquisition with the MSD ................................................................................ 59 Supported Signal Types ............................................................................................. 59
Agilent MassHunter MSD ....................................................................................................... 60 MassHunter Requirements ........................................................................................ 60 Configuring the Instrument ....................................................................................... 60 Default Instrument Settings ....................................................................................... 61 Advanced Configuration ........................................................................................... 62 The MassHunter Tune Window ................................................................................ 63 Tuning the MSD ........................................................................................................ 64 Data Acquisition with MassHunter ........................................................................... 66 Supported Signal Types ............................................................................................. 67
MKS PDR 2000 Pressure Controller ....................................................................................... 67 Configuring the Instrument ....................................................................................... 67 Supported Signal Types ............................................................................................. 68
MKS 651C Pressure Controller ............................................................................................... 68 Configuring the Instrument ....................................................................................... 68 Supported Signal Types ............................................................................................. 69
MKS PR4000 Pressure Controller ........................................................................................... 70 Configuring the Instrument ....................................................................................... 70 Supported Signal Types ............................................................................................. 71
Diablo MPValve Sequencer ..................................................................................................... 71
Reference Manual for MS Sensor 3.0 Software Contents vii
Configuring Diablo MPValve Sequencer .................................................................. 71 About MPValve Sequencer ....................................................................................... 73
Appendix 75
Troubleshooting ....................................................................................................................... 75 Standard Troubleshooting Steps ................................................................................ 75 Troubleshooting the Agilent 5973/5975/5977 MSD ................................................. 76
Index 79

Reference Manual for MS Sensor 3.0 Software Introduction 1
Introduction
MS Sensor Overview
The MS Sensor software is designed to allow simple, yet flexible acquisition and
display of continuous process data using the Agilent Technologies 5973, 5975, or
5977 MSD and other kinds of instruments and sensors like pressure and flow meters.
Features
Enables the Agilent Technologies 5973N, 5975, or 5977 MSD to be
used for continuous process analysis.
The software architecture allows real-time data to be acquired from
multiple kinds of instruments and sensors.
User-defined formulas can be defined and applied to instrument signal
data in real time. This allows ratio, normalization, and other
calculations to be performed and displayed in real time.
A linear calibration function can easily be generated for Signals.
Up to 6 trend-plot windows can be used to display graphical results in
real time.
A real-time data grid displays numeric results in real time
Results are logged to comma-delimited (CSV) text files that can be
easily imported into spreadsheets and other data analysis or modeling
applications.
An event log allows logging of user notes, system messages, and error
and warning alerts.
MS Sensor System Requirements
The MS Sensor software requires the following:
For 5973N and 5975 Instruments using MSD ChemStation for acquisition:
Microsoft Windows XP with Service Pack 3 or Windows 7
Professional, 32-bit or 64-bit Editions.
2 Introduction Reference Manual for MS Sensor 3.0 Software
The Agilent Technologies MSD ChemStation G1701DA or G1701EA,
Version D.00.00, D.01.02, D.02.00, D.03.00, E.00.00, E.01.00,
E.02.00, E.02.01, E.02.02 in order for the software to acquire data from
an Agilent Technologies 5973N or 5975 MSD. Check the MS Sensor
Release Notes to see the ChemStation versions that are currently
supported.
For 5975 and 5977 MSDs using MassHunter GC/MS for acquisition:
Microsoft Windows 7 Professional, 32-bit or 64-bit editions.
The Agilent Technologies MassHunter GC/MS Acquisition B.07.00
SP1 or later.
The Agilent Technologies ChemStation Data Analysis version F.01.00
or later for data analysis using the "raw 'data.ms' files.
Installation
The MS Sensor software can be installed by running the installation program,
"setup.exe", located on the distribution CD-ROM.
Before running the installation program, you should review the release notes
document, "release notes.txt" that is also located on the installation CD-ROM. This
document contains information on installation and use of the software that may not
be present in the manual or help file.
IMPORTANT Important: If this software will be used with an Agilent Technologies 5973N, 5975,
or 5977 MSD, you must first install the MSD ChemStation or MassHunter GC/MS
Acquisition software and confirm that it is operational by performing a successful
autotune before installing the MS Sensor software.
Software License and Registration
The MS Sensor software is licensed for use on a single computer. The software
license must be “activated” by entering a special code before the 14-day initial trial
period expires. After purchasing a software license, you must send an “Activation
Request Code” to Diablo Analytical in order to receive the “License Activation
Code”. License Activation Codes are specific to each computer; so make sure to
send the Activation Request Code from the computer on which you wish to activate
the software license.
Note: During the trial period, the software will run without limitation. However,
after the initial trial period expires, you will only be able to acquire and process data
from the “demo” instruments.

Reference Manual for MS Sensor 3.0 Software Introduction 3
If you would like to bypass the initial license status dialog when starting the MS
Sensor software, then check the “Don’t show the License Status Dialog on startup”
checkbox. The current license status will still be displayed in the event log. You can
then access the License Status dialog box from the “Help > License…” menu option.
See the “Software License Activation Guide” for more information.
About Diablo Analytical, Inc.
Mt. Diablo is a well-known
San Francisco Bay Area
Mountain
Diablo Analytical, Inc developed the MS Sensor software. Diablo Analytical is an
analytical application development company located in Antioch, CA. We specialize
in the development of custom analytical solutions for a broad range of industries.
Diablo Analytical, Inc. 5141 Lone Tree Way
Antioch, CA 94531
Phone: (925) 755-1005
Fax: (925) 755-1007
E-Mail: [email protected]
WWW: http://www.diabloanalytical.com
Software Support
If the MS Sensor Software package was licensed through Agilent Technologies as
part of the Agilent 5000A Real-Time Gas Analyzer, then software support is handled
by Agilent Technologies. Please refer to the support information provided with the
5000A documentation.
If the MS Sensor Software package was licensed directly from Diablo Analytical or
purchased from Diablo Analytical or one of our resellers, then software support is
handled directly by Diablo. Diablo Analytical Support can be reached by any of the
following methods:
5141 Lone Tree Way
Antioch, CA 94531

4 Introduction Reference Manual for MS Sensor 3.0 Software
Phone: (925) 755-1005
Fax: (925) 755-1007
E-mail: [email protected]
Web: www.diabloanalytical.com

Reference Manual for MS Sensor 3.0 Software Getting Started 5
Getting Started
Main Application Window
The main MS Sensor application consists of a main menu, a toolbar, and several
windows that perform specific functions, including the acquisition control panel, the
event log, the real-time data grid, and one or more real-time trend plot windows.
For more information see:
“Main Menu” on page 6
“Main Toolbar” on page 7
“Event Log” on page 10
“Manual Acquisition Control Panel” on page 39
“Trend Plot Window” on page 42
“Real-time Data Grid” on page 45

6 Getting Started Reference Manual for MS Sensor 3.0 Software
Main Menu
The following options are accessed through the MS Sensor main menu:
File
Exit MS Sensor will shut down all instruments, close all windows and exit
immediately. If the system is acquiring data, then the acquisition will have to be
stopped before you can exit from MS Sensor.
Method
Open: Displays a dialog box allowing you to open a method and display it in the
method editor.
New: Prompts you for a method name and then displays an "empty" method in the
method editor.
Edit: Opens the currently loaded method in the method editor.
Signal Calibration Displays the signal calibration summary dialog box.
Wizard: Starts the MS Sensor Method Wizard.
Acquisition
Manual: Displays the MS Sensor Manual Acquisition Control Panel.
Tools
Options: Displays the MS Sensor "Options" dialog box that is used to configure the
system.
View Data Files: Prompt you for a data file, and the type of result to display
(Signals, Calculations, Data Channels, or the Run Log), and then will open the
selected file in a "viewing application".
Event Log: Provides access to the Event Log sub menu. The sub-menu options are
described in the Event Log section.
Window
Cascade: Rearranges all open MS Sensor Windows so they are overlapped in
"cascading" fashion.
Tile Horizontal/Vertical: Rearranges all open MS Sensor Windows so that they are
tiled next to each other, filling the main window of the application.
Help
Contents: Displays the contents page of the MS Sensor Help file.
Release Notes: Displays the current MS Sensor Release Notes in an Internet browser
window.
Create support log archive file: This option creates the “Zip” archive file
‘SupportLogs.zip’ in the main MS Sensor application directory. This archive file
contains all the error and status log files that are produced by the software. This file
can then be e-mailed to technical support.
About: Displays a dialog box that contains information about the MS Sensor
software, including the current revision number.
Reference Manual for MS Sensor 3.0 Software Getting Started 7
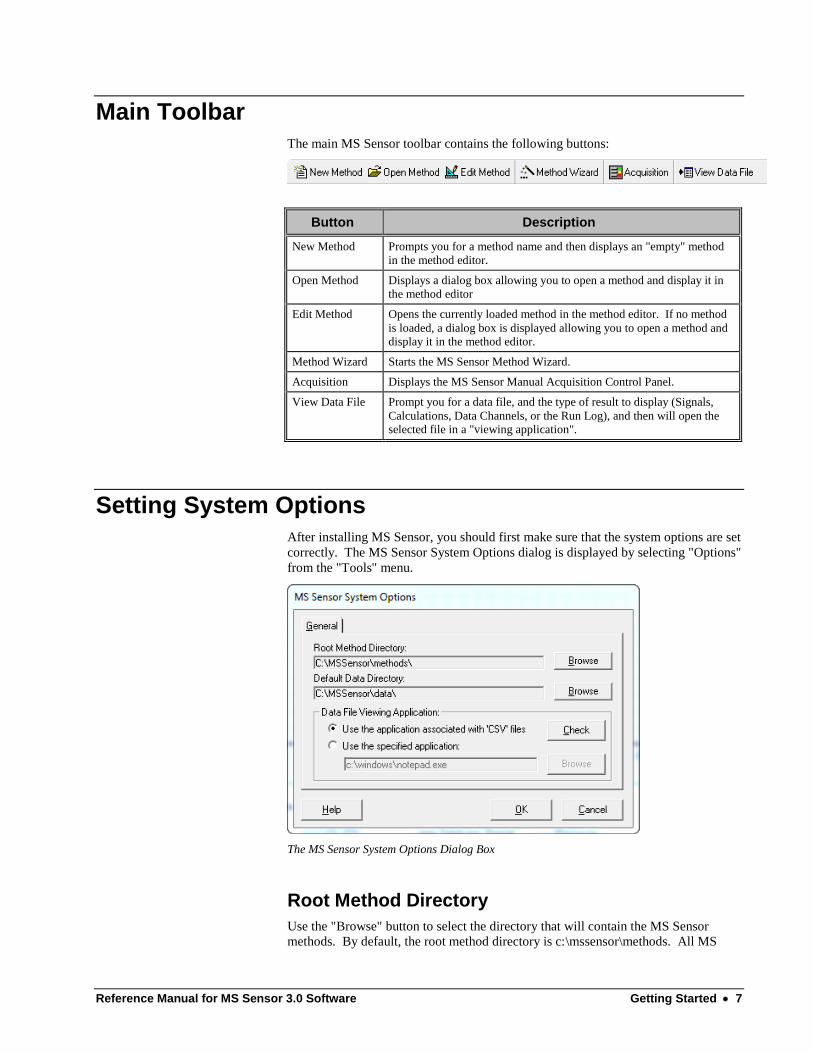
Main Toolbar
The main MS Sensor toolbar contains the following buttons:
Button Description
New Method Prompts you for a method name and then displays an "empty" method
in the method editor.
Open Method Displays a dialog box allowing you to open a method and display it in
the method editor
Edit Method Opens the currently loaded method in the method editor. If no method
is loaded, a dialog box is displayed allowing you to open a method and
display it in the method editor.
Method Wizard Starts the MS Sensor Method Wizard.
Acquisition Displays the MS Sensor Manual Acquisition Control Panel.
View Data File Prompt you for a data file, and the type of result to display (Signals,
Calculations, Data Channels, or the Run Log), and then will open the selected file in a "viewing application".
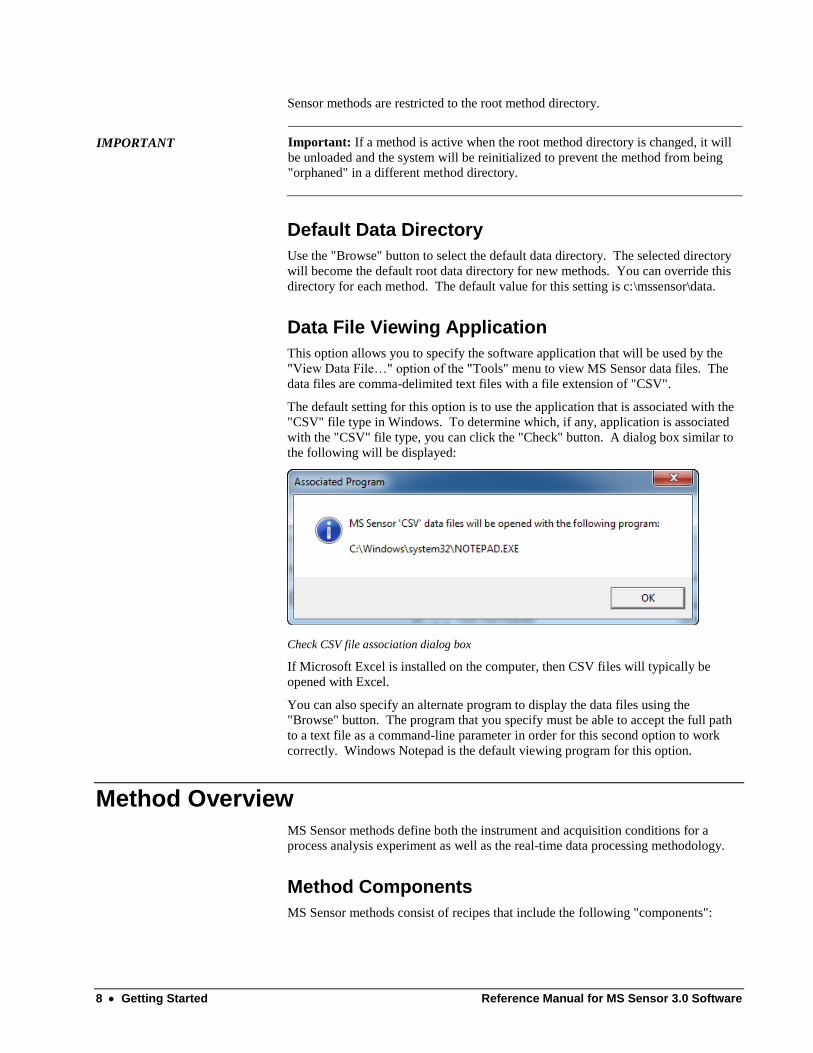
Setting System Options
After installing MS Sensor, you should first make sure that the system options are set
correctly. The MS Sensor System Options dialog is displayed by selecting "Options"
from the "Tools" menu.
The MS Sensor System Options Dialog Box
Root Method Directory
Use the "Browse" button to select the directory that will contain the MS Sensor
methods. By default, the root method directory is c:\mssensor\methods. All MS
8 Getting Started Reference Manual for MS Sensor 3.0 Software
Sensor methods are restricted to the root method directory.
IMPORTANT Important: If a method is active when the root method directory is changed, it will
be unloaded and the system will be reinitialized to prevent the method from being
"orphaned" in a different method directory.
Default Data Directory
Use the "Browse" button to select the default data directory. The selected directory
will become the default root data directory for new methods. You can override this
directory for each method. The default value for this setting is c:\mssensor\data.
Data File Viewing Application
This option allows you to specify the software application that will be used by the
"View Data File…" option of the "Tools" menu to view MS Sensor data files. The
data files are comma-delimited text files with a file extension of "CSV".
The default setting for this option is to use the application that is associated with the
"CSV" file type in Windows. To determine which, if any, application is associated
with the "CSV" file type, you can click the "Check" button. A dialog box similar to
the following will be displayed:
Check CSV file association dialog box
If Microsoft Excel is installed on the computer, then CSV files will typically be
opened with Excel.
You can also specify an alternate program to display the data files using the
"Browse" button. The program that you specify must be able to accept the full path
to a text file as a command-line parameter in order for this second option to work
correctly. Windows Notepad is the default viewing program for this option.
Method Overview
MS Sensor methods define both the instrument and acquisition conditions for a
process analysis experiment as well as the real-time data processing methodology.
Method Components
MS Sensor methods consist of recipes that include the following "components":

Reference Manual for MS Sensor 3.0 Software Getting Started 9
Component Description
Instrument Instruments are signal-generating devices. A specific software driver
must be written for each instrument whose signal will be acquired by
MS Sensor. In addition to the Agilent Technologies 5973/75/77
MSD, instrument drivers have been written for a number of pressure and flow meters.
Signal Signals are floating point values that are the foundation of an MS
Sensor method. The signal recipe defines what result will be retrieved from a particular instrument's signal data.
Calculation Calculations use a custom, user-defined formula to perform
calculations in real time. The formula can include Signal values as
well as constants, mathematical operators, and a number of mathematical functions.
Data Channel Data Channels are the top-level components that are trend plotted and
displayed in real time. Data Channels are also defined by a custom
formula that can include both Signals and Calculations.
Component Processing Flowchart
The following flow chart describes how MS Sensor methods and method
components are processed during a process analysis experiment.
InstrumentsAcquire raw signal data from Instrument
SignalsApply Signal recipe to raw Instrument signal to generate signal response
Data ChannelsApply Signal or Calculation response to Data Channel formula to generate
Data Channel response
Signal RecipeDefines how raw Instrument signals
are processed in order to generate a
Signal response
Data Channel RecipeDefines the formula to which Signal or
Calculation response value(s) will be
applied to generate a Data Channel
response
Sum, Ratio, Difference, Average
Custom Formula
Instrument RecipesDefines the Instrument parameters and
condtions that will be used to generate
the raw signal
Method
CalculationsApply Signal response to Calculation
formula to generate Calculation
response
Inst1 Inst2
Sig1 Sig2 Sig3 Sig4 Sig5 Sig6
Calc1 Calc2 Calc3
Chan1 Chan2 Chan3 Chan4 Chan5 Chan6
Calculation RecipeDefines the formula to which Signal
response value(s) will be applied to
generate a Calculation response
Sum, Ratio, Difference, Average,
Custom Formula
Acquisition and Component Processing
Flowchart
Update Real-time Trend Plot, Data Grid, and Data Channel Log File with
Data Channel Response values
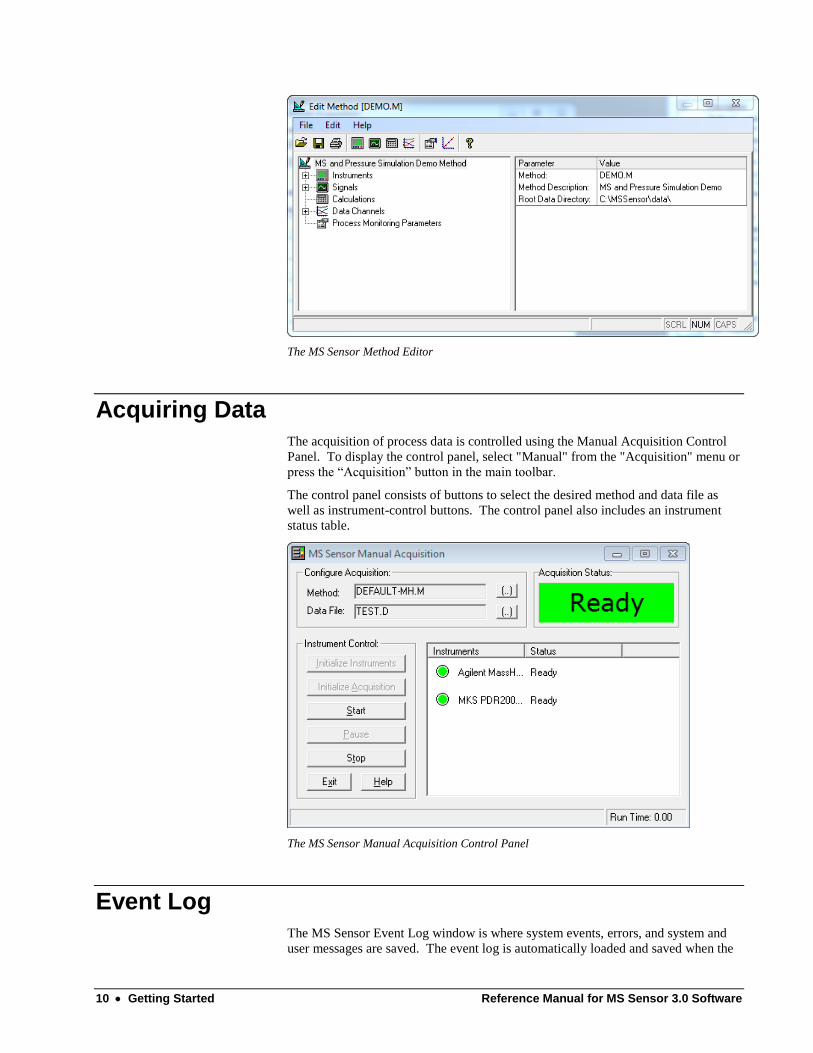
Method Editor
Methods are edited using the method-editing window, which consists of two panels.
Method components are displayed in a tree on the left panel, while the current
parameters for a selected component are displayed on the right panel.
10 Getting Started Reference Manual for MS Sensor 3.0 Software
The MS Sensor Method Editor
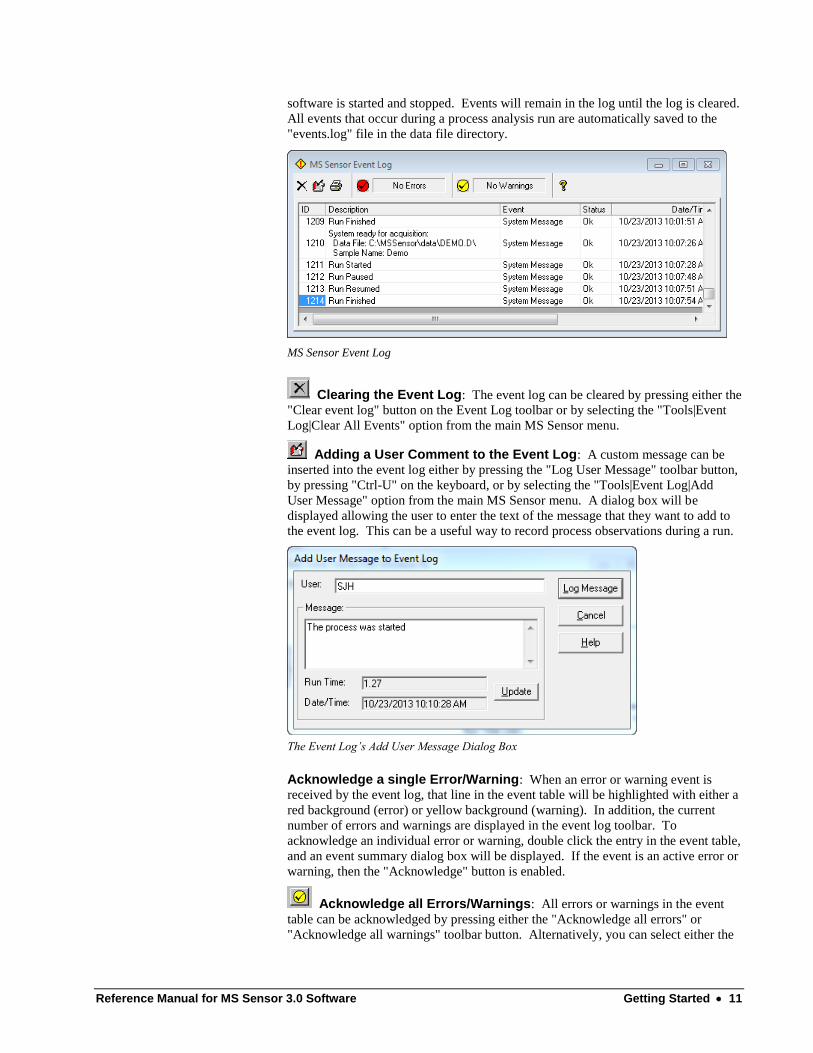
Acquiring Data The acquisition of process data is controlled using the Manual Acquisition Control
Panel. To display the control panel, select "Manual" from the "Acquisition" menu or
press the “Acquisition” button in the main toolbar.
The control panel consists of buttons to select the desired method and data file as
well as instrument-control buttons. The control panel also includes an instrument
status table.
The MS Sensor Manual Acquisition Control Panel
Event Log The MS Sensor Event Log window is where system events, errors, and system and
user messages are saved. The event log is automatically loaded and saved when the
Reference Manual for MS Sensor 3.0 Software Getting Started 11
software is started and stopped. Events will remain in the log until the log is cleared.
All events that occur during a process analysis run are automatically saved to the
"events.log" file in the data file directory.
MS Sensor Event Log
Clearing the Event Log: The event log can be cleared by pressing either the
"Clear event log" button on the Event Log toolbar or by selecting the "Tools|Event
Log|Clear All Events" option from the main MS Sensor menu.
Adding a User Comment to the Event Log: A custom message can be
inserted into the event log either by pressing the "Log User Message" toolbar button,
by pressing "Ctrl-U" on the keyboard, or by selecting the "Tools|Event Log|Add
User Message" option from the main MS Sensor menu. A dialog box will be
displayed allowing the user to enter the text of the message that they want to add to
the event log. This can be a useful way to record process observations during a run.
The Event Log’s Add User Message Dialog Box
Acknowledge a single Error/Warning: When an error or warning event is
received by the event log, that line in the event table will be highlighted with either a
red background (error) or yellow background (warning). In addition, the current
number of errors and warnings are displayed in the event log toolbar. To
acknowledge an individual error or warning, double click the entry in the event table,
and an event summary dialog box will be displayed. If the event is an active error or
warning, then the "Acknowledge" button is enabled.
Acknowledge all Errors/Warnings: All errors or warnings in the event
table can be acknowledged by pressing either the "Acknowledge all errors" or
"Acknowledge all warnings" toolbar button. Alternatively, you can select either the

12 Getting Started Reference Manual for MS Sensor 3.0 Software
"Tools|Event Log|Acknowledge all errors" or "Tools|Event Log|Acknowledge all
warnings" menu option.
Print the Event Log: The entire event log can be printed by pressing the
"Print event log" toolbar button, or by selecting the "Tools|Event Log|Print" option
of the main MS Sensor menu.
Arrange Event Table Columns: The order of the columns in the event table can
be customized by clicking on the column header cell and dragging the column to a
new position. The new column order will be restored automatically when MS
Sensor is started.
Sort the Event Table: The event table can be sorted in either ascending or
descending order based on the values in a particular column by clicking on the
header cell of the desired column.
Viewing an Event
If you double click on an event in the Event Table, the "Event" dialog box will be
displayed:
MS Sensor Event Dialog Box
If the event is an error or warning, the "Acknowledge" button can be pressed. This
will cause the Event Status to change from "Warning" or "Error" to "Ack", and the
Warning or Error count on the main Event Log dialog box will be decremented by 1.
Pressing the “Copy” button will cause the current event detail to be copied to the
Windows Clipboard.
Running the Demonstration Method
A demonstration method, DEMO.M, is installed with the MS Sensor software. This
demo method uses "simulator" instruments that produce random signal data for the
purposes of testing and software familiarization. The following steps describe how
to load and run the demonstration method.
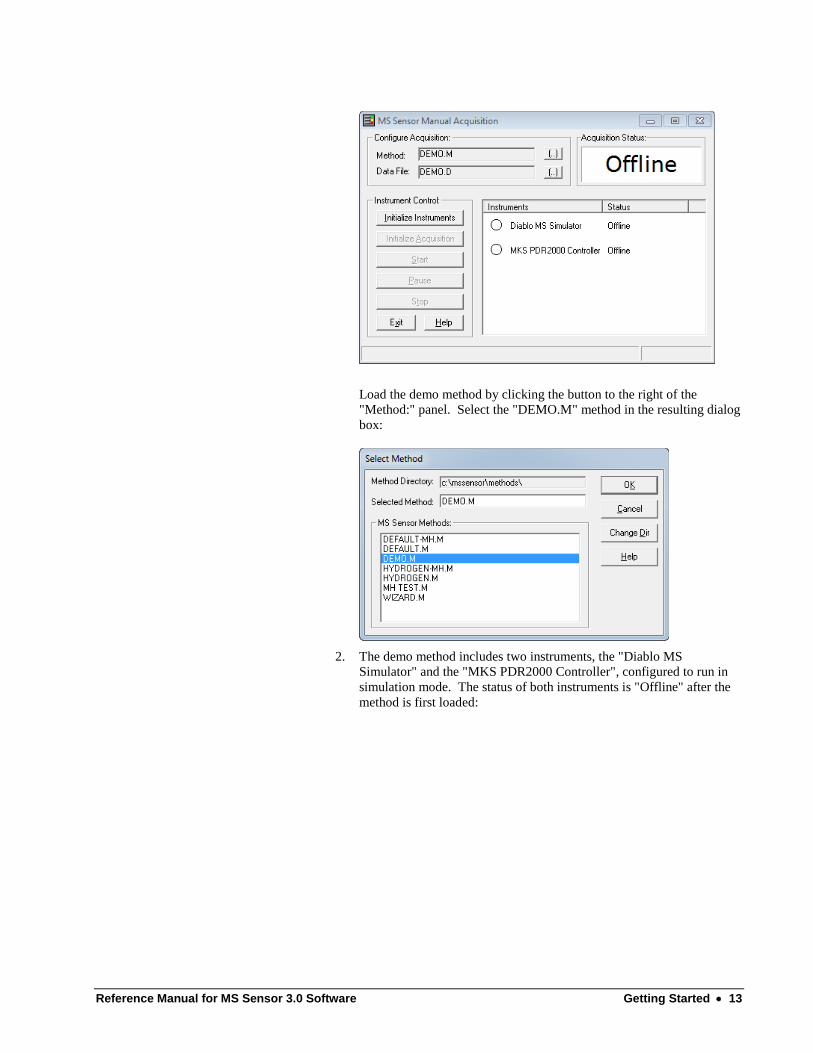
1. Select "Manual" from the "Acquisition" menu. The Manual
Acquisition control panel will be displayed:
Reference Manual for MS Sensor 3.0 Software Getting Started 13
Load the demo method by clicking the button to the right of the
"Method:" panel. Select the "DEMO.M" method in the resulting dialog
box:
2. The demo method includes two instruments, the "Diablo MS
Simulator" and the "MKS PDR2000 Controller", configured to run in
simulation mode. The status of both instruments is "Offline" after the
method is first loaded:
14 Getting Started Reference Manual for MS Sensor 3.0 Software
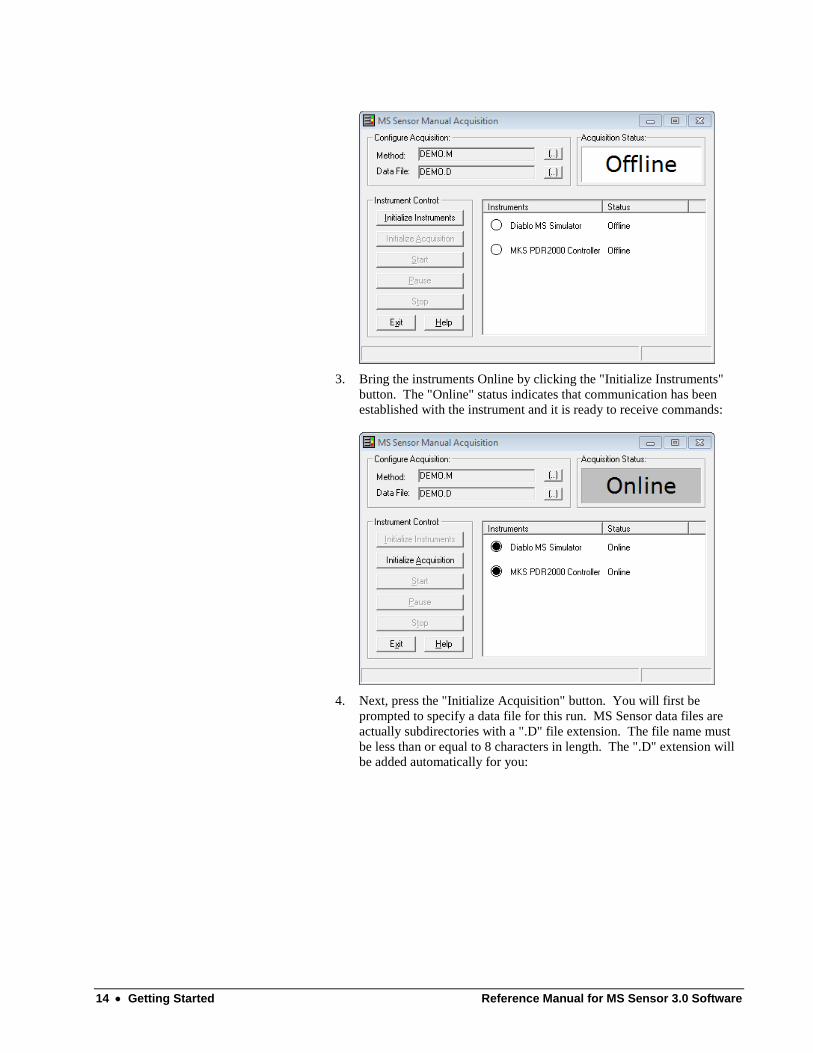
3. Bring the instruments Online by clicking the "Initialize Instruments"
button. The "Online" status indicates that communication has been
established with the instrument and it is ready to receive commands:
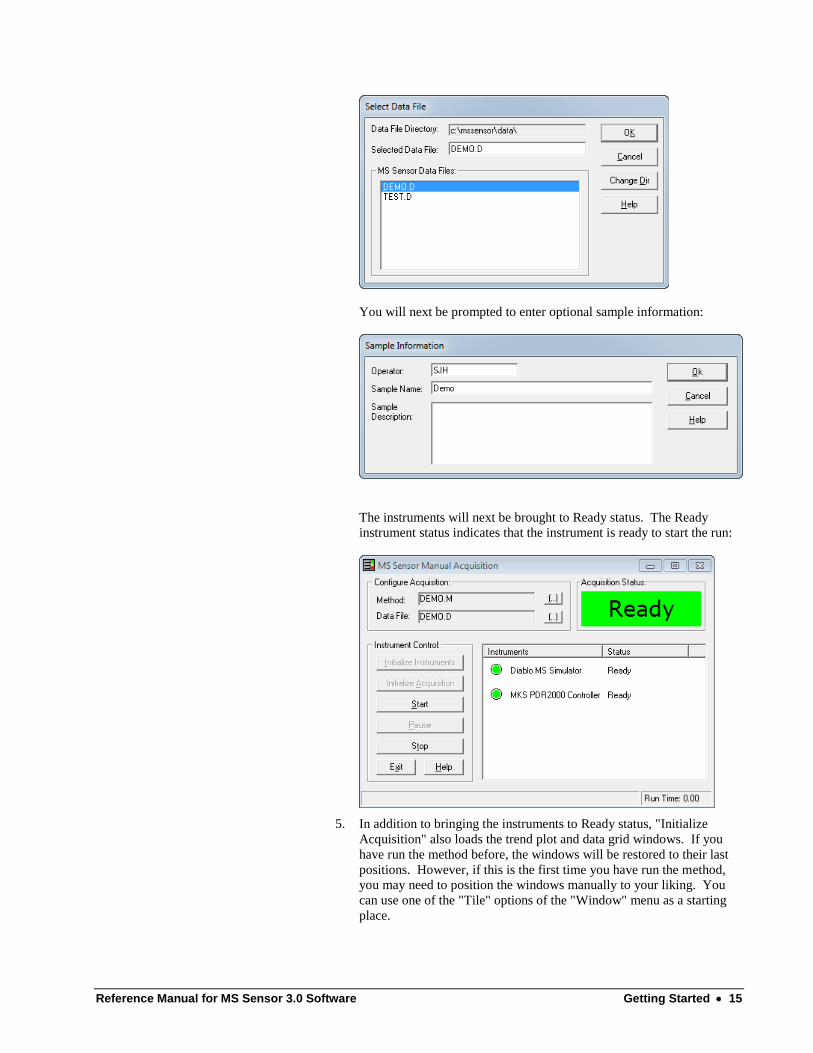
4. Next, press the "Initialize Acquisition" button. You will first be
prompted to specify a data file for this run. MS Sensor data files are
actually subdirectories with a ".D" file extension. The file name must
be less than or equal to 8 characters in length. The ".D" extension will
be added automatically for you:
Reference Manual for MS Sensor 3.0 Software Getting Started 15
You will next be prompted to enter optional sample information:
The instruments will next be brought to Ready status. The Ready
instrument status indicates that the instrument is ready to start the run:
5. In addition to bringing the instruments to Ready status, "Initialize
Acquisition" also loads the trend plot and data grid windows. If you
have run the method before, the windows will be restored to their last
positions. However, if this is the first time you have run the method,
you may need to position the windows manually to your liking. You
can use one of the "Tile" options of the "Window" menu as a starting
place.

16 Getting Started Reference Manual for MS Sensor 3.0 Software
6. Start the run by pressing the "Start" button. The instrument status will
switch to "Acquiring", and you should see data start to appear in the
real-time grid window and the trend plot windows.
7. The demo method is configured to run continuously until you press the
"Stop" button.
8. After stopping the run, use Windows Explorer to examine the data file
directory. If you installed the software to the default directory, your
data file will be located in the "c:\mssensor\data\" subdirectory. The
data file directory, demo.d in this example, contains the file
"demo.csv". This file contains the Data Channel results saved in a
comma-delimited text file format:
The log file can be easily loaded into a spreadsheet application like
Microsoft Excel, or a third-party statistical analysis or modeling
program to analyze the process data. You can use the “View Data File”
menu and toolbar option to easily open a data file in the associated
application.

Reference Manual for MS Sensor 3.0 Software Methods 17
Methods
Default and Demo Methods
The following default methods are installed with the MS Sensor application.
Method Description
DEFAULT.M The default method set up for the Agilent
Technologies 5973N or 5975 MSD using
MSD ChemStation control and an MKS
PDR2000 pressure controller. This method
includes a set of common Signals and Data
Channels that can be edited for a specific application.
DEFAULT-MH.M The default method set up for the Agilent
Technologies 5975 or 5977 MSD using
MassHunter control and an MKS PDR2000
pressure controller. This method includes a
set of common Signals and Data Channels that can be edited for a specific application.
HYDROGEN.M Same configuration as the default method
for MSD ChemStation control, but the
5973/75 instrument is set up to use the
special hydrogen tune file, "HTUNE.U".
This tune file is created by running a "Full Hydrogen Tune" from the tune window.
HYDROGEN-MH.M Same configuration as the default method
for MassHunter control, but the 5975/77
instrument is set up to use the special
hydrogen tune file, "HTUNE.U". This tune
file is created by running a "Full Hydrogen
Tune" from the tune window.
DEMO.M A demonstration method that uses
"simulator" instruments to generate random
signal data for purposes of testing,
familiarization and demonstration.

18 Methods Reference Manual for MS Sensor 3.0 Software
Method Files
MS Sensor method files are actually subdirectories with a ".M" file extension that
contain a number of recipe files that define the method settings. Method files are
always located in the "Root Method Directory" specified in the System Options
dialog.
IMPORTANT Important: Although these recipe files are all simple text files using the Windows
"INI" format, it is not recommended that the user edit them directly.
The common recipe files are summarized in the following table. In addition, each
instrument that is added to the method will have a corresponding recipe file in the
method subdirectory.
Recipe File Description
Method.rcp Contains general information for the method including the method
name and root data directory. In addition, method defaults like window positions are saved to this file.
Instruments.rcp General information like the number of instruments, and each
instrument's description and type are stored in this file. Instrument-
specific settings are stored in separate recipe files. For example
settings for the MS Simulator instrument are saved in the file "mssim.rcp".
Signals.rcp The Signals recipe file contains the settings for all Signals defined
for this method, including signal description signal type, signal indexes, and calibration settings.
Calculations.rcp The settings for all Calculations are stored in the calculations recipe
file. These settings include the description and the formula that will be used to determine each Calculation's value.
Channels.rcp The settings for all Data Channels are stored in this file. These
settings include the description, the formula used to calculate the
channel's value, and options like whether or not the channel will be displayed in any trend plot window.
Acquisition.rcp The method settings for the Process Monitoring Parameters are
stored in this file.
Opening Methods
Existing methods can be opened in one of two ways. To load and edit a method,
select the "Open" option of the "Method" menu (or the “Open Method” button on the
Main Toolbar). A dialog box will be displayed, allowing you to select a method file
from within the root method directory. The selected method will be loaded and
displayed in the method editor dialog box.
To load a method for acquisition only, you must first open the Manual Acquisition
Control Panel by selecting "Manual" from the "Acquisition" menu (or the
“Acquisition” button on the Main Toolbar). Once the control panel is displayed,
click the button to the right of the "Method:" panel at the top of the dialog box and
select the desired method file from the root method directory.
Reference Manual for MS Sensor 3.0 Software Methods 19
Creating New Methods
New methods can be created by selecting "New" from the "Method" menu or by
pressing the “New Method” button on the Main Toolbar. You will first be presented
with a dialog box to specify the name of the new method. You can either manually
enter a new method name, or if you want to overwrite an existing method, you can
select that method's name from the method list.
IMPORTANT Important: Method files are actually subdirectories with a ".M" file extension. If
you enter a new method name manually, the ".M" extension will be added for you
automatically.
In addition, if you are using an older “16-bit” version of the MSD ChemStation, then
method file names can only contain 8 characters with no spaces.
After selecting the file name for the new method, the method editor dialog box will
be displayed with an empty method tree. When creating a new method it is best to
start from the top of the method tree by first adding new Instruments to the method,
and then work your way down adding new Signals, then Calculations, and finally
Data Channels. It is also important to make sure that the method parameters and
process-monitoring parameters are also set correctly.
When you are finished creating your new method, make sure to save it before exiting
the method editor.
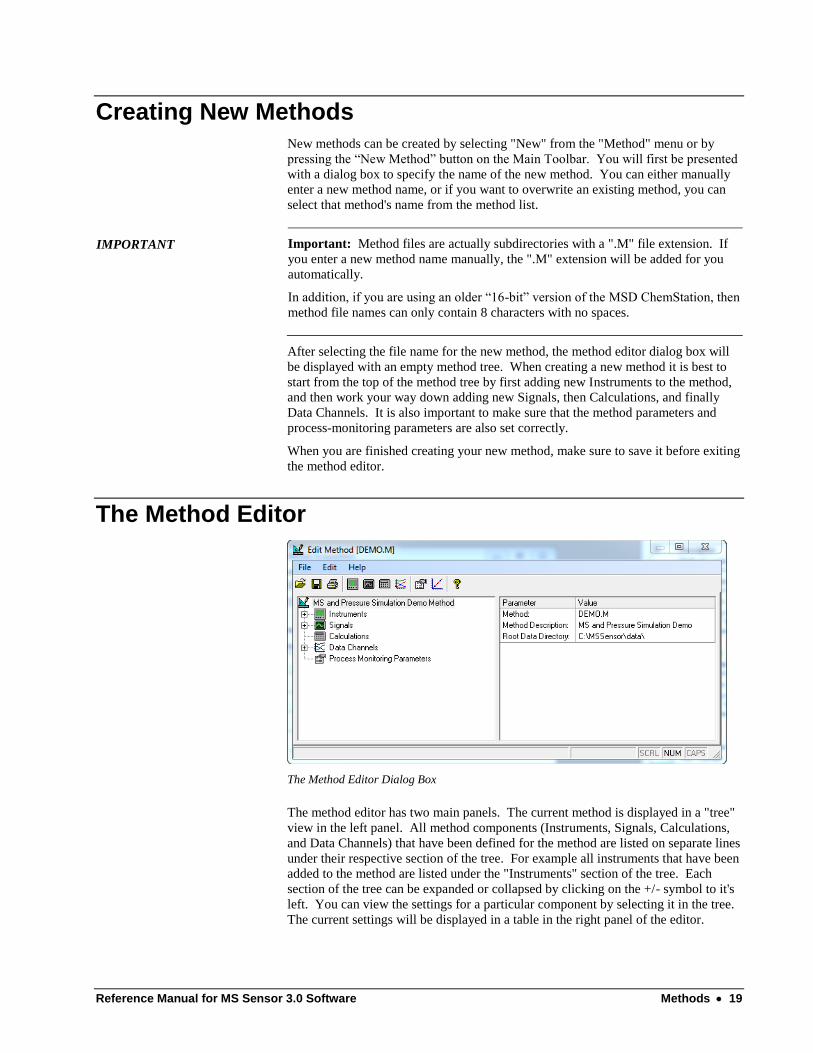
The Method Editor
The Method Editor Dialog Box
The method editor has two main panels. The current method is displayed in a "tree"
view in the left panel. All method components (Instruments, Signals, Calculations,
and Data Channels) that have been defined for the method are listed on separate lines
under their respective section of the tree. For example all instruments that have been
added to the method are listed under the "Instruments" section of the tree. Each
section of the tree can be expanded or collapsed by clicking on the +/- symbol to it's
left. You can view the settings for a particular component by selecting it in the tree.
The current settings will be displayed in a table in the right panel of the editor.

20 Methods Reference Manual for MS Sensor 3.0 Software
Component Key Names are
used to identify a particular
component in a formula Component Key Names
Each component in a method is assigned a unique "key name" when it is first added
to a method. The key name begins with the component prefix identified in the table
below. Each key then has a unique integer appended to it (e.g. Inst1, Inst2, Sig1,
Sig2) so that the component can be uniquely identified. These key names are
important because they are the strings used to identify the component in the
Calculation and Data Channel formulas.
Component Key Name Prefix
Instrument Inst
Signal Sig
Calculation Calc
Data Channel Chan
Editing Components
In general, the various method components can be edited by right-clicking on the
desired item in the tree view on the left-hand side of the editing window, and then
selecting the desired action (new, edit, delete) from the resulting pop-up menu.
The Method Editor Toolbar
The following functions are available in the Method Editor Toolbar:
Button Description
Open a method file.
Save the current method.
Print the current method.
Add a new instrument to the method.
Add a new signal to the method.
Add a new calculated component to the method.
Add a new data channel to the method.
Edit process-monitoring parameters.
Display signal calibration dialog box.

Reference Manual for MS Sensor 3.0 Software Methods 21
Adding New Components to a Method
To add a new component to a method you can either use the appropriate menu option
under the "Edit" menu of the method editor, or you can right-click on the appropriate
section of the tree and select the "Add" option from the resulting pop-up menu. For
instance, to add a new instrument to the method, you can either select "Add
Instrument" from the "Edit" menu, or you can right click on the "Instruments"
section of the tree and select "New Instrument" from the pop-up menu.
Editing Method Parameters
To edit the general method parameters, you can either select "Method Parameters"
from the "Edit Menu", or you can right-click on the top line of the method tree that
contains the method description and select "Edit" from the pop-up menu.
IMPORTANT Important: Make sure that the default data directory is set to an existing directory.
By default, this setting will be c:\mssensor\data.
Editing Method Components
To edit the settings for an existing component, you should first expand that
component's section of the tree, and then double-click on the component's line in the
tree. For example to edit the settings for Instrument 1, you would expand the
Instruments section of the method tree and then double click on the line that starts
with "Inst1:"
You can also edit a component by selecting it in the tree view, and then double-
clicking anywhere in the table displaying the component's parameters on the right
panel of the method editor.
Deleting Components from a Method
A component can be deleted from the method by right clicking the component in the
method tree and then selecting the "Delete" option form the pop-up menu.
IMPORTANT Important: Be very careful deleting components from a method. When you delete
a particular component, any other component that uses it in a formula will also be
deleted automatically to prevent invalid formulas in the method.
Editing Process Monitoring Parameters
The process monitoring parameters can be edited by double-clicking on the "Process
Monitoring Parameters" line of the method tree. You can also right-click on the
"Process Monitoring Parameters" line of the method tree and then select "Edit
Parameters" from the resulting pop-up menu.
Method Components
The following sections describe the method components editing dialog boxes in
detail.

22 Methods Reference Manual for MS Sensor 3.0 Software
Instruments
When a new instrument is added to a method, the following dialog box is displayed.
Add New Instrument Dialog
Instrument Description
Enter a description for this instrument. The instrument description is displayed in
the method tree to help you identify the instrument.
Instrument Type
Instruments supported by the MS Sensor software are listed in the "Instrument Type"
list box. A specific instrument driver has been written for each instrument that is
listed. Once you have selected the desired instrument type and press the "Add"
button, an instrument-specific dialog will be displayed that allows you to configure
that instrument. For more information on the supported instruments and their
configuration, see the Instruments section.
Instrument Parameters
Each instrument has it's own custom dialog box that is used to set the instrument's
parameters for acquisition. Please refer to the specific Instrument in the
"Instrument" section for information on configuring a particular instrument.
Signals
Signals are numeric values that are the foundation of an MS Sensor method. The
signal recipe defines what result will be retrieved from a particular instrument's raw
signal data.
Edit Signal Dialog Box

Reference Manual for MS Sensor 3.0 Software Methods 23
Signal Description
Enter a description of the Signal. This description will appear in the method tree to
help identify the Signal.
Instrument
The Instrument list box will contain the description of each instrument that has been
added to the method. Select the instrument from which you want to retrieve a
Signal. Once you have selected an instrument, the "Signal Type" and "Signal Index"
sections of the dialog box will be updated to reflect the types of signals that are
available for the selected instrument.
Signal Type
Each instrument can support multiple types of signals. All signals provided by the
selected instrument are listed in the "Signal Type" list box. Depending on the type of
signal, an additional Signal Index may also be required to define the signal fully.
The signal types that are provided by each instrument are described in the
Instruments section.
Signal Index Values
The signal types available for an instrument can be one dimensional, like a simple
pressure signal, or multi dimensional, like a mass spectrum. Multi-dimensional
signal types require additional signal index values in order to be able to retrieve the
proper value. If a signal index value is required for the selected signal type, then one
or both of the signal index text boxes will be enabled and a descriptive label for the
index will be displayed.
For example, the MS Simulator instrument provides the "Mass Spectrum
Abundance" signal type. This signal type requires one index value that is labeled
"M/Z". This signal index happens to be the mass-to-charge ratio whose abundance
will be extracted from the current mass spectrum when the signal is processed by the
data system.
Linear Calibration Function
A simple linear calibration function can be specified for each Signal. By default, the
slope of the calibration function is 1 and the intercept is 0. It is the user's
responsibility to generate the calibration slope and intercept experimentally. Both
the raw and calibrated signals can be used in Calculation and Data Channel formulas.
The "Signal Calibration" function can be used to generate the linear calibration
function from suitable calibration data.
Create New Data Channel
This check box provides a shortcut if you want to trend plot or log a raw signal. If
you check the "Create New Data Channel" box, the system will automatically create
a new Data Channel based on this Signal when you press the "Save" button. This
new Data Channel will have the same description as the Signal, and it's formula will
include only this Signal's response. See the section on Data Channels for more
information.
Please note that a new Data Channel will be created each time the "Save" button is
pressed with this box checked.
Calibration
Clicking the Calibration button causes the Signal Calibration dialog box to be
displayed. This dialog allows you to easily generate the linear calibration function
from one or more calibration levels. See "Signal Calibration" for more information.
24 Methods Reference Manual for MS Sensor 3.0 Software
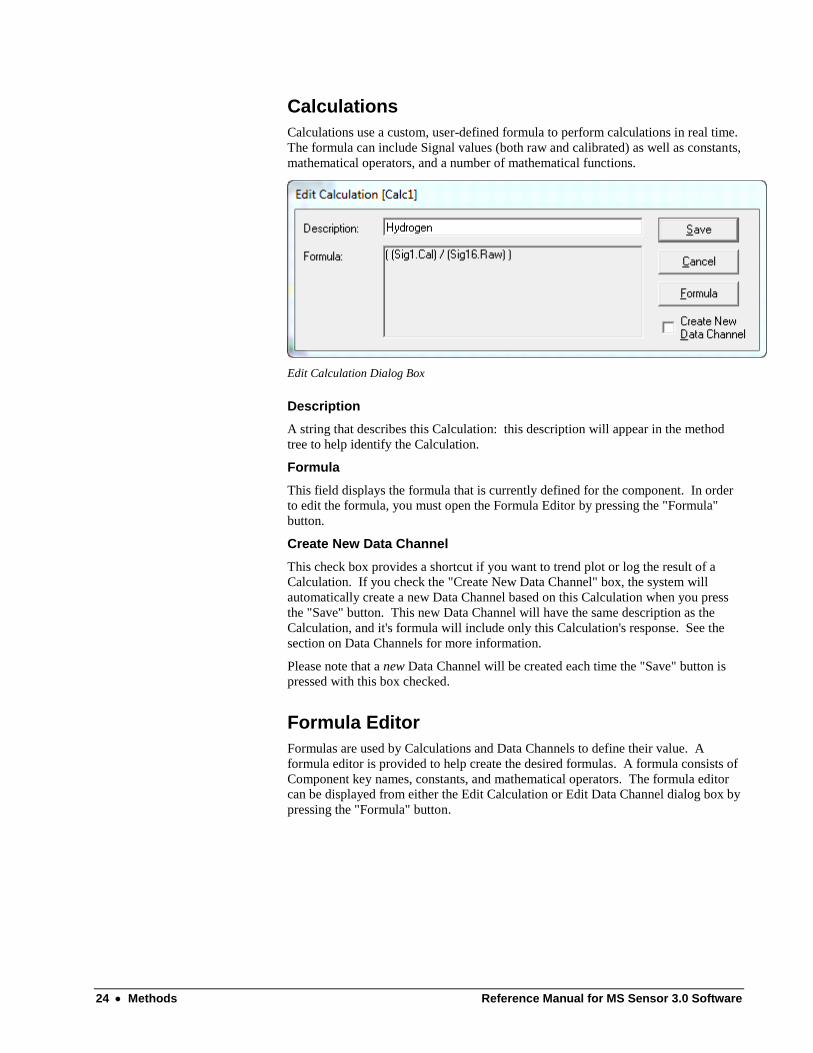
Calculations
Calculations use a custom, user-defined formula to perform calculations in real time.
The formula can include Signal values (both raw and calibrated) as well as constants,
mathematical operators, and a number of mathematical functions.
Edit Calculation Dialog Box
Description
A string that describes this Calculation: this description will appear in the method
tree to help identify the Calculation.
Formula
This field displays the formula that is currently defined for the component. In order
to edit the formula, you must open the Formula Editor by pressing the "Formula"
button.
Create New Data Channel
This check box provides a shortcut if you want to trend plot or log the result of a
Calculation. If you check the "Create New Data Channel" box, the system will
automatically create a new Data Channel based on this Calculation when you press
the "Save" button. This new Data Channel will have the same description as the
Calculation, and it's formula will include only this Calculation's response. See the
section on Data Channels for more information.
Please note that a new Data Channel will be created each time the "Save" button is
pressed with this box checked.
Formula Editor
Formulas are used by Calculations and Data Channels to define their value. A
formula editor is provided to help create the desired formulas. A formula consists of
Component key names, constants, and mathematical operators. The formula editor
can be displayed from either the Edit Calculation or Edit Data Channel dialog box by
pressing the "Formula" button.

Reference Manual for MS Sensor 3.0 Software Methods 25
Formula Editor Dialog Box
Components
This list includes all of the components that are available in the current method. If
you are editing a Calculation formula then only the Signal Components will be
present in the list. If you are editing a Data Channel formula, then both Signals and
Calculations will be present in the list.
Components are represented in a formula by their key name enclosed in parenthesis.
To add a component to the formula simply double click on the component in the list.
The component key name will be added to the formula at the last location of the
cursor in the formula.
Signal Types
When you add a Signal to the formula, you will be presented with the following
dialog box to select the signal type that should be placed in the formula.
Select Signal Type Dialog Box
Calibrated Signal Response: The signal response after the calibration function
has been applied. The "Cal" signal type will be appended to the key name in the
formula (e.g. "Sig1.Cal").
26 Methods Reference Manual for MS Sensor 3.0 Software
Raw Signal Response: The raw signal response before the calibration function
has been applied. The "Raw" signal type will be appended to the key name in the
formula (e.g. "Sig1.Raw").
Calibration Slope: The slope from the calibration function for this Signal. The
"Slope" signal type will be appended to the key name in the formula (e.g.
"Sig1.Slope").
Calibration Intercept: The intercept from the calibration function for this Signal.
The "Intercept" signal type will be appended to the key name in the formula (e.g.
"Sig1.Intercept").
Operators
The mathematical operators that are supported in formulas are listed here. In
addition, commonly used operators are assigned to the buttons. To place an operator
in the formula, you can either double click on it in the Operators list, or you can click
the appropriate button. The operator will be placed at the last cursor location in the
formula.
Constant
Numeric constants can be entered into the Constants box and then inserted into the
formula by pressing the "Insert" button.
Current Formula
The current formula is displayed in this text box. By default, the formula cannot be
edited directly in this text box. See the "Allow direct editing of the formula"
checkbox description below for a way to override the default behavior.
Test Button
Use this button to test whether the current formula is valid. The formula editor will
not let you save an invalid formula.
Move Buttons
These buttons are used to move the currently selected component key or operator to
the left or right in the formula.
Delete Button
This button will delete the currently selected component key or operator.
Undo Button
This button will undo the last change made to the formula.
Allow direct editing of the formula
By default, the formula cannot be edited by typing directly in the text box. Instead,
component keys are added by clicking on the component list, operators are added by

Reference Manual for MS Sensor 3.0 Software Methods 27
clicking on the operator list, the formula is rearranged using the move buttons, etc.
This approach is taken to try and reduce the possibility of creating invalid formulas.
However, if you would prefer to create or edit the formula directly in the formula
textbox, simply check the "Allow direct editing" checkbox. You can still use the
various formula editing lists and buttons, but you can also use "normal" text box
editing techniques like cutting and pasting. If you choose to operate in this mode, it
is a good idea to "Test" your formula frequently.
Data Channels
Data Channels are the top-level components that are trend plotted, displayed in real
time, etc. Data Channels are defined by a custom formula that can include both
Signals and Calculations.
Data Channel Editor Dialog Box
Description
A string that describes the Data Channel. This description will appear in the method
tree to help identify the Data Channel. In addition, the description will also appear in
the legend of the trend plot, and as the column header in both the real-time trend data
grid and in the data (log) files.
Formula
This field displays the formula that is currently defined for the Data Channel. In
order to edit the formula, you must open the Formula Editor by pressing the
"Formula" button.
Display Options
The following display options can be set for each Data Channel.
Display Channel in Data Grid: If this checkbox is selected, then this Data
Channel will be included in the real-time data grid during acquisition. This setting
has no affect on whether this Data Channel is logged to the data file.
Display Channel in Trend Plot: If this checkbox is selected, then this Data
Channel will be displayed in the selected trend-plot Window.
Trend Plot List: Data Channels can be assigned to one of 6 trend-plot windows.
This can be advantageous if you want to place unrelated Data Channels in different
windows or you want to group channels with similar response ranges together.
28 Methods Reference Manual for MS Sensor 3.0 Software
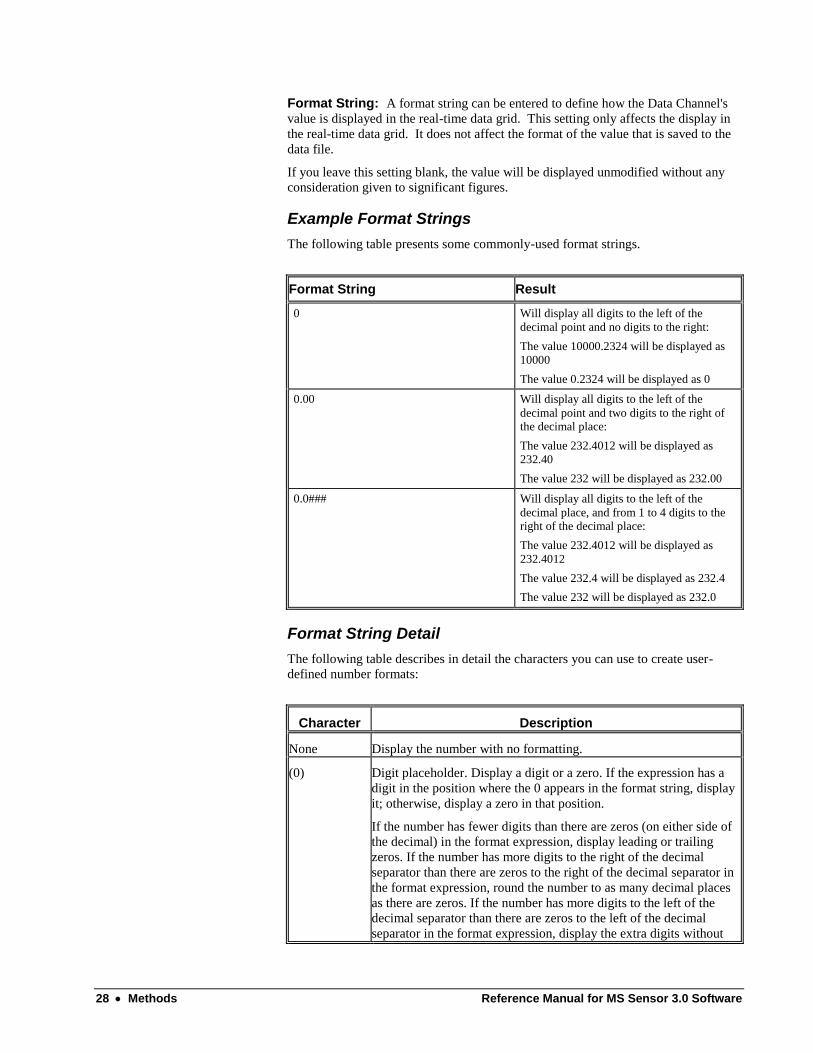
Format String: A format string can be entered to define how the Data Channel's
value is displayed in the real-time data grid. This setting only affects the display in
the real-time data grid. It does not affect the format of the value that is saved to the
data file.
If you leave this setting blank, the value will be displayed unmodified without any
consideration given to significant figures.
Example Format Strings
The following table presents some commonly-used format strings.
Format String Result
0 Will display all digits to the left of the
decimal point and no digits to the right:
The value 10000.2324 will be displayed as
10000
The value 0.2324 will be displayed as 0
0.00 Will display all digits to the left of the
decimal point and two digits to the right of the decimal place:
The value 232.4012 will be displayed as
232.40
The value 232 will be displayed as 232.00
0.0### Will display all digits to the left of the
decimal place, and from 1 to 4 digits to the right of the decimal place:
The value 232.4012 will be displayed as
232.4012
The value 232.4 will be displayed as 232.4
The value 232 will be displayed as 232.0
Format String Detail
The following table describes in detail the characters you can use to create user-
defined number formats:
Character Description
None Display the number with no formatting.
(0) Digit placeholder. Display a digit or a zero. If the expression has a
digit in the position where the 0 appears in the format string, display
it; otherwise, display a zero in that position.
If the number has fewer digits than there are zeros (on either side of
the decimal) in the format expression, display leading or trailing
zeros. If the number has more digits to the right of the decimal
separator than there are zeros to the right of the decimal separator in
the format expression, round the number to as many decimal places
as there are zeros. If the number has more digits to the left of the
decimal separator than there are zeros to the left of the decimal
separator in the format expression, display the extra digits without
Reference Manual for MS Sensor 3.0 Software Methods 29
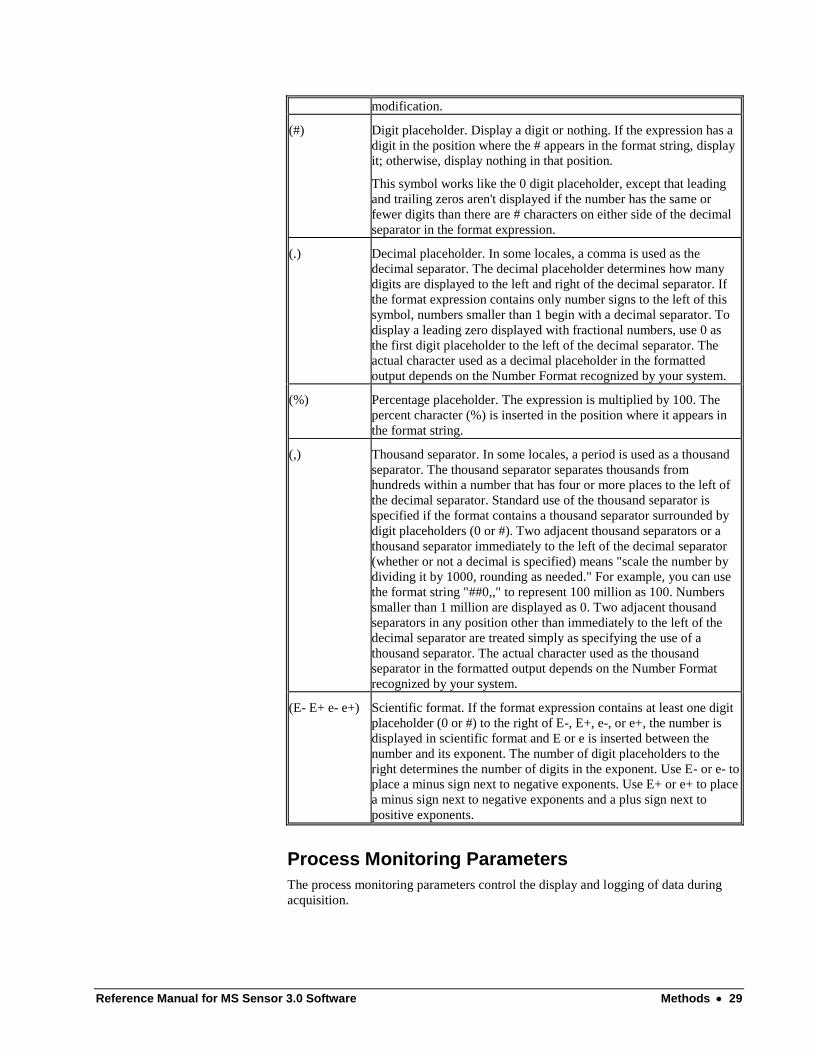
modification.
(#) Digit placeholder. Display a digit or nothing. If the expression has a
digit in the position where the # appears in the format string, display
it; otherwise, display nothing in that position.
This symbol works like the 0 digit placeholder, except that leading
and trailing zeros aren't displayed if the number has the same or
fewer digits than there are # characters on either side of the decimal
separator in the format expression.
(.) Decimal placeholder. In some locales, a comma is used as the
decimal separator. The decimal placeholder determines how many
digits are displayed to the left and right of the decimal separator. If
the format expression contains only number signs to the left of this
symbol, numbers smaller than 1 begin with a decimal separator. To
display a leading zero displayed with fractional numbers, use 0 as
the first digit placeholder to the left of the decimal separator. The
actual character used as a decimal placeholder in the formatted
output depends on the Number Format recognized by your system.
(%) Percentage placeholder. The expression is multiplied by 100. The
percent character (%) is inserted in the position where it appears in
the format string.
(,) Thousand separator. In some locales, a period is used as a thousand
separator. The thousand separator separates thousands from
hundreds within a number that has four or more places to the left of
the decimal separator. Standard use of the thousand separator is
specified if the format contains a thousand separator surrounded by
digit placeholders (0 or #). Two adjacent thousand separators or a
thousand separator immediately to the left of the decimal separator
(whether or not a decimal is specified) means "scale the number by
dividing it by 1000, rounding as needed." For example, you can use
the format string "##0,," to represent 100 million as 100. Numbers
smaller than 1 million are displayed as 0. Two adjacent thousand
separators in any position other than immediately to the left of the
decimal separator are treated simply as specifying the use of a
thousand separator. The actual character used as the thousand
separator in the formatted output depends on the Number Format
recognized by your system.
(E- E+ e- e+) Scientific format. If the format expression contains at least one digit
placeholder (0 or #) to the right of E-, E+, e-, or e+, the number is
displayed in scientific format and E or e is inserted between the
number and its exponent. The number of digit placeholders to the
right determines the number of digits in the exponent. Use E- or e- to
place a minus sign next to negative exponents. Use E+ or e+ to place
a minus sign next to negative exponents and a plus sign next to
positive exponents.
Process Monitoring Parameters
The process monitoring parameters control the display and logging of data during
acquisition.
30 Methods Reference Manual for MS Sensor 3.0 Software
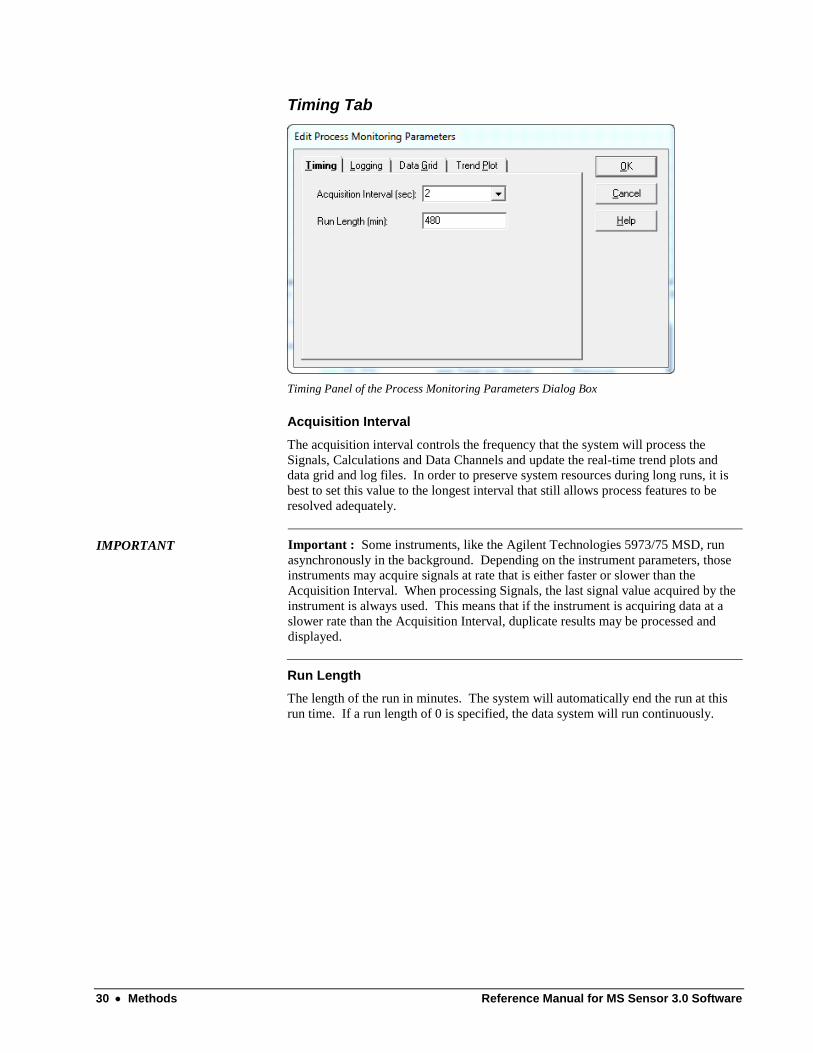
Timing Tab
Timing Panel of the Process Monitoring Parameters Dialog Box
Acquisition Interval
The acquisition interval controls the frequency that the system will process the
Signals, Calculations and Data Channels and update the real-time trend plots and
data grid and log files. In order to preserve system resources during long runs, it is
best to set this value to the longest interval that still allows process features to be
resolved adequately.
IMPORTANT Important : Some instruments, like the Agilent Technologies 5973/75 MSD, run
asynchronously in the background. Depending on the instrument parameters, those
instruments may acquire signals at rate that is either faster or slower than the
Acquisition Interval. When processing Signals, the last signal value acquired by the
instrument is always used. This means that if the instrument is acquiring data at a
slower rate than the Acquisition Interval, duplicate results may be processed and
displayed.
Run Length
The length of the run in minutes. The system will automatically end the run at this
run time. If a run length of 0 is specified, the data system will run continuously.

Reference Manual for MS Sensor 3.0 Software Methods 31
Logging Tab
Logging Panel of the Process Monitoring Parameters Dialog Box
This tab allows you to select what kinds of data will be saved to log files during a
run. The log files are comma-delimited text files that are save in the data file
directory. Depending on which boxes are checked in this panel, the following log
files will be created:
Data Log File Name
Signal Response Signals.csv
Calculation Response Calculations.csv
Data Channel Response Named based on the data file name. For example if the data file
name is "data1.d", then the Data Channel response will be logged to "data1.csv".
The Signals and Calculations log files are typically used in method development and
troubleshooting. During normal use, these boxes should not be checked, particularly
during long process analysis experiments.
32 Methods Reference Manual for MS Sensor 3.0 Software
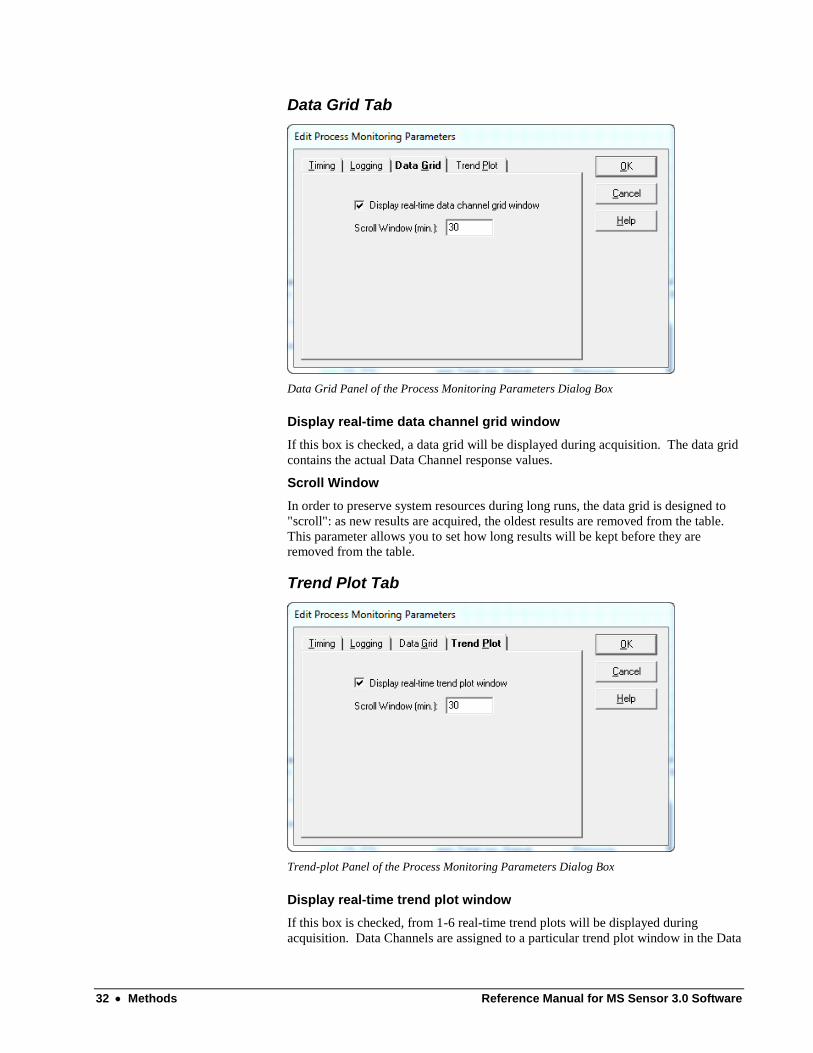
Data Grid Tab
Data Grid Panel of the Process Monitoring Parameters Dialog Box
Display real-time data channel grid window
If this box is checked, a data grid will be displayed during acquisition. The data grid
contains the actual Data Channel response values.
Scroll Window
In order to preserve system resources during long runs, the data grid is designed to
"scroll": as new results are acquired, the oldest results are removed from the table.
This parameter allows you to set how long results will be kept before they are
removed from the table.
Trend Plot Tab
Trend-plot Panel of the Process Monitoring Parameters Dialog Box
Display real-time trend plot window
If this box is checked, from 1-6 real-time trend plots will be displayed during
acquisition. Data Channels are assigned to a particular trend plot window in the Data

Reference Manual for MS Sensor 3.0 Software Methods 33
Channel configuration dialog. Only the trend plot windows that have at least one
Data Channel assigned to them will be displayed during a run.
Scroll Window
In order to preserve system resources during long runs, the trend plots are designed
to "scroll": as new results are acquired, the oldest results are removed from the plot.
This parameter allows you to set how long results will be kept before they are
removed from the plot.
Signal Calibration The Signal Calibration option provides an easy way to generate the "Linear
Calibration Function" for each Signal in a method. The signal calibration window
can be accessed directly via the "Calibrate" button on the "Edit Signal" dialog box.
Alternatively, a "Signal Calibration" option has been added to both the "Edit" menu
of the Method Editor, and the "Method" menu of the main application window.
Selecting one of the latter two new menu options will display a signal calibration
summary dialog box that allows you to browse and edit the calibration for each
defined signal.
Signal Calibration Summary dialog box
The signal calibration option allows an unlimited number of calibration levels to be
defined for each signal. New calibration levels can be added by pressing the
calibration table's "Add" button, and then entering the amount and signal response
derived from the analysis of a suitable calibration standard. After entering all
calibration levels for the signal, press the "Calculate" button, which will recalculate
the calibration function based on the data in the calibration table, and plot the results
on the "Calibration Plot" tab of the signal calibration dialog box.
For single-level calibrations, the calibration slope is determined from the amount and
signal values entered in the calibration table, and the intercept will be set to zero. A
linear regression is used to determine the slope and intercept for calibrations with 3
or more levels.
34 Methods Reference Manual for MS Sensor 3.0 Software
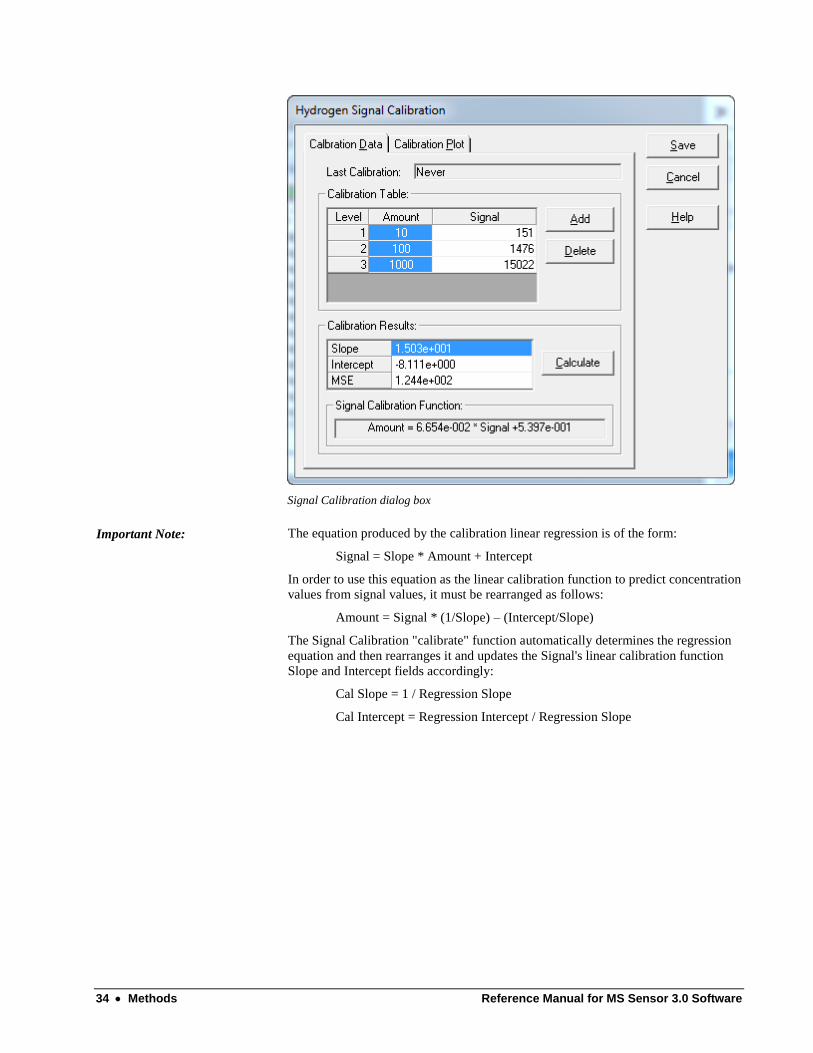
Signal Calibration dialog box
Important Note: The equation produced by the calibration linear regression is of the form:
Signal = Slope * Amount + Intercept
In order to use this equation as the linear calibration function to predict concentration
values from signal values, it must be rearranged as follows:
Amount = Signal * (1/Slope) – (Intercept/Slope)
The Signal Calibration "calibrate" function automatically determines the regression
equation and then rearranges it and updates the Signal's linear calibration function
Slope and Intercept fields accordingly:
Cal Slope = 1 / Regression Slope
Cal Intercept = Regression Intercept / Regression Slope
Reference Manual for MS Sensor 3.0 Software Methods 35
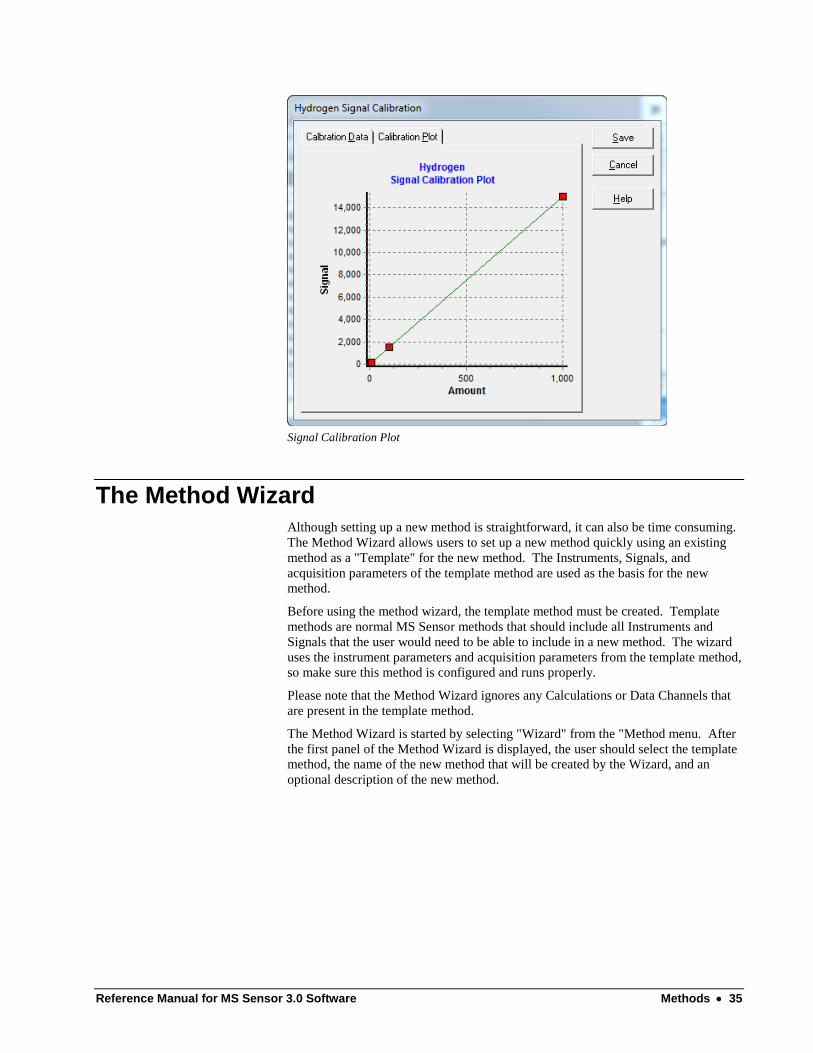
Signal Calibration Plot
The Method Wizard
Although setting up a new method is straightforward, it can also be time consuming.
The Method Wizard allows users to set up a new method quickly using an existing
method as a "Template" for the new method. The Instruments, Signals, and
acquisition parameters of the template method are used as the basis for the new
method.
Before using the method wizard, the template method must be created. Template
methods are normal MS Sensor methods that should include all Instruments and
Signals that the user would need to be able to include in a new method. The wizard
uses the instrument parameters and acquisition parameters from the template method,
so make sure this method is configured and runs properly.
Please note that the Method Wizard ignores any Calculations or Data Channels that
are present in the template method.
The Method Wizard is started by selecting "Wizard" from the "Method menu. After
the first panel of the Method Wizard is displayed, the user should select the template
method, the name of the new method that will be created by the Wizard, and an
optional description of the new method.

36 Methods Reference Manual for MS Sensor 3.0 Software
Step 1: Select the Template Method and New Method Name and Description
Next, the user selects the Signals from the template method to include in the new
method, along with the plot window that should be used to display the Signal's
results.
Step 2: Select which Signals will be included in the new method
The method wizard provides the following data processing options. The Wizard will
automatically create a set of Calculations and Data Channels whose formulas reflect
the selected options.
Reference Manual for MS Sensor 3.0 Software Methods 37
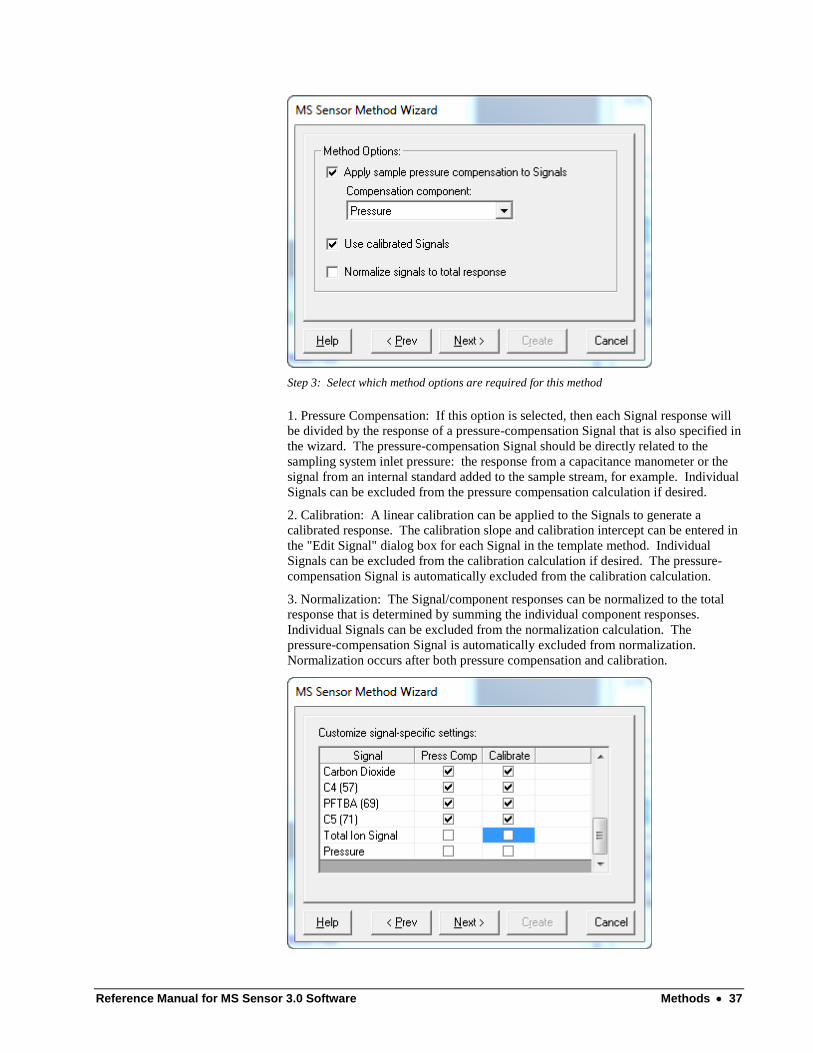
Step 3: Select which method options are required for this method
1. Pressure Compensation: If this option is selected, then each Signal response will
be divided by the response of a pressure-compensation Signal that is also specified in
the wizard. The pressure-compensation Signal should be directly related to the
sampling system inlet pressure: the response from a capacitance manometer or the
signal from an internal standard added to the sample stream, for example. Individual
Signals can be excluded from the pressure compensation calculation if desired.
2. Calibration: A linear calibration can be applied to the Signals to generate a
calibrated response. The calibration slope and calibration intercept can be entered in
the "Edit Signal" dialog box for each Signal in the template method. Individual
Signals can be excluded from the calibration calculation if desired. The pressure-
compensation Signal is automatically excluded from the calibration calculation.
3. Normalization: The Signal/component responses can be normalized to the total
response that is determined by summing the individual component responses.
Individual Signals can be excluded from the normalization calculation. The
pressure-compensation Signal is automatically excluded from normalization.
Normalization occurs after both pressure compensation and calibration.
38 Methods Reference Manual for MS Sensor 3.0 Software
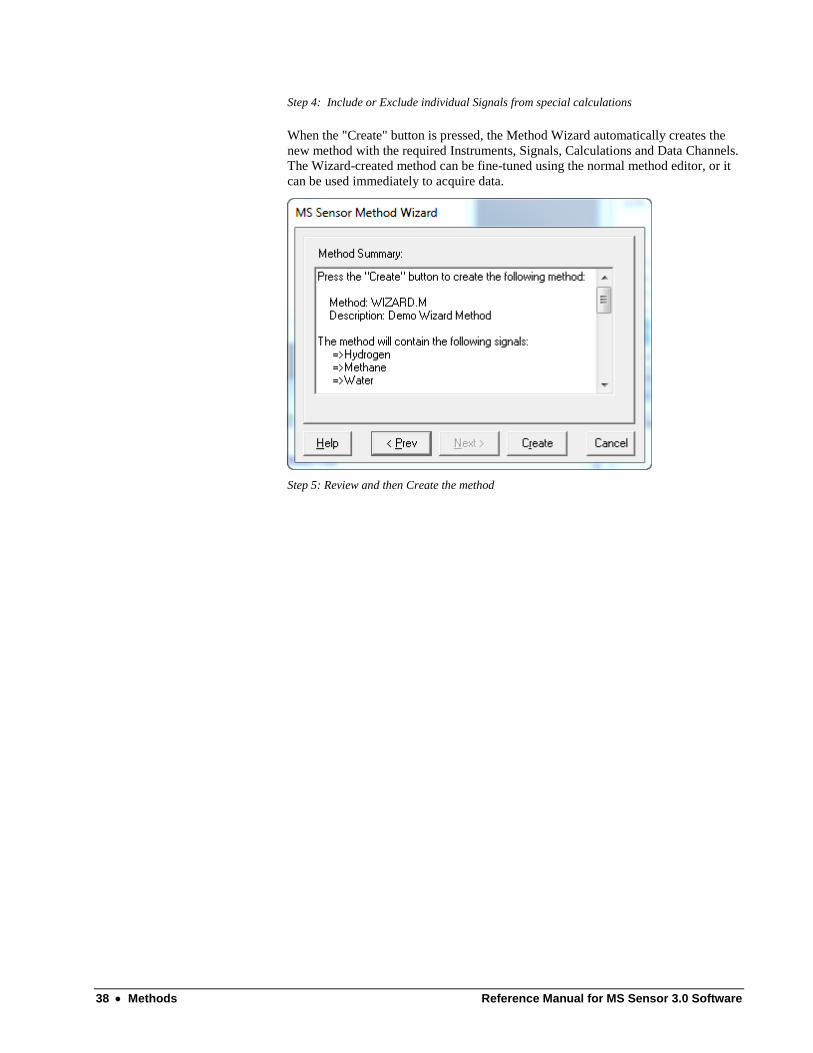
Step 4: Include or Exclude individual Signals from special calculations
When the "Create" button is pressed, the Method Wizard automatically creates the
new method with the required Instruments, Signals, Calculations and Data Channels.
The Wizard-created method can be fine-tuned using the normal method editor, or it
can be used immediately to acquire data.
Step 5: Review and then Create the method
Reference Manual for MS Sensor 3.0 Software Acquisition 39
Acquisition
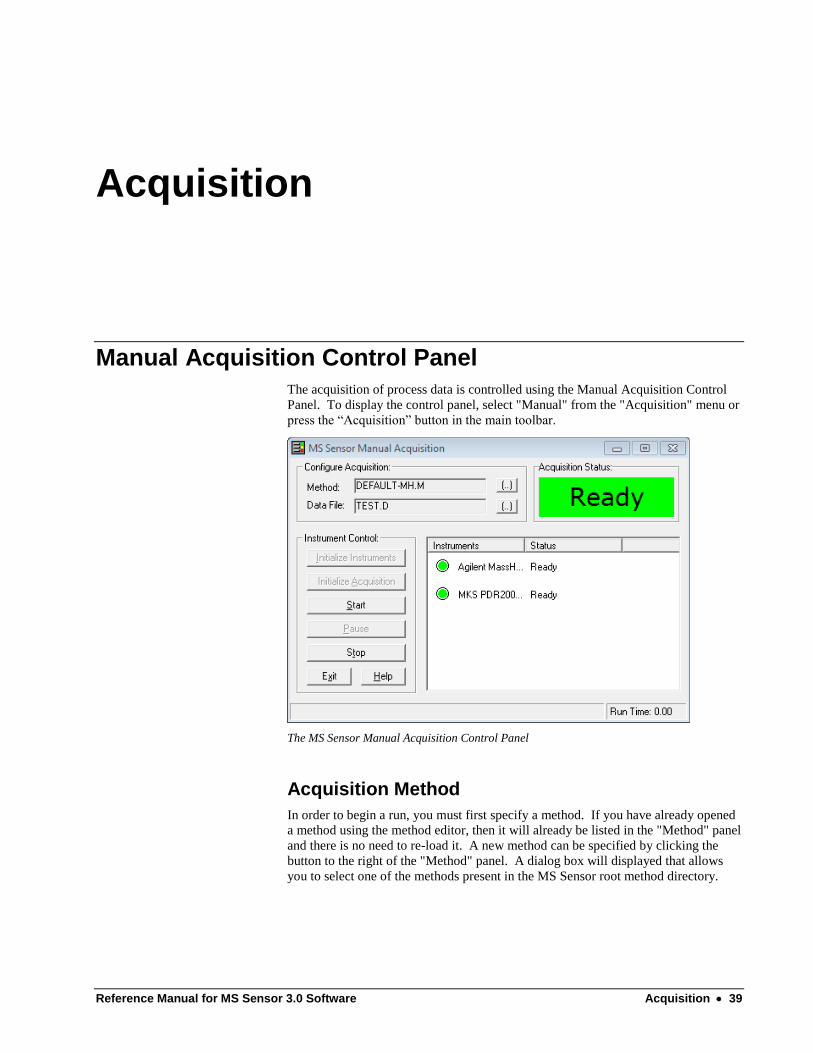
Manual Acquisition Control Panel
The acquisition of process data is controlled using the Manual Acquisition Control
Panel. To display the control panel, select "Manual" from the "Acquisition" menu or
press the “Acquisition” button in the main toolbar.
The MS Sensor Manual Acquisition Control Panel
Acquisition Method
In order to begin a run, you must first specify a method. If you have already opened
a method using the method editor, then it will already be listed in the "Method" panel
and there is no need to re-load it. A new method can be specified by clicking the
button to the right of the "Method" panel. A dialog box will displayed that allows
you to select one of the methods present in the MS Sensor root method directory.

40 Acquisition Reference Manual for MS Sensor 3.0 Software
Method Browser Dialog Box
To load a method from a different directory, click the "Change Dir" button, and
select the new method directory
IMPORTANT Important: If you change the method directory, you are changing the root method
directory for the system.
Acquisition Data File
A data file must also be specified before a run can be started. Pressing the button to
the right of the "Data File" panel will cause a dialog box to be displayed allowing
you to specify the data file name. If you specify an existing data file, you will be
prompted whether or not the file should be overwritten.
Data File Browser Dialog Box

Reference Manual for MS Sensor 3.0 Software Acquisition 41
MS Sensor data files are actually subdirectories with a ".D" file extension. The file
name must be less than or equal to 8 characters in length. The ".D" extension will be
added automatically for you.
The data file is restricted to the root data directory that is specified in the current
method. The root data directory for a method can be changed in the "Method
Parameters" section of the Method Editor, or the "Change Dir" button on the Data
File Browser Dialog Box can be clicked and a new data directory selected.
Instrument Control Buttons
The "Instrument Control" buttons are used to Initialize, Start, and Stop a process
analysis run. Depending on the status of the system, only certain buttons will be
enabled. When a method is first loaded, all instruments will be Offline and only the
"Initialize Instruments" and "Exit" buttons will be enabled
Initialize Instruments
When this button is pressed, communication is established with all of the Instruments
in the method. The Instrument status is changed from "offline" to "online". If
Instrument initialization is successful, then the "Initialize Acquisition" button will be
enabled.
Initialize Acquisition
If no data file has been specified, then you will first be prompted for a data file name.
Next, the "Sample Information" dialog box is displayed. The information entered
into this dialog box will be saved to the header lines of the log files. Entering sample
information is optional.
Finally, each instrument is brought from "Online" to "Ready" status. Depending on
which instruments are present in the method, it can sometimes take several seconds
for an instrument to load its parameters, stabilize and enter "Ready" status. Once all
instruments are have achieved Ready status, the "Start" button will be enabled.
Start
Pressing the "Start" button will start the process analysis run. All instruments will
change from "Ready" status to "Acquiring" and data will begin to be displayed in the
data grid and trend plots and data will begin to be logged to the data files.
Pause
The "Pause" button provides a way for an acquisition to be paused temporarily. This
can be useful if you need to examine the data grid or trend plots in detail during a
run. When you press the "Pause" button the caption toggles to "Resume". Press the
"Resume" button to continue normal acquisition.
Stop
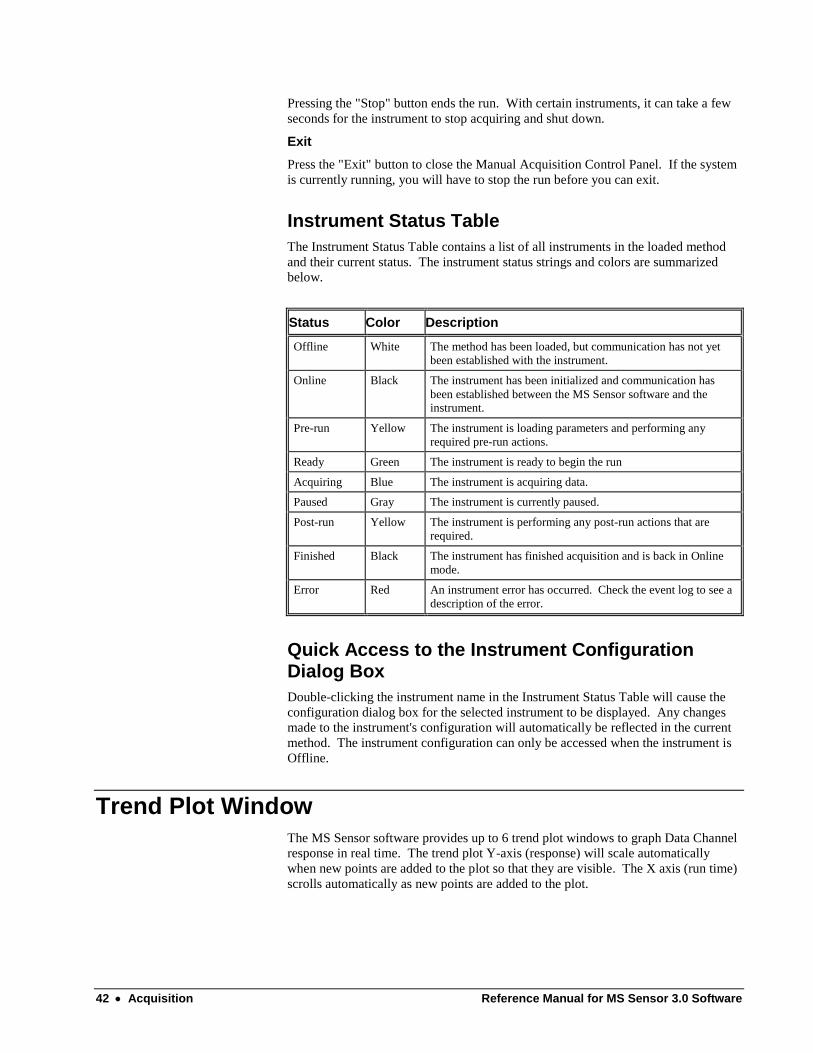
42 Acquisition Reference Manual for MS Sensor 3.0 Software
Pressing the "Stop" button ends the run. With certain instruments, it can take a few
seconds for the instrument to stop acquiring and shut down.
Exit
Press the "Exit" button to close the Manual Acquisition Control Panel. If the system
is currently running, you will have to stop the run before you can exit.
Instrument Status Table
The Instrument Status Table contains a list of all instruments in the loaded method
and their current status. The instrument status strings and colors are summarized
below.
Status Color Description
Offline White The method has been loaded, but communication has not yet
been established with the instrument.
Online Black The instrument has been initialized and communication has
been established between the MS Sensor software and the instrument.
Pre-run Yellow The instrument is loading parameters and performing any
required pre-run actions.
Ready Green The instrument is ready to begin the run
Acquiring Blue The instrument is acquiring data.
Paused Gray The instrument is currently paused.
Post-run Yellow The instrument is performing any post-run actions that are
required.
Finished Black The instrument has finished acquisition and is back in Online
mode.
Error Red An instrument error has occurred. Check the event log to see a
description of the error.
Quick Access to the Instrument Configuration Dialog Box
Double-clicking the instrument name in the Instrument Status Table will cause the
configuration dialog box for the selected instrument to be displayed. Any changes
made to the instrument's configuration will automatically be reflected in the current
method. The instrument configuration can only be accessed when the instrument is
Offline.
Trend Plot Window
The MS Sensor software provides up to 6 trend plot windows to graph Data Channel
response in real time. The trend plot Y-axis (response) will scale automatically
when new points are added to the plot so that they are visible. The X axis (run time)
scrolls automatically as new points are added to the plot.
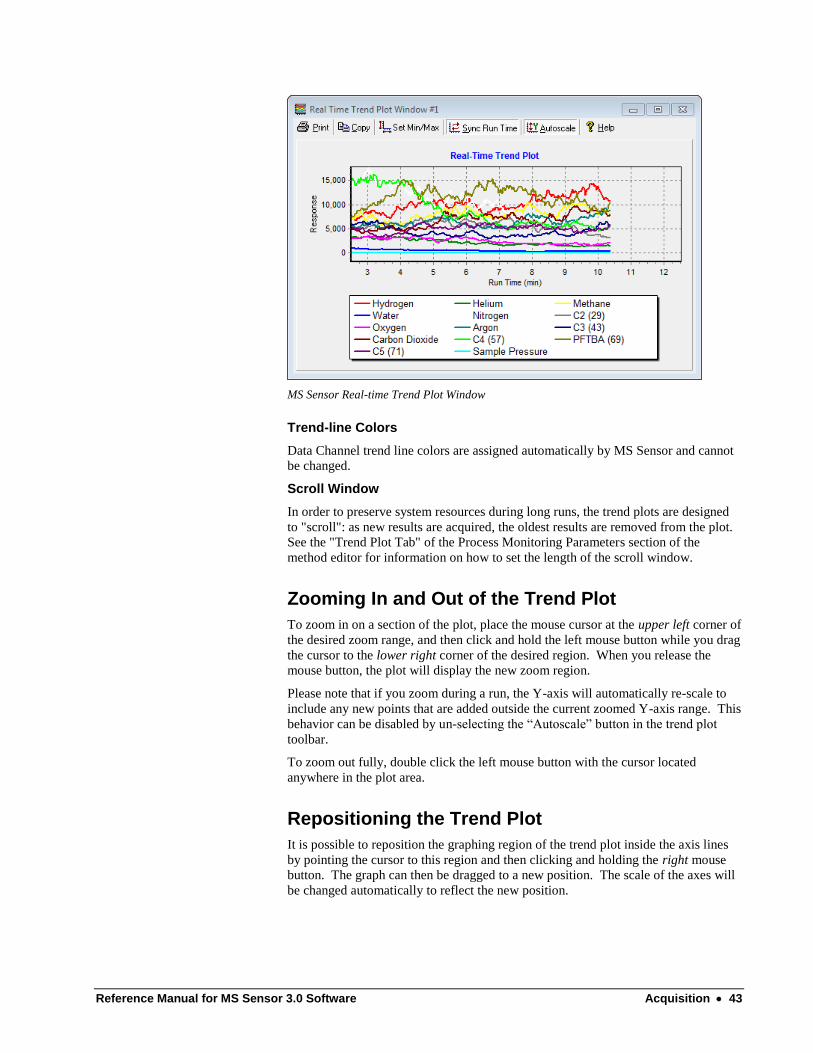
Reference Manual for MS Sensor 3.0 Software Acquisition 43
MS Sensor Real-time Trend Plot Window
Trend-line Colors
Data Channel trend line colors are assigned automatically by MS Sensor and cannot
be changed.
Scroll Window
In order to preserve system resources during long runs, the trend plots are designed
to "scroll": as new results are acquired, the oldest results are removed from the plot.
See the "Trend Plot Tab" of the Process Monitoring Parameters section of the
method editor for information on how to set the length of the scroll window.
Zooming In and Out of the Trend Plot
To zoom in on a section of the plot, place the mouse cursor at the upper left corner of
the desired zoom range, and then click and hold the left mouse button while you drag
the cursor to the lower right corner of the desired region. When you release the
mouse button, the plot will display the new zoom region.
Please note that if you zoom during a run, the Y-axis will automatically re-scale to
include any new points that are added outside the current zoomed Y-axis range. This
behavior can be disabled by un-selecting the “Autoscale” button in the trend plot
toolbar.
To zoom out fully, double click the left mouse button with the cursor located
anywhere in the plot area.
Repositioning the Trend Plot
It is possible to reposition the graphing region of the trend plot inside the axis lines
by pointing the cursor to this region and then clicking and holding the right mouse
button. The graph can then be dragged to a new position. The scale of the axes will
be changed automatically to reflect the new position.

44 Acquisition Reference Manual for MS Sensor 3.0 Software
Trend Plot Toolbar
Each trend plot window contains a toolbar that allows the plot behavior to be
modified as described below.
Button Description
Print Display a dialog box that allows the current trend plot to be
printed. This option isn’t available during acquisition.
Copy Copies the current trend plot to the Windows clipboard. The
option isn’t available during acquisition.
Set Min/Max Displays a dialog box that allows the minimum and maximum of
the axes of the selected trend plot to be set.
Sync Run Time All trend plot windows that have this button depressed will
synchronize their run-time axis.
Autoscale If this button is depressed, then the selected trend plot’s Y
(response) axis will automatically scale to include the maximum and minimum data points within the current time window.
Setting the Trend Plot Axis Scale
In addition to zooming and dragging the plots, the axis scales can also be set by
clicking the “Set Min/Max” button in the Real-time Trend Plot toolbar. The
following dialog box will be displayed, allowing the minimum and maximum values
of both the X (Run Time) and Y (Response) axes to be set.
When the dialog box is first displayed, the min and max values are initialized to the
current values from the selected trend plot. Any changes made to these values will
be reflected immediately on the selected plot window.
Note that the plot shown in the dialog box does not show actual data.
Set Trend Plot Axis Min/Max Dialog Box
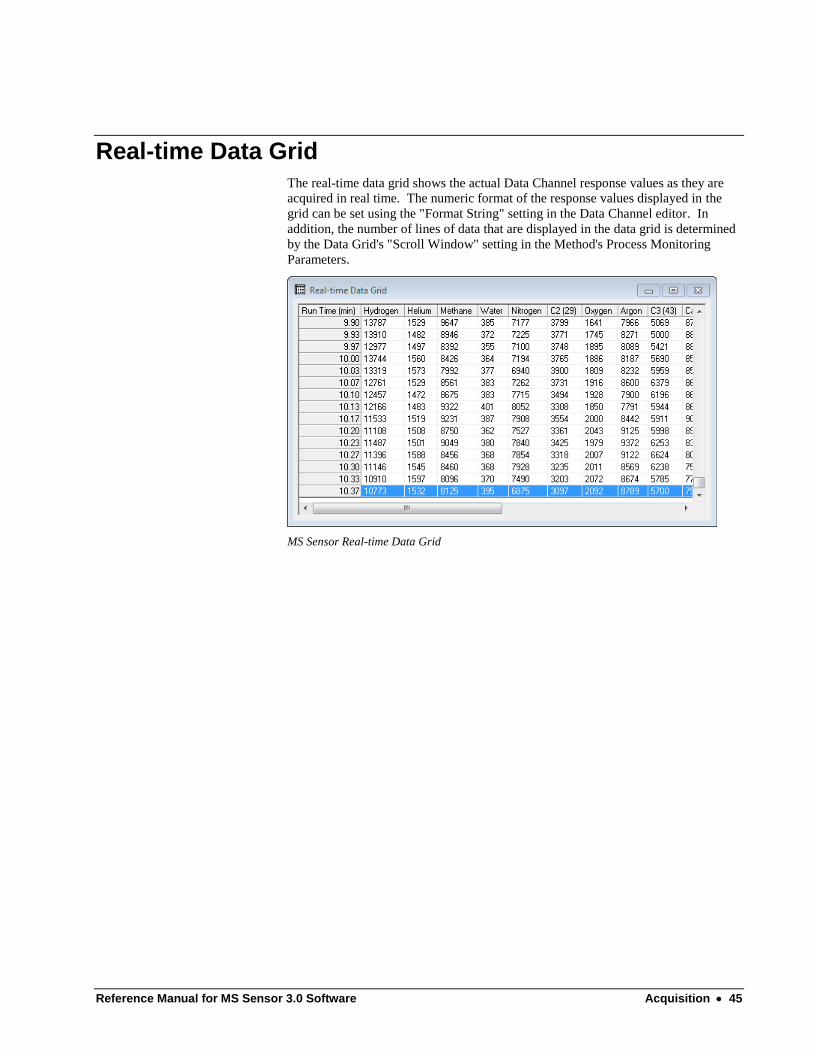
Reference Manual for MS Sensor 3.0 Software Acquisition 45
Real-time Data Grid
The real-time data grid shows the actual Data Channel response values as they are
acquired in real time. The numeric format of the response values displayed in the
grid can be set using the "Format String" setting in the Data Channel editor. In
addition, the number of lines of data that are displayed in the data grid is determined
by the Data Grid's "Scroll Window" setting in the Method's Process Monitoring
Parameters.
MS Sensor Real-time Data Grid

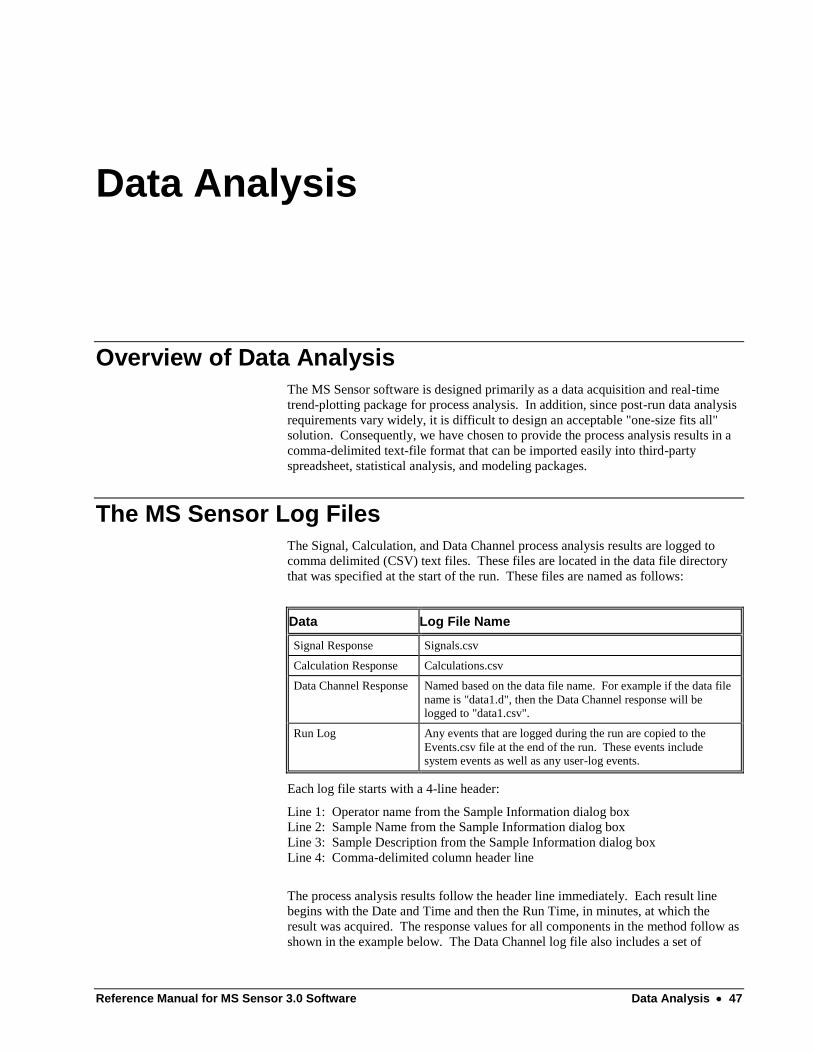
Reference Manual for MS Sensor 3.0 Software Data Analysis 47
Data Analysis
Overview of Data Analysis
The MS Sensor software is designed primarily as a data acquisition and real-time
trend-plotting package for process analysis. In addition, since post-run data analysis
requirements vary widely, it is difficult to design an acceptable "one-size fits all"
solution. Consequently, we have chosen to provide the process analysis results in a
comma-delimited text-file format that can be imported easily into third-party
spreadsheet, statistical analysis, and modeling packages.
The MS Sensor Log Files
The Signal, Calculation, and Data Channel process analysis results are logged to
comma delimited (CSV) text files. These files are located in the data file directory
that was specified at the start of the run. These files are named as follows:
Data Log File Name
Signal Response Signals.csv
Calculation Response Calculations.csv
Data Channel Response Named based on the data file name. For example if the data file
name is "data1.d", then the Data Channel response will be logged to "data1.csv".
Run Log Any events that are logged during the run are copied to the
Events.csv file at the end of the run. These events include system events as well as any user-log events.
Each log file starts with a 4-line header:
Line 1: Operator name from the Sample Information dialog box
Line 2: Sample Name from the Sample Information dialog box
Line 3: Sample Description from the Sample Information dialog box
Line 4: Comma-delimited column header line
The process analysis results follow the header line immediately. Each result line
begins with the Date and Time and then the Run Time, in minutes, at which the
result was acquired. The response values for all components in the method follow as
shown in the example below. The Data Channel log file also includes a set of
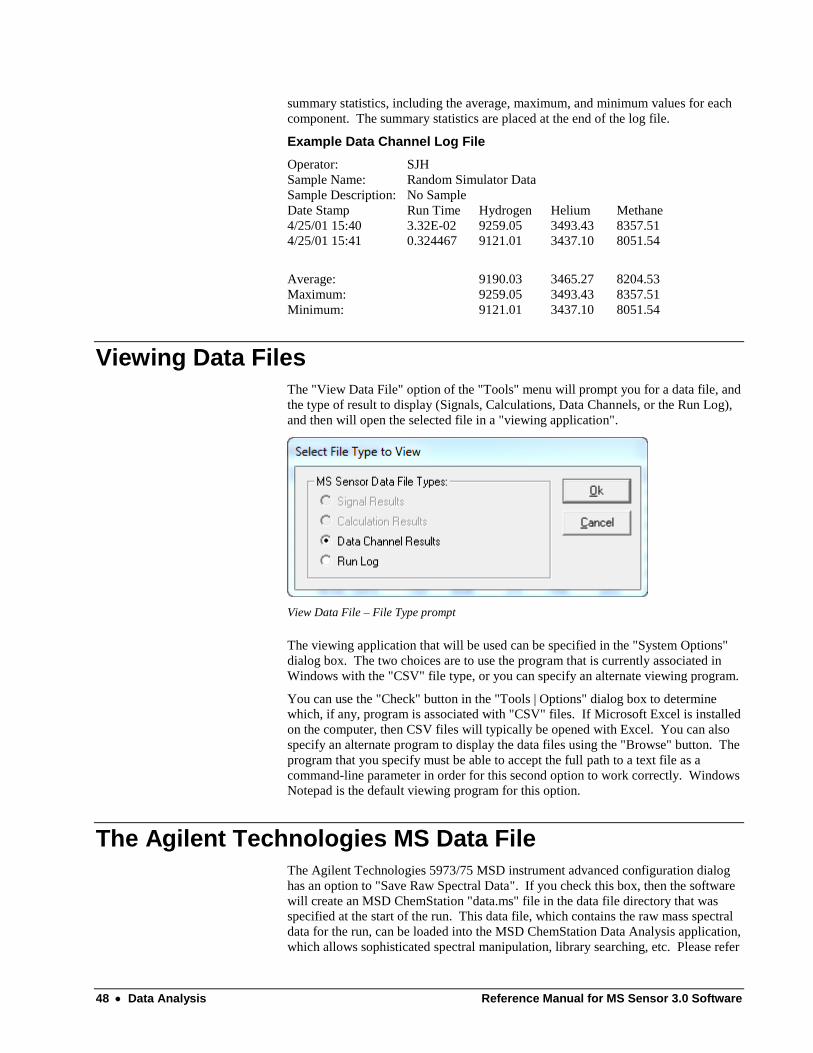
48 Data Analysis Reference Manual for MS Sensor 3.0 Software
summary statistics, including the average, maximum, and minimum values for each
component. The summary statistics are placed at the end of the log file.
Example Data Channel Log File
Operator: SJH
Sample Name: Random Simulator Data
Sample Description: No Sample
Date Stamp Run Time Hydrogen Helium Methane
4/25/01 15:40 3.32E-02 9259.05 3493.43 8357.51
4/25/01 15:41 0.324467 9121.01 3437.10 8051.54
Average: 9190.03 3465.27 8204.53
Maximum: 9259.05 3493.43 8357.51
Minimum: 9121.01 3437.10 8051.54
Viewing Data Files
The "View Data File" option of the "Tools" menu will prompt you for a data file, and
the type of result to display (Signals, Calculations, Data Channels, or the Run Log),
and then will open the selected file in a "viewing application".
View Data File – File Type prompt
The viewing application that will be used can be specified in the "System Options"
dialog box. The two choices are to use the program that is currently associated in
Windows with the "CSV" file type, or you can specify an alternate viewing program.
You can use the "Check" button in the "Tools | Options" dialog box to determine
which, if any, program is associated with "CSV" files. If Microsoft Excel is installed
on the computer, then CSV files will typically be opened with Excel. You can also
specify an alternate program to display the data files using the "Browse" button. The
program that you specify must be able to accept the full path to a text file as a
command-line parameter in order for this second option to work correctly. Windows
Notepad is the default viewing program for this option.
The Agilent Technologies MS Data File
The Agilent Technologies 5973/75 MSD instrument advanced configuration dialog
has an option to "Save Raw Spectral Data". If you check this box, then the software
will create an MSD ChemStation "data.ms" file in the data file directory that was
specified at the start of the run. This data file, which contains the raw mass spectral
data for the run, can be loaded into the MSD ChemStation Data Analysis application,
which allows sophisticated spectral manipulation, library searching, etc. Please refer

Reference Manual for MS Sensor 3.0 Software Data Analysis 49
to the ChemStation documentation for more information on it's data analysis
capabilities.

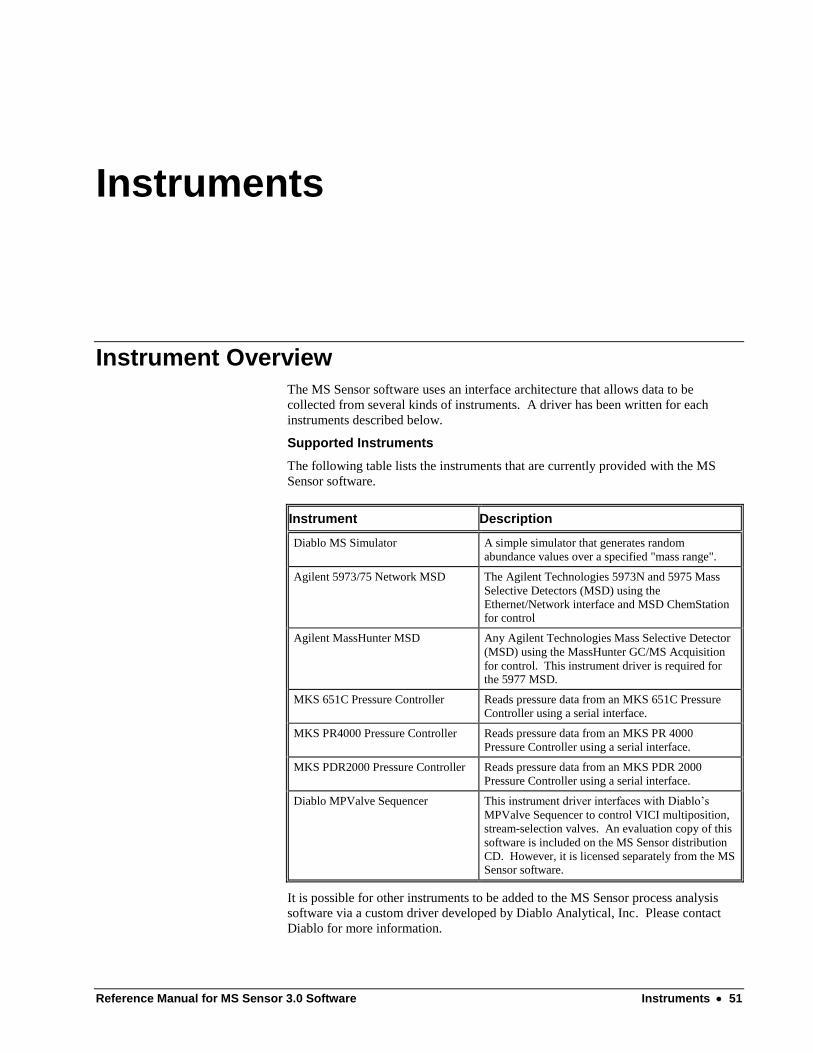
Reference Manual for MS Sensor 3.0 Software Instruments 51
Instruments
Instrument Overview
The MS Sensor software uses an interface architecture that allows data to be
collected from several kinds of instruments. A driver has been written for each
instruments described below.
Supported Instruments
The following table lists the instruments that are currently provided with the MS
Sensor software.
Instrument Description
Diablo MS Simulator A simple simulator that generates random
abundance values over a specified "mass range".
Agilent 5973/75 Network MSD The Agilent Technologies 5973N and 5975 Mass
Selective Detectors (MSD) using the
Ethernet/Network interface and MSD ChemStation for control
Agilent MassHunter MSD Any Agilent Technologies Mass Selective Detector
(MSD) using the MassHunter GC/MS Acquisition
for control. This instrument driver is required for the 5977 MSD.
MKS 651C Pressure Controller Reads pressure data from an MKS 651C Pressure
Controller using a serial interface.
MKS PR4000 Pressure Controller Reads pressure data from an MKS PR 4000
Pressure Controller using a serial interface.
MKS PDR2000 Pressure Controller Reads pressure data from an MKS PDR 2000
Pressure Controller using a serial interface.
Diablo MPValve Sequencer This instrument driver interfaces with Diablo’s
MPValve Sequencer to control VICI multiposition,
stream-selection valves. An evaluation copy of this
software is included on the MS Sensor distribution
CD. However, it is licensed separately from the MS Sensor software.
It is possible for other instruments to be added to the MS Sensor process analysis
software via a custom driver developed by Diablo Analytical, Inc. Please contact
Diablo for more information.

52 Instruments Reference Manual for MS Sensor 3.0 Software
Diablo MS Simulator
The Diablo MS Simulator instrument is a simple mass spectrometer simulator that
generates random abundance values over a specified "scan range". This instrument
is used primarily for testing, training, and demonstration since it doesn't need to be
connected to an actual instrument.
Configuring the Diablo MS Simulator Instrument
Diablo MS Simulator Instrument Recipe Dialog Box
Instrument Description
This description is used to help identify the instrument in the method tree and the
manual acquisition instrument status table.
Scan Range
Enter a Starting Mass and Ending Mass to define the scan range over which the
simulator will generate signal data.
Supported Signal Types
Mass Abundance
This signal type returns the abundance of the specified mass in the spectrum.
Signal Index 1 (M/Z): The mass-to-charge ratio of the desired peak in the mass
spectrum. This mass must fall within the scan range that is specified in the
instrument parameters dialog box.
Total Ion Signal
This signal type returns the total abundance of all ions in the mass spectrum.
Base Peak Mass
This signal type returns the mass of the largest peak in the mass spectrum.
Base Peak Abundance
This signal type returns the abundance of the largest peak in the mass spectrum.
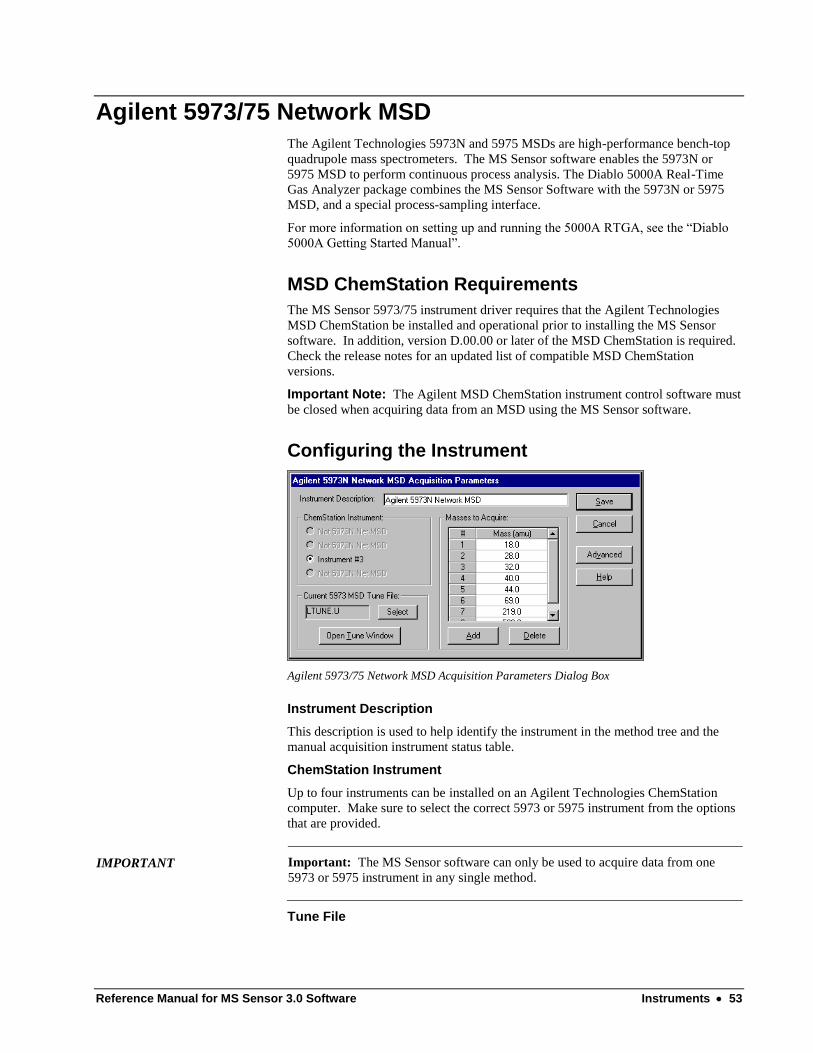
Reference Manual for MS Sensor 3.0 Software Instruments 53
Agilent 5973/75 Network MSD
The Agilent Technologies 5973N and 5975 MSDs are high-performance bench-top
quadrupole mass spectrometers. The MS Sensor software enables the 5973N or
5975 MSD to perform continuous process analysis. The Diablo 5000A Real-Time
Gas Analyzer package combines the MS Sensor Software with the 5973N or 5975
MSD, and a special process-sampling interface.
For more information on setting up and running the 5000A RTGA, see the “Diablo
5000A Getting Started Manual”.
MSD ChemStation Requirements
The MS Sensor 5973/75 instrument driver requires that the Agilent Technologies
MSD ChemStation be installed and operational prior to installing the MS Sensor
software. In addition, version D.00.00 or later of the MSD ChemStation is required.
Check the release notes for an updated list of compatible MSD ChemStation
versions.
Important Note: The Agilent MSD ChemStation instrument control software must
be closed when acquiring data from an MSD using the MS Sensor software.
Configuring the Instrument
Agilent 5973/75 Network MSD Acquisition Parameters Dialog Box
Instrument Description
This description is used to help identify the instrument in the method tree and the
manual acquisition instrument status table.
ChemStation Instrument
Up to four instruments can be installed on an Agilent Technologies ChemStation
computer. Make sure to select the correct 5973 or 5975 instrument from the options
that are provided.
IMPORTANT Important: The MS Sensor software can only be used to acquire data from one
5973 or 5975 instrument in any single method.
Tune File
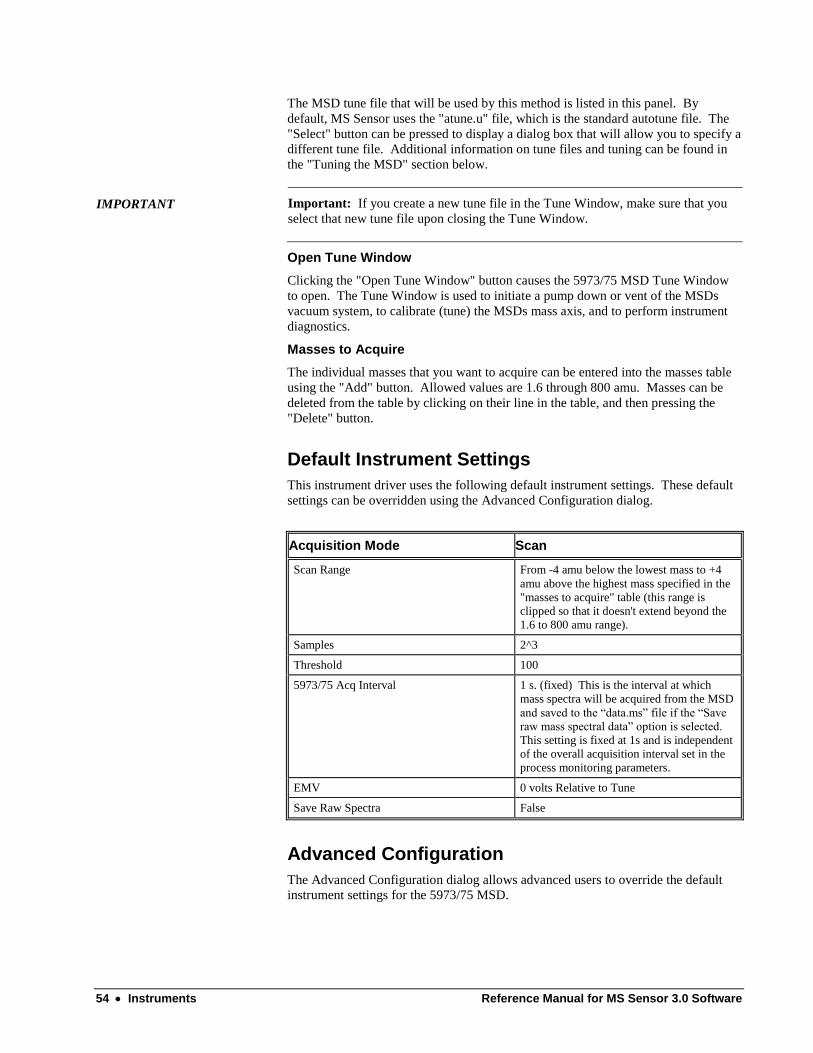
54 Instruments Reference Manual for MS Sensor 3.0 Software
The MSD tune file that will be used by this method is listed in this panel. By
default, MS Sensor uses the "atune.u" file, which is the standard autotune file. The
"Select" button can be pressed to display a dialog box that will allow you to specify a
different tune file. Additional information on tune files and tuning can be found in
the "Tuning the MSD" section below.
IMPORTANT Important: If you create a new tune file in the Tune Window, make sure that you
select that new tune file upon closing the Tune Window.
Open Tune Window
Clicking the "Open Tune Window" button causes the 5973/75 MSD Tune Window
to open. The Tune Window is used to initiate a pump down or vent of the MSDs
vacuum system, to calibrate (tune) the MSDs mass axis, and to perform instrument
diagnostics.
Masses to Acquire
The individual masses that you want to acquire can be entered into the masses table
using the "Add" button. Allowed values are 1.6 through 800 amu. Masses can be
deleted from the table by clicking on their line in the table, and then pressing the
"Delete" button.
Default Instrument Settings
This instrument driver uses the following default instrument settings. These default
settings can be overridden using the Advanced Configuration dialog.
Acquisition Mode Scan
Scan Range From -4 amu below the lowest mass to +4
amu above the highest mass specified in the
"masses to acquire" table (this range is
clipped so that it doesn't extend beyond the
1.6 to 800 amu range).
Samples 2^3
Threshold 100
5973/75 Acq Interval 1 s. (fixed) This is the interval at which
mass spectra will be acquired from the MSD
and saved to the “data.ms” file if the “Save
raw mass spectral data” option is selected.
This setting is fixed at 1s and is independent
of the overall acquisition interval set in the
process monitoring parameters.
EMV 0 volts Relative to Tune
Save Raw Spectra False
Advanced Configuration
The Advanced Configuration dialog allows advanced users to override the default
instrument settings for the 5973/75 MSD.
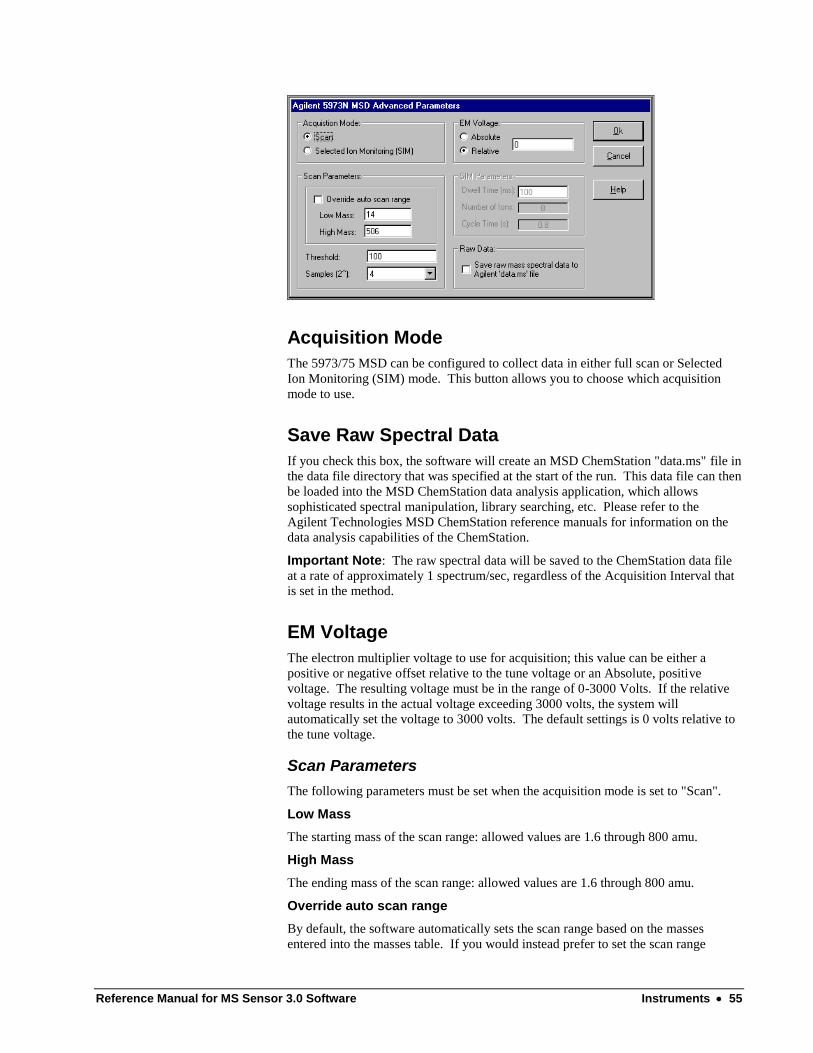
Reference Manual for MS Sensor 3.0 Software Instruments 55
Acquisition Mode
The 5973/75 MSD can be configured to collect data in either full scan or Selected
Ion Monitoring (SIM) mode. This button allows you to choose which acquisition
mode to use.
Save Raw Spectral Data
If you check this box, the software will create an MSD ChemStation "data.ms" file in
the data file directory that was specified at the start of the run. This data file can then
be loaded into the MSD ChemStation data analysis application, which allows
sophisticated spectral manipulation, library searching, etc. Please refer to the
Agilent Technologies MSD ChemStation reference manuals for information on the
data analysis capabilities of the ChemStation.
Important Note: The raw spectral data will be saved to the ChemStation data file
at a rate of approximately 1 spectrum/sec, regardless of the Acquisition Interval that
is set in the method.
EM Voltage
The electron multiplier voltage to use for acquisition; this value can be either a
positive or negative offset relative to the tune voltage or an Absolute, positive
voltage. The resulting voltage must be in the range of 0-3000 Volts. If the relative
voltage results in the actual voltage exceeding 3000 volts, the system will
automatically set the voltage to 3000 volts. The default settings is 0 volts relative to
the tune voltage.
Scan Parameters
The following parameters must be set when the acquisition mode is set to "Scan".
Low Mass
The starting mass of the scan range: allowed values are 1.6 through 800 amu.
High Mass
The ending mass of the scan range: allowed values are 1.6 through 800 amu.
Override auto scan range
By default, the software automatically sets the scan range based on the masses
entered into the masses table. If you would instead prefer to set the scan range

56 Instruments Reference Manual for MS Sensor 3.0 Software
manually, check the "Override auto scan range" checkbox and entered the desired
low and high masses.
Threshold
This is the MS peak detection threshold. Spectral peaks whose abundance is below
this value will be ignored by the data system and their abundance will be set to 0.
Samples
A number n, where the number of samples is 2^n; allowed values for n are 0 through
7. This determines the degree of signal averaging that will be performed.
IMPORTANT Important: Setting Samples to a value less than 3 can cause inconsistent results for
low masses (less than 10 amu).
SIM Parameters
The following parameters must be set when the acquisition mode is set to "Selected
Ion Monitoring".
SIM Ion Table
Up to 30 SIM ions can be added to the "Masses to Acquire" table on the main
configuration dialog box using the "Add" button. Allowed values are 1.6 through
800 amu. Ions can be deleted from the table by clicking on their line in the table,
and then pressing the "Delete" button.
Dwell Time
The time in milliseconds for acquiring data at each mass: the acceptable range is 10-
9999. The dwell time multiplied by the number of ions must be less than 59 s.
Cycle Time
The dwell time multiplied by the number of ions: the total cycle time must be less
than 59 s.
The MSD Tune Window
Pressing the “Tune Window” button opens the MSD Tune Window. This window is
a custom version of the MSD ChemStation's "Manual Tune" window.
The Tune Window is used to initiate a pump down or vent of the MSDs vacuum
system, to calibrate (tune) the MSDs mass axis, and to perform instrument
diagnostics.
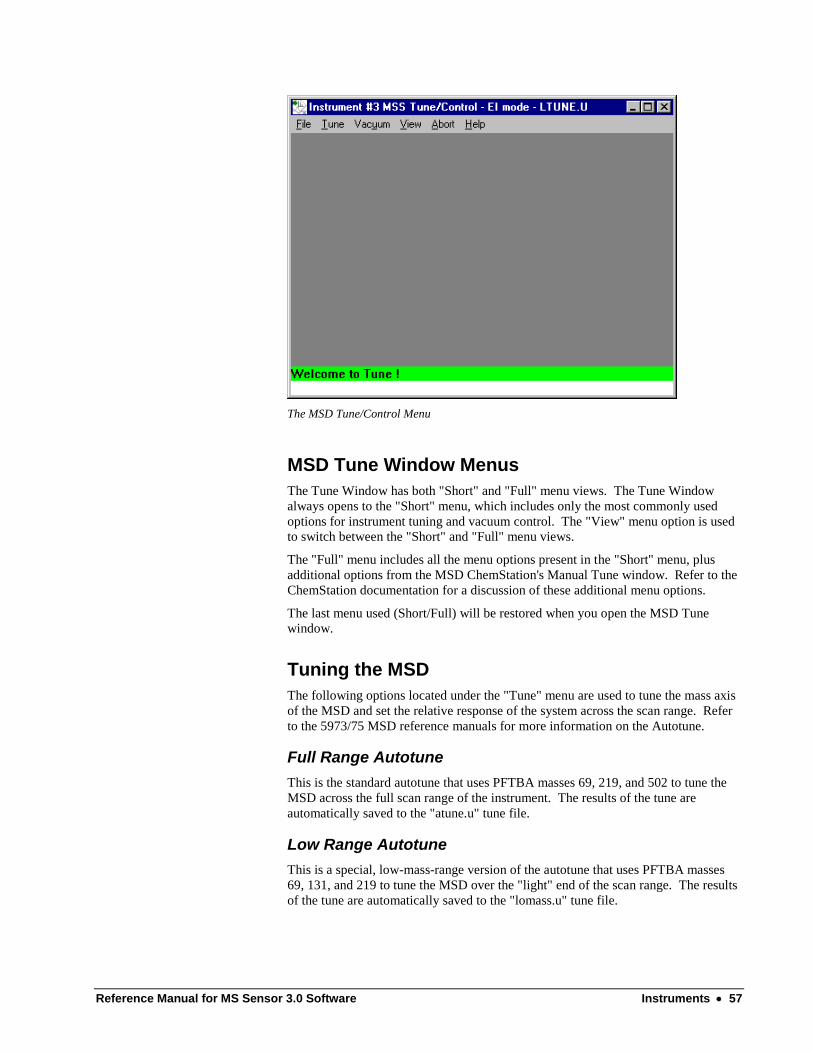
Reference Manual for MS Sensor 3.0 Software Instruments 57
The MSD Tune/Control Menu
MSD Tune Window Menus
The Tune Window has both "Short" and "Full" menu views. The Tune Window
always opens to the "Short" menu, which includes only the most commonly used
options for instrument tuning and vacuum control. The "View" menu option is used
to switch between the "Short" and "Full" menu views.
The "Full" menu includes all the menu options present in the "Short" menu, plus
additional options from the MSD ChemStation's Manual Tune window. Refer to the
ChemStation documentation for a discussion of these additional menu options.
The last menu used (Short/Full) will be restored when you open the MSD Tune
window.
Tuning the MSD
The following options located under the "Tune" menu are used to tune the mass axis
of the MSD and set the relative response of the system across the scan range. Refer
to the 5973/75 MSD reference manuals for more information on the Autotune.
Full Range Autotune
This is the standard autotune that uses PFTBA masses 69, 219, and 502 to tune the
MSD across the full scan range of the instrument. The results of the tune are
automatically saved to the "atune.u" tune file.
Low Range Autotune
This is a special, low-mass-range version of the autotune that uses PFTBA masses
69, 131, and 219 to tune the MSD over the "light" end of the scan range. The results
of the tune are automatically saved to the "lomass.u" tune file.
58 Instruments Reference Manual for MS Sensor 3.0 Software
Hydrogen Tune
The measurement of very light ions like hydrogen with the MSD requires special
tuning and hardware. In order to perform a hydrogen tune, the 5973/75 MSD must
have the special "Low Gauss" source magnet and a 6-mm drawout lens installed. In
addition, you will need to be able to supply the instrument with a "tune mix"
containing 20-100% Hydrogen in a diluent gas like Helium or Nitrogen.
There are two hydrogen tune menu options, "Full Hydrogen Tune", and "Quick
Hydrogen Tune". The "Full Hydrogen Tune" automatically runs a low-range
autotune before optimizing the system for hydrogen response. The "Quick Hydrogen
Tune" loads the current low-range tune file (lomass.u) from disk, and then performs
the hydrogen optimization tune.
The hydrogen optimization tune adjusts the repeller, ion focus, electron energy,
emission current, and entrance lens offset parameters to produce maximum response
at m/z=2. In addition, masses 69, 131, and 219 from the 5973/75 MSDs calibration
fluid (PFTBA) are used to help calibrate the mass axis, adjust peak widths, and set
the electron multiplier voltage so that a consistent signal abundance is achieved.
The results of the hydrogen optimization tune are save to the tune file 'htune.u'.
IMPORTANT Important: You should only perform the Hydrogen Tune with the standard 50-
micron orifice plate installed on the high-vacuum side of the RTGA interface.
Important Considerations
There are several important things to consider when performing a hydrogen tune.
1. The system will be optimized for response in the very low mass range.
Consequently the performance at higher masses may be reduced.
2. The hydrogen tune will result in the Electron Energy being set to
something other than the "standard" 70 eV. This will only be an issue
if calculations or library searches are performed with the assumption
that the spectra will have a "classic" fragmentation pattern. This is not
expected to be important with standard uses of the Real-Time Gas
Analyzer.
3. Although the hydrogen optimization tune will work over a range of
hydrogen concentrations, it is best to use a consistent tune mix in order
to achieve reproducible and consistent hydrogen tunes for specific
applications.
4. After performing a hydrogen tune, make sure that you specify 'htune.u'
as the tune file in the MS Sensor "Agilent 5973/75 Network MSD
Acquisition Parameters" Dialog Box.
Resetting to Factory Default Conditions
The hydrogen optimization tune is influenced significantly by the starting conditions
as defined by the low-range autotune (lomass.u). If for some reason the low-range
autotune has drifted or become corrupted, it may be necessary to reset the tune
parameters to their factory-default values. This is accomplished by switching to the
"Full" menu view ("View | Full Menu"), select "Reset to Defaults" from the "File"
menu, and then select "Autotune" from the list of factory tunes.
On recent versions of the MSD ChemStation, the factory default tune files can be
restored by running the Agilent MSD Configuration Editor. Open the instrument
that corresponds to the RTGA MSD and then click “OK” to close and save the
configuration. Click “Yes” when prompted to “Proceed with update to Instrument

Reference Manual for MS Sensor 3.0 Software Instruments 59
Configuration”.
IMPORTANT Important: After resetting the tune parameters to their default parameters, you
should immediately run either a Low-range Autotune, or a Full Hydrogen Tune so
that the low-range autotune file is regenerated from the factory defaults.
Data Acquisition with the MSD
When a 5973/75 MSD instrument is initialized, an acquisition window is
automatically opened and minimized to the Windows 2000/XP taskbar. This
window can be restored during acquisition so that the mass spectrum of the process
can be viewed in real time.
Make sure not to close this window manually during acquisition, or the resulting
instrument error will cause the analysis to abort immediately. It is, however, safe to
minimize this window during acquisition.
MS Sensor 5973/75 MSD Acquisition Window
Supported Signal Types
Mass Abundance
This signal type returns the abundance of the specified mass in the spectrum.
Signal Index 1 (M/Z): The mass-to-charge ratio of the desired peak in the mass
spectrum. This value must fall between the low mass and high mass scan range that
is specified in the instrument parameters dialog box.
Total Ion Signal
This signal type returns the total abundance of all ions in the mass spectrum.

60 Instruments Reference Manual for MS Sensor 3.0 Software
Base Peak Mass
This signal type returns the mass of the largest peak in the mass spectrum.
Base Peak Abundance
This signal type returns the abundance of the largest peak in the mass spectrum.
Agilent MassHunter MSD
The Agilent Technologies MassHunter GC/MS Acquisition software is required to
control the 5977 MSD and also currently supports the 5975 MSD.
MassHunter Requirements
The MS Sensor MassHunter MSD instrument driver requires that the Agilent
Technologies MassHunter GC/MS Acquisition software be installed and operational
prior to installing the MS Sensor software. In addition, version B.07.00 SP1 or later
of MassHunter is required. Check the MS Sensor release notes for an updated list of
compatible MassHunter versions.
Important Note: The Agilent MassHunter instrument control software must be
closed when acquiring data from an MSD using the MS Sensor software.
Configuring the Instrument
Agilent MassHunter MSD Acquisition Parameters Dialog Box
Instrument Description
This description is used to help identify the instrument in the method tree and the
manual acquisition instrument status table.
MassHunter Instrument
Up to four instruments can be installed on an Agilent Technologies MassHunter
computer. Make sure to select the correct MSD instrument from the options that are
provided.
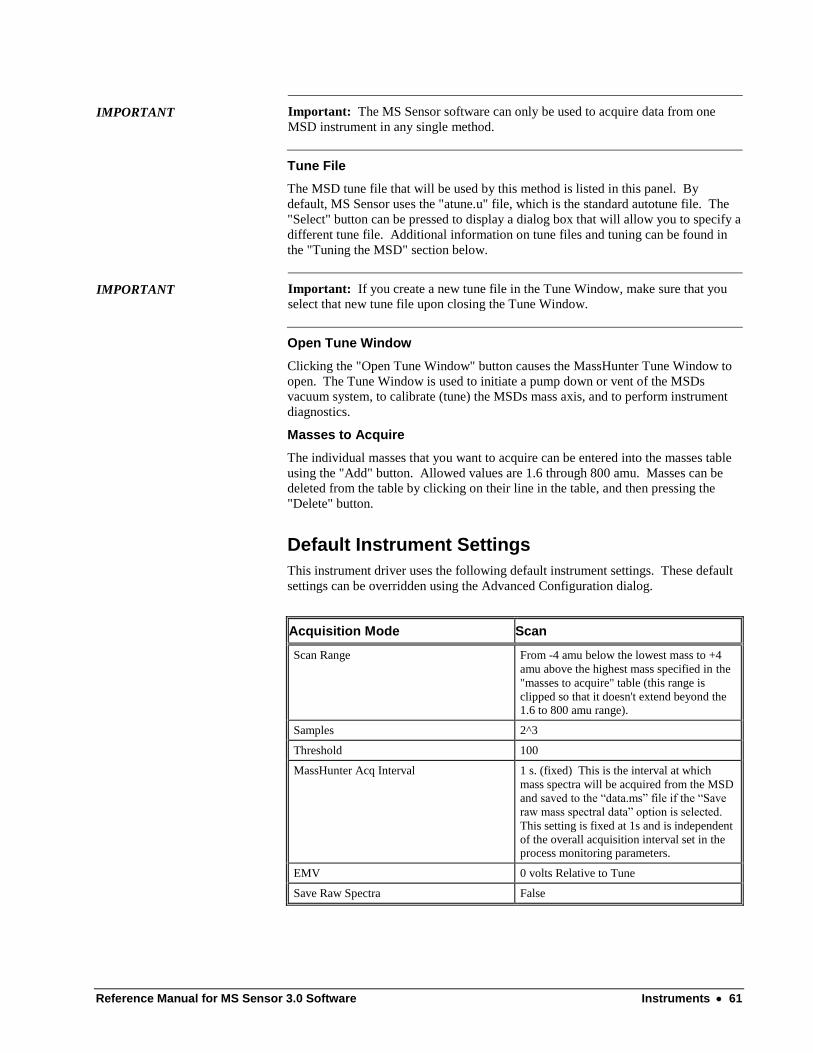
Reference Manual for MS Sensor 3.0 Software Instruments 61
IMPORTANT Important: The MS Sensor software can only be used to acquire data from one
MSD instrument in any single method.
Tune File
The MSD tune file that will be used by this method is listed in this panel. By
default, MS Sensor uses the "atune.u" file, which is the standard autotune file. The
"Select" button can be pressed to display a dialog box that will allow you to specify a
different tune file. Additional information on tune files and tuning can be found in
the "Tuning the MSD" section below.
IMPORTANT Important: If you create a new tune file in the Tune Window, make sure that you
select that new tune file upon closing the Tune Window.
Open Tune Window
Clicking the "Open Tune Window" button causes the MassHunter Tune Window to
open. The Tune Window is used to initiate a pump down or vent of the MSDs
vacuum system, to calibrate (tune) the MSDs mass axis, and to perform instrument
diagnostics.
Masses to Acquire
The individual masses that you want to acquire can be entered into the masses table
using the "Add" button. Allowed values are 1.6 through 800 amu. Masses can be
deleted from the table by clicking on their line in the table, and then pressing the
"Delete" button.
Default Instrument Settings
This instrument driver uses the following default instrument settings. These default
settings can be overridden using the Advanced Configuration dialog.
Acquisition Mode Scan
Scan Range From -4 amu below the lowest mass to +4
amu above the highest mass specified in the
"masses to acquire" table (this range is
clipped so that it doesn't extend beyond the 1.6 to 800 amu range).
Samples 2^3
Threshold 100
MassHunter Acq Interval 1 s. (fixed) This is the interval at which
mass spectra will be acquired from the MSD
and saved to the “data.ms” file if the “Save
raw mass spectral data” option is selected.
This setting is fixed at 1s and is independent
of the overall acquisition interval set in the process monitoring parameters.
EMV 0 volts Relative to Tune
Save Raw Spectra False

62 Instruments Reference Manual for MS Sensor 3.0 Software
Advanced Configuration
The Advanced Configuration dialog allows advanced users to override the default
instrument settings for the MSD.
Acquisition Mode
The MSD can be configured to collect data in either full scan or Selected Ion
Monitoring (SIM) mode. This button allows you to choose which acquisition mode
to use.
Save Raw Spectral Data
If you check this box, the software will create an MSD ChemStation "data.ms" file in
the data file directory that was specified at the start of the run. This data file can then
be loaded into the MSD ChemStation data analysis application, which allows
sophisticated spectral manipulation, library searching, etc. Please refer to the
Agilent Technologies MSD ChemStation reference manuals for information on the
data analysis capabilities of ChemStation Data Analysis.
Important Note: The raw spectral data will be saved to the ChemStation data file
at a rate of approximately 1 spectrum/sec, regardless of the Acquisition Interval that
is set in the method.
EM Voltage
The electron multiplier voltage to use for acquisition; this value can be either a
positive or negative offset relative to the tune voltage or an Absolute, positive
voltage. The resulting voltage must be in the range of 0-3000 Volts. If the relative
voltage results in the actual voltage exceeding 3000 volts, the system will
automatically set the voltage to 3000 volts. The default settings is 0 volts relative to
the tune voltage.
Scan Parameters
The following parameters must be set when the acquisition mode is set to "Scan".
Low Mass
Reference Manual for MS Sensor 3.0 Software Instruments 63
The starting mass of the scan range: allowed values are 1.6 through 800 amu.
High Mass
The ending mass of the scan range: allowed values are 1.6 through 800 amu.
Override auto scan range
By default, the software automatically sets the scan range based on the masses
entered into the masses table. If you would instead prefer to set the scan range
manually, check the "Override auto scan range" checkbox and entered the desired
low and high masses.
Threshold
This is the MS peak detection threshold. Spectral peaks whose abundance is below
this value will be ignored by the data system and their abundance will be set to 0.
Samples
A number n, where the number of samples is 2^n; allowed values for n are 0 through
7. This determines the degree of signal averaging that will be performed.
IMPORTANT Important: Setting Samples to a value less than 3 can cause inconsistent results for
low masses (less than 10 amu).
SIM Parameters
The following parameters must be set when the acquisition mode is set to "Selected
Ion Monitoring".
SIM Ion Table
Up to 30 SIM ions can be added to the "Masses to Acquire" table on the main
configuration dialog box using the "Add" button. Allowed values are 1.6 through
800 amu. Ions can be deleted from the table by clicking on their line in the table,
and then pressing the "Delete" button.
Dwell Time
The time in milliseconds for acquiring data at each mass: the acceptable range is 10-
9999. The dwell time multiplied by the number of ions must be less than 59 s.
Cycle Time
The dwell time multiplied by the number of ions: the total cycle time must be less
than 59 s.
The MassHunter Tune Window
Pressing the “Tune Window” button opens the MSD Tune Window. This window is
a custom version of the MassHunter " Tune and Vacuum Control" window.
The Tune Window is used to initiate a pump down or vent of the MSDs vacuum
system, to calibrate (tune) the MSDs mass axis, and to perform instrument
diagnostics.
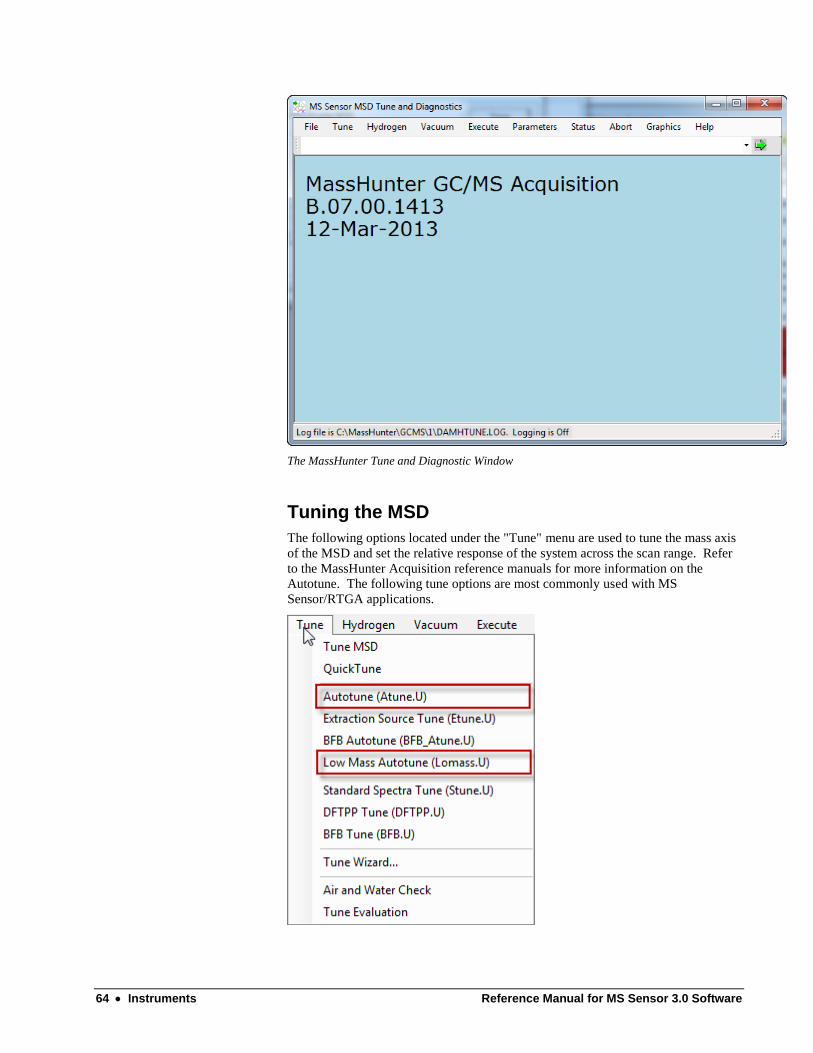
64 Instruments Reference Manual for MS Sensor 3.0 Software
The MassHunter Tune and Diagnostic Window
Tuning the MSD
The following options located under the "Tune" menu are used to tune the mass axis
of the MSD and set the relative response of the system across the scan range. Refer
to the MassHunter Acquisition reference manuals for more information on the
Autotune. The following tune options are most commonly used with MS
Sensor/RTGA applications.
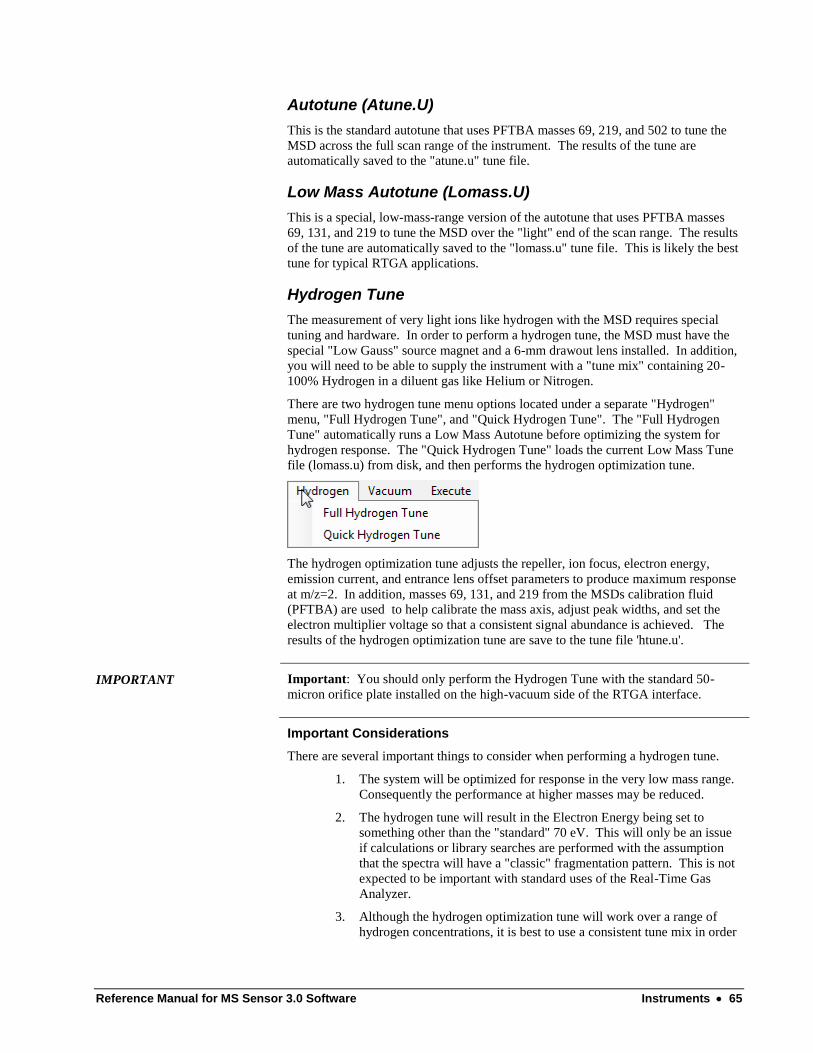
Reference Manual for MS Sensor 3.0 Software Instruments 65
Autotune (Atune.U)
This is the standard autotune that uses PFTBA masses 69, 219, and 502 to tune the
MSD across the full scan range of the instrument. The results of the tune are
automatically saved to the "atune.u" tune file.
Low Mass Autotune (Lomass.U)
This is a special, low-mass-range version of the autotune that uses PFTBA masses
69, 131, and 219 to tune the MSD over the "light" end of the scan range. The results
of the tune are automatically saved to the "lomass.u" tune file. This is likely the best
tune for typical RTGA applications.
Hydrogen Tune
The measurement of very light ions like hydrogen with the MSD requires special
tuning and hardware. In order to perform a hydrogen tune, the MSD must have the
special "Low Gauss" source magnet and a 6-mm drawout lens installed. In addition,
you will need to be able to supply the instrument with a "tune mix" containing 20-
100% Hydrogen in a diluent gas like Helium or Nitrogen.
There are two hydrogen tune menu options located under a separate "Hydrogen"
menu, "Full Hydrogen Tune", and "Quick Hydrogen Tune". The "Full Hydrogen
Tune" automatically runs a Low Mass Autotune before optimizing the system for
hydrogen response. The "Quick Hydrogen Tune" loads the current Low Mass Tune
file (lomass.u) from disk, and then performs the hydrogen optimization tune.
The hydrogen optimization tune adjusts the repeller, ion focus, electron energy,
emission current, and entrance lens offset parameters to produce maximum response
at m/z=2. In addition, masses 69, 131, and 219 from the MSDs calibration fluid
(PFTBA) are used to help calibrate the mass axis, adjust peak widths, and set the
electron multiplier voltage so that a consistent signal abundance is achieved. The
results of the hydrogen optimization tune are save to the tune file 'htune.u'.
IMPORTANT Important: You should only perform the Hydrogen Tune with the standard 50-
micron orifice plate installed on the high-vacuum side of the RTGA interface.
Important Considerations
There are several important things to consider when performing a hydrogen tune.
1. The system will be optimized for response in the very low mass range.
Consequently the performance at higher masses may be reduced.
2. The hydrogen tune will result in the Electron Energy being set to
something other than the "standard" 70 eV. This will only be an issue
if calculations or library searches are performed with the assumption
that the spectra will have a "classic" fragmentation pattern. This is not
expected to be important with standard uses of the Real-Time Gas
Analyzer.
3. Although the hydrogen optimization tune will work over a range of
hydrogen concentrations, it is best to use a consistent tune mix in order

66 Instruments Reference Manual for MS Sensor 3.0 Software
to achieve reproducible and consistent hydrogen tunes for specific
applications.
4. After performing a hydrogen tune, make sure that you specify 'htune.u'
as the tune file in the MS Sensor "Agilent MassHunter MSD
Acquisition Parameters" Dialog Box.
Resetting to Factory Default Conditions
The hydrogen optimization tune is influenced significantly by the starting conditions
as defined by the low-range autotune (lomass.u). If for some reason the low-range
autotune has drifted or become corrupted, it may be necessary to reset the tune
parameters to their factory-default values.
The factory default tune files can be restored by running the Agilent MSD
Configuration Editor. Open the instrument that corresponds to the RTGA MSD and
then click “OK” to close and save the configuration. Click “Yes” when prompted to
“Proceed with update to Instrument Configuration”.
IMPORTANT Important: After resetting the tune parameters to their default parameters, you
should immediately run either a Low Mass Autotune, or a Full Hydrogen Tune so
that the low-range autotune file is regenerated from the factory defaults.
Data Acquisition with MassHunter
When an MSD instrument is initialized, an acquisition window is automatically
opened and minimized to the Windows 7 taskbar. This window can be restored
during acquisition so that the mass spectrum of the process can be viewed in real
time.
Make sure not to close this window manually during acquisition, or the resulting
instrument error will cause the analysis to abort immediately. It is, however, safe to
minimize this window during acquisition.
MS Sensor Acquisition Window
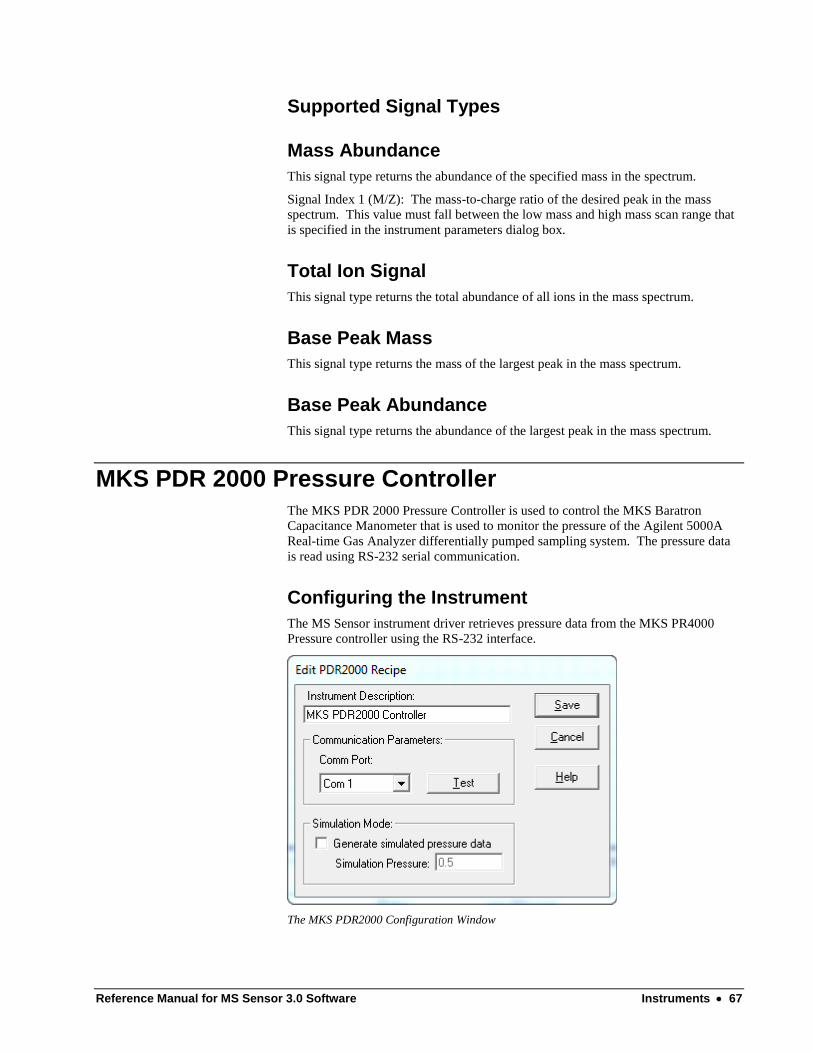
Reference Manual for MS Sensor 3.0 Software Instruments 67
Supported Signal Types
Mass Abundance
This signal type returns the abundance of the specified mass in the spectrum.
Signal Index 1 (M/Z): The mass-to-charge ratio of the desired peak in the mass
spectrum. This value must fall between the low mass and high mass scan range that
is specified in the instrument parameters dialog box.
Total Ion Signal
This signal type returns the total abundance of all ions in the mass spectrum.
Base Peak Mass
This signal type returns the mass of the largest peak in the mass spectrum.
Base Peak Abundance
This signal type returns the abundance of the largest peak in the mass spectrum.
MKS PDR 2000 Pressure Controller
The MKS PDR 2000 Pressure Controller is used to control the MKS Baratron
Capacitance Manometer that is used to monitor the pressure of the Agilent 5000A
Real-time Gas Analyzer differentially pumped sampling system. The pressure data
is read using RS-232 serial communication.
Configuring the Instrument
The MS Sensor instrument driver retrieves pressure data from the MKS PR4000
Pressure controller using the RS-232 interface.
The MKS PDR2000 Configuration Window
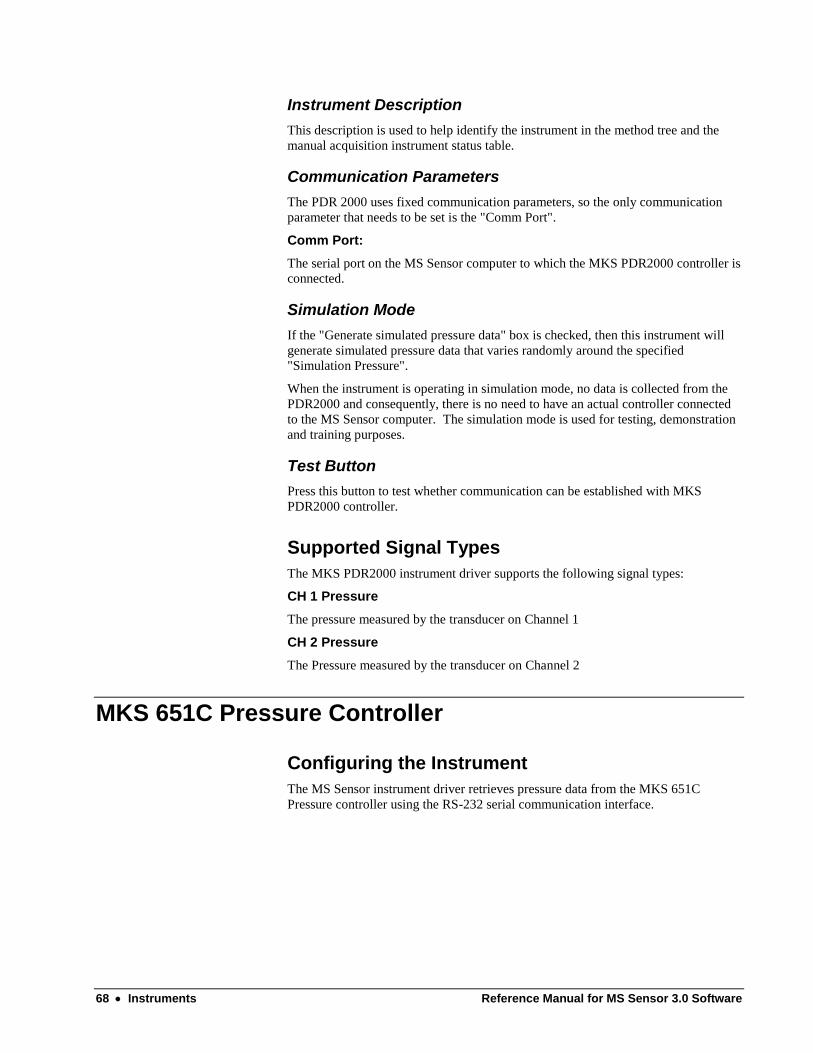
68 Instruments Reference Manual for MS Sensor 3.0 Software
Instrument Description
This description is used to help identify the instrument in the method tree and the
manual acquisition instrument status table.
Communication Parameters
The PDR 2000 uses fixed communication parameters, so the only communication
parameter that needs to be set is the "Comm Port".
Comm Port:
The serial port on the MS Sensor computer to which the MKS PDR2000 controller is
connected.
Simulation Mode
If the "Generate simulated pressure data" box is checked, then this instrument will
generate simulated pressure data that varies randomly around the specified
"Simulation Pressure".
When the instrument is operating in simulation mode, no data is collected from the
PDR2000 and consequently, there is no need to have an actual controller connected
to the MS Sensor computer. The simulation mode is used for testing, demonstration
and training purposes.
Test Button
Press this button to test whether communication can be established with MKS
PDR2000 controller.
Supported Signal Types
The MKS PDR2000 instrument driver supports the following signal types:
CH 1 Pressure
The pressure measured by the transducer on Channel 1
CH 2 Pressure
The Pressure measured by the transducer on Channel 2
MKS 651C Pressure Controller
Configuring the Instrument
The MS Sensor instrument driver retrieves pressure data from the MKS 651C
Pressure controller using the RS-232 serial communication interface.
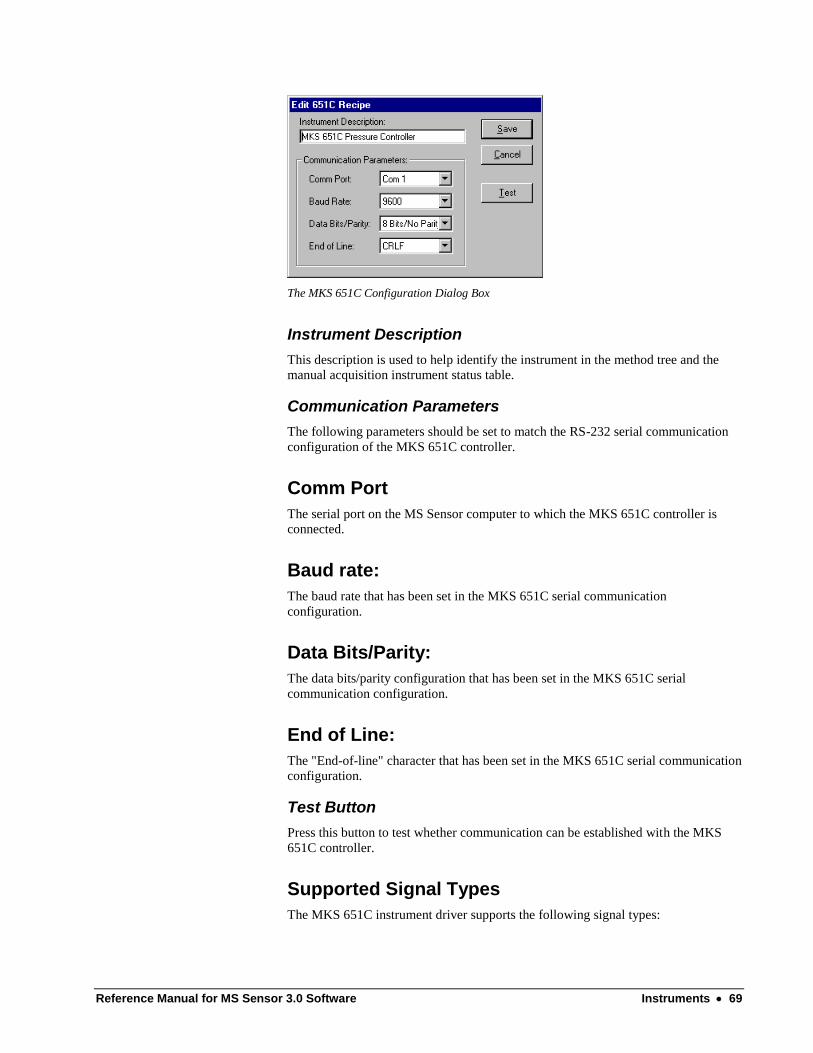
Reference Manual for MS Sensor 3.0 Software Instruments 69
The MKS 651C Configuration Dialog Box
Instrument Description
This description is used to help identify the instrument in the method tree and the
manual acquisition instrument status table.
Communication Parameters
The following parameters should be set to match the RS-232 serial communication
configuration of the MKS 651C controller.
Comm Port
The serial port on the MS Sensor computer to which the MKS 651C controller is
connected.
Baud rate:
The baud rate that has been set in the MKS 651C serial communication
configuration.
Data Bits/Parity:
The data bits/parity configuration that has been set in the MKS 651C serial
communication configuration.
End of Line:
The "End-of-line" character that has been set in the MKS 651C serial communication
configuration.
Test Button
Press this button to test whether communication can be established with the MKS
651C controller.
Supported Signal Types
The MKS 651C instrument driver supports the following signal types:

70 Instruments Reference Manual for MS Sensor 3.0 Software
Pressure
The current pressure reading on the controller.
MKS PR4000 Pressure Controller
Configuring the Instrument
The MS Sensor instrument driver retrieves pressure data from the MKS PR4000
Pressure controller using the RS-232 serial communication interface.
The MKS PR4000 Configuration Dialog Box
Instrument Description
This description is used to help identify the instrument in the method tree and the
manual acquisition instrument status table.
Communication Parameters
The following parameters should be set to match the RS-232 serial communication
configuration of the MKS PR4000 controller.
Comm Port
The serial port on the MS Sensor computer to which the MKS PR4000 controller is
connected.
Baud rate:
The baud rate that has been set in the MKS PR4000 serial communication
configuration.
Data Bits/Parity:
The data bits/parity configuration that has been set in the MKS PR4000 serial
communication configuration.
Test Button
Press this button to test whether communication can be established with MKS
PR4000 controller.

Reference Manual for MS Sensor 3.0 Software Instruments 71
Supported Signal Types
The MKS 651C instrument driver supports the following signal types:
CH 1 Actual Value
The actual value (pressure or flow rate) of the transducer on Channel 1
CH 2 Actual Value
The actual value (pressure or flow rate) of the transducer on Channel 2
Diablo MPValve Sequencer
This instrument driver is designed to interface the Diablo Analytical MPValve
Sequencer application with the MS Sensor software to provide integrated control of
VICI (Valco) multi-position, stream-selection valves.
With integrated valve control, the valve position can be specified as an MS Sensor
Signal and Data Channel. As a result, the valve position can be included with each
line of data that is collected during acquisition.
Important Note: A fully functional evaluation copy of Diablo’s MPValve 3.0
software is included on the MS Sensor installation CD and the latest version of the
software can be downloaded from Diablo’s web site. You may evaluate MPValve
Sequencer for 30 days. After the evaluation period ends, you must purchase a
software license from Diablo in order to continue using the software.
Configuring Diablo MPValve Sequencer
MPValve Sequencer Configuration Dialog Box
Instrument Description
This description is used to help identify the instrument in the method tree and the
manual acquisition instrument status table.
Edit Sequence

72 Instruments Reference Manual for MS Sensor 3.0 Software
Press the “Edit Sequence” button to start the MPValve Sequencer software. You can
then either load an existing valve sequence file, or create and save a new valve
sequence from within the MPValve Sequencer software. See the MPValve software
help file or manual for more information on setting up valve sequence programs.
When a sequence file is opened or saved from within the MPValve Sequencer
software, the sequence file will be passed automatically to the MPValve Sequencer
instrument configuration.
Note: If you would like to control the multiposition valve manually during an MS
Sensor run, simply create or load a valve sequence with no sequence steps. You can
then use the manual control section of the MPValve Sequencer window to increment,
decrement, or move to a specific valve position.
Other Options
Display valve switch event markers in trend plots: If this check box is
selected, then an event marker will be drawn on all Real-time Trend Plots at the run-
time that the valve switch occurred.
Log valce switch events to the event log: If this check box is selected, an
entry will be made in the MS Sensor event log to document the run time, valve, and
valve position.
Important: This option should be disabled for long runs with many valve switches
since the large number of log entries will produce a very large log file and potentially
cause problems with system resources.
Real-time Trend Plot Window showing valve switch event markers
Supported Signal Types
The Diablo MPValve Sequencer instrument driver supports the following signal
types:
Valve Position:
This signal type returns the current valve position for the specified valve. The valve
is specified in Signal Index 1.
Reference Manual for MS Sensor 3.0 Software Instruments 73
About MPValve Sequencer
MPValve Sequencer is a component of Diablo Analytical’s MPValve 3.0 software.
MPValve 3.0 consists of two applications: MPValve Controller and MPValve
Sequencer. Both applications are designed to interface with a Valco (VICI) multi-
position valve through a microelectronic actuator control module (ACM) via RS-232
serial communications. The MPValve Controller application allows both interactive
and automated control of valve position using command-line parameters, Dynamic
Data Exchange (DDE) or ActiveX/COM programming. The MPValve Sequencer is a
stand-alone valve sequencing application.
Diablo’s MPValve Sequencer Software
The MPVavlve Sequencer software allows both manual control of valve position as
well as timed control of valve position based on a set of steps defined in the
sequence table.

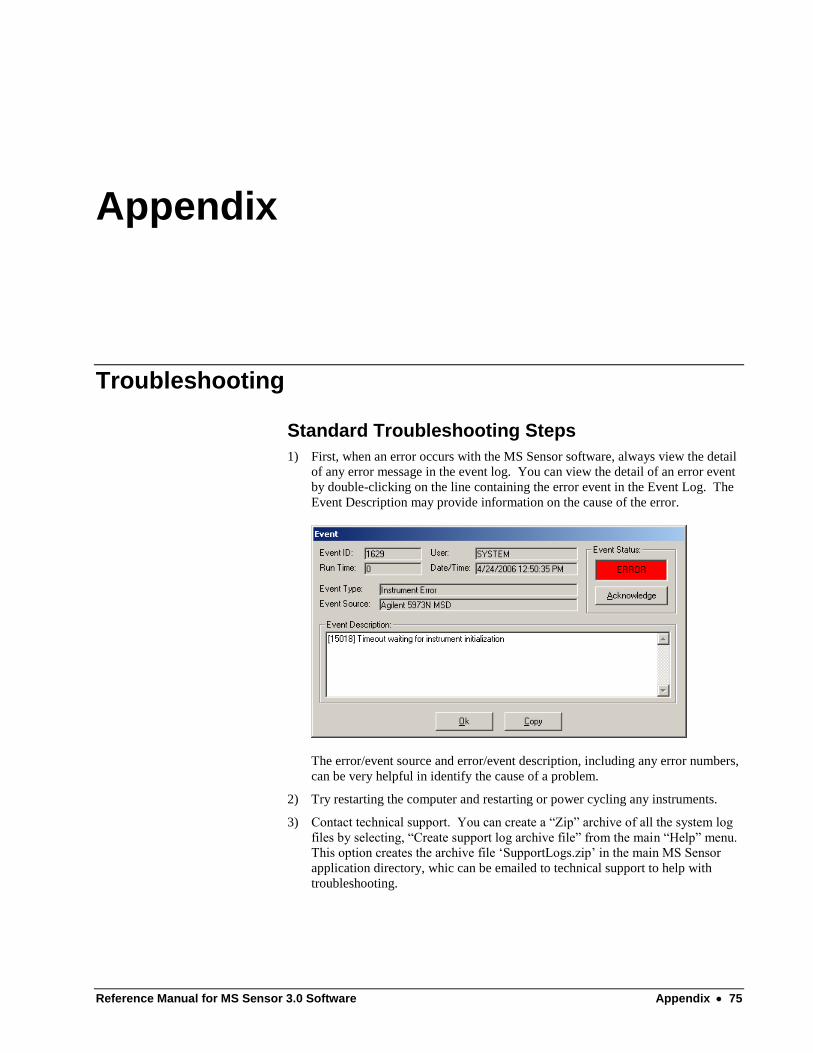
Reference Manual for MS Sensor 3.0 Software Appendix 75
Appendix
Troubleshooting
Standard Troubleshooting Steps
1) First, when an error occurs with the MS Sensor software, always view the detail
of any error message in the event log. You can view the detail of an error event
by double-clicking on the line containing the error event in the Event Log. The
Event Description may provide information on the cause of the error.
The error/event source and error/event description, including any error numbers,
can be very helpful in identify the cause of a problem.
2) Try restarting the computer and restarting or power cycling any instruments.
3) Contact technical support. You can create a “Zip” archive of all the system log
files by selecting, “Create support log archive file” from the main “Help” menu.
This option creates the archive file ‘SupportLogs.zip’ in the main MS Sensor
application directory, whic can be emailed to technical support to help with
troubleshooting.

76 Appendix Reference Manual for MS Sensor 3.0 Software
Troubleshooting the Agilent 5973/5975/5977 MSD
The Agilent 5973 and 5975 MSDs are complex instruments and the first step in
troubleshooting problems is to determine if the problem is with communication
between the MS Sensor software and the MSD software, or if the problem is with the
MSD hardware or software.
1) First, close the MS Sensor software and start the Agilent MSD instrument
control software and try to perform a standard autotune. If you are unable to
perform an autotune with the standard software, then the problem lies with the
MSD hardware or ChemStation software. If you are able to complete a standard
autotune, then the problem may be with the communication between the MSD
Software and the MS Sensor Software.
2) Try rebooting the MSD controller. This can be accomplished by pressing the
"Menu" button on the 5973/75 local user interface (LUI) until "Controller
Menu" is displayed on the LUI display. Press the "Item" button until "Reboot
Controller" is displayed. Press the "Yes/Select" button, to reboot the controller.
You can also power cycle the MSD instrument to force the controller to reboot.
Specific Errors:
“Mass Spec is already in use by another session”
If the error "Mass Spec is already in use by another session" is displayed when a
5973N or 5975 MSD instrument is initialized, then you will need to reboot the MSD
controller. This can be accomplished by pressing the "Menu" button on the 5973/75
local user interface (LUI) until "Controller Menu" is displayed on the LUI display,
and then pressing the "Item" button until "Reboot Controller" is displayed. If you
then press the "Yes/Select" button, the controller will be rebooted. You can also
power cycle the MSD instrument to force the controller to reboot.
Wait for the MSD to reboot and reload it's firmware (the MSD will beep when this
process is complete), and you should then be able to initialize the 5973/75 from the
MS Sensor Acquisition Control Panel.

Reference Manual for MS Sensor 3.0 Software Appendix 77

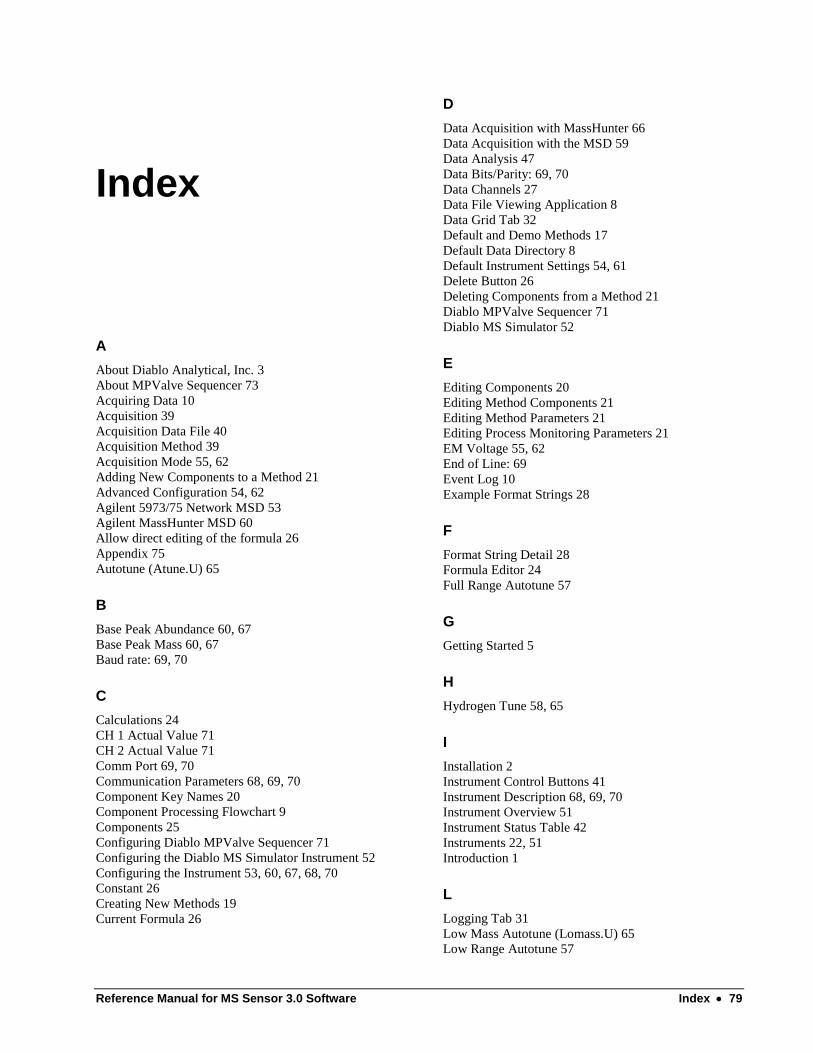
Reference Manual for MS Sensor 3.0 Software Index 79
Index
A
About Diablo Analytical, Inc. 3
About MPValve Sequencer 73
Acquiring Data 10
Acquisition 39
Acquisition Data File 40
Acquisition Method 39
Acquisition Mode 55, 62
Adding New Components to a Method 21
Advanced Configuration 54, 62
Agilent 5973/75 Network MSD 53
Agilent MassHunter MSD 60
Allow direct editing of the formula 26
Appendix 75
Autotune (Atune.U) 65
B
Base Peak Abundance 60, 67
Base Peak Mass 60, 67
Baud rate: 69, 70
C
Calculations 24
CH 1 Actual Value 71
CH 2 Actual Value 71
Comm Port 69, 70
Communication Parameters 68, 69, 70
Component Key Names 20
Component Processing Flowchart 9
Components 25
Configuring Diablo MPValve Sequencer 71
Configuring the Diablo MS Simulator Instrument 52
Configuring the Instrument 53, 60, 67, 68, 70
Constant 26
Creating New Methods 19
Current Formula 26
D
Data Acquisition with MassHunter 66
Data Acquisition with the MSD 59
Data Analysis 47
Data Bits/Parity: 69, 70
Data Channels 27
Data File Viewing Application 8
Data Grid Tab 32
Default and Demo Methods 17
Default Data Directory 8
Default Instrument Settings 54, 61
Delete Button 26
Deleting Components from a Method 21
Diablo MPValve Sequencer 71
Diablo MS Simulator 52
E
Editing Components 20
Editing Method Components 21
Editing Method Parameters 21
Editing Process Monitoring Parameters 21
EM Voltage 55, 62
End of Line: 69
Event Log 10
Example Format Strings 28
F
Format String Detail 28
Formula Editor 24
Full Range Autotune 57
G
Getting Started 5
H
Hydrogen Tune 58, 65
I
Installation 2
Instrument Control Buttons 41
Instrument Description 68, 69, 70
Instrument Overview 51
Instrument Status Table 42
Instruments 22, 51
Introduction 1
L
Logging Tab 31
Low Mass Autotune (Lomass.U) 65
Low Range Autotune 57
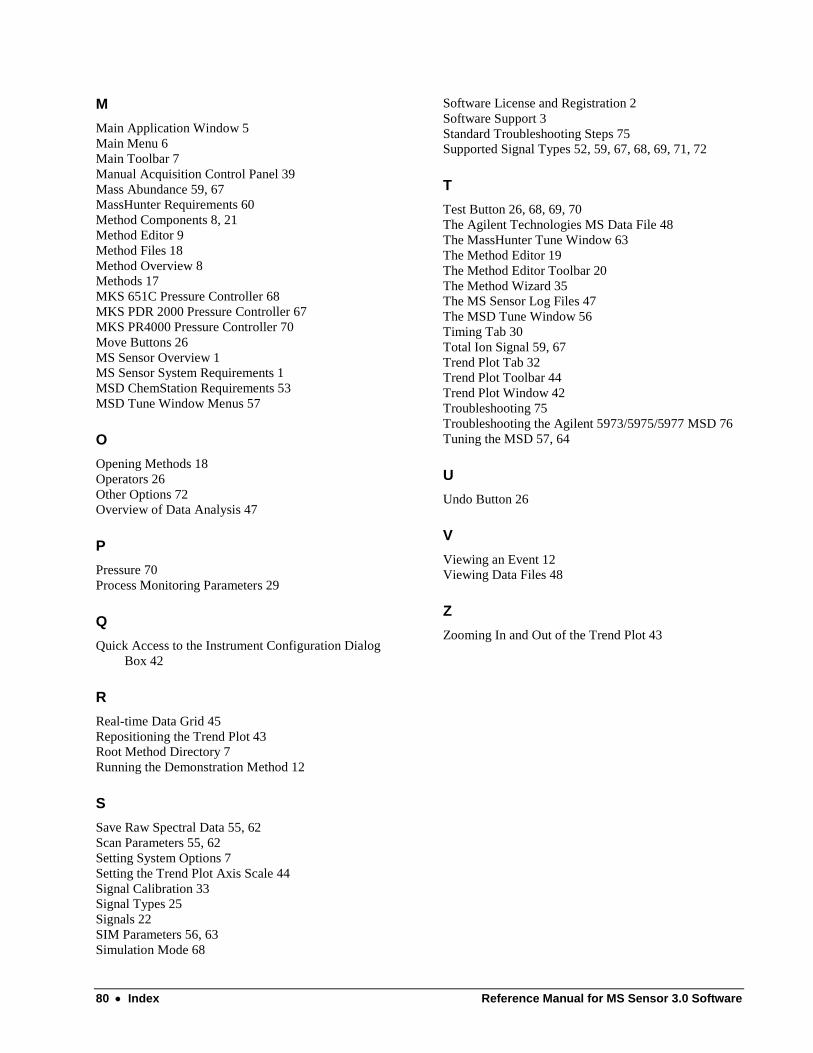
80 Index Reference Manual for MS Sensor 3.0 Software
M
Main Application Window 5
Main Menu 6
Main Toolbar 7
Manual Acquisition Control Panel 39
Mass Abundance 59, 67
MassHunter Requirements 60
Method Components 8, 21
Method Editor 9
Method Files 18
Method Overview 8
Methods 17
MKS 651C Pressure Controller 68
MKS PDR 2000 Pressure Controller 67
MKS PR4000 Pressure Controller 70
Move Buttons 26
MS Sensor Overview 1
MS Sensor System Requirements 1
MSD ChemStation Requirements 53
MSD Tune Window Menus 57
O
Opening Methods 18
Operators 26
Other Options 72
Overview of Data Analysis 47
P
Pressure 70
Process Monitoring Parameters 29
Q
Quick Access to the Instrument Configuration Dialog
Box 42
R
Real-time Data Grid 45
Repositioning the Trend Plot 43
Root Method Directory 7
Running the Demonstration Method 12
S
Save Raw Spectral Data 55, 62
Scan Parameters 55, 62
Setting System Options 7
Setting the Trend Plot Axis Scale 44
Signal Calibration 33
Signal Types 25
Signals 22
SIM Parameters 56, 63
Simulation Mode 68
Software License and Registration 2
Software Support 3
Standard Troubleshooting Steps 75
Supported Signal Types 52, 59, 67, 68, 69, 71, 72
T
Test Button 26, 68, 69, 70
The Agilent Technologies MS Data File 48
The MassHunter Tune Window 63
The Method Editor 19
The Method Editor Toolbar 20
The Method Wizard 35
The MS Sensor Log Files 47
The MSD Tune Window 56
Timing Tab 30
Total Ion Signal 59, 67
Trend Plot Tab 32
Trend Plot Toolbar 44
Trend Plot Window 42
Troubleshooting 75
Troubleshooting the Agilent 5973/5975/5977 MSD 76
Tuning the MSD 57, 64
U
Undo Button 26
V
Viewing an Event 12
Viewing Data Files 48
Z
Zooming In and Out of the Trend Plot 43