reference notes to the financial statements...pwc holdings ltd and its subsidiaries notes to the...
TRANSCRIPT

PwC Holdings Ltd and its Subsidiaries
Notes to the Financial StatementsFor the financial year ended 31 December 2010
119Illustrative Annual Report 2010
Reference
Not
es to
the
Fina
ncia
l Sta
tem
ents
3. Critical accounting estimates, assumptions and judgements1,2
Estimates, assumptions and judgements are continually evaluated and are based on historical experience and other factors, including expectations of future events that are believed to be reasonable under the circumstances.
3.1 Critical accounting estimates and assumptions
(a)Estimatedimpairmentofnon-financialassets
Goodwill is tested for impairment annually and whenever there is indication that the goodwill may be impaired. Intangible assets, property, plant and equipment and investments in subsidiaries, associates and joint ventures are tested for impairment whenever there is any objective evidence or indication that these assets may be impaired.
The recoverable amounts of these assets and where applicable, cash-generating units, have been determined based on value-in-use calculations. These calculations require the use of estimates (Note 29(a)).
An impairment charge of $4,650,000 arose in the China furniture CGU in the financial year ended 31 December 2010, which reduced the carrying amount of goodwill allocated to the China furniture CGU from $4,680,000 to $30,000. If the management’s estimated gross margin used in the value in use calculation for this CGU at 31 December 2010 is lowered by 10%, the remaining goodwill of $30,000 would be fully impaired, and in addition, the Group would reduce the carrying value of property, plant and equipment in this CGU, amounting to $20,213,000, by $350,000.3
If the management’s estimated pre-tax discount rate applied to the discounted cash flows for the China furniture CGU at 31 December 2010 is raised by 1%, the carrying amounts of goodwill and property, plant and equipment in this CGU would have been reduced by $30,000 and $250,000 respectively.3
(b)Uncertaintaxpositions
The Group is subject to income taxes in numerous jurisdictions. In determining the income tax liabilities, management is required to estimate the amount of capital allowances and the deductibility of certain expenses (“uncertain tax positions”) at each tax jurisdiction.
The Group has significant open tax assessments with one tax authority at the balance sheet date. As management believes that the tax positions are sustainable, the Group has not recognised any additional tax liability on these uncertain tax positions. The maximum exposure of these uncertain tax positions, not recognised in these financial statements is $3,500,000.
FRS 1
(122,125,126,129)
120
ReferencePwC Holdings Ltd and its Subsidiaries
Notes to the Financial StatementsFor the financial year ended 31 December 2010
Not
es to
the
Fina
ncia
l Sta
tem
ents
3.1 Critical accounting estimates and assumptions (continued)
(c) Construction contracts
The Group uses the percentage-of-completion method to account for its contract revenue. The stage of completion is measured by reference to the contract costs incurred to date compared to the estimated total costs for the contract.
Significant assumptions are required to estimate the total contract costs and the recoverable variation works that affect the stage of completion and the contract revenue respectively. In making these estimates, management has relied on past experience and the work of specialists.
If the revenue on uncompleted contracts at the balance sheet date increases/decreases by 10% from management’s estimates, the Group’s revenue will increase/decrease by $1,250,000 and $1,000,000 respectively.3
If the contract costs of uncompleted contracts to be incurred increase/decrease by 10% from management’s estimates, the Group’s profit will decrease/increase by $800,000 and $700,000 respectively.3
(d)Impairmentofloansandreceivables
Management reviews its loans and receivables for objective evidence of impairment at least quarterly. Significant financial difficulties of the debtor, the probability that the debtor will enter bankruptcy, and default or significant delay in payments are considered objective evidence that a receivable is impaired. In determining this, management makes judgement as to whether there is observable data indicating that there has been a significant change in the payment ability of the debtor, or whether there have been significant changes with adverse effect in the technological, market, economic or legal environment in which the debtor operates in.
Where there is objective evidence of impairment, management makes judgements as to whether an impairment loss should be recorded as an expense. In determining this, management uses estimates based on historical loss experience for assets with similar credit risk characteristics. The methodology and assumptions used for estimating both the amount and timing of future cash flows are reviewed regularly to reduce any differences between the estimated loss and actual loss experience.
If the net present values of estimated cash flows increase/decrease by 10% from management’s estimates for all past due loans and receivables, the Group’s and Company’s allowance for impairment will decrease/increase by $584,000 and $220,000 respectively3.

PwC Holdings Ltd and its Subsidiaries
Notes to the Financial StatementsFor the financial year ended 31 December 2010
121Illustrative Annual Report 2010
Reference
Not
es to
the
Fina
ncia
l Sta
tem
ents
3.1 Critical accounting estimates and assumptions (continued) (e)Fairvalueestimationonunlistedsecurities
The Group holds corporate variable rate notes that are not traded in an active market amounting to $5,347,000. The Group has used discounted cash flow analyses for valuing these financial assets and made estimates about expected future cash flows and credit spreads.
If the credit spread used in the discounted cash flow analysis is increased or decreased by 1% from management’s estimates, the Group’s carrying amount of financial assets, available-for-sale will be reduced by $196,000 or increased by $209,000 respectively.
3.2 Critical judgements in applying the entity’s accounting policies
(a)Deferredincometaxassets
The Group recognises deferred income tax assets on carried forward tax losses to the extent there are sufficient estimated future taxable profits and/or taxable temporary differences against which the tax losses can be utilised and that the Group is able to satisfy the continuing ownership test.
During 2010, the Group reorganised shareholdings of certain group entities, for which a deferred tax asset amounting to $250,000 was recognised based on the anticipated future use of tax losses carried forward by those entities. If the tax authority regards the group entities as not satisfying the continuing ownership test, the deferred tax income asset will have to be written off as income tax expense.
(b)Impairmentoffinancialassets,available-for-sale
At the balance sheet date, the fair values of certain equity securities classified as financial assets available-for-sale amounting to $10,230,000 have declined below cost by $203,000. The Group has made a judgement that this decline is not significant or prolonged. In making this judgement, the Group has considered, among other factors, the short-term duration of the decline, the small magnitude by which the fair value of the investment is below cost; and the positive financial health and short-term business outlook of the investee.
If the decline in fair value below cost was considered significant or prolonged, the Group would suffer an additional loss of $203,000 in its 2010 financial statements, being the reclassification of the fair value loss included in the fair value reserve to profit or loss.
FRS 107(27B)(e)
122
ReferencePwC Holdings Ltd and its Subsidiaries
Notes to the Financial StatementsFor the financial year ended 31 December 2010
Not
es to
the
Fina
ncia
l Sta
tem
ents
3.2 Critical judgements in applying the entity’s accounting policies (continued)
(c)Revenuerecognition
The Group started to design and sell a new furniture line to a new customer during 2010. Revenue of $950,000 and profit of $665,000 are recognised on these sales.
The buyer has the right to rescind the sales if there is 5% dissatisfaction with the quality of the first 1,000 pieces of furniture sold to its customers. Based on past experience with similar sales, the Group estimates that the dissatisfaction rate will not exceed 3% and as such, recognised the revenue on this transaction during 2010. If the sale is rescinded, the Group will suffer an estimated loss of $700,000 in its 2011 financial statements, $665,000 being the reversal of 2010 profits and $35,000 being the costs for returning the inventory to the warehouse.
FRS 1(128)
FRS 1(129)
FRS 1(126)
Guidance notes
Critical accounting estimates, assumptions and judgements
1. These disclosures must be tailored for another reporting entity as they are specific to an entity’s particular circumstances. Additional examples are available in Appendix 2.
2. Disclosure of key sources of estimation uncertainty is not required for assets and liabilities that are measured at fair value based on recently observable market prices. This is because even if their fair values may change materially within the next financial year, these changes will not arise from assumptions or other sources of estimation uncertainty at the balance sheet date.
3. The sensitivity of carrying amounts to the methods, assumptions and estimates underlying their calculation is required to be disclosed only when it is necessary to help users of financial statements understand difficult, subjective or complex judgements made by management concerning the future and other key sources of estimation uncertainty.

PwC Holdings Ltd and its Subsidiaries
Notes to the Financial StatementsFor the financial year ended 31 December 2010
123Illustrative Annual Report 2010
Reference
Not
es to
the
Fina
ncia
l Sta
tem
ents
4. Revenue
Group 2010 2009 $’000 $’000 Sale of goods 172,619 96,854Construction revenue 29,808 11,527Rendering of services 7,659 3,929 210,086 112,310Reclassification from hedging reserve (Note 38(b)(iv))1,2 128 50Total sales 210,214 112,360
Guidance notes
Revenue
1. FRS 39 does not prescribe the income statement line item in which reclassification from hedging reserve should be included. Accordingly, an entity can also elect to present the reclassification from hedging reserve under “Other losses – net”. The elected presentation should however be applied consistently.
2. The ineffectiveness on cash flow hedges should be classified consistently with the results of the trading derivatives (please refer to Note 8 to financial statements).
FRS 18(35)(b)(i)
FRS 11(39)(a)
FRS 18(35)(b)(ii)
FRS 107(23)(d)

124
ReferencePwC Holdings Ltd and its Subsidiaries
Notes to the Financial StatementsFor the financial year ended 31 December 2010
Not
es to
the
Fina
ncia
l Sta
tem
ents
5. Expenses by nature1
Group 2010 2009 $’000 $’000 Purchases of inventories 59,401 23,688Amortisation of intangible assets (Note 29(d)) 775 515Depreciation of property, plant and equipment (Note 28) 17,675 9,582Impairment loss of goodwill (Note 29(a)) 4,650 –Total amortisation, depreciation and impairment 23,100 10,097 Employee compensation (Note 6) 40,090 15,500Sub-contractor charges2 12,400 7,700Advertising expense2 10,871 6,952Rental expense on operating leases 10,588 8,697Research expense 473 200Transportation expense2 7,763 5,876Reversal of inventory write-down/inventory write-down2 (200) 350Other expenses 1,478 672Changes in inventories and construction contract work-in-progress (7,279) (2,950)Total cost of sales, distribution and marketing costs and administrative expenses 158,685 76,782 Included in the Group’s rental expense on operating leases is contingent rent amounting to $40,000 (2009: $45,000). The contingent rent was computed based on annual inflation rates published by the Singapore Department of Statistics.
Guidance notes
Expenses by nature
1. This disclosure is required only of entities that present their expenses by function on the face of the statement of comprehensive income. This publication illustrates a reconciliation of significant/material expenses to the total expenses by function (excluding finance expenses). This presentation is encouraged as it ensures that all significant/material expenses have been disclosed. As an alternative, the reporting entity can present only selected significant/material expenses in this note.
2. Where items of income and expense are of such size, nature or incidence that their disclosure is relevant to explain the performance of the entity for the period, the nature and amount of such items shall be disclosed separately. This includes:
(a) write-downs of inventories or property, plant and equipment or reversals;(b) restructuring provision for costs of restructuring or reversal;(c) disposals of items of property, plant and equipment;(d) disposals of investments;(e) litigation settlements; (f) other reversals of provisions; (g) minimum lease payments; and(h) contingent rents and sub-lease payments.
FRS 38(118)(d)
FRS 16(73)(e)(vii)
FRS 36(126)(a)
FRS 1(104)
FRS 1(104)
FRS 17(35)(c)
FRS 38(126)
FRS 2(36)(e,f)
FRS 17(31)(c,d(i))
FRS 1(104)
FRS 1(97,98)

PwC Holdings Ltd and its Subsidiaries
Notes to the Financial StatementsFor the financial year ended 31 December 2010
125Illustrative Annual Report 2010
Reference
Not
es to
the
Fina
ncia
l Sta
tem
ents
6. Employee compensation
Group 2010 2009 $’000 $’000 Wages and salaries 28,514 11,679Employer’s contribution to defined contribution plans including Central Provident Fund1 9,246 3,717Termination benefits 1,600 –Other long-term benefits 300 282Share option expense (Note 38(b)(i)) 690 622 40,350 16,300Less: Amounts attributable to discontinued operations (260) (800)Amounts attributable to continuing operations (Note 5) 40,090 15,500
Guidance notes
Employee compensation
1. For Singapore entities, defined contribution plans include contributions to the Central Provident Fund. A number of countries in the region (for example, Korea, Taiwan, Thailand, Vietnam, Indonesia, India, Sri Lanka, Pakistan and Bangladesh) have local legislation that requires companies to contribute to defined benefits plans. Accounting for defined benefit plans is complicated and the disclosures are extensive. Please refer to Appendix 1 Example 4 for an illustrated disclosure.
FRS 19(46)
FRS 19(142)
FRS 102(50,51(a))
126
ReferencePwC Holdings Ltd and its Subsidiaries
Notes to the Financial StatementsFor the financial year ended 31 December 2010
Not
es to
the
Fina
ncia
l Sta
tem
ents
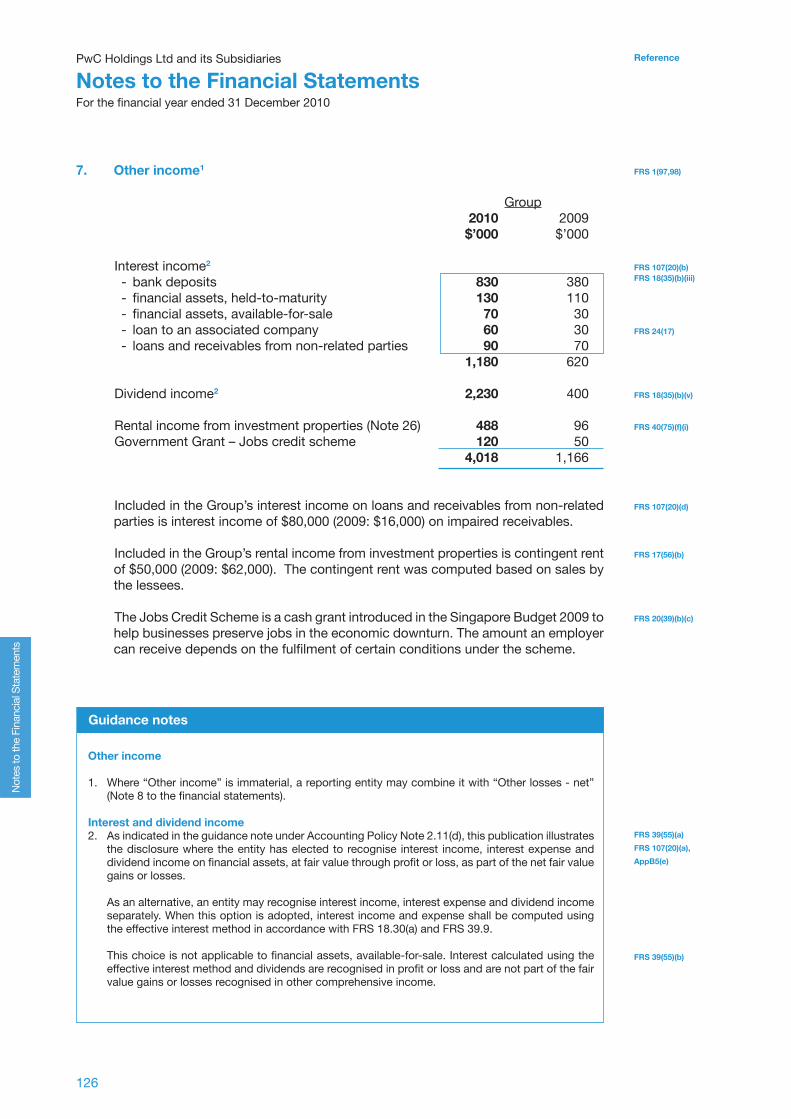
7. Other income1
Group 2010 2009 $’000 $’000 Interest income2 - bank deposits 830 380 - financial assets, held-to-maturity 130 110 - financial assets, available-for-sale 70 30 - loan to an associated company 60 30 - loans and receivables from non-related parties 90 70 1,180 620 Dividend income2 2,230 400 Rental income from investment properties (Note 26) 488 96Government Grant – Jobs credit scheme 120 50 4,018 1,166
Included in the Group’s interest income on loans and receivables from non-related parties is interest income of $80,000 (2009: $16,000) on impaired receivables.
Included in the Group’s rental income from investment properties is contingent rent of $50,000 (2009: $62,000). The contingent rent was computed based on sales by the lessees.
The Jobs Credit Scheme is a cash grant introduced in the Singapore Budget 2009 to help businesses preserve jobs in the economic downturn. The amount an employer can receive depends on the fulfilment of certain conditions under the scheme.
Guidance notes
Other income
1. Where “Other income” is immaterial, a reporting entity may combine it with “Other losses - net” (Note 8 to the financial statements).
Interest and dividend income2. As indicated in the guidance note under Accounting Policy Note 2.11(d), this publication illustrates
the disclosure where the entity has elected to recognise interest income, interest expense and dividend income on financial assets, at fair value through profit or loss, as part of the net fair value gains or losses.
As an alternative, an entity may recognise interest income, interest expense and dividend income separately. When this option is adopted, interest income and expense shall be computed using the effective interest method in accordance with FRS 18.30(a) and FRS 39.9.
This choice is not applicable to financial assets, available-for-sale. Interest calculated using the effective interest method and dividends are recognised in profit or loss and are not part of the fair value gains or losses recognised in other comprehensive income.
FRS 1(97,98)
FRS 107(20)(b)FRS 18(35)(b)(iii)
FRS 24(17)
FRS 18(35)(b)(v)
FRS 40(75)(f)(i)
FRS 107(20)(d)
FRS 17(56)(b)
FRS 20(39)(b)(c)
FRS 39(55)(a)
FRS 107(20)(a),
AppB5(e)
FRS 39(55)(b)

PwC Holdings Ltd and its Subsidiaries
Notes to the Financial StatementsFor the financial year ended 31 December 2010
127Illustrative Annual Report 2010
Reference
Not
es to
the
Fina
ncia
l Sta
tem
ents
8. Other losses – net
Group 2010 2009 $’000 $’000 Fair value gains/(losses) - Financial assets held for trading (891) (1,778) - Financial assets designated as fair value through profit or loss at initial recognition 610 – - Derivatives held for trading 424 226 143 (1,552) Financial assets, available-for-sale - Impairment loss (Note 16) (575) – - Reclassification from other comprenhensive income on disposal (Note 38(b)(iii)) 200 – (375) – Fair value gains/(losses) on fair value hedges - Hedged item: Firm commitments 117 133 - Hedging instrument: Currency forwards (116) (131)Ineffectiveness on cash flow hedges1 (11) (3)Currency translation loss – net2 (210) (116)Gain on disposal of property, plant and equipment 17 8Net fair value (losses)/gains on investment properties (Note 26) (123) 50 Loss on disposal of subsidiary (Note 13) (945) – (1,503) (1,611)
Guidance notes
Other losses – net
Ineffectiveness on hedges 1. Please see Guidance Note on Note 4 to financial statements.
Currency translation differences2. Currency translation differences arising from operating activities should form part of other gains/
losses while those arising from financing activities should form part of finance expenses.
FRS 1(97,98)
FRS 107(20)(a)(i)
FRS 107(20)(a)(i)
FRS 107(20)(a)(i)
FRS 107(20)(a)(i)
FRS 107(20)(a)(ii)
FRS 107(20)(e)
FRS 107(20)(a)(ii)
FRS 107(24)(a)(i)
FRS 107(24)(a)(ii)
FRS 107(24)(b)
FRS 21(52)(a)
FRS 40(76)(d)
FRS 1(97)

128
ReferencePwC Holdings Ltd and its Subsidiaries
Notes to the Financial StatementsFor the financial year ended 31 December 2010
Not
es to
the
Fina
ncia
l Sta
tem
ents
9. Finance expenses
Group 2010 2009 $’000 $’000 Interest expense - bank borrowings (4,922) (5,872) - convertible bonds (Note 32) (2,873) – - dividend on redeemable preference shares (1,950) (1,950) - finance lease liabilities (67) (62) (9,812) (7,884)Amortisation of discount on provision for legal claims (Note 35(c)) (70) (65)Cash flow hedges, reclassified from hedging reserve (Note 38(b)(iv)) 102 304Currency translation gains/(losses) – net 2,578 (1,540)Less: Amount capitalised in investment property and property, plant and equipment (Note 26) 129 125Finance expenses recognised in profit or loss (7,073) (9,060)
Borrowing costs on general financing were capitalised at a rate of 6.2% (2009: 5.6%).
DV
DV
FRS 24(17,18(a))
DV
FRS 107(20)(b)
FRS 37(84)(e)
FRS 107(23)(d)
FRS 21(52)(a)
FRS 23(26)(a)
FRS 23(26)(b)
PwC Holdings Ltd and its Subsidiaries
Notes to the Financial StatementsFor the financial year ended 31 December 2010
129Illustrative Annual Report 2010
Reference
Not
es to
the
Fina
ncia
l Sta
tem
ents
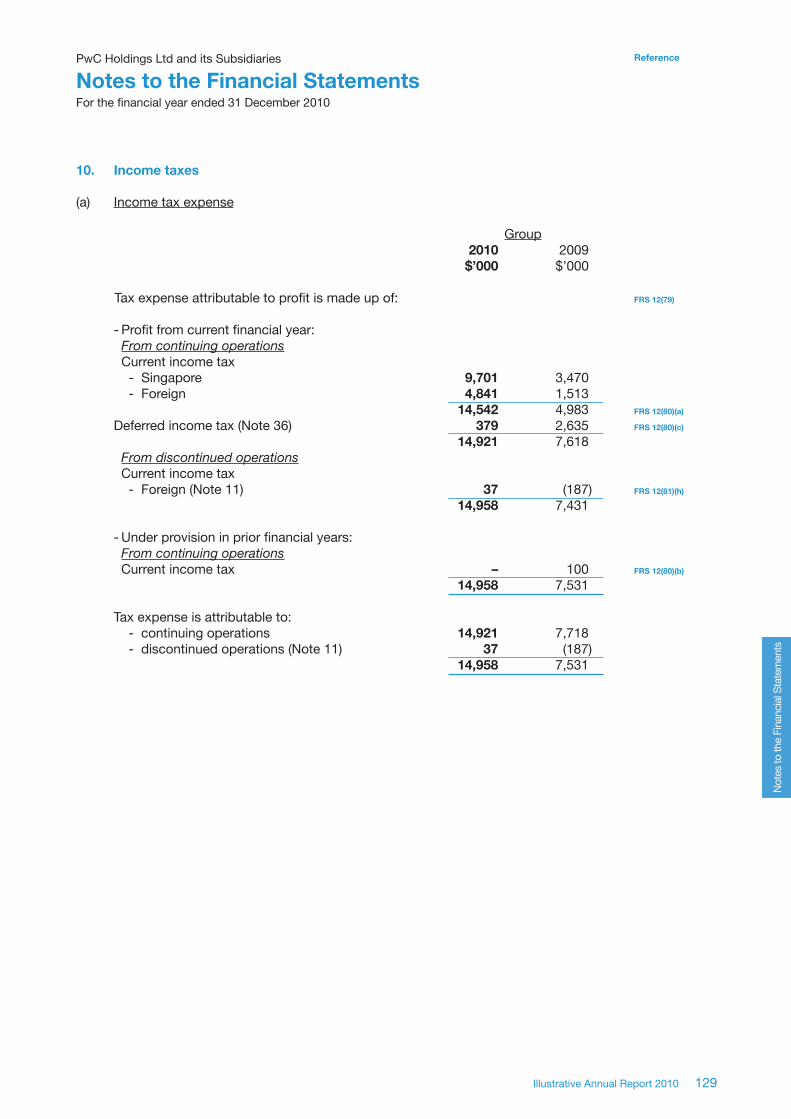
10. Income taxes
(a) Income tax expense
Group 2010 2009 $’000 $’000 Tax expense attributable to profit is made up of: - Profit from current financial year: Fromcontinuingoperations Current income tax - Singapore 9,701 3,470 - Foreign 4,841 1,513 14,542 4,983Deferred income tax (Note 36) 379 2,635 14,921 7,618 Fromdiscontinuedoperations Current income tax - Foreign (Note 11) 37 (187) 14,958 7,431 - Under provision in prior financial years: Fromcontinuingoperations Current income tax – 100 14,958 7,531 Tax expense is attributable to: - continuing operations 14,921 7,718 - discontinued operations (Note 11) 37 (187) 14,958 7,531
FRS 12(79)
FRS 12(80)(a)
FRS 12(80)(c)
FRS 12(81)(h)
FRS 12(80)(b)
130
ReferencePwC Holdings Ltd and its Subsidiaries
Notes to the Financial StatementsFor the financial year ended 31 December 2010
Not
es to
the
Fina
ncia
l Sta
tem
ents
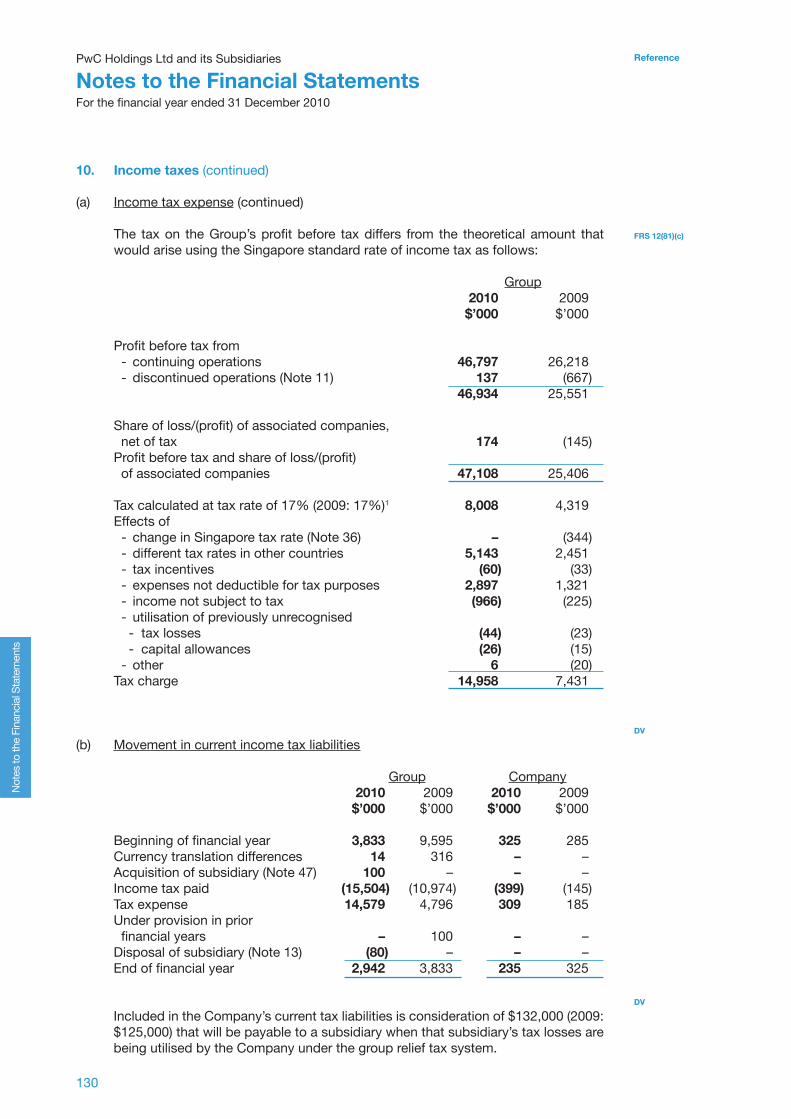
10. Income taxes (continued)
(a) Income tax expense (continued)
The tax on the Group’s profit before tax differs from the theoretical amount that would arise using the Singapore standard rate of income tax as follows:
Group 2010 2009 $’000 $’000 Profit before tax from - continuing operations 46,797 26,218 - discontinued operations (Note 11) 137 (667) 46,934 25,551 Share of loss/(profit) of associated companies, net of tax 174 (145)Profit before tax and share of loss/(profit) of associated companies 47,108 25,406 Tax calculated at tax rate of 17% (2009: 17%)1 8,008 4,319Effects of - change in Singapore tax rate (Note 36) – (344) - different tax rates in other countries 5,143 2,451 - tax incentives (60) (33) - expenses not deductible for tax purposes 2,897 1,321 - income not subject to tax (966) (225) - utilisation of previously unrecognised - tax losses (44) (23) - capital allowances (26) (15) - other 6 (20)Tax charge 14,958 7,431
(b) Movement in current income tax liabilities Group Company 2010 2009 2010 2009 $’000 $’000 $’000 $’000 Beginning of financial year 3,833 9,595 325 285Currency translation differences 14 316 – –Acquisition of subsidiary (Note 47) 100 – – –Income tax paid (15,504) (10,974) (399) (145)Tax expense 14,579 4,796 309 185Under provision in prior financial years – 100 – –Disposal of subsidiary (Note 13) (80) – – –End of financial year 2,942 3,833 235 325 Included in the Company’s current tax liabilities is consideration of $132,000 (2009: $125,000) that will be payable to a subsidiary when that subsidiary’s tax losses are being utilised by the Company under the group relief tax system.
FRS 12(81)(c)
DV
DV

PwC Holdings Ltd and its Subsidiaries
Notes to the Financial StatementsFor the financial year ended 31 December 2010
131Illustrative Annual Report 2010
Reference
Not
es to
the
Fina
ncia
l Sta
tem
ents
10. Income taxes (continued)
(c) The tax (charge) / credit relating to each component of other comprehensive income is as follows: Group 2010 2009 Tax Tax Before (charge) After Before (charge) After Tax /credit Tax Tax /credit Tax $’000 $’000 $’000 $’000 $’000 $’000Fair value gains and reclassification adjustments on financial assets, available-for-sale 510 (92) 418 88 (21) 67 Fair value gains and reclassification adjustments on cash flow hedges 77 (14) 63 20 (7) 13
Currency translation differences arising from consolidation and disposal of subsidiary 1,134 – 1,134 (118) – (118) Revaluation gains on property, plant and equipment 253 (46) 207 1,133 (281) 852
Change in tax rate – – – – 50 50
Share of other comprehensive income of associated companies 27 – 27 – – –
Other comprehensive income 2,001 (152) 1,849 1,123 (259) 864
FRS 12(81)ab
FRS 1(90)
FRS 1(90)
FRS 1(90)
FRS 1(90)
FRS 1(90)
FRS 1(90)

132
ReferencePwC Holdings Ltd and its Subsidiaries
Notes to the Financial StatementsFor the financial year ended 31 December 2010
Not
es to
the
Fina
ncia
l Sta
tem
ents
Guidance notes
Income taxes
Applicable tax rate(s)1. In explaining the relationship between tax expense (or income) and accounting profit, an entity
shall use an applicable tax rate that provides the most meaningful information to the users of its financial statements. This publication illustrates the disclosure where the corporate tax rate in the country in which the Company is domiciled (Singapore) is the most meaningful tax rate.
Another entity operating in several jurisdictions may find it more meaningful to aggregate separate reconciliations prepared using the domestic rates in those jurisdictions. When that approach is issued, the line item “effect of different tax rates in other countries” will no longer be relevant.
2. In the event that changes to tax laws relating to the new tax incentives are not finalised by the reporting date and the effect is expected to be material, the following disclosure can be considered:
“TheGroup’sandCompany’staxliabilitieshavebeencomputedbasedonthecorporatetaxrateandtaxlawsprevailingatbalancesheetdate.On[dateofbudgetannouncement]theSingaporeSecondMinisterforFinanceannouncedchangestotheSingaporetaxlaws,whichincludednewincentivesthatmightbeavailabletocertaingroupentitieswitheffectfromtheyearofassessment2011.TheGroup’sandCompany’staxexpenseforthefinancialyearended[31December2010]havenottakenintoconsiderationtheeffectoftheseincentivesasthefinaldetailedinterpretationoftheincentiveshadnotbeenreleasedbythetaxauthorityasofthedateofauthorisationofthesefinancialstatements.”
FRS 12(81)(a)
FRS 1(90)
FRS 12(85)
FRS 12(81)(d)
10. Income taxes (continued)
(d) Income tax recognised directly in equity is as follows:
Group 2010 2009 $’000 $’000 Equity component of convertible bonds (Note 38(b)(vi)) (421) –Excess tax on employee share option scheme 114 – (307) –

PwC Holdings Ltd and its Subsidiaries
Notes to the Financial StatementsFor the financial year ended 31 December 2010
133Illustrative Annual Report 2010
Reference
Not
es to
the
Fina
ncia
l Sta
tem
ents
11. Discontinued operations and Disposal Group classified as held for sale
Following the approval of the Group’s management and shareholders on 31 May 2010 to sell 50% out of its 70% interest in PwC Glass Sdn Bhd in Malaysia (comprising of the Group’s glass business segment), the entire assets and liabilities related to PwC Glass Sdn Bhd are classified as a disposal group held for sale on the balance sheet, and the entire results from PwC Glass Sdn Bhd are presented separately on the statement of comprehensive income as “Discontinued operations”. The transaction is expected to be completed by April 2011.
(a) The results of the discontinued operations and the re-measurement of the disposal group are as follows:
Group 2010 20091
$’000 $’000
Revenue 1,200 4,600Expenses (1,003) (5,267)Profit/(loss) before tax from discontinued operations 197 (667)Tax (53) 187Profit/(loss) after tax from discontinued operations 144 (480) Pre-tax loss recognised on the measurement to fair value less cost to sell on disposal group (60) –Tax 16 –After tax loss recognised on the measurement to fair value less cost to sell on disposal group (44) – Total profit/(loss) from discontinued operations 100 (480)
Profit attributable to equity holders of the Company relates to: - Profit from continuing operations 29,358 17,432 - Profit/(loss) from discontinued operations 70 (336)Total 29,428 17,096
(b) The impact of the discontinued operations on the cash flows of the Group is as follows: Group 2009 2008 $’000 $’000
Operating cash inflows2 300 790Investing cash outflows2 (103) (20)Financing cash outflows2 (295) (66)Total cash (outflows)/inflows (98) 704
FRS 105(41)(a,b,d)
FRS 105(33)(b)
FRS 12(81)(h)(ii)
FRS 12(81)(h)(ii)
FRS 105(33)(d)
FRS 105(33)(c)

134
ReferencePwC Holdings Ltd and its Subsidiaries
Notes to the Financial StatementsFor the financial year ended 31 December 2010
Not
es to
the
Fina
ncia
l Sta
tem
ents
11. Discontinued operations and Disposal Group classified as held for sale (continued)
Group 2010
$’000 (c) Details of the assets in disposal group classified as held-for-sale are as follows: Property, plant and equipment (Note 28) 1,563 Intangible assets (Note 29(b)) 100 Inventory 1,670 3,333 (d) Details of the liabilities directly associated with disposal group classified as held-for-sale are as follows: Trade and other payables 104 Other current liabilities 20 Provisions (Note 35(a)) 96 220
Group 2010 2009 $’000 $’000
(e) Cumulative income / (expense) recognised in other comprehensive income relating to disposal group classified as held for sale
- Currency translation differences 200 (100)
(f) Total comprehensive income attributable to the equity holders of the Company relates to: - Continuing operations 30,440 18,203 - Discontinued operations 280 (356) Total 30,720 17,847
FRS 105(38)
FRS 105(38)
FRS 105(38)
FRS 105 (33)(d)
FRS 105(34)
FRS 105(33)(c)
FRS 105(34)
Guidance notes
Discontinued operations
1. An entity shall re-present the prior period’s results for the discontinued operations.
2. The net cash flows attributable to operating, investing and financing activities of discontinued operations (including comparatives) shall be disclosed either in the notes or on the face of the cash flow statement. This publication illustrates the disclosure when the entity elects to disclose in the notes to the financial statements.
If the entity elects to present net cash flows on the face of the cash flow statement, the relevant net cash flows should be presented under operating, investing and financing activities respectively. It is not appropriate to combine and present the net cash flows from three activities as one line item under operating, investing or financing activities.
PwC Holdings Ltd and its Subsidiaries
Notes to the Financial StatementsFor the financial year ended 31 December 2010
135Illustrative Annual Report 2010
Reference
Not
es to
the
Fina
ncia
l Sta
tem
ents
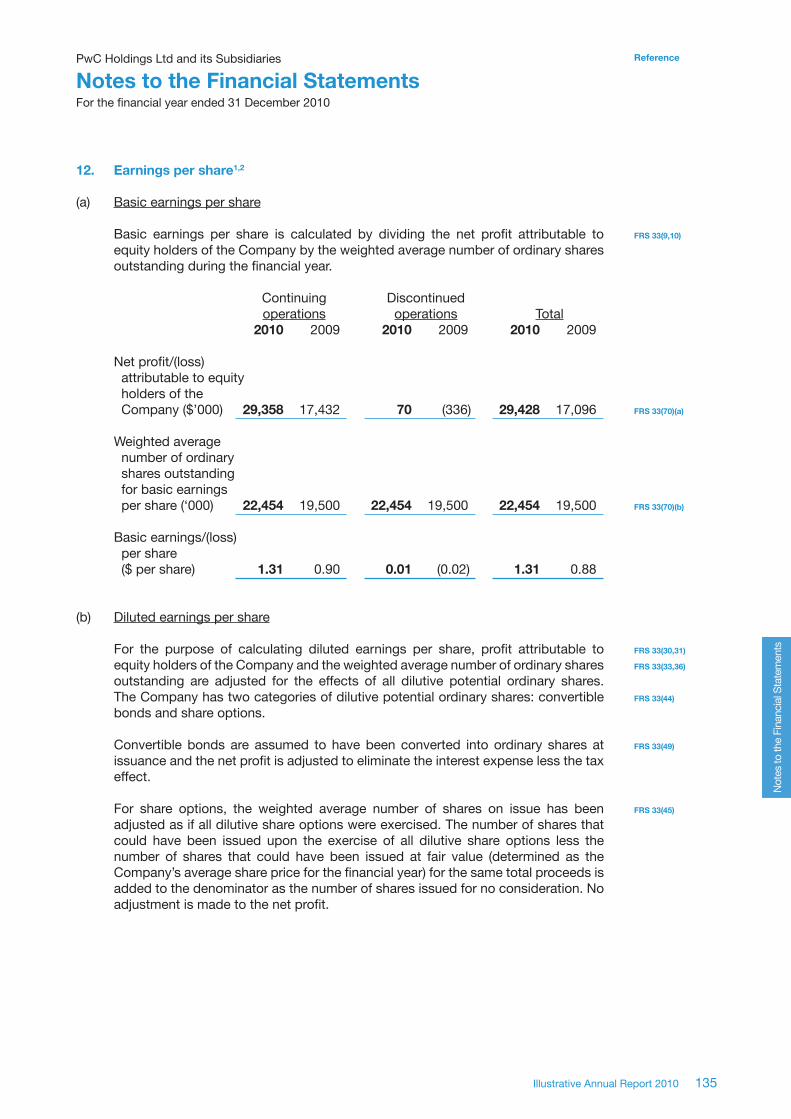
12. Earnings per share1,2
(a) Basic earnings per share
Basic earnings per share is calculated by dividing the net profit attributable to equity holders of the Company by the weighted average number of ordinary shares outstanding during the financial year. Continuing Discontinued operations operations Total 2010 2009 2010 2009 2010 2009 Net profit/(loss) attributable to equity holders of the Company ($’000) 29,358 17,432 70 (336) 29,428 17,096 Weighted average number of ordinary shares outstanding for basic earnings per share (‘000) 22,454 19,500 22,454 19,500 22,454 19,500 Basic earnings/(loss) per share ($ per share) 1.31 0.90 0.01 (0.02) 1.31 0.88
(b) Diluted earnings per share
For the purpose of calculating diluted earnings per share, profit attributable to equity holders of the Company and the weighted average number of ordinary shares outstanding are adjusted for the effects of all dilutive potential ordinary shares. The Company has two categories of dilutive potential ordinary shares: convertible bonds and share options.
Convertible bonds are assumed to have been converted into ordinary shares at issuance and the net profit is adjusted to eliminate the interest expense less the tax effect.
For share options, the weighted average number of shares on issue has been adjusted as if all dilutive share options were exercised. The number of shares that could have been issued upon the exercise of all dilutive share options less the number of shares that could have been issued at fair value (determined as the Company’s average share price for the financial year) for the same total proceeds is added to the denominator as the number of shares issued for no consideration. No adjustment is made to the net profit.
FRS 33(9,10)
FRS 33(70)(a)
FRS 33(70)(b)
FRS 33(30,31)
FRS 33(33,36)
FRS 33(44)
FRS 33(49)
FRS 33(45)

136
ReferencePwC Holdings Ltd and its Subsidiaries
Notes to the Financial StatementsFor the financial year ended 31 December 2010
Not
es to
the
Fina
ncia
l Sta
tem
ents
12. Earnings per share (continued)
(b) Diluted earnings per share (continued)
Diluted earnings per share for continuing operations and discontinued operations attributable to equity holders of the Company is calculated as follows: Continuing Discontinued operations operations Total 2010 2009 2010 2009 2010 2009 Net profit/(loss) attributable to equity holders of the Company ($’000) 29,358 17,432 70 (336) 29,428 17,096
Interest expense on convertible bonds, net of tax ($’000) 2,528 – – – 2,528 –
Net profit/(loss) used to determine diluted earnings per share ($’000) 31,886 17,432 70 (336) 31,956 17,096 Weighted average number of ordinary shares outstanding for basic earnings per share (‘000) 22,454 19,500 22,454 19,500 22,454 19,500
Adjustments for (‘000) - Convertible bonds 3,300 – 3,300 – 3,300 – - Share options 1,858 600 1,858 600 1,858 600 27,612 20,100 27,612 20,100 27,612 20,100 Diluted earnings/(loss) per share ($ per share) 1.15 0.87 * (0.02) 1.16 0.85
*Lessthan$0.01
FRS 33(70)(a)
FRS 33(70)(a)
FRS 33(70)(b)
FRS 33(70)(b)
FRS 33(64)
FRS 33(73)
Guidance notes
Earnings per share (“EPS”)
1. If the number of ordinary or potential ordinary shares increases as a result of a capitalisation, bonus issue or share split, or decreases as a result of a reverse share split before the financial statements are authorised for issue, the basic and diluted EPS for all periods presented shall be adjusted retrospectively, even when this occurs after the balance sheet date.
2. If the reporting entity discloses, in addition to basic and diluted EPS, per share amounts using another measure of net profit, such amounts shall be calculated using the weighted average number of ordinary shares determined based on FRS 33. The basic and diluted per share amount shall be disclosed in the notes to the financial statements. A reconciliation shall be provided between the measure used and a line item reported in the statement of comprehensive income.
PwC Holdings Ltd and its Subsidiaries
Notes to the Financial StatementsFor the financial year ended 31 December 2010
137Illustrative Annual Report 2010
Reference
Not
es to
the
Fina
ncia
l Sta
tem
ents
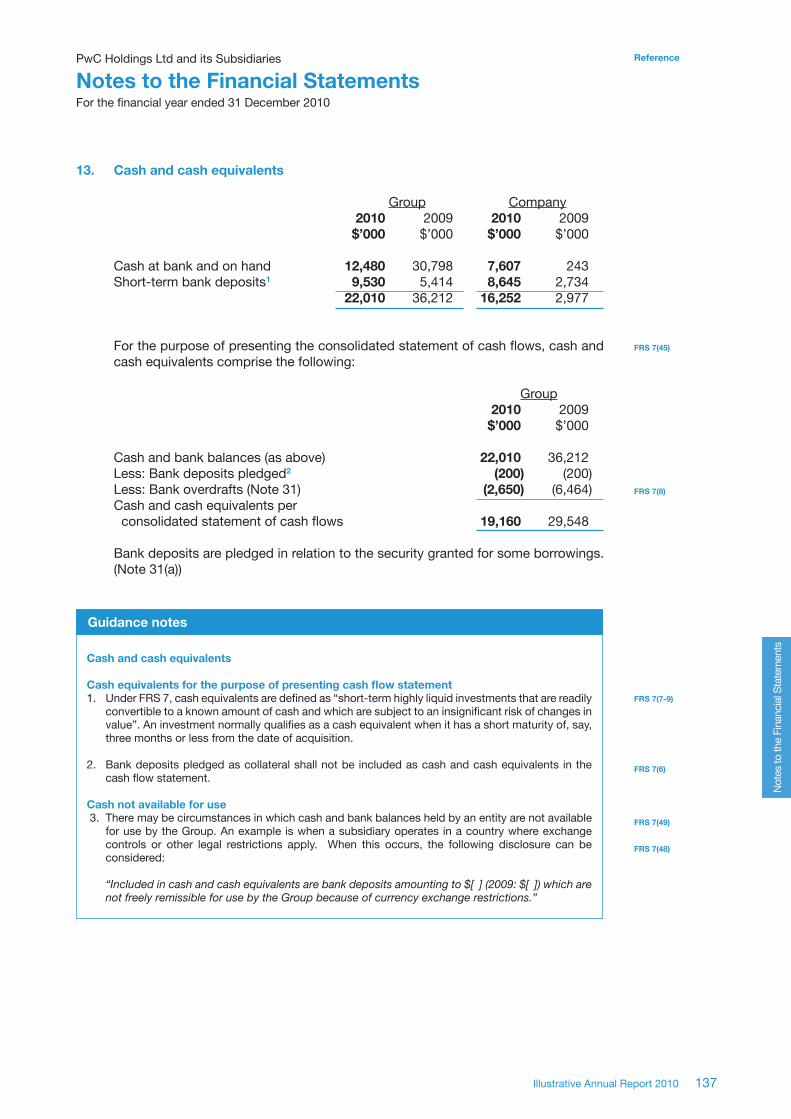
13. Cash and cash equivalents Group Company 2010 2009 2010 2009 $’000 $’000 $’000 $’000 Cash at bank and on hand 12,480 30,798 7,607 243Short-term bank deposits1 9,530 5,414 8,645 2,734 22,010 36,212 16,252 2,977 For the purpose of presenting the consolidated statement of cash flows, cash and cash equivalents comprise the following:
Group 2010 2009 $’000 $’000 Cash and bank balances (as above) 22,010 36,212Less: Bank deposits pledged2 (200) (200)Less: Bank overdrafts (Note 31) (2,650) (6,464)Cash and cash equivalents per consolidated statement of cash flows 19,160 29,548
Bank deposits are pledged in relation to the security granted for some borrowings. (Note 31(a))
FRS 7(45)
FRS 7(8)
FRS 7(7-9)
FRS 7(6)
FRS 7(49)
FRS 7(48)
Guidance notes
Cash and cash equivalents
Cash equivalents for the purpose of presenting cash flow statement1. Under FRS 7, cash equivalents are defined as “short-term highly liquid investments that are readily
convertible to a known amount of cash and which are subject to an insignificant risk of changes in value”. An investment normally qualifies as a cash equivalent when it has a short maturity of, say, three months or less from the date of acquisition.
2. Bank deposits pledged as collateral shall not be included as cash and cash equivalents in the cash flow statement.
Cash not available for use 3. There may be circumstances in which cash and bank balances held by an entity are not available
for use by the Group. An example is when a subsidiary operates in a country where exchange controls or other legal restrictions apply. When this occurs, the following disclosure can be considered:
“Includedincashandcashequivalentsarebankdepositsamountingto$[](2009:$[])whicharenotfreelyremissibleforusebytheGroupbecauseofcurrencyexchangerestrictions.”
138
ReferencePwC Holdings Ltd and its Subsidiaries
Notes to the Financial StatementsFor the financial year ended 31 December 2010
Not
es to
the
Fina
ncia
l Sta
tem
ents
13. Cash and cash equivalents (continued)
Acquisition and disposal of subsidiaries
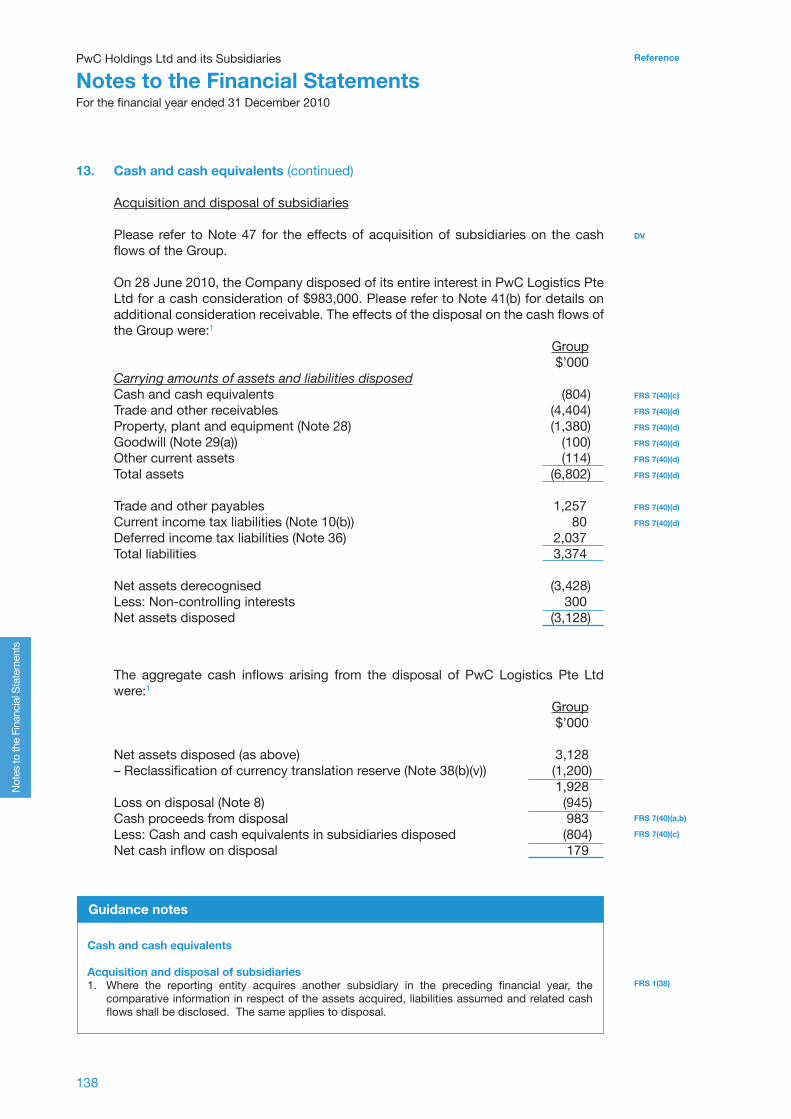
Please refer to Note 47 for the effects of acquisition of subsidiaries on the cash flows of the Group.
On 28 June 2010, the Company disposed of its entire interest in PwC Logistics Pte Ltd for a cash consideration of $983,000. Please refer to Note 41(b) for details on additional consideration receivable. The effects of the disposal on the cash flows of the Group were:1
Group $’000Carryingamountsofassetsandliabilitiesdisposed Cash and cash equivalents (804)Trade and other receivables (4,404)Property, plant and equipment (Note 28) (1,380)Goodwill (Note 29(a)) (100)Other current assets (114)Total assets (6,802)
Trade and other payables 1,257Current income tax liabilities (Note 10(b)) 80Deferred income tax liabilities (Note 36) 2,037 Total liabilities 3,374
Net assets derecognised (3,428)Less: Non-controlling interests 300Net assets disposed (3,128)
DV
FRS 7(40)(c)
FRS 7(40)(d)
FRS 7(40)(d)
FRS 7(40)(d)
FRS 7(40)(d)
FRS 7(40)(d)
FRS 7(40)(d)
FRS 7(40)(d)
The aggregate cash inflows arising from the disposal of PwC Logistics Pte Ltd were:1
Group $’000 Net assets disposed (as above) 3,128– Reclassification of currency translation reserve (Note 38(b)(v)) (1,200) 1,928Loss on disposal (Note 8) (945)Cash proceeds from disposal 983Less: Cash and cash equivalents in subsidiaries disposed (804)Net cash inflow on disposal 179
FRS 7(40)(a,b)
FRS 7(40)(c)
FRS 1(38)
Guidance notes
Cash and cash equivalents
Acquisition and disposal of subsidiaries1. Where the reporting entity acquires another subsidiary in the preceding financial year, the
comparative information in respect of the assets acquired, liabilities assumed and related cash flows shall be disclosed. The same applies to disposal.
PwC Holdings Ltd and its Subsidiaries
Notes to the Financial StatementsFor the financial year ended 31 December 2010
139Illustrative Annual Report 2010
Reference
Not
es to
the
Fina
ncia
l Sta
tem
ents
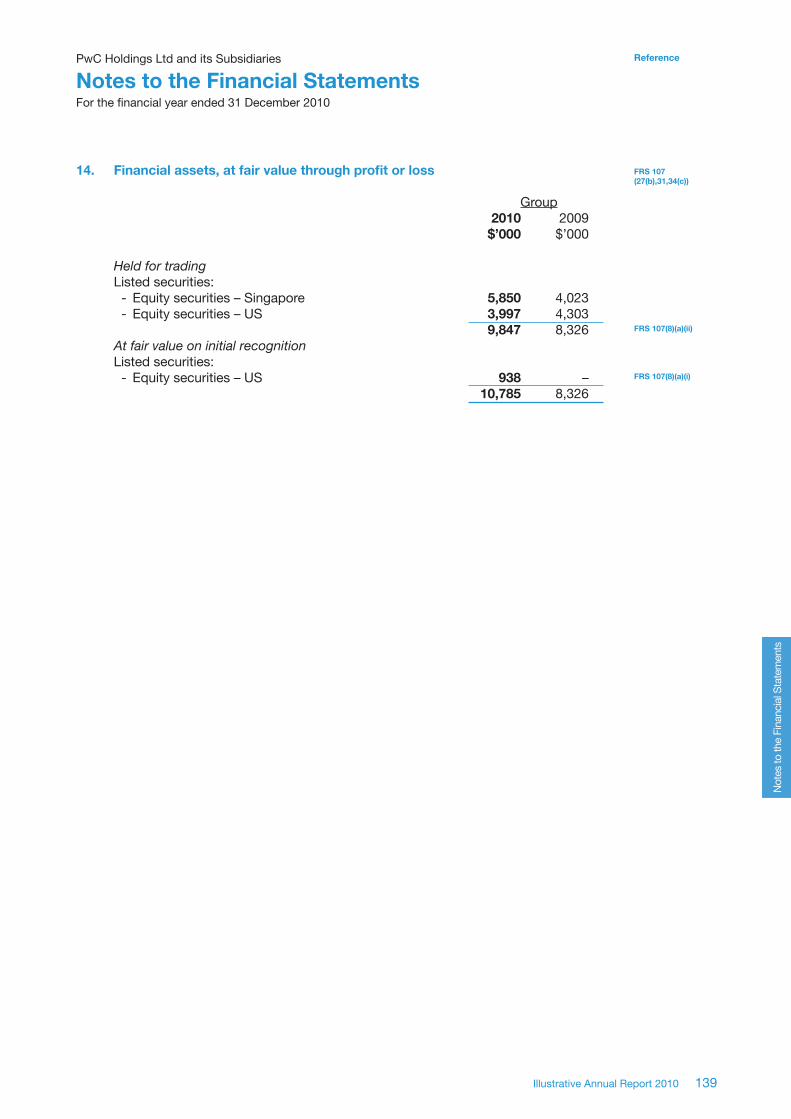
14. Financial assets, at fair value through profit or loss
Group 2010 2009 $’000 $’000 Heldfortrading Listed securities: - Equity securities – Singapore 5,850 4,023 - Equity securities – US 3,997 4,303 9,847 8,326Atfairvalueoninitialrecognition Listed securities: - Equity securities – US 938 – 10,785 8,326
FRS 107 (27(b),31,34(c))
FRS 107(8)(a)(ii)
FRS 107(8)(a)(i)
140
ReferencePwC Holdings Ltd and its Subsidiaries
Notes to the Financial StatementsFor the financial year ended 31 December 2010
Not
es to
the
Fina
ncia
l Sta
tem
ents
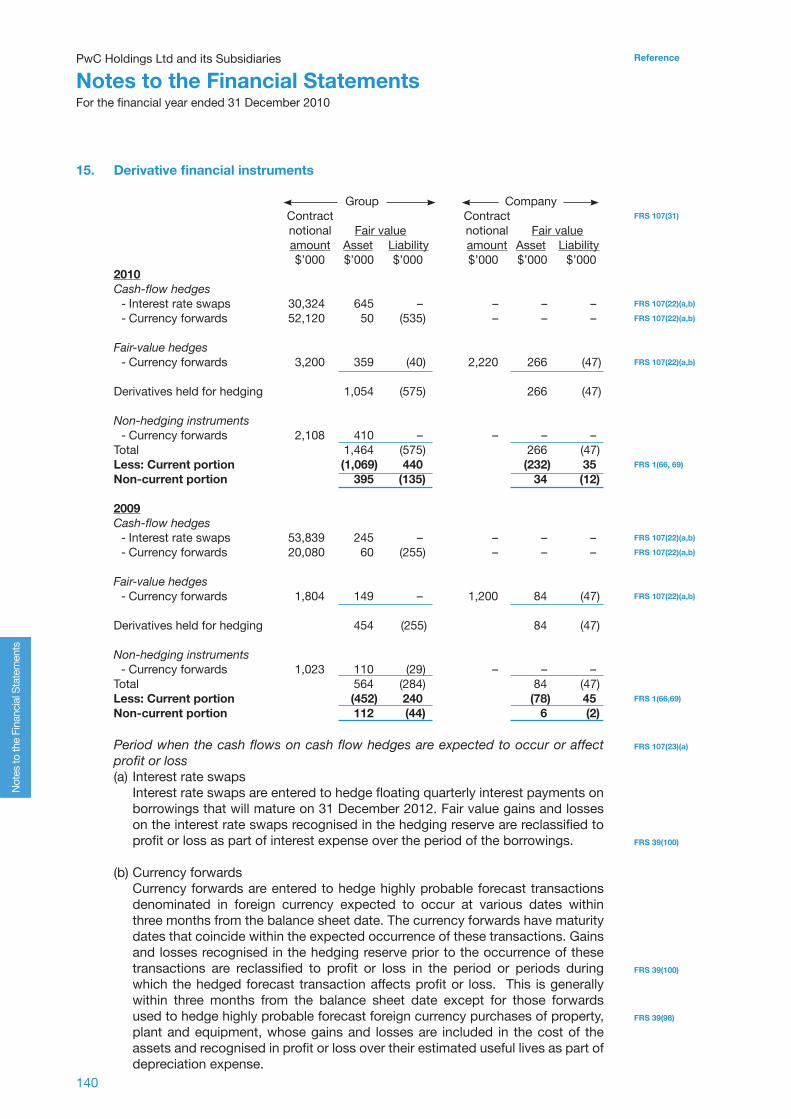
15. Derivative financial instruments Group Company Contract Contract notional Fair value notional Fair value amount Asset Liability amount Asset Liability $’000 $’000 $’000 $’000 $’000 $’0002010 Cash-flowhedges - Interest rate swaps 30,324 645 – – – – - Currency forwards 52,120 50 (535) – – – Fair-valuehedges - Currency forwards 3,200 359 (40) 2,220 266 (47) Derivatives held for hedging 1,054 (575) 266 (47)
Non-hedging instruments - Currency forwards 2,108 410 – – – –Total 1,464 (575) 266 (47)Less: Current portion (1,069) 440 (232) 35Non-current portion 395 (135) 34 (12) 2009 Cash-flowhedges - Interest rate swaps 53,839 245 – – – – - Currency forwards 20,080 60 (255) – – – Fair-valuehedges - Currency forwards 1,804 149 – 1,200 84 (47) Derivatives held for hedging 454 (255) 84 (47)
Non-hedging instruments - Currency forwards 1,023 110 (29) – – –Total 564 (284) 84 (47)Less: Current portion (452) 240 (78) 45Non-current portion 112 (44) 6 (2)
Periodwhenthecashflowsoncashflowhedgesareexpectedtooccuroraffectprofitorloss(a) Interest rate swaps Interest rate swaps are entered to hedge floating quarterly interest payments on
borrowings that will mature on 31 December 2012. Fair value gains and losses on the interest rate swaps recognised in the hedging reserve are reclassified to profit or loss as part of interest expense over the period of the borrowings.
(b) Currency forwards Currency forwards are entered to hedge highly probable forecast transactions
denominated in foreign currency expected to occur at various dates within three months from the balance sheet date. The currency forwards have maturity dates that coincide within the expected occurrence of these transactions. Gains and losses recognised in the hedging reserve prior to the occurrence of these transactions are reclassified to profit or loss in the period or periods during which the hedged forecast transaction affects profit or loss. This is generally within three months from the balance sheet date except for those forwards used to hedge highly probable forecast foreign currency purchases of property, plant and equipment, whose gains and losses are included in the cost of the assets and recognised in profit or loss over their estimated useful lives as part of depreciation expense.
FRS 107(31)
FRS 107(22)(a,b)
FRS 107(22)(a,b)
FRS 107(22)(a,b)
FRS 1(66, 69)
FRS 107(22)(a,b)
FRS 107(22)(a,b)
FRS 107(22)(a,b)
FRS 1(66,69)
FRS 107(23)(a)
FRS 39(100)
FRS 39(100)
FRS 39(98)
PwC Holdings Ltd and its Subsidiaries
Notes to the Financial StatementsFor the financial year ended 31 December 2010
141Illustrative Annual Report 2010
Reference
Not
es to
the
Fina
ncia
l Sta
tem
ents
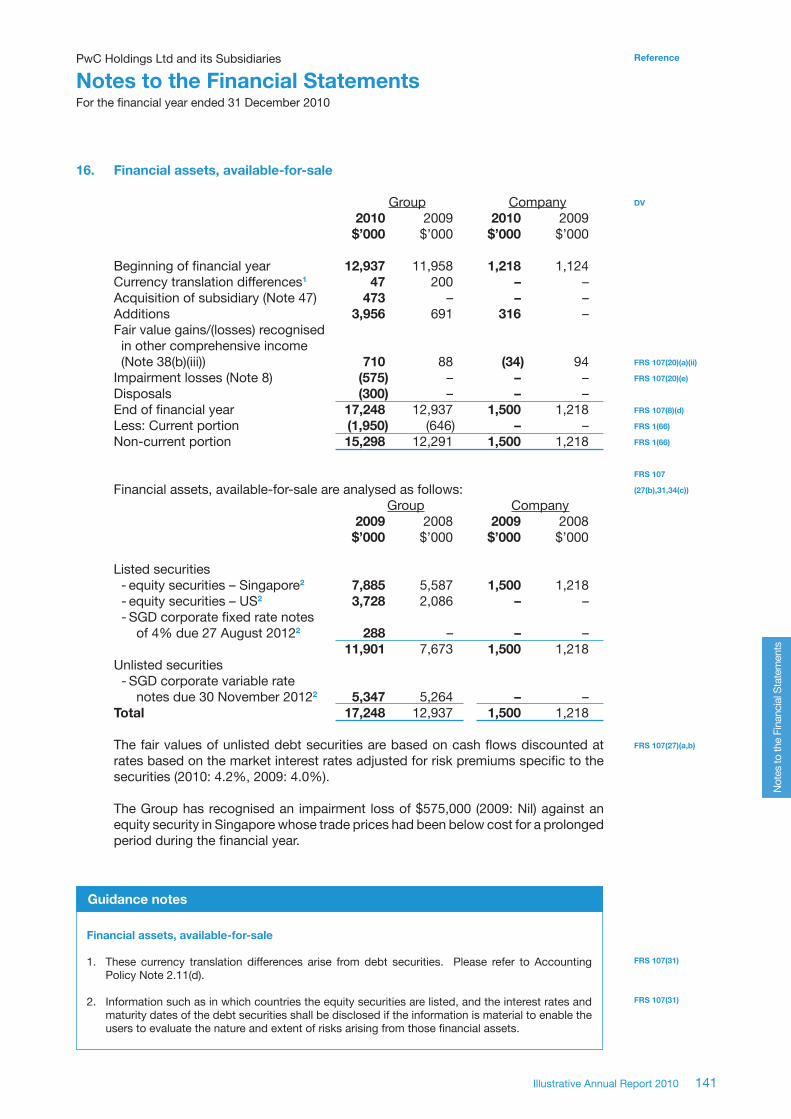
16. Financial assets, available-for-sale Group Company 2010 2009 2010 2009 $’000 $’000 $’000 $’000 Beginning of financial year 12,937 11,958 1,218 1,124Currency translation differences1 47 200 – –Acquisition of subsidiary (Note 47) 473 – – –Additions 3,956 691 316 –Fair value gains/(losses) recognised in other comprehensive income (Note 38(b)(iii)) 710 88 (34) 94Impairment losses (Note 8) (575) – – –Disposals (300) – – –End of financial year 17,248 12,937 1,500 1,218Less: Current portion (1,950) (646) – –Non-current portion 15,298 12,291 1,500 1,218 Financial assets, available-for-sale are analysed as follows: Group Company 2009 2008 2009 2008 $’000 $’000 $’000 $’000 Listed securities - equity securities – Singapore2 7,885 5,587 1,500 1,218 - equity securities – US2 3,728 2,086 – – - SGD corporate fixed rate notes of 4% due 27 August 20122 288 – – – 11,901 7,673 1,500 1,218Unlisted securities - SGD corporate variable rate notes due 30 November 20122 5,347 5,264 – –Total 17,248 12,937 1,500 1,218 The fair values of unlisted debt securities are based on cash flows discounted at rates based on the market interest rates adjusted for risk premiums specific to the securities (2010: 4.2%, 2009: 4.0%).
The Group has recognised an impairment loss of $575,000 (2009: Nil) against an equity security in Singapore whose trade prices had been below cost for a prolonged period during the financial year.
DV
FRS 107(20)(a)(ii)
FRS 107(20)(e)
FRS 107(8)(d)
FRS 1(66)
FRS 1(66)
FRS 107
(27(b),31,34(c))
FRS 107(27)(a,b)
FRS 107(31)
FRS 107(31)
Guidance notes
Financial assets, available-for-sale
1. These currency translation differences arise from debt securities. Please refer to Accounting Policy Note 2.11(d).
2. Information such as in which countries the equity securities are listed, and the interest rates and maturity dates of the debt securities shall be disclosed if the information is material to enable the users to evaluate the nature and extent of risks arising from those financial assets.

142
ReferencePwC Holdings Ltd and its Subsidiaries
Notes to the Financial StatementsFor the financial year ended 31 December 2010
Not
es to
the
Fina
ncia
l Sta
tem
ents
17. Trade and other receivables – current Group Company 2010 2009 2010 2009 $’000 $’000 $’000 $’000 Finance lease receivables (Note 21) 156 218 – – Trade receivables - Associated companies 188 217 – – - Subsidiaries – – 1,200 600 - Non-related parties 17,240 14,779 6,412 1,531 17,428 14,996 7,612 2,131Less: Allowance for impairment of receivables – non-related parties (509) (470) (100) (50)Trade receivables – net 16,919 14,526 7,512 2,081 Construction contracts - Due from customers (Note 19) 1,384 1,188 – – - Retentions (Note 19) 60 40 – – 1,444 1,228 – – Loan to an associated company 2,668 1,276 – –Less: Non-current portion (Note 20) (2,322) (1,240) – – 346 36 – – Staff loans (Note 22) 60 25 30 20Deposits 345 221 – –Prepayments 200 105 50 50Other receivables 40 40 20 15 19,510 16,399 7,612 2,166 Certain subsidiaries of the Group have factored trade receivables with carrying amounts of $1,260,000 (2009: $1,340,000) to a bank in exchange for cash during the financial year ended 31 December 2010. The transaction has been accounted for as a collateralised borrowing as the bank has full recourse to those subsidiaries in the event of default by the debtors (Note 31(a)).
The loan to an associated company, PwC A Property (Hong Kong) Limited, is unsecured and repayable in full by 1 January 2012. Interest is fixed at 2.2% per annum.
FRS 1(77,78(b))
FRS 17(47)(a)
FRS 24(17(b),22)
FRS 24(18)(d)
FRS 24(18)(c)
FRS 1(78)(b)
FRS 11(42)(a)
FRS 11(40)(c)
FRS 24(17(b),18(d))
FRS 107 (14)
FRS 24(17)(b)
FRS 107(31)

PwC Holdings Ltd and its Subsidiaries
Notes to the Financial StatementsFor the financial year ended 31 December 2010
143Illustrative Annual Report 2010
Reference
Not
es to
the
Fina
ncia
l Sta
tem
ents
18. Inventories Group Company 2010 2009 2010 2009 $’000 $’000 $’000 $’000 Raw materials 7,622 7,612 – –Work-in-progress 1,810 1,796 – –Finished/trading goods 14,826 7,686 2,200 335 24,258 17,094 2,200 335
The cost of inventories recognised as an expense and included in “cost of sales” amounts to $37,842,000 (2009: $20,738,000).
Inventories of $1,200,000 (2009: $1,000,000) of the Group and $600,000 (2009: $300,000) of the Company have been pledged as security for bank overdrafts of the Group and the Company (Note 31(a)).
The Group has recognised a reversal of $200,000 (2009: Nil), being part of an inventory write-down made in 2009, as the inventories were sold above the carrying amounts in 2010.
FRS 1(78)(c)
FRS 2(36)(b)
FRS 2(37)
FRS 2(37)
FRS 2(37)
FRS 2(36)(d), (38)
FRS 2(36)(h)
FRS 2(36)(f,g)
19. Construction contracts Group 2010 2009 $’000 $’000 Constructioncontractwork-in-progress: Beginning of financial year 147 347Contract costs incurred 13,847 8,991Contract expenses recognised in profit or loss (13,732) (9,191)End of financial year 262 147 Aggregate costs incurred and profits recognised (less losses recognised) to date on uncompleted construction contracts 32,067 23,325Less: Progress billings (30,763) (22,197) 1,304 1,128Presented as: Due from customers on construction contracts1 (Note 17) 1,384 1,188Due to customers on construction contracts1 (Note 30) (80) (60) 1,304 1,128 Advances received on construction contracts (Note 30) 541 262 Retentions on construction contracts (Note 17) 60 40
DV
DV
DV
FRS 11(40)(a)
FRS 11(42)(a)
FRS 11(42)(b)
FRS 11(40)(b)
FRS 11(40)(c)
144
ReferencePwC Holdings Ltd and its Subsidiaries
Notes to the Financial StatementsFor the financial year ended 31 December 2010
Not
es to
the
Fina
ncia
l Sta
tem
ents
FRS 11(42)
FRS 21(23)(a)
Guidance notes
Construction contracts
1. The determination of amounts due to and from customers on construction contracts shall be made on a contract-by-contract basis. These balances shall not be set off against each other. These balances are monetary items in nature and will need to be translated at closing rates at the balance sheet date if they are denominated in foreign currencies.
20. Trade and other receivables – non-current Group Company 2010 2009 2010 2009 $’000 $’000 $’000 $’000
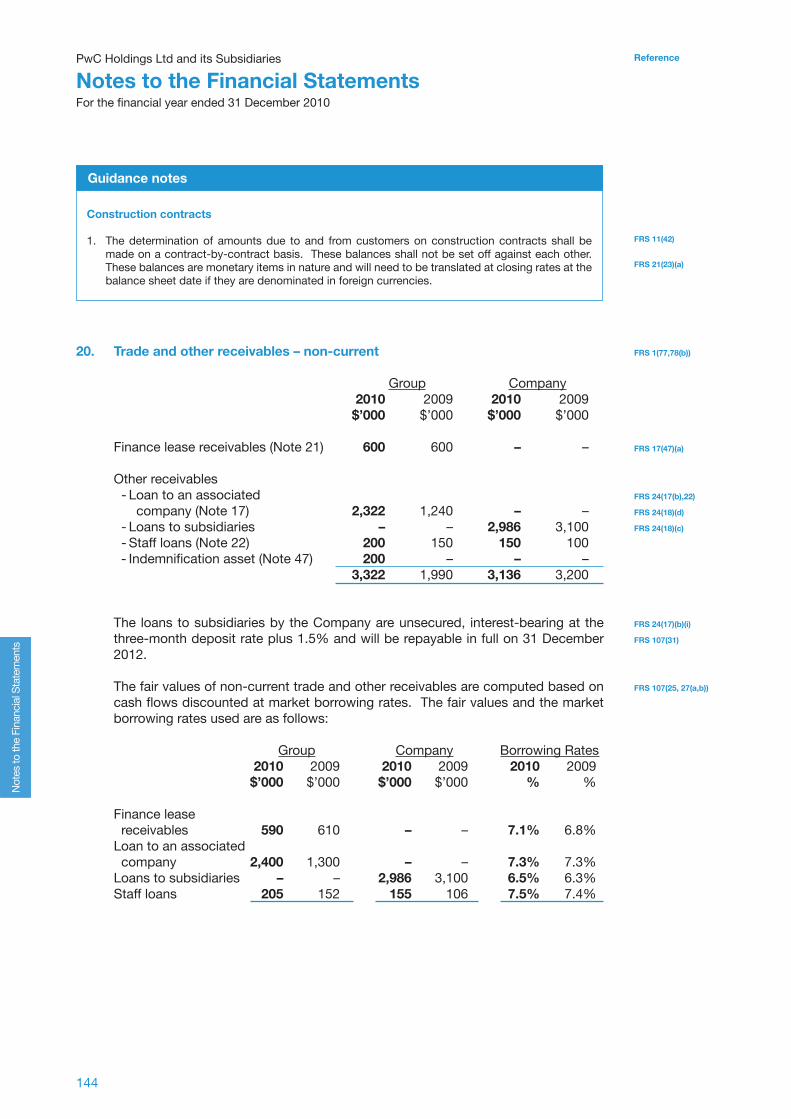
Finance lease receivables (Note 21) 600 600 – – Other receivables - Loan to an associated company (Note 17) 2,322 1,240 – – - Loans to subsidiaries – – 2,986 3,100 - Staff loans (Note 22) 200 150 150 100 - Indemnification asset (Note 47) 200 – – – 3,322 1,990 3,136 3,200
The loans to subsidiaries by the Company are unsecured, interest-bearing at the three-month deposit rate plus 1.5% and will be repayable in full on 31 December 2012.
The fair values of non-current trade and other receivables are computed based on cash flows discounted at market borrowing rates. The fair values and the market borrowing rates used are as follows: Group Company Borrowing Rates 2010 2009 2010 2009 2010 2009 $’000 $’000 $’000 $’000 % % Finance lease receivables 590 610 – – 7.1% 6.8%Loan to an associated company 2,400 1,300 – – 7.3% 7.3%Loans to subsidiaries – – 2,986 3,100 6.5% 6.3%Staff loans 205 152 155 106 7.5% 7.4%
FRS 1(77,78(b))
FRS 17(47)(a)
FRS 24(17(b),22)
FRS 24(18)(d)
FRS 24(18)(c)
FRS 24(17)(b)(i)
FRS 107(31)
FRS 107(25, 27(a,b))
PwC Holdings Ltd and its Subsidiaries
Notes to the Financial StatementsFor the financial year ended 31 December 2010
145Illustrative Annual Report 2010
Reference
Not
es to
the
Fina
ncia
l Sta
tem
ents
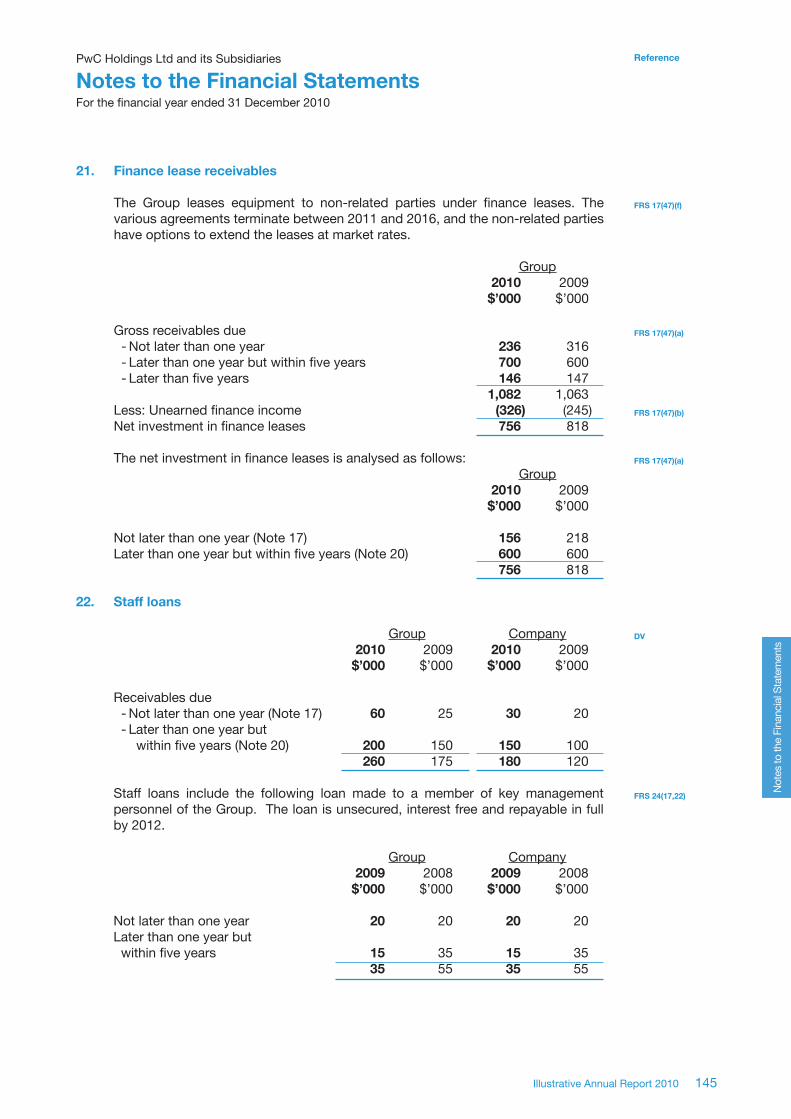
21. Finance lease receivables
The Group leases equipment to non-related parties under finance leases. The various agreements terminate between 2011 and 2016, and the non-related parties have options to extend the leases at market rates. Group 2010 2009 $’000 $’000 Gross receivables due - Not later than one year 236 316 - Later than one year but within five years 700 600 - Later than five years 146 147 1,082 1,063Less: Unearned finance income (326) (245)Net investment in finance leases 756 818 The net investment in finance leases is analysed as follows: Group 2010 2009 $’000 $’000 Not later than one year (Note 17) 156 218Later than one year but within five years (Note 20) 600 600 756 818
22. Staff loans Group Company 2010 2009 2010 2009 $’000 $’000 $’000 $’000
Receivables due - Not later than one year (Note 17) 60 25 30 20 - Later than one year but within five years (Note 20) 200 150 150 100 260 175 180 120 Staff loans include the following loan made to a member of key management personnel of the Group. The loan is unsecured, interest free and repayable in full by 2012. Group Company 2009 2008 2009 2008 $’000 $’000 $’000 $’000 Not later than one year 20 20 20 20Later than one year but within five years 15 35 15 35 35 55 35 55
FRS 17(47)(f)
FRS 17(47)(a)
FRS 17(47)(b)
FRS 17(47)(a)
DV
FRS 24(17,22)

146
ReferencePwC Holdings Ltd and its Subsidiaries
Notes to the Financial StatementsFor the financial year ended 31 December 2010
Not
es to
the
Fina
ncia
l Sta
tem
ents
23. Investments in associated companies Group Company 2010 2009 2010 2009 $’000 $’000 $’000 $’000
Equity investment at cost 1,000 1,000 Beginning of financial year 8,569 8,133 Currency translation differences (603) 291 Acquisition of subsidiary (Note 47) 389 – Share of (losses)/profits1 (174) 145 Share of movement in fair value reserve (Note 38(b)(iii)) 27 – End of financial year 8,208 8,569 The summarised financial information of associated companies, not adjusted for the proportion ownership interest held by the Group, is as follows2,3 - Assets 59,774 36,918 - Liabilities 46,401 23,674 - Revenue 65,865 45,013 - Net (loss)/profit (500) 800
Share of associated companies’ contingent liabilities incurred jointly with other investors 106 240
Contingent liabilities relating to liabilities of associates for which the Company is severally liable 60 100
Goodwill amounting to $1,020,000 (2009: $1,020,000) is included in the carrying amount of investments in associated companies.
The Group has not recognised its share of losses of an associated company amounting to $15,000 (2009: $5,000) because the Group’s cumulative share of losses exceeds its interest in that entity4 and the Group has no obligation in respect of those losses. The cumulative unrecognised losses amount to $27,000 (2009: $12,000) at the balance sheet date.
The Group has not recognised its share of profits for the financial year of another associated company amounting to $13,000 (2009: $20,000) because the Group’s cumulative share of unrecognised losses with respect to that entity amounts to $25,000 (2009: $38,000) at the balance sheet date.
The Group’s investments in associated companies include investments in listed associated companies with a carrying amount of $800,000 (2009: $800,000), for which the published price quotations are $1,440,000 (2009: $1,250,000) at the balance sheet date.
Details of significant associated companies are provided in Note 51.
FRS 28(38)
FRS 28(39)
FRS 28(38)
FRS 28(37)(b)
FRS 28(40)(a)
FRS 28(40)(b)
DV
FRS 28(37)(g)
FRS 28(37)(g)
FRS 28(37)(a)

PwC Holdings Ltd and its Subsidiaries
Notes to the Financial StatementsFor the financial year ended 31 December 2010
147Illustrative Annual Report 2010
Reference
Not
es to
the
Fina
ncia
l Sta
tem
ents
FRS 28(28)
FRS 28(37)(i)
FRS 28(29)
Guidance notes
Investments in associated companies
Cumulative preference shares issued by associated company 1. If the associated company has cumulative preference shares that are held by parties outside the
Group and that are classified as equity, the investor computes its share of results after adjusting for the dividends on such shares, whether or not the dividends have been declared.
Summarised financial information of associated companies2. An alternative method of presenting summarised financial information is to disclose the Group’s
proportionate share instead of the gross amounts of assets, liabilities and results as recorded in the associated companies’ financial statements. The alternative method is recommended when the reporting entity has several associated companies with differing interests.
3. Where the reporting entity is an investor that is exempted under paragraph 13(c) of FRS 28 from applying equity accounting for its investments in associated companies and elects to use that exemption, the summarised financial information of the associated companies shall continue to be presented in the investor’s separate financial statements. No similar requirement is applicable to joint ventures.
Interest in an associated company4. The interest in an associated company is the carrying amount of the investment in the associated
company together with any long-term interests that, in substance, form part of the investor’s net investment in the associated company. For example, an item for which settlement is neither planned nor likely to occur in the foreseeable future is, in substance, an extension of the entity’s investment in that associated company.

148
ReferencePwC Holdings Ltd and its Subsidiaries
Notes to the Financial StatementsFor the financial year ended 31 December 2010
Not
es to
the
Fina
ncia
l Sta
tem
ents
24. Investment in a joint venture The Company has a 60% equity interest at a cost of $880,000 (2009: $880,000) in PwC JV Logistics (PRC) Ltd (“PwC JV Logistics”), which provides freight forwarding and warehousing services in the People’s Republic of China. PwC JV Logistics is deemed to be a joint venture of the Company as the appointment of its directors and the allocation of voting rights for key business decisions require the unanimous approval of its venturers.1
The following amounts represent the Group’s 60% share of the assets and liabilities and income and expenses of the joint venture which are included in the consolidated balance sheet and statement of comprehensive income using the line-by-line format of proportionate consolidation:2,3
Group 2010 2009 $’000 $’000 Assets - Current assets 803 717 - Non-current assets 2,730 2,124 3,533 2,841Liabilities - Current liabilities (388) (406) - Non-current liabilities (1,081) (1,073) (1,469) (1,479) Net assets 2,064 1,362 Sales 1,100 778Expenses (354) (509)Profit before tax 746 269Income tax (224) (160)Profit after tax 522 109 Operating cash inflows 640 560Investing cash (outflows)/inflows (40) 70Financing cash outflows (20) (110)Total cash inflows 580 520 Capital commitments in relation to interest in joint venture – 250 Proportionate interest in joint venture’s capital commitments 90 92 Details of the joint venture are included in Note 51.
FRS 31(56)
FRS 31(56)
DV
FRS 7(50)(b)
FRS 31(55)(a)
FRS 31(55)(b)
PwC Holdings Ltd and its Subsidiaries
Notes to the Financial StatementsFor the financial year ended 31 December 2010
149Illustrative Annual Report 2010
Reference
Not
es to
the
Fina
ncia
l Sta
tem
ents
CA 5(1)
FRS 27(4)
FRS 31(2)
FRS 31(56)
FRS 31(56)
Guidance notes
Investment in a joint venture
Legal subsidiary not required to be consolidated1. Under the Companies Act, a company is a subsidiary of another company if the latter owns
more than 50% of the equity interest in the former. This definition is different from FRS 27, which defines subsidiary as an entity that is controlled by another entity. Accordingly, the Accounting and Corporate Regulatory Authority (“ACRA”) issued Practice Direction No. 4 of 2006 to clarify that:
(a) a parent (under FRS 27) which is not a holding company (under the Companies Act) must prepare consolidated accounts in accordance with FRS 27 as mandated by the Companies Act;
(b) a holding company (under the Companies Act) which is also a parent (under FRS 27) must prepare consolidated accounts in accordance with FRS 27 as mandated by the Companies Act; and
(c) a holding company (under the Companies Act) which is not a parent (under FRS 27) must incorporate financial information relating to its legal subsidiaries in its financial statements in accordance with the relevant FRS (FRS 28, 31 or 39).
The above is possible because ACRA interprets the term “consolidated accounts” in Section 201(3A) of the Companies Act as not restricted to the meaning of consolidated financial statements under FRS 27. Instead, the phrase “consolidated accounts” is viewed wide enough to include the incorporation of the financial information of a legal subsidiary as accounted for in accordance with FRS 28, 31 or 39.
Summarised financial information of joint ventures2. Where the reporting entity is a venturer that is exempted under paragraph 2 of FRS 31 from
applying proportionate consolidation or equity accounting for its investments in joint ventures and elects to use that exemption, the summarised financial information of the joint ventures need not be disclosed in the venturer’s separate financial statements. This disclosure shall be made in the consolidated financial statements only when the joint ventures are either proportionately consolidated or equity accounted for. This treatment is different from that applicable to associated companies.
3. The reporting entity must also present the summarised financial information of joint ventures based on the Group’s proportionate interests in the joint ventures. There is no option to present the items at their gross amounts, unlike associated companies.
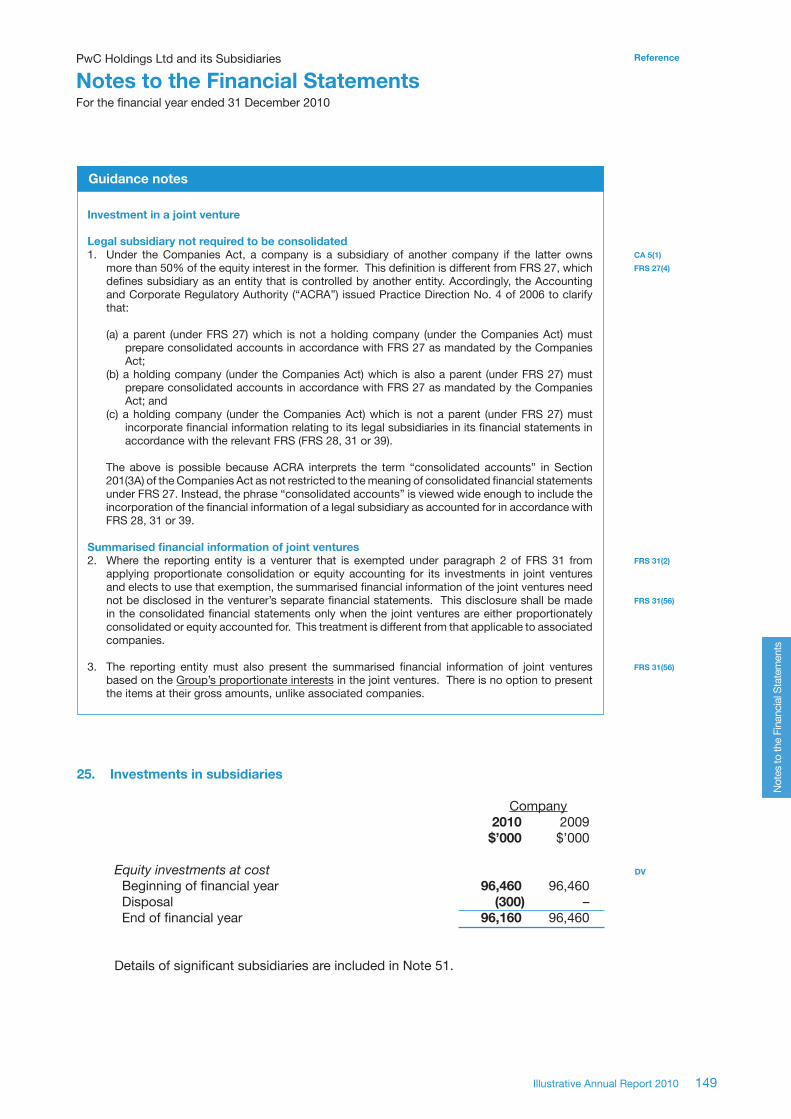
25. Investments in subsidiaries
Company 2010 2009 $’000 $’000 Equityinvestmentsatcost Beginning of financial year 96,460 96,460 Disposal (300) – End of financial year 96,160 96,460
Details of significant subsidiaries are included in Note 51.
DV

150
ReferencePwC Holdings Ltd and its Subsidiaries
Notes to the Financial StatementsFor the financial year ended 31 December 2010
Not
es to
the
Fina
ncia
l Sta
tem
ents
26. Investment properties
Group 2010 2009 $’000 $’000 Beginning of financial year 5,455 3,365Additions – 2,040Improvements 288 –Disposals (70) –Net fair value (loss)/gain recognised in profit or loss (Note 8) (123) 50End of financial year 5,550 5,455
Investment properties are carried at fair values1 at the balance sheet date as determined by independent professional valuers. Valuations are made annually based on the properties’ highest-and-best-use using the Direct Market Comparison Method.
Investment properties are leased to non-related parties under operating leases (Note 42(c)).
Certain investment properties are mortgaged to secure bank loans (Note 31(a)).
The following amounts are recognised in profit and loss: Group 2010 2009 $’000 $’000 Rental income (Note 7) 488 96Direct operating expenses arising from:- Investment properties that generated rental income (30) (6)- Investment properties that did not generate rental income (40) (8)
FRS 40(76)
FRS 40(76)(d)
FRS 40(76)
FRS 40(75)(d,e)
FRS 17(56)(c)
FRS 17(57)
FRS 40(75)(g)
FRS 40(75)(f)(i)
FRS 40(75)(f)(ii)
FRS 40(75)(f)(iii)
FRS 40(50,77)
Guidance notes
Adjustment to fair value1. When a valuation obtained for investment property is adjusted significantly for the purpose of
the financial statements, for example to avoid double-counting for assets or liabilities that are recognised as separate assets and liabilities, the entity shall disclose a reconciliation between the valuation obtained and the adjusted valuation included in the financial statements, showing separately the aggregate amount of each type of significant adjustment.
PwC Holdings Ltd and its Subsidiaries
Notes to the Financial StatementsFor the financial year ended 31 December 2010
151Illustrative Annual Report 2010
Reference
Not
es to
the
Fina
ncia
l Sta
tem
ents
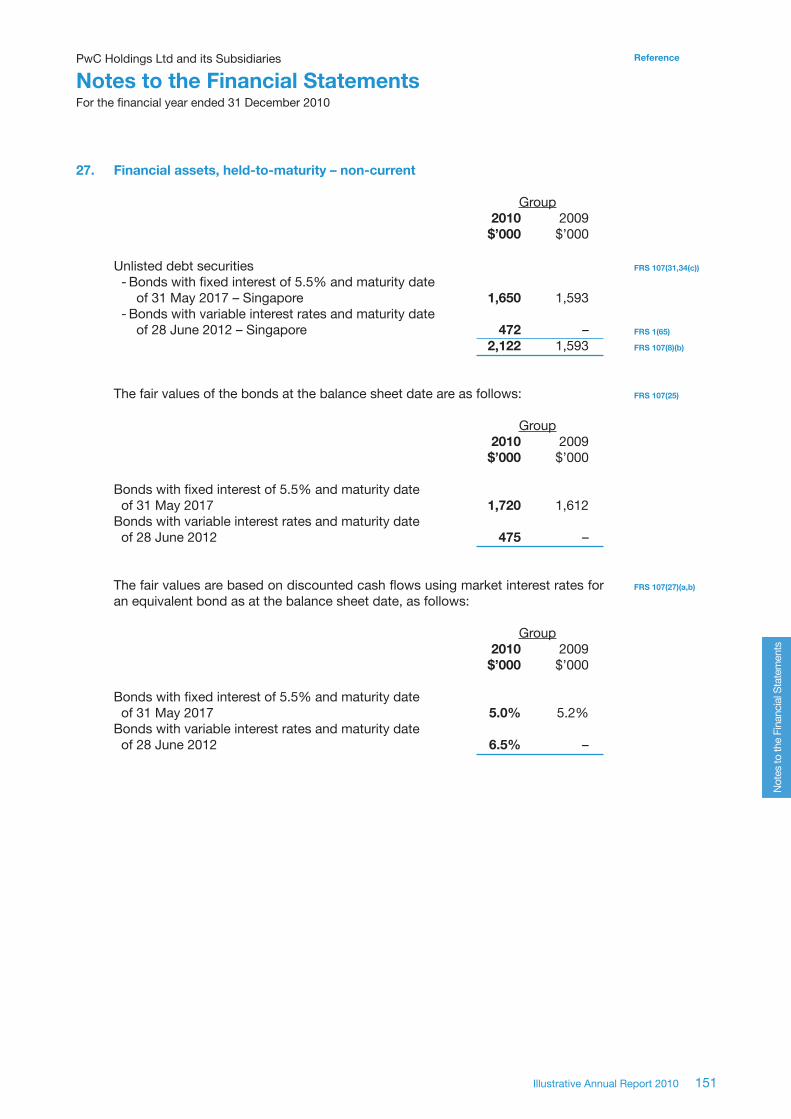
27. Financial assets, held-to-maturity – non-current
Group 2010 2009 $’000 $’000 Unlisted debt securities - Bonds with fixed interest of 5.5% and maturity date of 31 May 2017 – Singapore 1,650 1,593 - Bonds with variable interest rates and maturity date of 28 June 2012 – Singapore 472 – 2,122 1,593
The fair values of the bonds at the balance sheet date are as follows: Group 2010 2009 $’000 $’000
Bonds with fixed interest of 5.5% and maturity date of 31 May 2017 1,720 1,612Bonds with variable interest rates and maturity date of 28 June 2012 475 –
The fair values are based on discounted cash flows using market interest rates for an equivalent bond as at the balance sheet date, as follows: Group 2010 2009 $’000 $’000 Bonds with fixed interest of 5.5% and maturity date of 31 May 2017 5.0% 5.2%Bonds with variable interest rates and maturity date of 28 June 2012 6.5% –
FRS 107(31,34(c))
FRS 1(65)
FRS 107(8)(b)
FRS 107(25)
FRS 107(27)(a,b)

152
ReferencePwC Holdings Ltd and its Subsidiaries
Notes to the Financial StatementsFor the financial year ended 31 December 2010
Not
es to
the
Fina
ncia
l Sta
tem
ents
28. Property, plant and equipment
Assets Freehold Leasehold Plant and Motor under land land Buildings equipment vehicles construction Total $’000 $’000 $’000 $’000 $’000 $’000 $’000
Group 2010 Costorvaluation Beginning of financial year Cost – – – 84,703 2,700 – 87,403 Valuation 8,400 8,061 21,453 – – – 37,914 8,400 8,061 21,453 84,703 2,700 – 125,317Currency translation differences – 314 (808) 4,509 103 – 4,118Acquisition of Subsidiary5 (Note 47) – 12,012 37,060 18,199 513 – 67,784Additions – 3,423 3,703 2,202 427 360 10,115Reclassified to disposal group – – – (1,842) – – (1,842)Disposals1 – (594) (1,526) (4,887) – – (7,007)Revaluation surplus2
(Note 38(b)(vii)) 50 93 110 – – – 253Revaluation adjustments2 – (455) (970) – – – (1,425)End of financial year 8,450 22,854 59,022 102,884 3,743 360 197,313 Representing: Cost – – – 102,884 3,743 360 106,987Valuation 8,450 22,854 59,022 – – – 90,326 8,450 22,854 59,022 102,884 3,743 360 197,313 AccumulateddepreciationandimpairmentlossesBeginning of financial year – – – 26,177 1,250 – 27,427Currency translation differences – – – 808 87 – 895Depreciation charge - Continuing operations (Note 5) – 489 1,056 15,436 694 – 17,675 - Discontinued operations – – – 79 – – 79Reclassified to disposal group – – – (279) – – (279)Disposals1 – (34) (86) (550) – – (670)Revaluation adjustments2 – (455) (970) – – – (1,425)End of financial year – – – 41,671 2,031 – 43,702 Net book value End of financial year 8,450 22,854 59,022 61,213 1,712 360 153,611
FRS 1(78)(a)
FRS 16(73)(d)
FRS 16(73)(a)
FRS 16(73)(d)
FRS 16(73)(e)(viii)
FRS 16(73)(e)(iii)
FRS 16(73)(e)(i)
FRS 16(73)(e)(ii)
FRS 16(73)(e)(ii)
FRS 16(73)(e)(iv)
FRS 16(73)(e)(iv)
FRS 16(73)(d)
FRS 16(73)(a)
FRS 16(73)(a),
SGX 1207(10)
FRS 16(73)(d)
FRS 16(73)(d)
FRS 16(73)(e)(viii)
FRS 16(73)(e)(vii)
FRS 16(73)(e)(ii)
FRS 16(73)(e)(ii)
FRS 16(73)(e)(iv)
FRS 16(73)(d)

PwC Holdings Ltd and its Subsidiaries
Notes to the Financial StatementsFor the financial year ended 31 December 2010
153Illustrative Annual Report 2010
Reference
Not
es to
the
Fina
ncia
l Sta
tem
ents
28. Property, plant and equipment (continued)
Assets Freehold Leasehold Plant and Motor under land land Buildings equipment vehicles construction Total $’000 $’000 $’000 $’000 $’000 $’000 $’000
Group 2009 Costorvaluation Beginning of financial year Cost – – – 87,450 2,362 – 89,812Valuation 8,300 8,059 19,851 – – – 36,210 8,300 8,059 19,851 87,450 2,362 – 126,022 Currency translation differences – (122) (272) (1,073) (53) – (1,520)Additions – – 1,588 4,063 391 – 6,042Disposals1 – – – (5,737) – – (5,737)Revaluation surplus2 (Note 38(b)(vii)) 100 235 798 – – – 1,133Revaluation adjustments2 – (111) (512) – – – (623)End of financial year 8,400 8,061 21,453 84,703 2,700 – 125,317 Representing: Cost – – – 84,703 2,700 – 87,403Valuation 8,400 8,061 21,453 – – – 37,914 8,400 8,061 21,453 84,703 2,700 – 125,317 AccumulateddepreciationandimpairmentlossesBeginning of financial year – 48 69 20,822 755 – 21,694Currency translation differences – (12) (18) (489) (37) – (556)Depreciation charge - Continuing operations (Note 5) – 75 461 8,514 532 – 9,582 - Discontinued operations – – – 80 – – 80Disposals1 – – – (2,750) – – (2,750)Revaluation adjustments2 – (111) (512) – – – (623)End of financial year – – – 26,177 1,250 – 27,427 Net book value End of financial year 8,400 8,061 21,453 58,526 1,450 – 97,890
FRS 1(78)(a)
FRS 16(73)(d)
FRS 16(73)(a)
FRS 16(73)(a)
FRS 16(73)(d)
FRS 16(73)(e)(viii)
FRS 16(73)(e)(i)
FRS 16(73)(e)(ii)
FRS 16(73)(e)(iv)
FRS 16(73)(e)(iv)
FRS 16(73)(d)
FRS 16(73)(a)FRS 16(73)(a), SGX 1207(10)
FRS 16(73)(d)
FRS 16(73)(d)
FRS 16(73)(e)(viii)
FRS 16(73)(e)(vii)
FRS 16(73)(e)(ii)
FRS 16(73)(e)(iv)
FRS 16(73)(d)

154
ReferencePwC Holdings Ltd and its Subsidiaries
Notes to the Financial StatementsFor the financial year ended 31 December 2010
Not
es to
the
Fina
ncia
l Sta
tem
ents
28. Property, plant and equipment (continued)
Plant and Motor equipment vehicles Total $’000 $’000 $’000Company 2010 Cost Beginning of financial year 432 50 482Additions 328 180 508Disposals (55) – (55)End of financial year 705 230 935 Accumulateddepreciation Beginning of financial year 62 20 82Depreciation charge 14 4 18Disposals (20) – (20)End of financial year 56 24 80 Net book value End of financial year 649 206 855 2009 Cost Beginning of financial year 432 – 432Additions – 50 50End of financial year 432 50 482 Accumulateddepreciation Beginning of financial year 27 – 27Depreciation charge 35 20 55End of financial year 62 20 82 Net book value End of financial year 370 30 400
FRS 1(75)(a)
FRS 16(73)(a)
FRS 16(73)(d)
FRS 16(73)(e)(i)
FRS 16(73)(e)(ii)
FRS 16(73)(d)
FRS 16(73)(d)
FRS 16(73)(e)(ii)
FRS 16(73)(e)(vii)
FRS 16(73)(d)
FRS 16(73)(a)
FRS 16(73)(d)
FRS 16(73)(e)(i)
FRS 16(73)(d)
FRS 16(73)(d)
FRS 16(73)(e)(vii)
FRS 16(73)(d)
(a) Included in additions in the consolidated financial statements are plant and equipment, and motor vehicles acquired under finance leases amounting to $400,000 (2009: Nil) and $150,000 (2009: Nil) respectively.
The carrying amounts of plant and equipment, and motor vehicles held under finance leases are $745,000 (2009: $450,000) and $180,000 (2009: Nil) respectively at the balance sheet date.4
(b) The freehold and leasehold land and buildings of the Group and the Company were valued by an independent professional valuer based on the properties’ highest-and-best-use using the Direct Market Comparison Method at the balance sheet date.
FRS 7(43)
FRS 17(31)(a)
FRS 16(77)(a-d)
SGX 1207(10)

PwC Holdings Ltd and its Subsidiaries
Notes to the Financial StatementsFor the financial year ended 31 December 2010
155Illustrative Annual Report 2010
Reference
Not
es to
the
Fina
ncia
l Sta
tem
ents
28. Property, plant and equipment (continued)
(c) If the land and buildings stated at valuation were included in the financial statements at cost less accumulated depreciation, their net book values would be:
Group 2010 2009 $’000 $’000 Freehold land 8,010 8,108Leasehold land 28,455 7,800Buildings 51,609 21,529
(d) Bank borrowings are secured on property, plant and equipment of the Group and the Company with carrying amounts of $52,835,000 and $537,000 respectively (2009: $75,530,000 and $390,000) (Note 31(a)).
FRS 16(77)(e)
FRS 16(74)(a)
FRS 16(35)
FRS 16(81)
FRS 17(31)(a)
Guidance notes
Property, plant and equipment (“PPE”)
Disposals 1. Disposal of PPE due to the sale of subsidiary may be included in the “Disposals” line item, as
illustrated in this publication.
Revaluations 2. When an item of PPE is revalued, the accumulated depreciation at the date of the revaluation can
either be :
(a) restated proportionately with the change in the gross carrying amount of the asset so that the carrying amount of the asset after revaluation equals its revalued amount; or
(b) eliminated against the gross carrying amount of the asset and the net amount restated to the revalued amount of the asset.
Method (b) is illustrated in this publication.
3. Entities are required to perform regular subsequent revaluations unless the initial revaluations were performed before 1984 or only one-off revaluations were performed between 1 January 1984 and 31 December 1996 (both dates inclusive). In the event that an item of PPE has been revalued more than once between 1 January 1984 and 31 December 1996, the entity shall explain why the PPE shall be exempted from subsequent revaluation and obtain its independent auditor’s concurrence on this.
Leased assets4. Net carrying amount at the balance sheet date shall be disclosed for each class of assets acquired
by finance lease.
Acquisition of subsidiary5. Property, plant and equipment acquired as part of a business combination should be initially
recorded at fair value from the perspective of the Group. From the viewpoint of the acquired entity, however, the property, plant and equipment continue to be recorded at cost less accumulated depreciation, including accumulated depreciation recorded prior to the date of the business combination. At Group level, consolidation adjustments may be necessary to adjust subsidiary book values to the Group numbers. For example, any pre-acquisition accumulated depreciation at the subsidiary level should not be carried forward to the consolidated Group numbers.
156
ReferencePwC Holdings Ltd and its Subsidiaries
Notes to the Financial StatementsFor the financial year ended 31 December 2010
Not
es to
the
Fina
ncia
l Sta
tem
ents
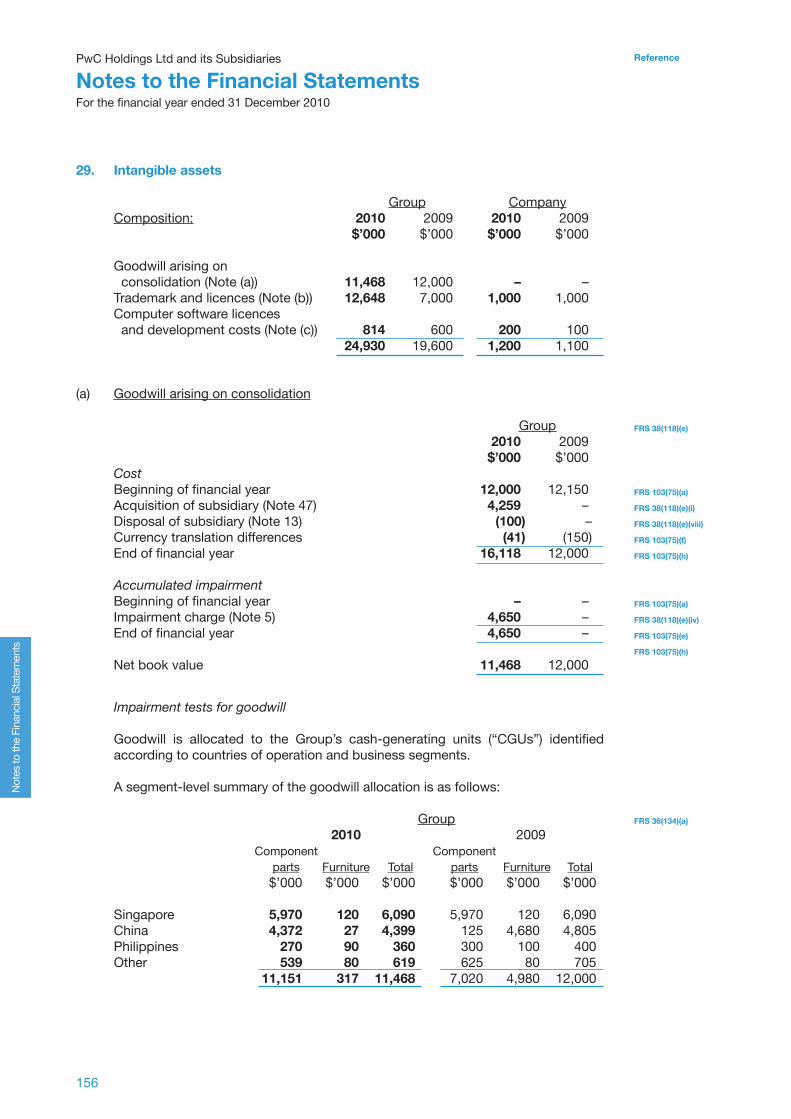
29. Intangible assets Group CompanyComposition: 2010 2009 2010 2009 $’000 $’000 $’000 $’000
Goodwill arising on consolidation (Note (a)) 11,468 12,000 – –Trademark and licences (Note (b)) 12,648 7,000 1,000 1,000Computer software licences and development costs (Note (c)) 814 600 200 100 24,930 19,600 1,200 1,100
(a) Goodwill arising on consolidation
Group 2010 2009 $’000 $’000Cost Beginning of financial year 12,000 12,150Acquisition of subsidiary (Note 47) 4,259 –Disposal of subsidiary (Note 13) (100) –Currency translation differences (41) (150)End of financial year 16,118 12,000 Accumulatedimpairment Beginning of financial year – –Impairment charge (Note 5) 4,650 –End of financial year 4,650 – Net book value 11,468 12,000
FRS 38(118)(e)
FRS 103(75)(a)
FRS 38(118)(e)(i)
FRS 38(118)(e)(viii)
FRS 103(75)(f)
FRS 103(75)(h)
FRS 103(75)(a)
FRS 38(118)(e)(iv)
FRS 103(75)(e)
FRS 103(75)(h)
Impairmenttestsforgoodwill
Goodwill is allocated to the Group’s cash-generating units (“CGUs”) identified according to countries of operation and business segments.
A segment-level summary of the goodwill allocation is as follows: Group 2010 2009 Component Component parts Furniture Total parts Furniture Total $’000 $’000 $’000 $’000 $’000 $’000 Singapore 5,970 120 6,090 5,970 120 6,090China 4,372 27 4,399 125 4,680 4,805Philippines 270 90 360 300 100 400Other 539 80 619 625 80 705 11,151 317 11,468 7,020 4,980 12,000
FRS 36(134)(a)

PwC Holdings Ltd and its Subsidiaries
Notes to the Financial StatementsFor the financial year ended 31 December 2010
157Illustrative Annual Report 2010
Reference
Not
es to
the
Fina
ncia
l Sta
tem
ents
29. Intangible assets (continued)
(a) Goodwill arising on consolidation (continued)
The recoverable amount of a CGU was determined based on value-in-use. Cash flow projections used in the value-in-use calculations were based on financial budgets approved by management covering a five-year period. Cash flows beyond the five-year period were extrapolated using the estimated growth rates stated below. The growth rate did not exceed the long-term average growth rate for the component parts business in which the CGU operates.
Key assumptions used for value-in-use calculations:
2010 Component parts Furniture Singapore China Philippines Other Singapore China Philippines Other Gross margin1 45.0% 56.0% 57.0% 56.0% 30.0% 32.0% 34.0% 35.0%Growth rate2 2.0% 4.5% 2.2% 1.9% 1.1% 2.6% 1.9% 1.4%Discount rate3 7.1% 14.5% 12.0% 13.2% 7.0% 15.0% 13.3% 13.5%
1 Budgeted gross margin2 Weighted average growth rate used to extrapolate cash flows beyond the budget period 3 Pre-tax discount rate applied to the pre-tax cash flow projections
FRS 36(134)(c)
FRS 36(134)(d)(iii)
FRS 36(134)(d)(i,iv,v)
FRS 36(134)(d)(ii)
FRS 36(55)
2009 Component parts Furniture Singapore China Philippines Other Singapore China Philippines Other Gross margin1 60.0% 59.0% 60.0% 56.0% 58.0% 56.0% 58.0% 55.0%Growth rate2 5.8% 8.8% 7.8% 1.9% 5.1% 8.3% 7.1% 1.4%Discount rate3 6.3% 10.0% 10.7% 12.8% 6.5% 11.0% 11.8% 13.5%
1 Budgeted gross margin2 Weighted average growth rate used to extrapolate cash flows beyond the budget period 3 Pre-tax discount rate applied to the pre-tax cash flow projections
These assumptions were used for the analysis of each CGU within the business segment. Management determined budgeted gross margin based on past performance and its expectations of market developments. The weighted average growth rates used were consistent with forecasts included in industry reports. The discount rates used were pre-tax and reflected specific risks relating to the relevant segments.

158
ReferencePwC Holdings Ltd and its Subsidiaries
Notes to the Financial StatementsFor the financial year ended 31 December 2010
Not
es to
the
Fina
ncia
l Sta
tem
ents
29. Intangible assets (continued)
(a) Goodwill arising on consolidation (continued)
An impairment charge of $4,650,000 (2009: Nil) is included within “Administrative expenses” in the statement of comprehensive income1. The impairment charge has arisen from the furniture CGU in China following a decision to reduce the manufacturing output as a result of reducing customer demand. The Group has also reassessed the useful lives of its property, plant and equipment and determined that no change in the useful lives was required.
The impairment test carried out as at 31 December 2010 for the component parts CGU in Singapore, which includes 55% of the goodwill recognised on the balance sheet has revealed that the recoverable amount of the CGU is only $10,000,000 or 3% higher than its carrying amount. This is the result of the significant pressure felt on selling prices and a sharp decrease in demand encountered as a result of the economic crisis. A further decrease in the growth margin by 1% or a decrease in the growth rate by 0.2% would result in the recoverable amount of the component parts CGU in Singapore to equal its carrying amount2.
FRS 36(126)(a)
FRS 36(130)
FRS 36(134)(f)
(b) Trademark and licences Group Company 2010 2009 2010 2009 $’000 $’000 $’000 $’000
CostBeginning of financial year 7,700 7,306 1,560 900Currency translation differences (19) (306) – –Acquisition of subsidiary (Note 47) 4,000 – – –Additions 2,447 700 100 660Reclassified to disposal group (Note 11) (100) – – –End of financial year 14,028 7,700 1,660 1,560 Accumulated amortisation Beginning of financial year 700 335 560 500Amortisation charge - Continuing operations 655 315 100 60 - Discontinued operations 25 50 – –End of financial year 1,380 700 660 560 Net book value 12,648 7,000 1,000 1,000
FRS 38(118)(c)
FRS 38(118)(e)(vii)
FRS 38(118)(e)(i)
FRS 38(118)(e)(i)
FRS 38(118)(e)(ii)
FRS 38(118)(c)
FRS 38(118)(c)
FRS 38(118)(e)(vi)
FRS 38(118)(c)

PwC Holdings Ltd and its Subsidiaries
Notes to the Financial StatementsFor the financial year ended 31 December 2010
159Illustrative Annual Report 2010
Reference
Not
es to
the
Fina
ncia
l Sta
tem
ents
29. Intangible assets (continued)
(c) Computer software licences Group Company 2010 2009 2010 2009 $’000 $’000 $’000 $’000
CostBeginning of financial year 1,300 1,345 120 120Currency translation differences (32) (45) – –Additions 366 – 120 –End of financial year 1,634 1,300 240 120 Accumulated amortisation Beginning of financial year 700 500 20 –Amortisation charge 120 200 20 20End of financial year 820 700 40 20 Net book value 814 600 200 100
FRS 38(118)(c)
FRS 38(118)(e)(vii)
FRS 38(118)(e)(i)
FRS 38(118)(c)
FRS 38(118)(c)
FRS 38(118)(e)(vi)
FRS 38(118)(c)
(d) Amortisation expense included in the statement of comprehensive income is analysed as follows1:
Group 2010 2009 $’000 $’000 Cost of sales 655 315Administrative expenses 120 200Total (Note 5) 775 515
FRS 38(118)(d)
FRS 38(118)(d)
FRS 36(134(f))
Guidance notes
Intangible assets
Line items on the statement of comprehensive income in which impairment losses are included1. These disclosures are required only for entities that present expenses by function on the face of
the statement of comprehensive income.
Effects of reasonably possible changes on impairment key assumptions2. If a reasonably possible change in a key assumption on which management has based its
determination of the unit’s (group of units’) recoverable amount would cause the unit’s (group of units’) carrying amount to exceed its recoverable amount, the following should be disclosed:
(a) The amount by which the unit’s (group of units’) recoverable amount exceeds its carrying amount;
(b) The value assigned to the key assumption;(c) The amount by which the value assigned to the key assumption must change, after
incorporating any consequential effects of that change on the other variables used to measure recoverable amount, in order for the unit’s (group of units’) recoverable amount to be equal to its carrying amount.
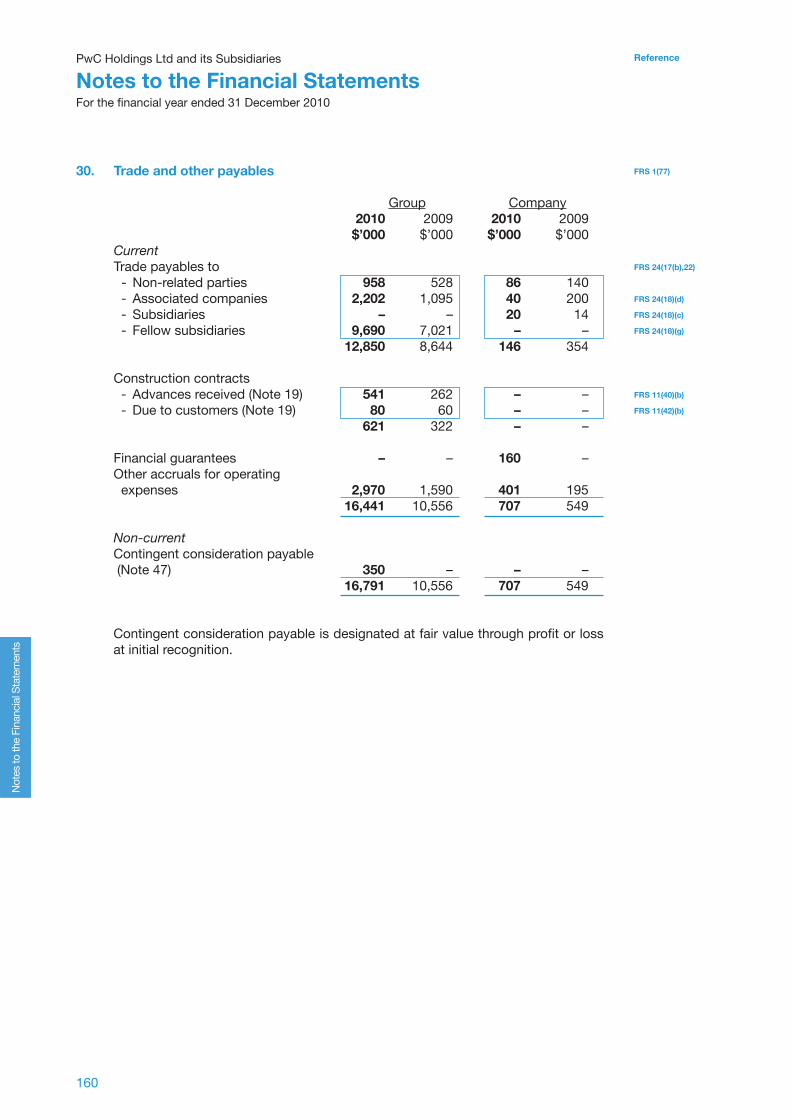
160
ReferencePwC Holdings Ltd and its Subsidiaries
Notes to the Financial StatementsFor the financial year ended 31 December 2010
Not
es to
the
Fina
ncia
l Sta
tem
ents
30. Trade and other payables
Group Company 2010 2009 2010 2009 $’000 $’000 $’000 $’000CurrentTrade payables to - Non-related parties 958 528 86 140 - Associated companies 2,202 1,095 40 200 - Subsidiaries – – 20 14 - Fellow subsidiaries 9,690 7,021 – – 12,850 8,644 146 354 Construction contracts - Advances received (Note 19) 541 262 – – - Due to customers (Note 19) 80 60 – – 621 322 – – Financial guarantees – – 160 –Other accruals for operating expenses 2,970 1,590 401 195 16,441 10,556 707 549
Non-currentContingent consideration payable (Note 47) 350 – – – 16,791 10,556 707 549
Contingent consideration payable is designated at fair value through profit or loss at initial recognition.
FRS 1(77)
FRS 24(17(b),22)
FRS 24(18)(d)
FRS 24(18)(c)
FRS 24(18)(g)
FRS 11(40)(b)
FRS 11(42)(b)
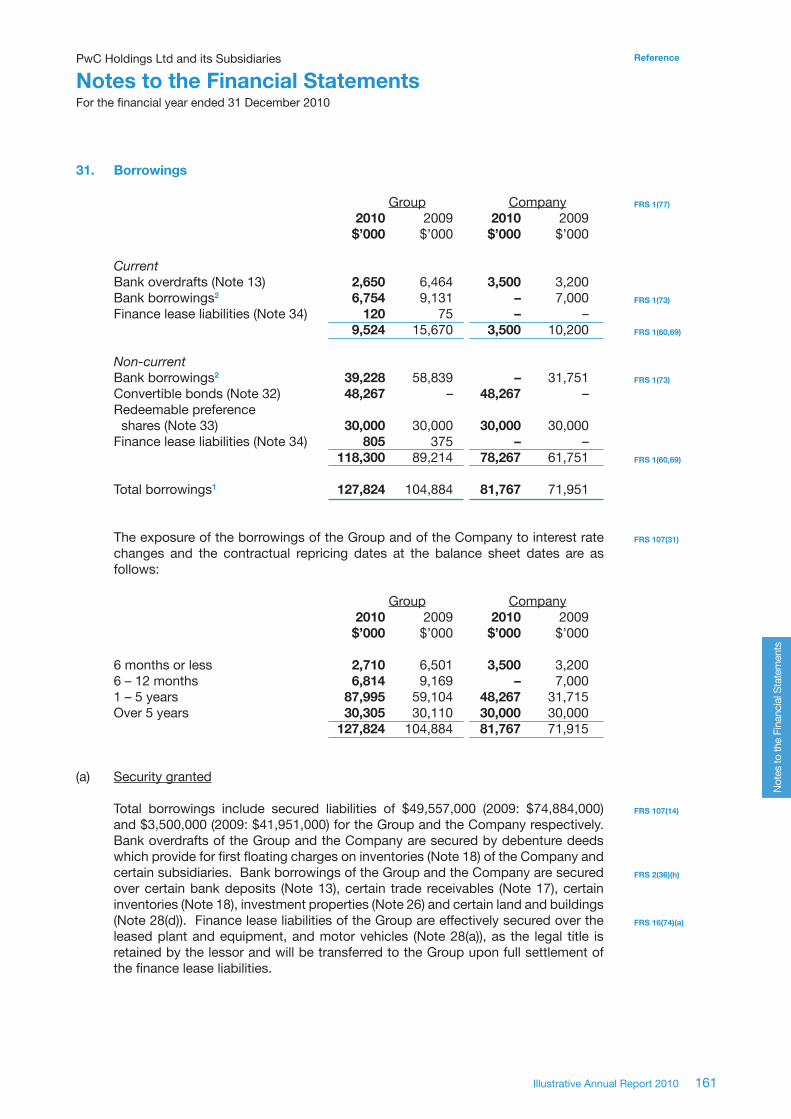
PwC Holdings Ltd and its Subsidiaries
Notes to the Financial StatementsFor the financial year ended 31 December 2010
161Illustrative Annual Report 2010
Reference
Not
es to
the
Fina
ncia
l Sta
tem
ents
31. Borrowings Group Company 2010 2009 2010 2009 $’000 $’000 $’000 $’000
Current Bank overdrafts (Note 13) 2,650 6,464 3,500 3,200Bank borrowings2 6,754 9,131 – 7,000Finance lease liabilities (Note 34) 120 75 – – 9,524 15,670 3,500 10,200 Non-current Bank borrowings2 39,228 58,839 – 31,751Convertible bonds (Note 32) 48,267 – 48,267 –Redeemable preference shares (Note 33) 30,000 30,000 30,000 30,000Finance lease liabilities (Note 34) 805 375 – – 118,300 89,214 78,267 61,751 Total borrowings1 127,824 104,884 81,767 71,951
The exposure of the borrowings of the Group and of the Company to interest rate changes and the contractual repricing dates at the balance sheet dates are as follows: Group Company 2010 2009 2010 2009 $’000 $’000 $’000 $’000
6 months or less 2,710 6,501 3,500 3,2006 – 12 months 6,814 9,169 – 7,0001 – 5 years 87,995 59,104 48,267 31,715Over 5 years 30,305 30,110 30,000 30,000 127,824 104,884 81,767 71,915
(a) Security granted
Total borrowings include secured liabilities of $49,557,000 (2009: $74,884,000) and $3,500,000 (2009: $41,951,000) for the Group and the Company respectively. Bank overdrafts of the Group and the Company are secured by debenture deeds which provide for first floating charges on inventories (Note 18) of the Company and certain subsidiaries. Bank borrowings of the Group and the Company are secured over certain bank deposits (Note 13), certain trade receivables (Note 17), certain inventories (Note 18), investment properties (Note 26) and certain land and buildings (Note 28(d)). Finance lease liabilities of the Group are effectively secured over the leased plant and equipment, and motor vehicles (Note 28(a)), as the legal title is retained by the lessor and will be transferred to the Group upon full settlement of the finance lease liabilities.
FRS 1(77)
FRS 1(73)
FRS 1(60,69)
FRS 1(73)
FRS 1(60,69)
FRS 107(31)
FRS 107(14)
FRS 2(36)(h)
FRS 16(74)(a)

162
ReferencePwC Holdings Ltd and its Subsidiaries
Notes to the Financial StatementsFor the financial year ended 31 December 2010
Not
es to
the
Fina
ncia
l Sta
tem
ents
31. Borrowings (continued)
(b) Fair value of non-current borrowings Group Company 2010 2009 2010 2009 $’000 $’000 $’000 $’000 Bank borrowings 41,193 57,135 – 29,987Convertible bonds 48,267 – 48,267 –Redeemable preference shares 30,931 31,314 30,391 31,314Finance lease liabilities 800 370 – – The fair values above are determined from the cash flow analyses, discounted at market borrowing rates of an equivalent instrument at the balance sheet date which the directors expect to be available to the Group as follows:
Group Company 2010 2009 2010 2009
Bank borrowings 5.8% 6.3% – 6.3%Convertible bonds 6.0% – 6.0% –Redeemable preference shares 6.0% 5.8% 6.0% 5.8%Finance lease liabilities 6.0% 6.1% – –
(c) Undrawn borrowing facilities Group Company 2010 2009 2010 2009 $’000 $’000 $’000 $’000
Not later than one year 24,900 16,600 9,010 9,060 Later than one year 14,000 8,400 6,000 5,220 38,900 25,000 15,010 14,280 The facilities expiring not later than one year from the balance sheet date are
facilities subject to annual review at various dates during 2011. The other facilities are arranged mainly to help finance the Group’s proposed expansion in Asia.
FRS 107(25)
FRS 107(29)(a)
FRS 107(27)(a,b)
DV
FRS 7(50)(a)
FRS 1(74)
FRS 107(18)
FRS 1(73)
Guidance notes
Defaults and breaches on borrowings1. FRS 107 requires additional disclosures in the event of defaults and breaches on borrowings.
Appendix 1 Example 5 includes an illustration.
Roll over and refinancing 2. Under an existing loan facility, if an entity has the discretion to refinance or roll over the borrowing
for at least twelve months after the balance sheet date and expects to do so, it classifies the borrowings as non-current. However, when refinancing or rolling over the borrowing is not at the discretion of the entity (for example, there is no agreement to refinance), the potential to refinance is not considered and the obligation is classified as current.
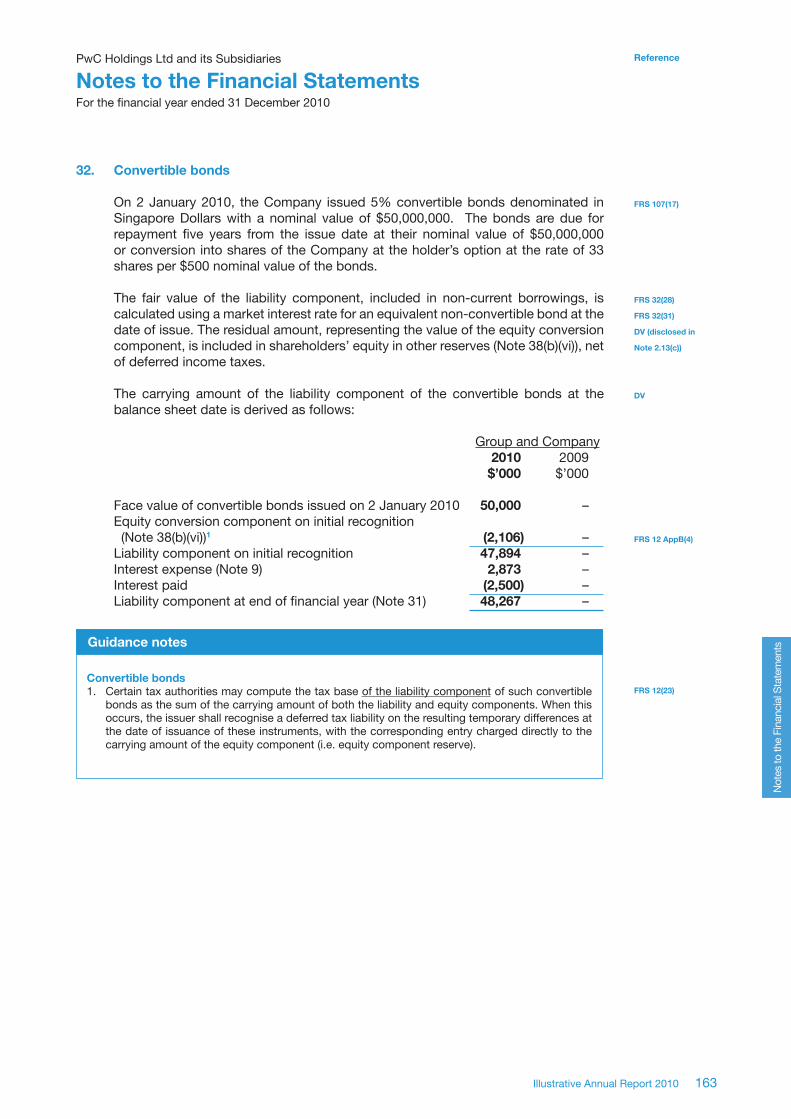
PwC Holdings Ltd and its Subsidiaries
Notes to the Financial StatementsFor the financial year ended 31 December 2010
163Illustrative Annual Report 2010
Reference
Not
es to
the
Fina
ncia
l Sta
tem
ents
FRS 107(17)
FRS 32(28)
FRS 32(31)
DV (disclosed in
Note 2.13(c))
DV
FRS 12 AppB(4)
FRS 12(23)
32. Convertible bonds
On 2 January 2010, the Company issued 5% convertible bonds denominated in Singapore Dollars with a nominal value of $50,000,000. The bonds are due for repayment five years from the issue date at their nominal value of $50,000,000 or conversion into shares of the Company at the holder’s option at the rate of 33 shares per $500 nominal value of the bonds.
The fair value of the liability component, included in non-current borrowings, is calculated using a market interest rate for an equivalent non-convertible bond at the date of issue. The residual amount, representing the value of the equity conversion component, is included in shareholders’ equity in other reserves (Note 38(b)(vi)), net of deferred income taxes.
The carrying amount of the liability component of the convertible bonds at the balance sheet date is derived as follows:
Group and Company 2010 2009 $’000 $’000 Face value of convertible bonds issued on 2 January 2010 50,000 –Equity conversion component on initial recognition (Note 38(b)(vi))1 (2,106) –Liability component on initial recognition 47,894 –Interest expense (Note 9) 2,873 –Interest paid (2,500) –Liability component at end of financial year (Note 31) 48,267 –
Guidance notes
Convertible bonds1. Certain tax authorities may compute the tax base of the liability component of such convertible
bonds as the sum of the carrying amount of both the liability and equity components. When this occurs, the issuer shall recognise a deferred tax liability on the resulting temporary differences at the date of issuance of these instruments, with the corresponding entry charged directly to the carrying amount of the equity component (i.e. equity component reserve).
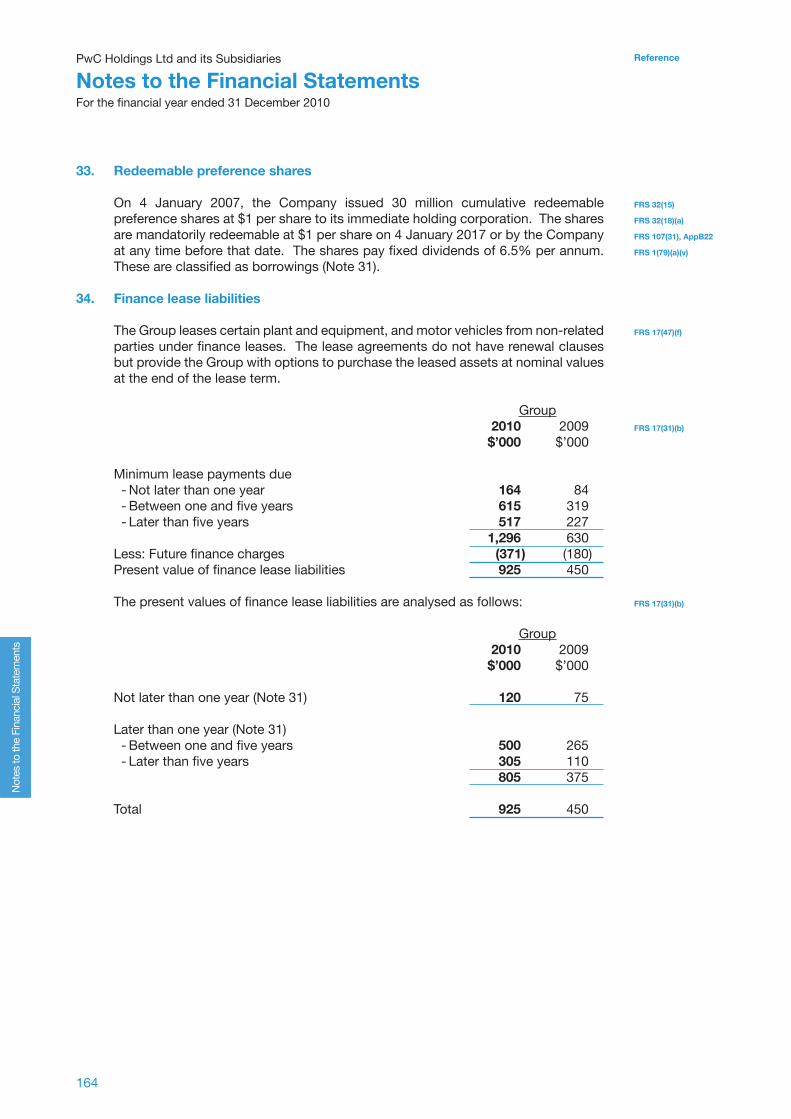
164
ReferencePwC Holdings Ltd and its Subsidiaries
Notes to the Financial StatementsFor the financial year ended 31 December 2010
Not
es to
the
Fina
ncia
l Sta
tem
ents
FRS 32(15)
FRS 32(18)(a)
FRS 107(31), AppB22
FRS 1(79)(a)(v)
FRS 17(47)(f)
FRS 17(31)(b)
FRS 17(31)(b)
33. Redeemable preference shares
On 4 January 2007, the Company issued 30 million cumulative redeemable preference shares at $1 per share to its immediate holding corporation. The shares are mandatorily redeemable at $1 per share on 4 January 2017 or by the Company at any time before that date. The shares pay fixed dividends of 6.5% per annum. These are classified as borrowings (Note 31).
34. Finance lease liabilities
The Group leases certain plant and equipment, and motor vehicles from non-related parties under finance leases. The lease agreements do not have renewal clauses but provide the Group with options to purchase the leased assets at nominal values at the end of the lease term. Group 2010 2009 $’000 $’000 Minimum lease payments due - Not later than one year 164 84 - Between one and five years 615 319 - Later than five years 517 227 1,296 630Less: Future finance charges (371) (180)Present value of finance lease liabilities 925 450 The present values of finance lease liabilities are analysed as follows:
Group 2010 2009 $’000 $’000 Not later than one year (Note 31) 120 75 Later than one year (Note 31) - Between one and five years 500 265 - Later than five years 305 110 805 375 Total 925 450

PwC Holdings Ltd and its Subsidiaries
Notes to the Financial StatementsFor the financial year ended 31 December 2010
165Illustrative Annual Report 2010
Reference
Not
es to
the
Fina
ncia
l Sta
tem
ents
FRS 1(78)(d)
FRS 1(61,69)
FRS 1(61,69)
FRS 37(85)(a)
FRS 37(84)(a)
FRS 37(84)(b)
FRS 37(84)(c)
FRS 37(84)(a)
FRS 37(85)(a)
FRS 37(84)(b)
FRS 34(26)
FRS 36(130)(a)
35. Provisions Group Company 2010 2009 2010 2009 $’000 $’000 $’000 $’000Current Warranty (Note (a)) 1,026 2,300 100 210Restructuring (Note (b)) 1,100 – – – 2,126 2,300 100 210Non-current Legal claims (Note (c)) 1,655 1,585 200 95Total 3,781 3,885 300 305
(a) Warranty
The Group and the Company give two-year warranties on certain products and undertake to repair or replace items that fail to perform satisfactorily. A provision is recognised at the balance sheet date for expected warranty claims based on past experience of the level of repairs and returns.
Movement in provision for warranty is as follows: Group Company 2010 20091 2010 20091
$’000 $’000 $’000 $’000
Beginning of financial year 2,300 2,120 210 90Currency translation differences 10 15 – –Provision made 210 275 70 170Provision utilised (1,398) (110) (180) (50)Reclassified to disposal group (Note 11) (96) – – –End of financial year 1,026 2,300 100 210
(b) Restructuring
The restructuring of the furniture segment will result in the retrenchment of 110 employees at two factories. An agreement was reached with the employees’ union that specified the number of staff involved and quantified the amounts payable to those made redundant. Estimated staff redundancy costs amounting to $840,000 are recognised in the financial year ended 31 December 2010. Other restructuring expenses amounting to $260,000 mainly comprise penalties on the early termination of leases on vacated properties.
The provision for restructuring of $1,100,000 is an update of the amount of $800,000 recorded in the Group’s interim consolidated financial report for the six months ended 30 June 2010, following the finalisation of certain restructuring costs in the second half of 2010. The provision for restructuring is expected to be fully utilised during the first half of 2011.2
In conjunction with the restructuring exercise, a goodwill impairment charge of $4,650,000 is recognised (Note 29(a)).
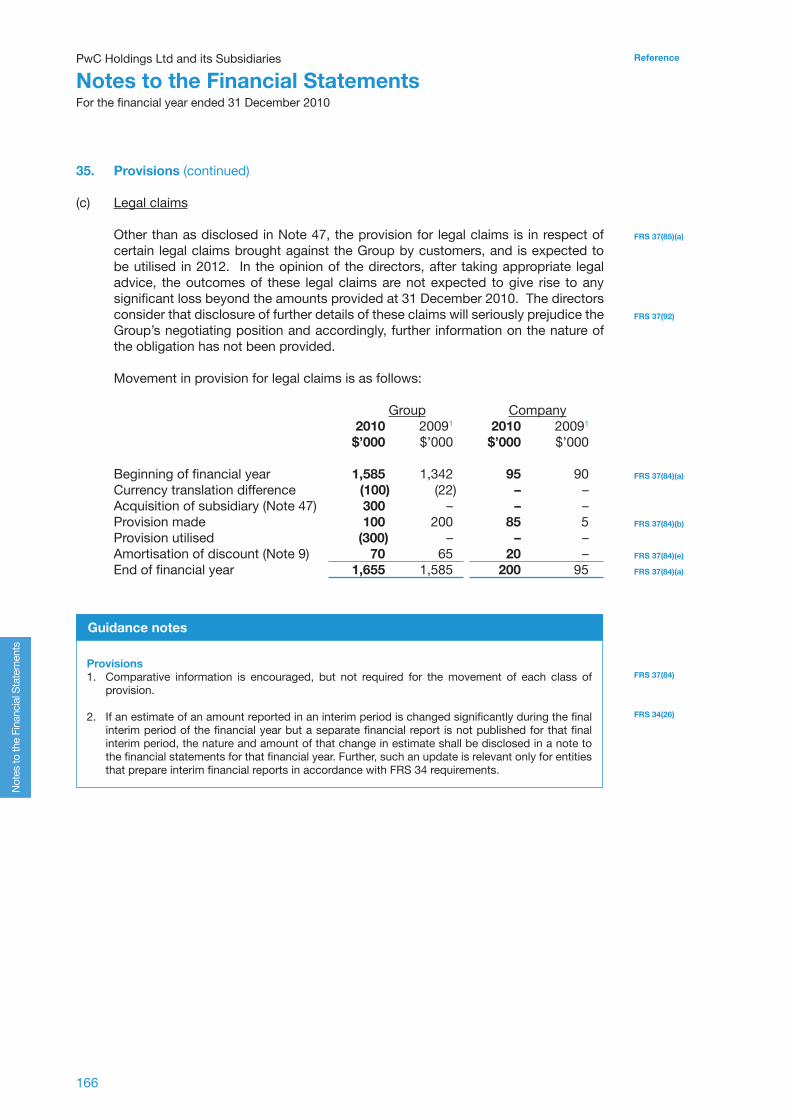
166
ReferencePwC Holdings Ltd and its Subsidiaries
Notes to the Financial StatementsFor the financial year ended 31 December 2010
Not
es to
the
Fina
ncia
l Sta
tem
ents
FRS 37(85)(a)
FRS 37(92)
FRS 37(84)(a)
FRS 37(84)(b)
FRS 37(84)(e)
FRS 37(84)(a)
FRS 37(84)
FRS 34(26)
35. Provisions (continued) (c) Legal claims
Other than as disclosed in Note 47, the provision for legal claims is in respect of certain legal claims brought against the Group by customers, and is expected to be utilised in 2012. In the opinion of the directors, after taking appropriate legal advice, the outcomes of these legal claims are not expected to give rise to any significant loss beyond the amounts provided at 31 December 2010. The directors consider that disclosure of further details of these claims will seriously prejudice the Group’s negotiating position and accordingly, further information on the nature of the obligation has not been provided.
Movement in provision for legal claims is as follows: Group Company 2010 20091 2010 20091
$’000 $’000 $’000 $’000
Beginning of financial year 1,585 1,342 95 90Currency translation difference (100) (22) – –Acquisition of subsidiary (Note 47) 300 – – –Provision made 100 200 85 5Provision utilised (300) – – –Amortisation of discount (Note 9) 70 65 20 –End of financial year 1,655 1,585 200 95
Guidance notes
Provisions 1. Comparative information is encouraged, but not required for the movement of each class of
provision.
2. If an estimate of an amount reported in an interim period is changed significantly during the final interim period of the financial year but a separate financial report is not published for that final interim period, the nature and amount of that change in estimate shall be disclosed in a note to the financial statements for that financial year. Further, such an update is relevant only for entities that prepare interim financial reports in accordance with FRS 34 requirements.
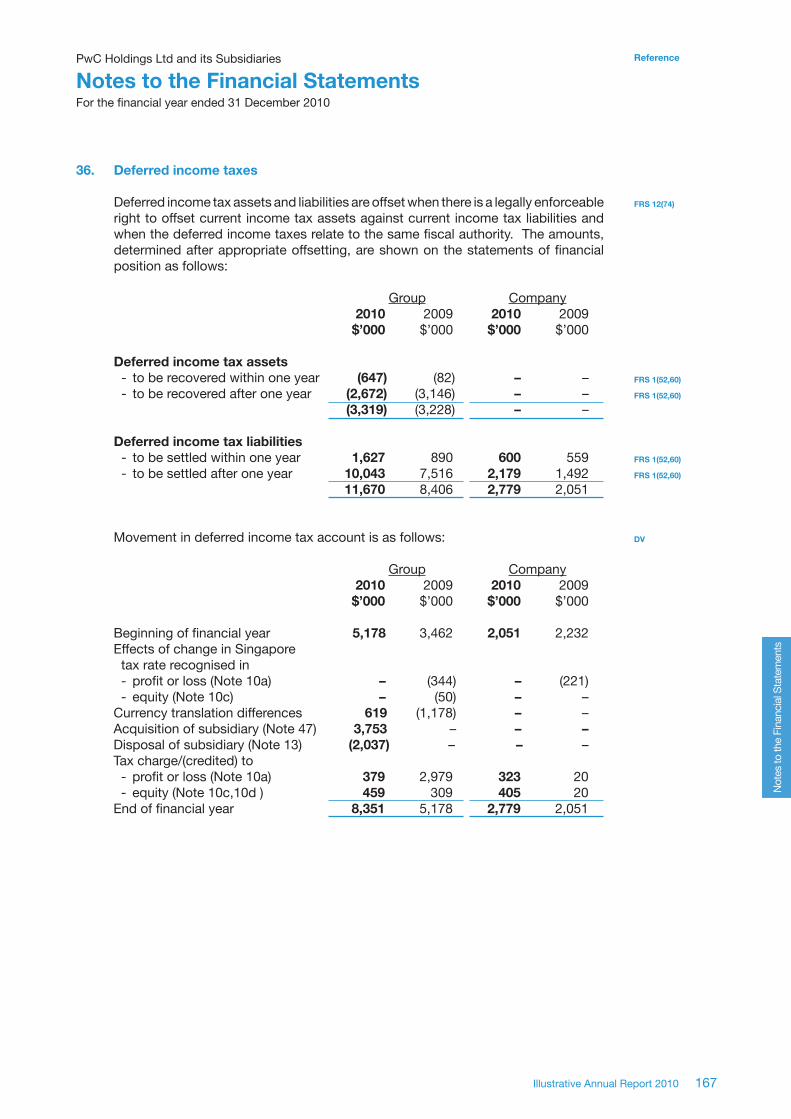
PwC Holdings Ltd and its Subsidiaries
Notes to the Financial StatementsFor the financial year ended 31 December 2010
167Illustrative Annual Report 2010
Reference
Not
es to
the
Fina
ncia
l Sta
tem
ents
FRS 12(74)
FRS 1(52,60)
FRS 1(52,60)
FRS 1(52,60)
FRS 1(52,60)
DV
36. Deferred income taxes
Deferred income tax assets and liabilities are offset when there is a legally enforceable right to offset current income tax assets against current income tax liabilities and when the deferred income taxes relate to the same fiscal authority. The amounts, determined after appropriate offsetting, are shown on the statements of financial position as follows: Group Company 2010 2009 2010 2009 $’000 $’000 $’000 $’000
Deferred income tax assets - to be recovered within one year (647) (82) – – - to be recovered after one year (2,672) (3,146) – – (3,319) (3,228) – – Deferred income tax liabilities - to be settled within one year 1,627 890 600 559 - to be settled after one year 10,043 7,516 2,179 1,492 11,670 8,406 2,779 2,051
Movement in deferred income tax account is as follows: Group Company 2010 2009 2010 2009 $’000 $’000 $’000 $’000
Beginning of financial year 5,178 3,462 2,051 2,232Effects of change in Singapore tax rate recognised in - profit or loss (Note 10a) – (344) – (221) - equity (Note 10c) – (50) – – Currency translation differences 619 (1,178) – – Acquisition of subsidiary (Note 47) 3,753 – – – Disposal of subsidiary (Note 13) (2,037) – – – Tax charge/(credited) to - profit or loss (Note 10a) 379 2,979 323 20 - equity (Note 10c,10d ) 459 309 405 20End of financial year 8,351 5,178 2,779 2,051

168
ReferencePwC Holdings Ltd and its Subsidiaries
Notes to the Financial StatementsFor the financial year ended 31 December 2010
Not
es to
the
Fina
ncia
l Sta
tem
ents
FRS 12(82)
FRS 12(81)(e)
FRS 12(81)(f)
36. Deferred income taxes (continued)
Deferred income tax assets are recognised for tax losses and capital allowances carried forward to the extent that realisation of the related tax benefits through future taxable profits is probable. The Group has unrecognised tax losses of $5,000,000 (2009: $5,244,000) and capital allowances of $400,000 (2009: $544,000) at the balance sheet date which can be carried forward and used to offset against future taxable income subject to meeting certain statutory requirements by those companies with unrecognised tax losses and capital allowances in their respective countries of incorporation. The tax losses have no expiry date except for an amount of $213,000 which will expire in 2011. The capital allowances will expire between 2012 and 2013.
Deferred income tax liabilities of $170,000 (2009: $127,500) have not been recognised for the withholding and other taxes that will be payable on the earnings of an overseas subsidiary when remitted to the holding company. These unremitted earnings are permanently reinvested and amount to $2,000,000 (2009: $1,500,000) at the balance sheet date.
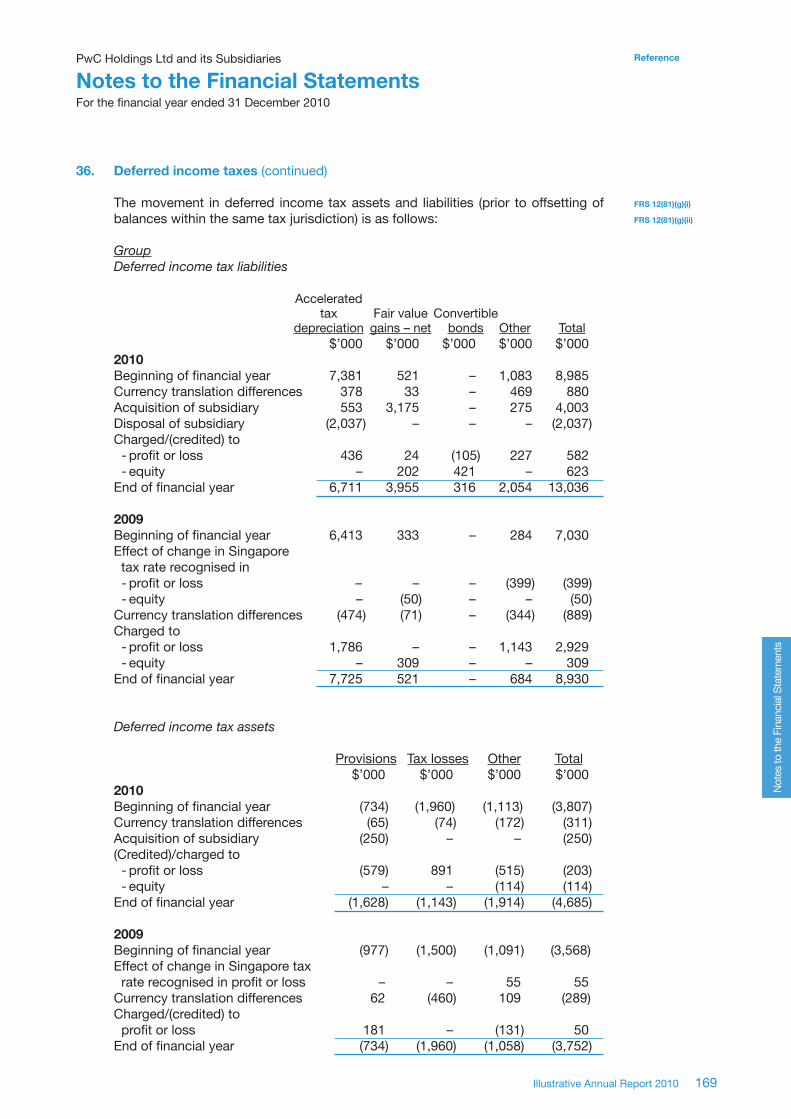
PwC Holdings Ltd and its Subsidiaries
Notes to the Financial StatementsFor the financial year ended 31 December 2010
169Illustrative Annual Report 2010
Reference
Not
es to
the
Fina
ncia
l Sta
tem
ents
36. Deferred income taxes (continued)
The movement in deferred income tax assets and liabilities (prior to offsetting of balances within the same tax jurisdiction) is as follows:
GroupDeferredincometaxliabilities
Accelerated tax Fair value Convertible depreciation gains – net bonds Other Total
$’000 $’000 $’000 $’000 $’000 2010 Beginning of financial year 7,381 521 – 1,083 8,985Currency translation differences 378 33 – 469 880Acquisition of subsidiary 553 3,175 – 275 4,003Disposal of subsidiary (2,037) – – – (2,037)Charged/(credited) to - profit or loss 436 24 (105) 227 582 - equity – 202 421 – 623End of financial year 6,711 3,955 316 2,054 13,036 2009 Beginning of financial year 6,413 333 – 284 7,030Effect of change in Singapore tax rate recognised in - profit or loss – – – (399) (399) - equity – (50) – – (50)Currency translation differences (474) (71) – (344) (889)Charged to - profit or loss 1,786 – – 1,143 2,929 - equity – 309 – – 309End of financial year 7,725 521 – 684 8,930
Deferredincometaxassets Provisions Tax losses Other Total $’000 $’000 $’000 $’0002010 Beginning of financial year (734) (1,960) (1,113) (3,807)Currency translation differences (65) (74) (172) (311)Acquisition of subsidiary (250) – – (250)(Credited)/charged to - profit or loss (579) 891 (515) (203) - equity – – (114) (114)End of financial year (1,628) (1,143) (1,914) (4,685) 2009 Beginning of financial year (977) (1,500) (1,091) (3,568)Effect of change in Singapore tax rate recognised in profit or loss – – 55 55Currency translation differences 62 (460) 109 (289)Charged/(credited) to profit or loss 181 – (131) 50End of financial year (734) (1,960) (1,058) (3,752)
FRS 12(81)(g)(i)
FRS 12(81)(g)(ii)

170
ReferencePwC Holdings Ltd and its Subsidiaries
Notes to the Financial StatementsFor the financial year ended 31 December 2010
Not
es to
the
Fina
ncia
l Sta
tem
ents
36. Deferred income taxes (continued)
Company
Deferredincometaxliabilities
Accelerated tax Fair value Convertible depreciation gains – net Bonds Total $’000 $’000 $’000 $’0002010 Beginning of financial year 2,014 82 – 2,096Charged to - profit or loss 366 – 21 387 - equity – 4 421 425End of financial year 2,380 86 442 2,908 2009 Beginning of financial year 2,175 68 – 2,243Effect of change in Singapore tax rate recognised in profit or loss (217) (6) – (223)Charged to - profit or loss 56 – – 56 - equity – 20 – 20End of financial year 2,014 82 – 2,096
Deferredincometaxassets Provisions Other Total $’000 $’000 $’0002010 Beginning of financial year (41) (4) (45)Charged/(credited) to - profit or loss 17 (81) (64) - equity – (20) (20)End of financial year (24) (105) (129) 2009 Beginning of financial year (17) 6 (11)Effect of change in Singapore tax rate recognised in profit or loss 2 – 2Credited to profit or loss (26) (10) (36)End of financial year (41) (4) (45)
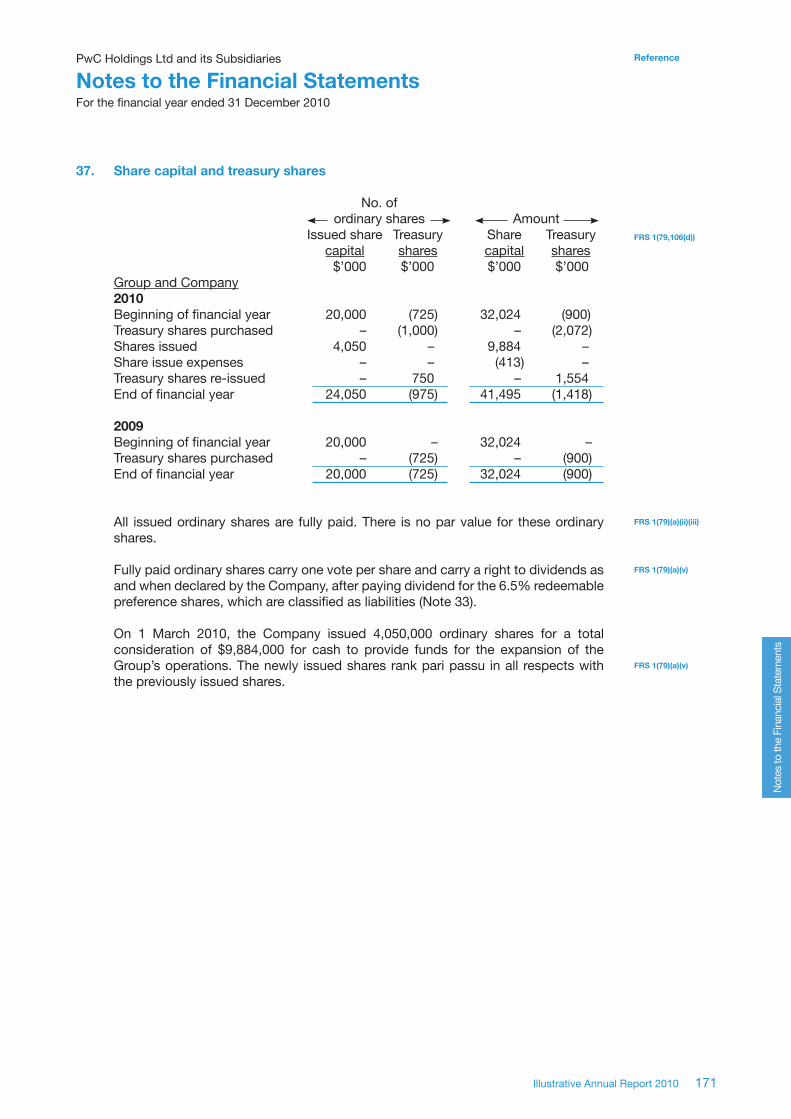
PwC Holdings Ltd and its Subsidiaries
Notes to the Financial StatementsFor the financial year ended 31 December 2010
171Illustrative Annual Report 2010
Reference
Not
es to
the
Fina
ncia
l Sta
tem
ents
37. Share capital and treasury shares
No. of ordinary shares Amount Issued share Treasury Share Treasury capital shares capital shares $’000 $’000 $’000 $’000Group and Company 2010 Beginning of financial year 20,000 (725) 32,024 (900)Treasury shares purchased – (1,000) – (2,072)Shares issued 4,050 – 9,884 –Share issue expenses – – (413) –Treasury shares re-issued – 750 – 1,554End of financial year 24,050 (975) 41,495 (1,418) 2009 Beginning of financial year 20,000 – 32,024 – Treasury shares purchased – (725) – (900)End of financial year 20,000 (725) 32,024 (900)
All issued ordinary shares are fully paid. There is no par value for these ordinary shares.
Fully paid ordinary shares carry one vote per share and carry a right to dividends as and when declared by the Company, after paying dividend for the 6.5% redeemable preference shares, which are classified as liabilities (Note 33).
On 1 March 2010, the Company issued 4,050,000 ordinary shares for a total consideration of $9,884,000 for cash to provide funds for the expansion of the Group’s operations. The newly issued shares rank pari passu in all respects with the previously issued shares.
FRS 1(79,106(d))
FRS 1(79)(a)(ii)(iii)
FRS 1(79)(a)(v)
FRS 1(79)(a)(v)
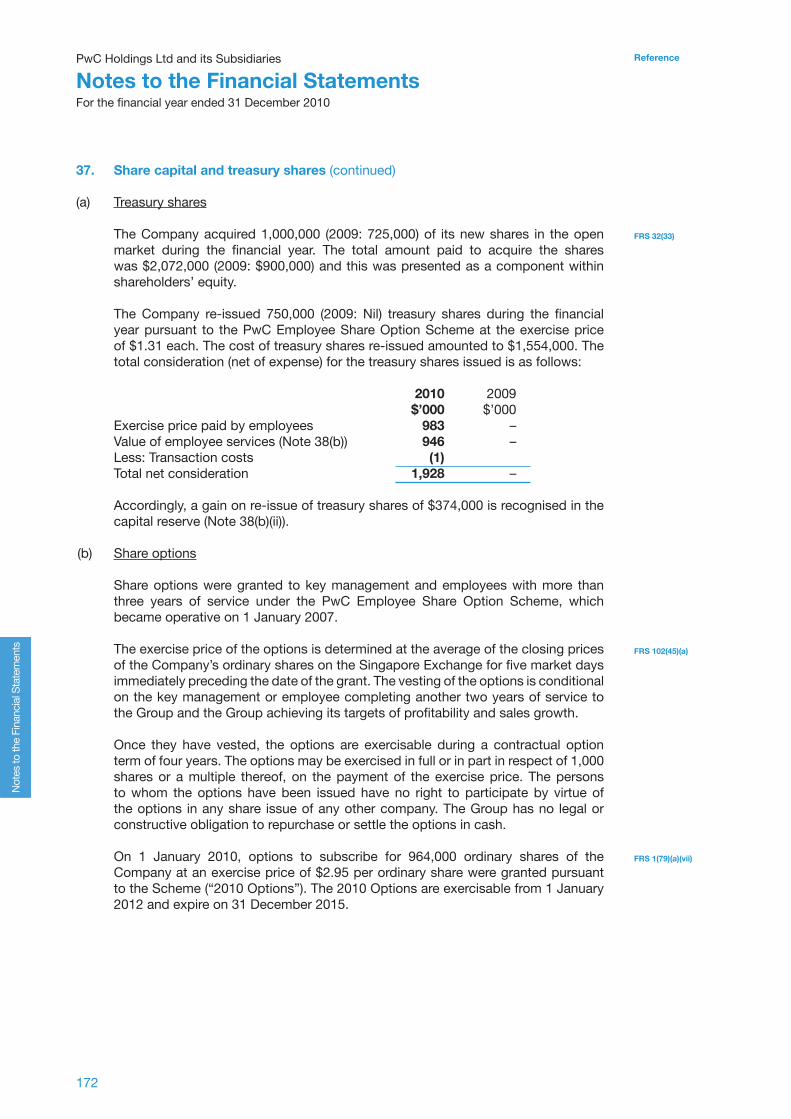
172
ReferencePwC Holdings Ltd and its Subsidiaries
Notes to the Financial StatementsFor the financial year ended 31 December 2010
Not
es to
the
Fina
ncia
l Sta
tem
ents
37. Share capital and treasury shares (continued)
(a) Treasury shares
The Company acquired 1,000,000 (2009: 725,000) of its new shares in the open market during the financial year. The total amount paid to acquire the shares was $2,072,000 (2009: $900,000) and this was presented as a component within shareholders’ equity.
The Company re-issued 750,000 (2009: Nil) treasury shares during the financial year pursuant to the PwC Employee Share Option Scheme at the exercise price of $1.31 each. The cost of treasury shares re-issued amounted to $1,554,000. The total consideration (net of expense) for the treasury shares issued is as follows:
2010 2009 $’000 $’000Exercise price paid by employees 983 –Value of employee services (Note 38(b)) 946 –Less: Transaction costs (1) Total net consideration 1,928 –
Accordingly, a gain on re-issue of treasury shares of $374,000 is recognised in the capital reserve (Note 38(b)(ii)).
(b) Share options
Share options were granted to key management and employees with more than three years of service under the PwC Employee Share Option Scheme, which became operative on 1 January 2007.
The exercise price of the options is determined at the average of the closing prices of the Company’s ordinary shares on the Singapore Exchange for five market days immediately preceding the date of the grant. The vesting of the options is conditional on the key management or employee completing another two years of service to the Group and the Group achieving its targets of profitability and sales growth.
Once they have vested, the options are exercisable during a contractual option term of four years. The options may be exercised in full or in part in respect of 1,000 shares or a multiple thereof, on the payment of the exercise price. The persons to whom the options have been issued have no right to participate by virtue of the options in any share issue of any other company. The Group has no legal or constructive obligation to repurchase or settle the options in cash.
On 1 January 2010, options to subscribe for 964,000 ordinary shares of the Company at an exercise price of $2.95 per ordinary share were granted pursuant to the Scheme (“2010 Options”). The 2010 Options are exercisable from 1 January 2012 and expire on 31 December 2015.
FRS 32(33)
FRS 102(45)(a)
FRS 1(79)(a)(vii)
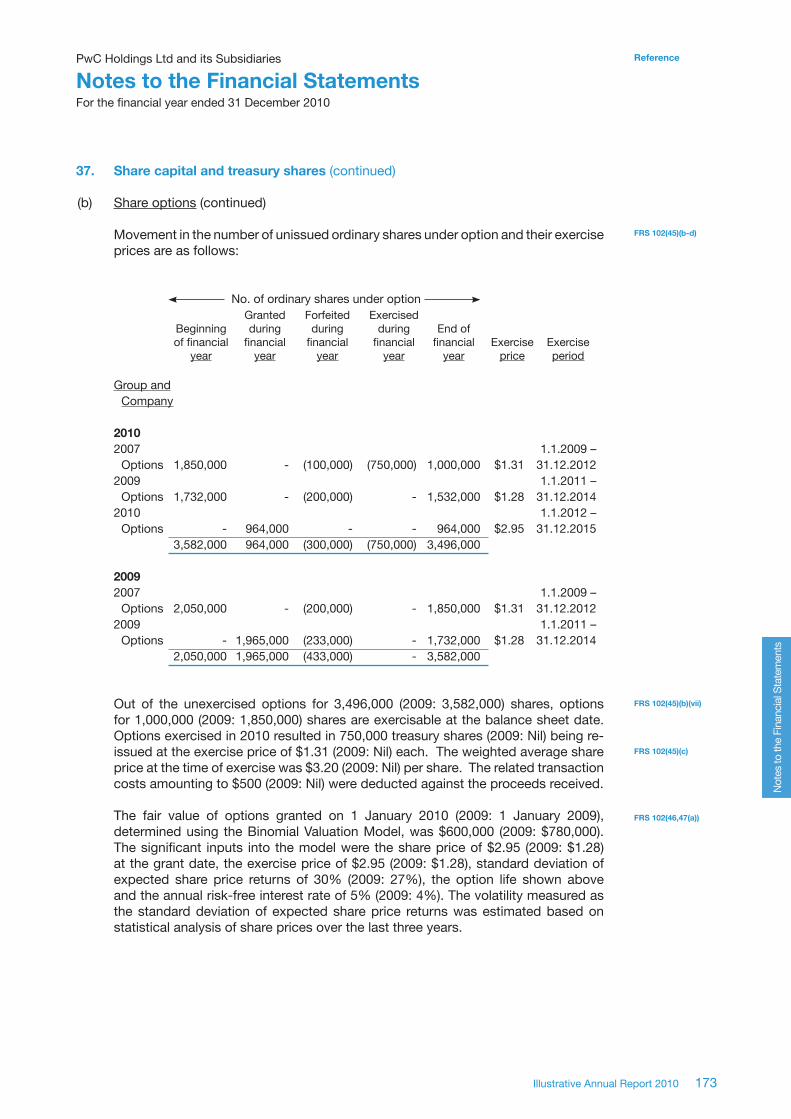
PwC Holdings Ltd and its Subsidiaries
Notes to the Financial StatementsFor the financial year ended 31 December 2010
173Illustrative Annual Report 2010
Reference
Not
es to
the
Fina
ncia
l Sta
tem
ents
37. Share capital and treasury shares (continued)
(b) Share options (continued)
Movement in the number of unissued ordinary shares under option and their exercise prices are as follows:
No. of ordinary shares under option Granted Forfeited Exercised Beginning during during during End of of financial financial financial financial financial Exercise Exercise year year year year year price period Group and Company
2010 2007 1.1.2009 – Options 1,850,000 - (100,000) (750,000) 1,000,000 $1.31 31.12.20122009 1.1.2011 – Options 1,732,000 - (200,000) - 1,532,000 $1.28 31.12.20142010 1.1.2012 – Options - 964,000 - - 964,000 $2.95 31.12.2015 3,582,000 964,000 (300,000) (750,000) 3,496,000 2009 2007 1.1.2009 – Options 2,050,000 - (200,000) - 1,850,000 $1.31 31.12.20122009 1.1.2011 – Options - 1,965,000 (233,000) - 1,732,000 $1.28 31.12.2014 2,050,000 1,965,000 (433,000) - 3,582,000
Out of the unexercised options for 3,496,000 (2009: 3,582,000) shares, options for 1,000,000 (2009: 1,850,000) shares are exercisable at the balance sheet date. Options exercised in 2010 resulted in 750,000 treasury shares (2009: Nil) being re-issued at the exercise price of $1.31 (2009: Nil) each. The weighted average share price at the time of exercise was $3.20 (2009: Nil) per share. The related transaction costs amounting to $500 (2009: Nil) were deducted against the proceeds received.
The fair value of options granted on 1 January 2010 (2009: 1 January 2009), determined using the Binomial Valuation Model, was $600,000 (2009: $780,000). The significant inputs into the model were the share price of $2.95 (2009: $1.28) at the grant date, the exercise price of $2.95 (2009: $1.28), standard deviation of expected share price returns of 30% (2009: 27%), the option life shown above and the annual risk-free interest rate of 5% (2009: 4%). The volatility measured as the standard deviation of expected share price returns was estimated based on statistical analysis of share prices over the last three years.
FRS 102(45)(b-d)
FRS 102(45)(b)(vii)
FRS 102(45)(c)
FRS 102(46,47(a))

174
ReferencePwC Holdings Ltd and its Subsidiaries
Notes to the Financial StatementsFor the financial year ended 31 December 2010
Not
es to
the
Fina
ncia
l Sta
tem
ents
FRS 1(106)(d)
FRS 1(106)(d)
FRS 1(106)(d)
FRS 1(106)(d)
FRS 107(20)(a)(ii)
FRS 12(81)(a)
FRS 1(91)
FRS 107(20)(a)(ii)
FRS 12(81)(a)
FRS 1(91)
38. Other reserves
Group Company 2010 2009 2010 2009 $’000 $’000 $’000 $’000
(a) Composition: Share option reserve 1,636 1,892 1,636 1,892Capital reserve 488 – 394 –Fair value reserve 572 127 96 130Hedging reserve 87 24 62 12Currency translation reserve 2,958 2,376 – –Equity component of convertible bonds 1,685 – 1,685 –Asset revaluation reserve 2,202 2,000 – – 9,628 6,419 3,873 2,034
(b) Movements: (i) Share option reserve Beginning of financial year 1,892 1,270 1,892 1,270 Employee share option scheme - Value of employee services (Note 6) 690 622 690 622 - Shares options exercised (Note 37(a)) (946) – (946) – End of financial year 1,636 1,892 1,636 1,892 (ii) Capital reserve Beginning of financial year – – – – Gain on re-issue of treasury shares (Note 37(a)) 374 – 374 – Tax on employee share option scheme5 114 – 20 – End of financial year 488 – 394 – (iii) Fair value reserve Beginning of financial year 127 55 130 55 Effect of change in Singapore tax rate – 5 – –* Financial assets, available-for- sale - Fair value gains/(losses) (Note 16) 710 88 (34) 94 - Tax on fair value changes (128) (21) 6 (19) 582 67 (28) 75 Share of associated companies’ fair value gains on financial assets, available-for-sale, net of tax (Note 23) 27 – – – Reclassification to profit or loss (Note 8) (200) – (7) – Tax on reclassification 36 – 1 – (164) – (6) – End of financial year 572 127 96 130
*Lessthan$1,000

PwC Holdings Ltd and its Subsidiaries
Notes to the Financial StatementsFor the financial year ended 31 December 2010
175Illustrative Annual Report 2010
Reference
Not
es to
the
Fina
ncia
l Sta
tem
ents
FRS 1(106)(d)
FRS 107(23)(c)
FRS 12(81)(a)
FRS 107(23)(d)
FRS 107(23)(d)
FRS 107(23)(e)
FRS 107(23)(e)
FRS 12(81)(a)
FRS 1(106)(d)
FRS 21(52)(b)
FRS 1(106)(d)
FRS 12(81)(a)
38. Other reserves (continued)
(b) Movements: (continued)
Group Company 2010 2009 2010 2009 $’000 $’000 $’000 $’000(iv) Hedging reserve Beginning of financial year 24 8 12 6 Effect of change in Singapore tax rate – 3 – –* Fair value gains 417 414 71 16 Tax on fair value gains (75) (86) (13) (3) 342 328 58 13
Reclassification to profit or loss - Revenue (Note 4) (128) (50) – – - Finance expense (Note 9) (102) (304) (10) (9)Reclassification to inventories (60) (40) – –Reclassification to property, plant and equipment (50) – – –Tax on reclassification adjustments 61 79 2 2
(279) (315) (8) (7)
End of financial year 87 24 62 12 (v) Currency translation reserve Beginning of financial year 2,376 2,454 – – Reclassification on disposal of a subsidiary (Note 13) (1,200) – – – Net currency translation differences of financial statements of foreign subsidiaries, a joint venture and associated companies 1,878 (338) – – Net currency translation difference on borrowings designated as hedges against foreign subsidiaries1 456 220 – – Less: Non-controlling interests2 (552) 40 – – 1,782 (78) – – End of financial year 2,958 2,376 – – (vi) Equity component of convertible bonds Convertible bond – equity component (Note 32) 2,106 – 2,106 – Tax on liability component (421) – (421) – End of financial year 1,685 – 1,685 – *Lessthan$1,000

176
ReferencePwC Holdings Ltd and its Subsidiaries
Notes to the Financial StatementsFor the financial year ended 31 December 2010
Not
es to
the
Fina
ncia
l Sta
tem
ents
FRS 1(106)(d)
FRS 16(39)
FRS 12(81)(a)
FRS 16(77)(f)
FRS 1(106)(d)
FRS 21(15,32)
FRS 16(41)
FRS 12(61,68A-68C)
38. Other reserves (continued)
(b) Movements: (continued)
Group Company 2010 2009 2010 2009 $’000 $’000 $’000 $’000(vii) Asset revaluation reserve3 Beginning of financial year 2,000 1,259 – – Effect of change in Singapore tax rate – 42 – – Revaluation gains (Note 28) 253 1,133 – – Tax on revaluation gains (46) (281) – – Less: Non-controlling interests2 (5) (153) – – 202 699 – – End of financial year 2,202 2,000 – –
Other reserves are non-distributable.4
Guidance notes
Other reserves
Borrowings designated as net investment hedges1. For a monetary item that is receivable from or payable to a foreign operation for which settlement
is neither planned nor likely to occur in the foreseeable future, the item is in substance a part of the entity’s net investment in that foreign operation. Currency translation differences arising from such items shall be recognised (a) in profit or loss in the separate financial statements of the reporting entity or of the foreign operation; and (b) in a separate component of equity in the consolidated financial statements.
Non-controlling interests2. Non-controlling interests’ share of reserve movement (net of tax) should be separately disclosed,
where applicable.
Transfer of revaluation surplus on property, plant and equipment (“PPE”)3. This publication illustrates the disclosure where the entity has elected to transfer revaluation
surplus of an item of PPE directly to retained profits when that asset is derecognised. An entity can also choose to transfer the revaluation surplus to retained profits progressively as the asset is used by the entity; the amount to be transferred will then be the difference in depreciation based on the revalued amount and the depreciation based on the asset’s original cost.
Distributable reserves4. The amount of reserves that are distributable will depend on the Articles of Association of the
Company subject to any regulatory restrictions.
Tax on employee share option scheme5. With effect from the Year of Assessment 2007, companies are allowed tax deduction for costs
incurred in the purchase of treasury shares that are transferred to employees pursuant to employee share-based payment (“SBP”) arrangements. For details, please refer to the Inland Revenue Authority of Singapore circular – “Use of treasury shares to fulfil obligations under an employee equity-based remuneration scheme” issued in June 2006 and a supplemental circular issued in January 2007.
As the timing of the tax deduction and the recognition of the employee share option expense differs, FRS 12 requires the recognition of the related deferred tax asset if the deferred tax asset recognition criteria are met. For an equity-settled SBP, if the cumulative amount of tax deduction exceeds the tax effect of the related cumulative remuneration expense at the reporting date, the excess of the associated deferred tax shall be recognised directly in equity. All taxes related to cash-settled SBPs shall be recognised in profit or loss.
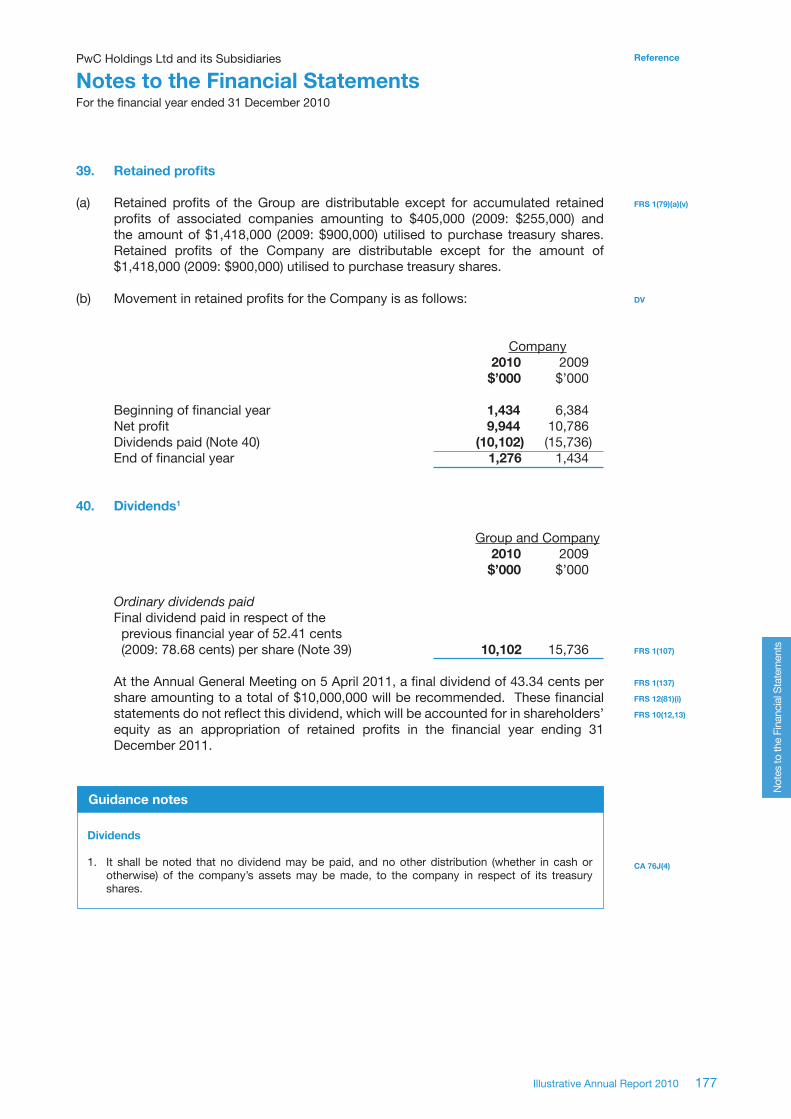
PwC Holdings Ltd and its Subsidiaries
Notes to the Financial StatementsFor the financial year ended 31 December 2010
177Illustrative Annual Report 2010
Reference
Not
es to
the
Fina
ncia
l Sta
tem
ents
39. Retained profits
(a) Retained profits of the Group are distributable except for accumulated retained profits of associated companies amounting to $405,000 (2009: $255,000) and the amount of $1,418,000 (2009: $900,000) utilised to purchase treasury shares. Retained profits of the Company are distributable except for the amount of $1,418,000 (2009: $900,000) utilised to purchase treasury shares.
(b) Movement in retained profits for the Company is as follows:
Company 2010 2009 $’000 $’000
Beginning of financial year 1,434 6,384 Net profit 9,944 10,786 Dividends paid (Note 40) (10,102) (15,736) End of financial year 1,276 1,434
40. Dividends1
Group and Company 2010 2009 $’000 $’000
Ordinarydividendspaid Final dividend paid in respect of the previous financial year of 52.41 cents (2009: 78.68 cents) per share (Note 39) 10,102 15,736 At the Annual General Meeting on 5 April 2011, a final dividend of 43.34 cents per
share amounting to a total of $10,000,000 will be recommended. These financial statements do not reflect this dividend, which will be accounted for in shareholders’ equity as an appropriation of retained profits in the financial year ending 31 December 2011.
Guidance notes
Dividends
1. It shall be noted that no dividend may be paid, and no other distribution (whether in cash or otherwise) of the company’s assets may be made, to the company in respect of its treasury shares.
FRS 1(79)(a)(v)
DV
FRS 1(107)
FRS 1(137)
FRS 12(81)(i)
FRS 10(12,13)
CA 76J(4)

178
ReferencePwC Holdings Ltd and its Subsidiaries
Notes to the Financial StatementsFor the financial year ended 31 December 2010
Not
es to
the
Fina
ncia
l Sta
tem
ents
41. Contingencies
(a) Contingent liabilities
Contingent liabilities, excluding those relating to business combinations (Note 47), investments in associated companies (Note 23) and the investment in a joint venture (Note 24), of which the probability of settlement is not remote at the balance sheet date, are as follows:
Group A claim for unspecified quantum of damages was lodged by a customer during
the financial year against a subsidiary and certain of its executives in respect of damages allegedly caused by the use of furniture supplied by the subsidiary. The subsidiary has disclaimed the liability and is defending the action. Legal advice obtained indicates that it is unlikely that any significant liability will arise. At the date of these financial statements, the directors are of the view that no material losses will arise in respect of the legal claim.
Company The Company has issued corporate guarantees to banks for borrowings of
certain subsidiaries with net liability positions. These bank borrowings amount to $16,000,000 (2009: Nil) at the balance sheet date.
(b) Contingent assets
In respect of the disposal of PwC Logistics Pte Ltd (“PwC Logistics”) on 28 June 2010 (Note 8), the Group will receive additional consideration of $70,000 if the net profit of PwC Logistics for the 18-month period ending 31 December 2011 exceeds $200,000.
FRS 37(86)
FRS 37(89)
FRS 16(74)(c)
FRS 38(122)(e)
42. Commitments
(a) Capital commitments
Capital expenditures contracted for at the balance sheet date but not recognised in the financial statements, excluding those relating to investments in associated companies (Note 23) and investment in a joint venture (Note 24), are as follows:
Group Company 2010 2009 2010 2009 $’000 $’000 $’000 $’000
Property, plant and equipment 4,193 4,117 800 600Intangible assets 460 474 200 100 4,653 4,591 1,000 700

PwC Holdings Ltd and its Subsidiaries
Notes to the Financial StatementsFor the financial year ended 31 December 2010
179Illustrative Annual Report 2010
Reference
Not
es to
the
Fina
ncia
l Sta
tem
ents
FRS 17(35)(d)
FRS 17(35)(a)(i)
FRS 17(35)(a)(ii)
FRS 17(35)(a)(iii)
FRS 17(56)(c)
FRS 17(56)(a)(i)
FRS 17(56)(a)(ii)
FRS 17(56)(a)(iii)
42. Commitments (continued)
(b) Operating lease commitments – where the Group is a lessee
The Group leases land, factories and warehouses from non-related parties under non-cancellable operating lease agreements. The leases have varying terms, escalation clauses and renewal rights1.
The future minimum lease payables under non-cancellable operating leases contracted for at the balance sheet date but not recognised as liabilities, are as follows:
Group 2010 2009 $’000 $’000
Not later than one year 11,664 10,204 Between one and five years 45,651 45,651 Later than five years 15,710 27,774 73,025 83,629
(c) Operating lease commitments – where the Group is a lessor
The Group and Company lease out retail space to non-related parties under non-cancellable operating leases. The lessees are required to pay either absolute fixed annual increases to the lease payments or contingent rents computed based on their sales achieved during the lease period.
The future minimum lease receivables under non-cancellable operating leases contracted for at the balance sheet date but not recognised as receivables, are as follows:
Group and Company 2009 2008 $’000 $’000
Not later than one year 348 52 Between one and five years 182 – Later than five years – – 530 52
Guidance notes
Commitments
Significant leasing arrangements1. When a lessee has significant leasing arrangements, the entity is required to disclose a general
description of the arrangement, such as the basis of contingent rent, the existence and terms of renewal/purchase options and escalation clauses, and any restrictions imposed (i.e. restrictions on dividends, additional debt, further leasing).
FRS 17(35)(d)

180
ReferencePwC Holdings Ltd and its Subsidiaries
Notes to the Financial StatementsFor the financial year ended 31 December 2010
Not
es to
the
Fina
ncia
l Sta
tem
ents
43. Financial risk management1
Financial risk factors The Group’s activities expose it to market risk (including currency risk, interest rate
risk and price risk), credit risk and liquidity risk. The Group’s overall risk management strategy seeks to minimise any adverse effects from the unpredictability of financial markets on the Group’s financial performance. The Group uses financial instruments such as currency forwards, interest rate swaps and foreign currency borrowings to hedge certain financial risk exposures.
The Board of Directors is responsible for setting the objectives and underlying
principles of financial risk management for the Group. The Financial Risk Management Committee (“FRMC”) then establishes the detailed policies such as authority levels, oversight responsibilities, risk identification and measurement, exposure limits and hedging strategies, in accordance with the objectives and underlying principles approved by the Board of Directors.
Financial risk management is carried out by a central treasury department (“Group Treasury”) in accordance with the policies set by the FRMC. The trading team of Group Treasury identifies, evaluates and hedges financial risks in close co-operation with the Group’s operating units. The reporting team of Group Treasury measures actual exposures against the limits set and prepares daily reports for review by the Heads of Group Treasury and each operating unit. Regular reports are also submitted to the FRMC and the Board of Directors.
(a) Market risk
(i) Currencyrisk
The Group operates in Asia with dominant operations in Singapore, China and the Philippines. Entities in the Group regularly transact in currencies other than their respective functional currencies (“foreign currencies”).
Currency risk arises within entities in the Group when transactions are denominated in foreign currencies such as the Singapore Dollar (“SGD”), United States Dollar (“USD”) and Chinese Renminbi (“RMB”). To manage the currency risk, individual Group entities enter into currency forwards with Group Treasury. Group Treasury in turn manages the overall currency exposure mainly by entering into currency forwards with banks.
Group Treasury’s risk management policy is to hedge between 60% and 80% of highly probable forecast transactions (mainly export sales and import purchases) in the next three months and approximately 90% of firm commitments denominated in foreign currencies.
In addition, the Group is exposed to currency translation risk on the net assets in foreign operations. Currency exposure to the net assets of the Group’s foreign operations in China, the Philippines, Hong Kong and Thailand are managed primarily through borrowings denominated in the relevant foreign currencies. Borrowings designated and qualified as hedges of net investments in the Group’s subsidiaries have a carrying amount of $2,986,000 (2009: $3,154,000) and a fair value of $2,577,000 (2009: $3,121,000) at the balance sheet date.
FRS 107(31)
FRS 107(33)(b)
FRS 107(33)(a)
FRS 107(33)(b)
FRS 107(22)(c)
FRS 107(33)(b)
FRS 107(33)(a,b)
FRS 107(22)(c)
FRS 107(22)(b)
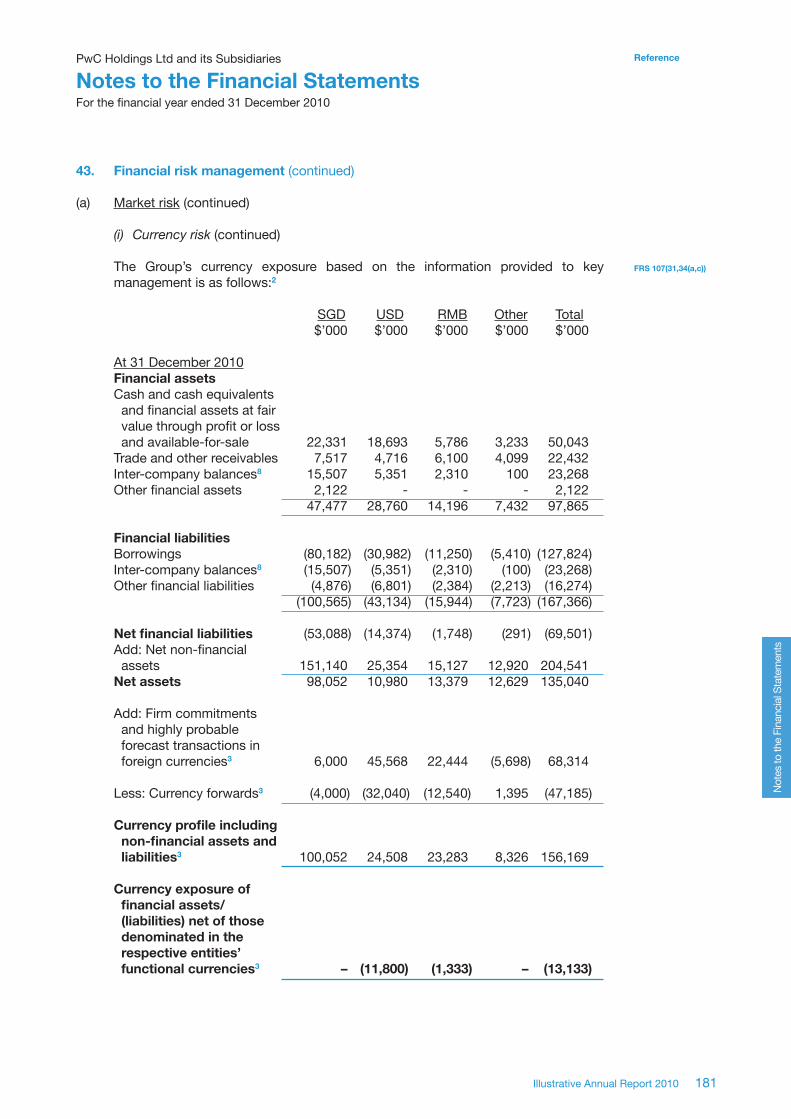
PwC Holdings Ltd and its Subsidiaries
Notes to the Financial StatementsFor the financial year ended 31 December 2010
181Illustrative Annual Report 2010
Reference
Not
es to
the
Fina
ncia
l Sta
tem
ents
43. Financial risk management (continued)
(a) Market risk (continued) (i) Currencyrisk (continued)
The Group’s currency exposure based on the information provided to key management is as follows:2
SGD USD RMB Other Total $’000 $’000 $’000 $’000 $’000
At 31 December 2010 Financial assets Cash and cash equivalents and financial assets at fair value through profit or loss and available-for-sale 22,331 18,693 5,786 3,233 50,043Trade and other receivables 7,517 4,716 6,100 4,099 22,432Inter-company balances8 15,507 5,351 2,310 100 23,268Other financial assets 2,122 - - - 2,122 47,477 28,760 14,196 7,432 97,865 Financial liabilities Borrowings (80,182) (30,982) (11,250) (5,410) (127,824)Inter-company balances8 (15,507) (5,351) (2,310) (100) (23,268)Other financial liabilities (4,876) (6,801) (2,384) (2,213) (16,274) (100,565) (43,134) (15,944) (7,723) (167,366) Net financial liabilities (53,088) (14,374) (1,748) (291) (69,501)Add: Net non-financial assets 151,140 25,354 15,127 12,920 204,541Net assets 98,052 10,980 13,379 12,629 135,040
Add: Firm commitments and highly probable forecast transactions in foreign currencies3 6,000 45,568 22,444 (5,698) 68,314
Less: Currency forwards3 (4,000) (32,040) (12,540) 1,395 (47,185) Currency profile including non-financial assets and liabilities3 100,052 24,508 23,283 8,326 156,169
Currency exposure of financial assets/ (liabilities) net of those denominated in the respective entities’ functional currencies3 – (11,800) (1,333) – (13,133)
FRS 107(31,34(a,c))

182
ReferencePwC Holdings Ltd and its Subsidiaries
Notes to the Financial StatementsFor the financial year ended 31 December 2010
Not
es to
the
Fina
ncia
l Sta
tem
ents
43. Financial risk management (continued)
(a) Market risk (continued) (i) Currencyrisk (continued)
The Group’s currency exposure based on the information provided to key management is as follows: (continued)
SGD USD RMB Other Total $’000 $’000 $’000 $’000 $’000
At 31 December 2009 Financial assets Cash and cash equivalents and financial assets at fair value through profit or loss and available-for-sale 20,762 26,419 7,003 3,291 57,475Trade and other receivables 7,050 4,001 5,300 1,933 18,284Inter-company balances 12,521 7,505 3,200 100 23,326Other financial assets 1,593 - - - 1,593 41,926 37,925 15,503 5,324 100,678Financial liabilities Borrowings (44,684) (46,736) (10,648) (2,816) (104,884)Inter-company balances (12,521) (7,505) (3,200) (100) (23,326)Other financial liabilities (5,216) (2,878) (1,540) (600) (10,234) (62,421) (57,119) (15,388) (3,516) (138,444) Net financial (liabilities)/ assets (20,495) (19,194) 115 1,808 (37,766)Add: Net non-financial assets 92,519 25,064 17,125 934 135,642Net assets 72,024 5,870 17,240 2,742 97,876 Add: Firm commitments and highly probable forecast transactions in foreign currencies3 2,000 14,893 6,000 (3,876) 19,017
Less: Currency forwards3 (1,400) (13,040) (4,540) 949 (18,031) Currency profile including non-financial assets and liabilities3 72,624 7,723 18,700 (185) 98,862
Currency exposure of financial assets/ (liabilities) net of those denominated in the respective entities’ functional currencies3 – (15,750) 100 – (15,650)
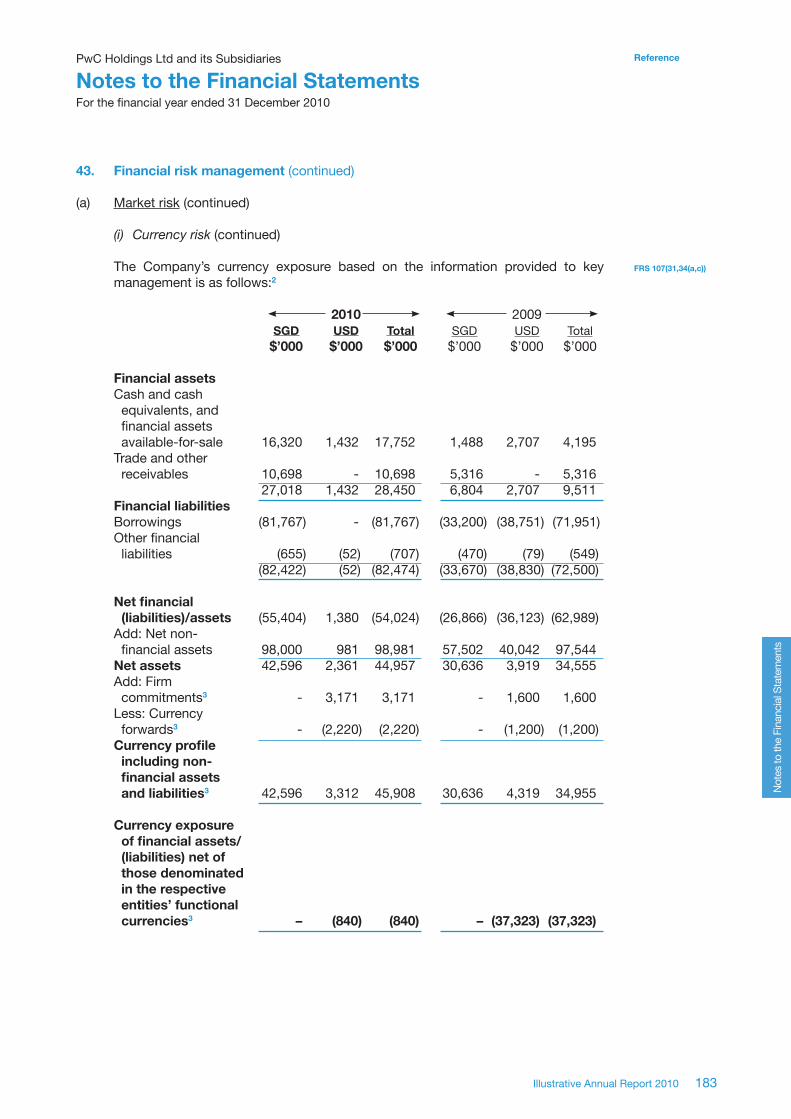
PwC Holdings Ltd and its Subsidiaries
Notes to the Financial StatementsFor the financial year ended 31 December 2010
183Illustrative Annual Report 2010
Reference
Not
es to
the
Fina
ncia
l Sta
tem
ents
43. Financial risk management (continued)
(a) Market risk (continued) (i) Currencyrisk (continued)
The Company’s currency exposure based on the information provided to key management is as follows:2
2010 2009 SGD USD Total SGD USD Total $’000 $’000 $’000 $’000 $’000 $’000 Financial assets Cash and cash equivalents, and financial assets available-for-sale 16,320 1,432 17,752 1,488 2,707 4,195Trade and other receivables 10,698 - 10,698 5,316 - 5,316 27,018 1,432 28,450 6,804 2,707 9,511Financial liabilities Borrowings (81,767) - (81,767) (33,200) (38,751) (71,951)Other financial liabilities (655) (52) (707) (470) (79) (549) (82,422) (52) (82,474) (33,670) (38,830) (72,500) Net financial (liabilities)/assets (55,404) 1,380 (54,024) (26,866) (36,123) (62,989)Add: Net non- financial assets 98,000 981 98,981 57,502 40,042 97,544Net assets 42,596 2,361 44,957 30,636 3,919 34,555Add: Firm commitments3 - 3,171 3,171 - 1,600 1,600Less: Currency forwards3 - (2,220) (2,220) - (1,200) (1,200)Currency profile including non- financial assets and liabilities3 42,596 3,312 45,908 30,636 4,319 34,955
Currency exposure of financial assets/ (liabilities) net of those denominated in the respective entities’ functional currencies3 – (840) (840) – (37,323) (37,323)
FRS 107(31,34(a,c))
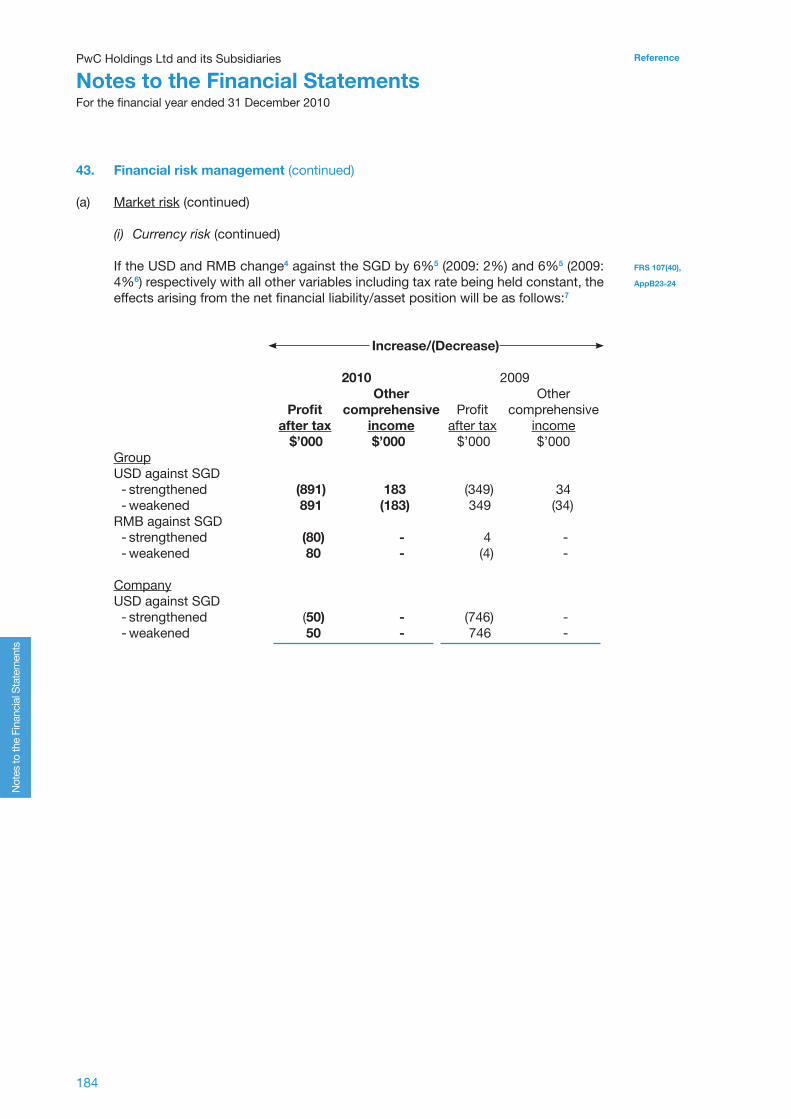
184
ReferencePwC Holdings Ltd and its Subsidiaries
Notes to the Financial StatementsFor the financial year ended 31 December 2010
Not
es to
the
Fina
ncia
l Sta
tem
ents
43. Financial risk management (continued)
(a) Market risk (continued) (i) Currencyrisk (continued)
If the USD and RMB change4 against the SGD by 6%5 (2009: 2%) and 6%5 (2009: 4%6) respectively with all other variables including tax rate being held constant, the effects arising from the net financial liability/asset position will be as follows:7
Increase/(Decrease)
2010 2009 Other Other Profit comprehensive Profit comprehensive after tax income after tax income $’000 $’000 $’000 $’000Group USD against SGD - strengthened (891) 183 (349) 34 - weakened 891 (183) 349 (34)RMB against SGD - strengthened (80) - 4 - - weakened 80 - (4) - Company USD against SGD - strengthened (50) - (746) - - weakened 50 - 746 -
FRS 107(40),
AppB23-24

PwC Holdings Ltd and its Subsidiaries
Notes to the Financial StatementsFor the financial year ended 31 December 2010
185Illustrative Annual Report 2010
Reference
Not
es to
the
Fina
ncia
l Sta
tem
ents
Guidance notes
Financial risk management – currency risk
Qualitative disclosures on currency risk1. The publication illustrates some disclosures that may be required for financial risk management.
The matters and level of detail to be disclosed depend on the circumstances and the extent of financial risks faced by the entity.
Quantitative disclosures on currency risk – based on management information 2. A reporting entity shall disclose summary quantitative data about its exposure to currency risk at
the reporting date. This disclosure shall be based on the information provided internally to key management personnel.
Quantitative disclosures on currency risk – factors considered3. This publication illustrates the disclosure where management has monitored the entity’s currency
risk exposure, taking into consideration (a) financial assets/liabilities denominated in the respective entities’ functional currencies; (b) firm commitments and highly probable forecast transactions in foreign currencies; (c) the effects of currency forwards used for hedges and held for trading; and (d) net non-financial assets of foreign subsidiaries. These are summed up in the line item “Currencyprofileincludingnon-financialassetsandliabilities”.
FRS 107 is not prescriptive in the presentation format of these quantitative disclosures. If management monitors the entity’s currency risk exposure using other basis, these line items shall be replaced as appropriate.
The line item “Currencyexposureoffinancialassets/(liabilities)netofthosedenominatedintherespectiveentities’ functionalcurrencies” measures the currency exposure under the scope of FRS 107 and is used as a basis for computing the currency sensitivity analysis required by FRS 107. This may not coincide with the currency exposure monitored by management. Disclosure of this line item is not mandated by FRS 107.
Sensitivity analysis for currency risk4. An entity shall provide sensitivity analysis for the whole of its business but may provide different
types of sensitivity analysis for different classes of financial instruments. A sensitivity analysis shall be disclosed for each currency to which an entity has significant exposure. In this publication, the entity has significant exposure to two major currencies, namely USD and RMB.
Sensitivity analysis – reasonably possible change5. In determining what a reasonably possible change in the relevant risk variables is, an entity shall
consider:
(a) the economic environments in which it operates. This shall not include remote or ‘worst case’ scenarios or ‘stress test’; and
(b) the effects of changes reasonably possible over the period until the entity next presents these disclosures (usually the next annual reporting period).
Sensitivity analysis – prior year disclosures6. In the event that the reasonably possible change in the risk variables changes, the prior year
disclosures should not be restated. However, the entity can present as additional information the sensitivity information for the comparative financial year using the new percentage for the current financial year.
Sensitivity analysis – Narrative text or tabular format 7. Instead of using a table format, the entity may disclose as follows:
“At 31 December 2010, if the USD has strengthened/weakened by [ ]% (2009: [ ]%) against the SGD with all other variables including tax rate being held constant, the Group’s and Company’s other comprehensive income will be $[ ] (2009: $[ ]) higher/lower and $[ ] (2009: $[ ]) higher/lower respectively as a result of currency translation gains/losses on securities classified as available-for-sale. The Group’s and Company’s profit after tax would have been $[ ] (2009: $[ ]) higher/lower and $[ ] (2009: $[ ]) higher/lower, as a result of currency translation gains/losses on the remaining USD-denominated financial instruments…...”
FRS 107(7)
FRS 107(34)(a)
FRS 107(34)(a)
FRS 107 AppB21
FRS 107 AppB19
FRS 107 IG36
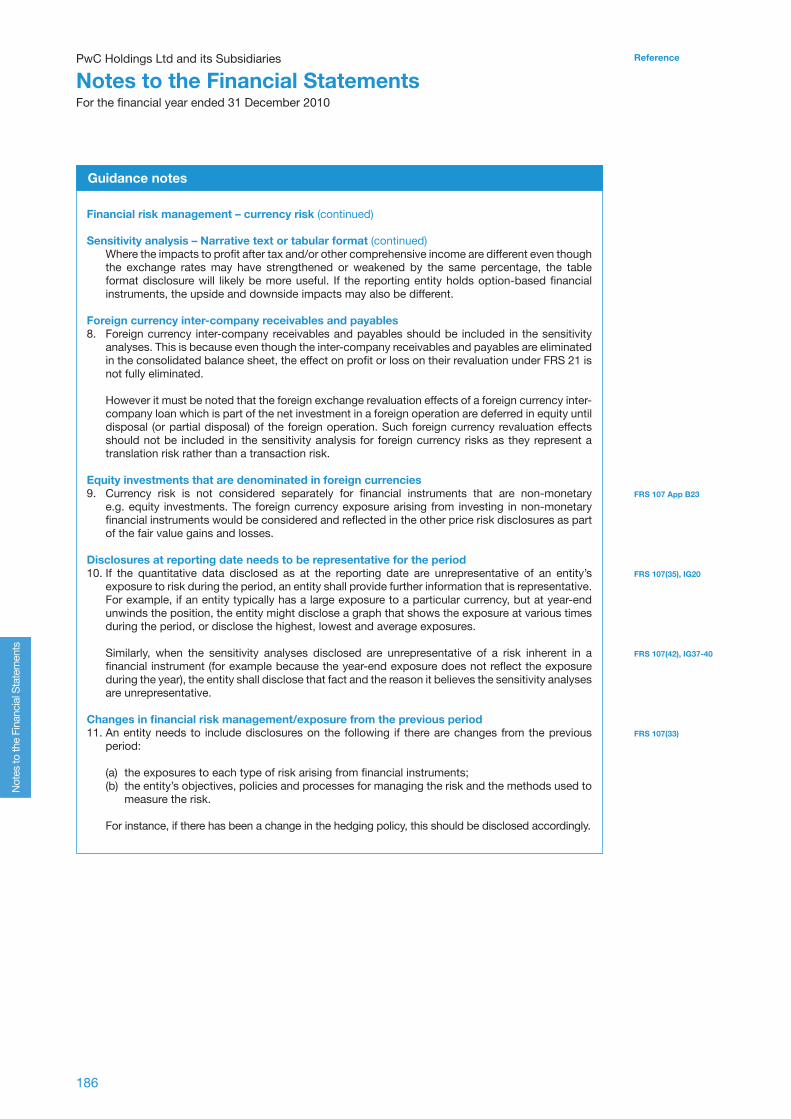
186
ReferencePwC Holdings Ltd and its Subsidiaries
Notes to the Financial StatementsFor the financial year ended 31 December 2010
Not
es to
the
Fina
ncia
l Sta
tem
ents
Guidance notes
Financial risk management – currency risk (continued)
Sensitivity analysis – Narrative text or tabular format (continued) Where the impacts to profit after tax and/or other comprehensive income are different even though
the exchange rates may have strengthened or weakened by the same percentage, the table format disclosure will likely be more useful. If the reporting entity holds option-based financial instruments, the upside and downside impacts may also be different.
Foreign currency inter-company receivables and payables8. Foreign currency inter-company receivables and payables should be included in the sensitivity
analyses. This is because even though the inter-company receivables and payables are eliminated in the consolidated balance sheet, the effect on profit or loss on their revaluation under FRS 21 is not fully eliminated.
However it must be noted that the foreign exchange revaluation effects of a foreign currency inter-company loan which is part of the net investment in a foreign operation are deferred in equity until disposal (or partial disposal) of the foreign operation. Such foreign currency revaluation effects should not be included in the sensitivity analysis for foreign currency risks as they represent a translation risk rather than a transaction risk.
Equity investments that are denominated in foreign currencies9. Currency risk is not considered separately for financial instruments that are non-monetary
e.g. equity investments. The foreign currency exposure arising from investing in non-monetary financial instruments would be considered and reflected in the other price risk disclosures as part of the fair value gains and losses.
Disclosures at reporting date needs to be representative for the period 10. If the quantitative data disclosed as at the reporting date are unrepresentative of an entity’s
exposure to risk during the period, an entity shall provide further information that is representative. For example, if an entity typically has a large exposure to a particular currency, but at year-end unwinds the position, the entity might disclose a graph that shows the exposure at various times during the period, or disclose the highest, lowest and average exposures.
Similarly, when the sensitivity analyses disclosed are unrepresentative of a risk inherent in a financial instrument (for example because the year-end exposure does not reflect the exposure during the year), the entity shall disclose that fact and the reason it believes the sensitivity analyses are unrepresentative.
Changes in financial risk management/exposure from the previous period11. An entity needs to include disclosures on the following if there are changes from the previous
period:
(a) the exposures to each type of risk arising from financial instruments; (b) the entity’s objectives, policies and processes for managing the risk and the methods used to
measure the risk.
For instance, if there has been a change in the hedging policy, this should be disclosed accordingly.
FRS 107 App B23
FRS 107(35), IG20
FRS 107(42), IG37-40
FRS 107(33)

PwC Holdings Ltd and its Subsidiaries
Notes to the Financial StatementsFor the financial year ended 31 December 2010
187Illustrative Annual Report 2010
Reference
Not
es to
the
Fina
ncia
l Sta
tem
ents
FRS 107(33)(a,b)
FRS 107(40),
AppB25-28
43. Financial risk management (continued)
(a) Market risk (continued) (ii) Price risk
The Group is exposed to equity securities price risk arising from the investments held by the Group which are classified on the consolidated balance sheet either as available-for-sale or at fair value through profit or loss. These securities are listed in Singapore and the United States. To manage its price risk arising from investments in equity securities, the Group diversifies its portfolio. Diversification of the portfolio is done in accordance with the limits set by the Group.
If prices for equity securities listed in Singapore and the United States change by 15% (2009: 6%) and 14% (2009: 6%) respectively with all other variables including tax rate being held constant, the effects on profit after tax and other comprehensive income would have been: Increase/(Decrease)
2010 2009 Other Other Profit comprehensive Profit comprehensive after tax income after tax income $’000 $’000 $’000 $’000Group Listed in Singapore - increased by 720 1,584 198 434 - decreased by (720) (1,584) (198) (434)
Listed in United States - increased by 526 408 180 88 - decreased by (712) (222) (200) (68) Company Listed in Singapore - increased by - 186 - 60 - decreased by - (186) - (60)
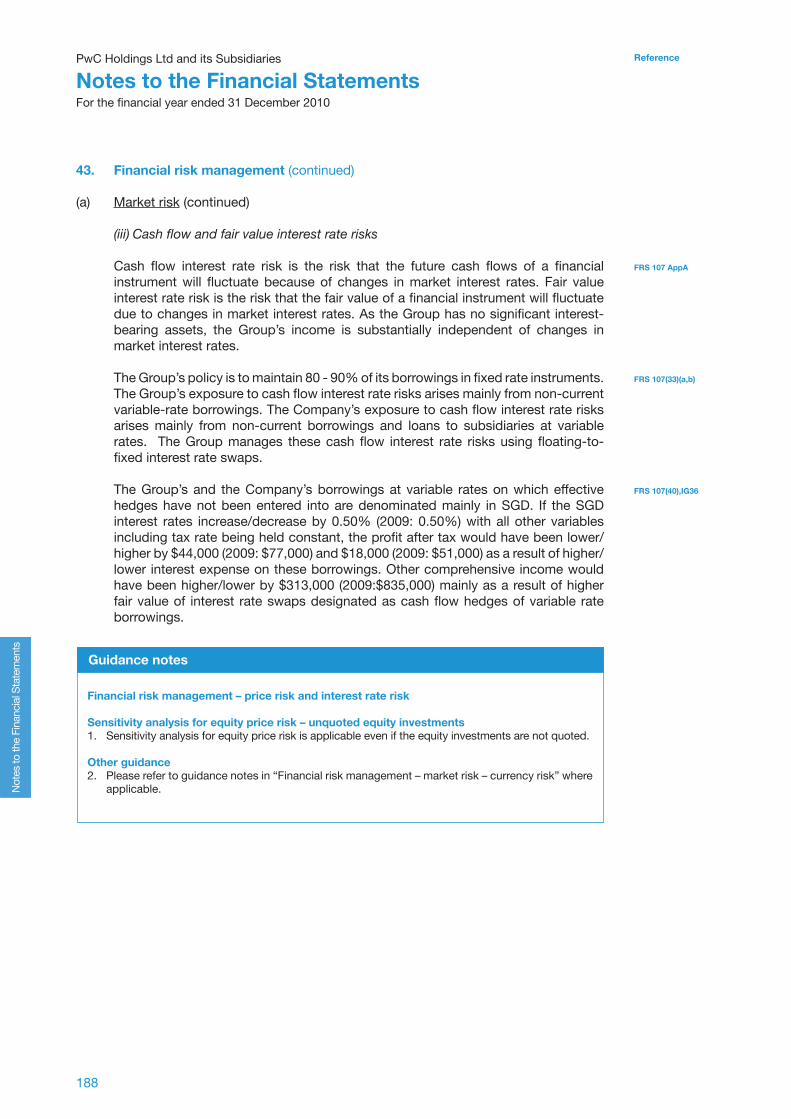
188
ReferencePwC Holdings Ltd and its Subsidiaries
Notes to the Financial StatementsFor the financial year ended 31 December 2010
Not
es to
the
Fina
ncia
l Sta
tem
ents
FRS 107 AppA
FRS 107(33)(a,b)
FRS 107(40),IG36
43. Financial risk management (continued)
(a) Market risk (continued) (iii)Cashflowandfairvalueinterestraterisks
Cash flow interest rate risk is the risk that the future cash flows of a financial instrument will fluctuate because of changes in market interest rates. Fair value interest rate risk is the risk that the fair value of a financial instrument will fluctuate due to changes in market interest rates. As the Group has no significant interest-bearing assets, the Group’s income is substantially independent of changes in market interest rates.
The Group’s policy is to maintain 80 - 90% of its borrowings in fixed rate instruments. The Group’s exposure to cash flow interest rate risks arises mainly from non-current variable-rate borrowings. The Company’s exposure to cash flow interest rate risks arises mainly from non-current borrowings and loans to subsidiaries at variable rates. The Group manages these cash flow interest rate risks using floating-to-fixed interest rate swaps.
The Group’s and the Company’s borrowings at variable rates on which effective hedges have not been entered into are denominated mainly in SGD. If the SGD interest rates increase/decrease by 0.50% (2009: 0.50%) with all other variables including tax rate being held constant, the profit after tax would have been lower/higher by $44,000 (2009: $77,000) and $18,000 (2009: $51,000) as a result of higher/lower interest expense on these borrowings. Other comprehensive income would have been higher/lower by $313,000 (2009:$835,000) mainly as a result of higher fair value of interest rate swaps designated as cash flow hedges of variable rate borrowings.
Guidance notes
Financial risk management – price risk and interest rate risk
Sensitivity analysis for equity price risk – unquoted equity investments1. Sensitivity analysis for equity price risk is applicable even if the equity investments are not quoted.
Other guidance2. Please refer to guidance notes in “Financial risk management – market risk – currency risk” where
applicable.

PwC Holdings Ltd and its Subsidiaries
Notes to the Financial StatementsFor the financial year ended 31 December 2010
189Illustrative Annual Report 2010
Reference
Not
es to
the
Fina
ncia
l Sta
tem
ents
FRS 107(33)(a,b)
FRS 107(36)(a,b)
FRS 107(34)(c)
FRS 107(34)(a)
43. Financial risk management (continued)
(b) Credit risk
Credit risk refers to the risk that counterparty will default on its contractual obligations resulting in financial loss to the Group. The major classes1 of financial assets of the Group and of the Company are bank deposits and trade receivables. For trade receivables, the Group adopts the policy of dealing only with customers of appropriate credit history, and obtaining sufficient collateral or buying credit insurance where appropriate to mitigate credit risk. For other financial assets, the Group adopts the policy of dealing only with high credit quality counterparties.
Credit exposure to an individual counterparty is restricted by credit limits that are approved by the Head of Credit Control based on ongoing credit evaluation. The counterparty’s payment profile and credit exposure are continuously monitored at the entity level by the respective management and at the Group level by the Head of Credit Control.
As the Group and the Company do not hold any collateral, the maximum exposure to credit risk for each class of financial instruments is the carrying amount of that class of financial instruments presented on the balance sheet, except as follows:
Company 2010 2009 $’000 $’000 Corporate guarantees provided to banks on subsidiaries’ loans 16,000 -
The trade receivables of the Group and of the Company comprise 5 debtors (2009: 5 debtors) and 3 debtors (2009: 3 debtors) respectively that individually represented 5 - 10% of trade receivables.
The credit risk for trade receivables based on the information provided to key management is as follows: Group Company 2010 2009 2010 2009 $’000 $’000 $’000 $’000
By geographical areas2 Singapore 7,770 7,217 3,680 1,569China 4,800 3,800 2,432 512Philippines 2,224 1,000 – –Other countries 2,125 2,509 1,400 – 16,919 14,526 7,512 2,081By types of customers2 Related parties 188 217 1,200 600Non-related parties - Multi-national companies 9,800 7,767 3,038 295 - Other companies 5,707 5,142 2,378 926 - Individuals 1,224 1,400 896 260 16,919 14,526 7,512 2,081

190
ReferencePwC Holdings Ltd and its Subsidiaries
Notes to the Financial StatementsFor the financial year ended 31 December 2010
Not
es to
the
Fina
ncia
l Sta
tem
ents
FRS 107(36)(c)
FRS 107(36)(d)
DV
FRS 107(37)(a)
FRS 107(37)(b)
FRS 107(16)
FRS 107(37)(b,c)
43. Financial risk management (continued)
(b) Credit risk (continued)
(i) Financialassetsthatareneitherpastduenorimpaired
Bank deposits that are neither past due nor impaired are mainly deposits with banks with high credit-ratings assigned by international credit-rating agencies. Trade receivables that are neither past due nor impaired are substantially companies with a good collection track record with the Group.
The Group’s and Company’s trade receivables not past due include receivables amounting to $440,000 (2009: $320,000) and $20,000 (2009: Nil) respectively that would have been past due or impaired if the terms were not re-negotiated during the financial year.
(ii) Financialassetsthatarepastdueand/orimpaired
There is no other class1 of financial assets that is past due and/or impaired except for trade receivables.
The age analysis of trade receivables past due but not impaired is as follows:
Group Company 2010 2009 2010 2009 $’000 $’000 $’000 $’000 Past due < 3 months 3,320 1,772 1,350 704Past due 3 to 6 months 1,446 654 500 205Past due over 6 months 270 154 150 66 5,036 2,580 2,000 975
The carrying amount of trade receivables individually determined to be impaired and the movement in the related allowance for impairment are as follows:3
Group Company 2010 2009 20010 2009 $’000 $’000 $’000 $’000 Past due 3 to 6 months 320 200 80 40Past over 6 months 480 400 120 40 800 600 200 80Less: Allowance for impairment (509) (470) (100) (50) 291 130 100 30 Beginning of financial year 470 438 50 40Currency translation difference (2) 1 – –Allowance made 74 61 58 17Allowance utilised (33) (30) (8) (7)End of financial year 509 470 100 50
The impaired trade receivables arise mainly from sales to a wholesaler which has suffered significant losses in its operations. Although certain goods sold to this wholesaler can be re-possessed4, it is uncertain that the wholesaler is still in possession of those goods.

PwC Holdings Ltd and its Subsidiaries
Notes to the Financial StatementsFor the financial year ended 31 December 2010
191Illustrative Annual Report 2010
Reference
Not
es to
the
Fina
ncia
l Sta
tem
ents
FRS 107(36)
FRS 107(34)
FRS 107(16)
FRS 107(38)
Guidance notes
Financial risk management – credit risk
Class versus category of financial instrument1. An entity is required to make certain credit risk exposures by class of financial instrument. A
‘class’ of financial instruments is not the same as a ‘category’ of financial instruments. Categories are defined in FRS 39 as financial assets at fair value through profit or loss, held-to-maturity investments, loans and receivables, available-for-sale financial assets, financial liabilities at fair value through profit or loss and financial liabilities measured at amortised cost.
Classes are expected to be determined at a lower level than the categories in FRS 39 and reconciled to the balance sheet as required by FRS 107(6). However, the level of detail for each class shall be determined on an entity-specific basis. Items are treated as one class when they share similar characteristics.
Quantitative disclosures on credit risk2. The quantitative disclosures on credit risk exposure shall be based on information provided
internally to key management personnel of the entity. This publication illustrates the disclosure where (a) management monitors the credit risk exposures only on the major classes of financial assets, which are bank deposits and trade receivables; and (b) the credit risk exposures on trade receivables are analysed and reported to key management by geographical areas and by types of customers. Other measures such as industry sector, credit rating and group of closely related counterparties might be used by another reporting entity.
Allowance account for credit losses3. When financial assets are impaired by credit losses and the entity records the impairment in a
separate allowance account rather than directly reducing the carrying amount of the asset, it shall disclose a reconciliation of changes in that account during the period for each class of financial assets.
Collateral and other credit enhancements obtained4. When an entity obtains financial or non-financial assets during the period by taking possession of
collateral it holds as security or calling on other credit enhancements, and such assets meet the recognition criteria in other Standards, the following disclosure can be considered:
“Duringthefinancialyear,theGroupobtainedassetsbytakingpossessionofcollateralheldassecurityasfollows:
Nature of assets Carryingamount($’000) Inventories 20 Property,plantandequipment 1,290
Repossesseditemsaresoldassoonaspracticable,withtheproceedsusedtoreduceoutstandingreceivables.Theyarepresentedwithin“othercurrentassets”onthebalancesheet”.
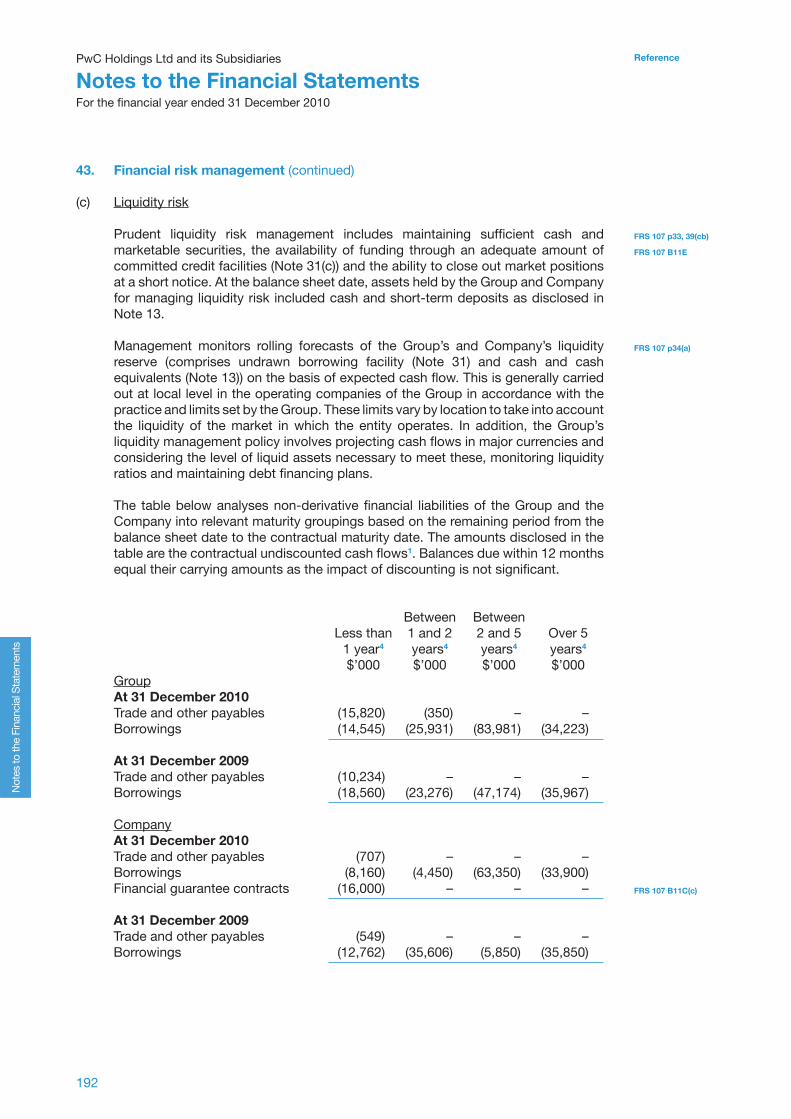
192
ReferencePwC Holdings Ltd and its Subsidiaries
Notes to the Financial StatementsFor the financial year ended 31 December 2010
Not
es to
the
Fina
ncia
l Sta
tem
ents
FRS 107 p33, 39(cb)
FRS 107 B11E
FRS 107 p34(a)
FRS 107 B11C(c)
43. Financial risk management (continued)
(c) Liquidity risk
Prudent liquidity risk management includes maintaining sufficient cash and marketable securities, the availability of funding through an adequate amount of committed credit facilities (Note 31(c)) and the ability to close out market positions at a short notice. At the balance sheet date, assets held by the Group and Company for managing liquidity risk included cash and short-term deposits as disclosed in Note 13.
Management monitors rolling forecasts of the Group’s and Company’s liquidity reserve (comprises undrawn borrowing facility (Note 31) and cash and cash equivalents (Note 13)) on the basis of expected cash flow. This is generally carried out at local level in the operating companies of the Group in accordance with the practice and limits set by the Group. These limits vary by location to take into account the liquidity of the market in which the entity operates. In addition, the Group’s liquidity management policy involves projecting cash flows in major currencies and considering the level of liquid assets necessary to meet these, monitoring liquidity ratios and maintaining debt financing plans.
The table below analyses non-derivative financial liabilities of the Group and the Company into relevant maturity groupings based on the remaining period from the balance sheet date to the contractual maturity date. The amounts disclosed in the table are the contractual undiscounted cash flows1. Balances due within 12 months equal their carrying amounts as the impact of discounting is not significant.
Between Between Less than 1 and 2 2 and 5 Over 5 1 year4 years4 years4 years4
$’000 $’000 $’000 $’000Group At 31 December 2010 Trade and other payables (15,820) (350) – –Borrowings (14,545) (25,931) (83,981) (34,223) At 31 December 2009 Trade and other payables (10,234) – – –Borrowings (18,560) (23,276) (47,174) (35,967) Company At 31 December 2010 Trade and other payables (707) – – –Borrowings (8,160) (4,450) (63,350) (33,900)Financial guarantee contracts (16,000) – – – At 31 December 2009 Trade and other payables (549) – – –Borrowings (12,762) (35,606) (5,850) (35,850)
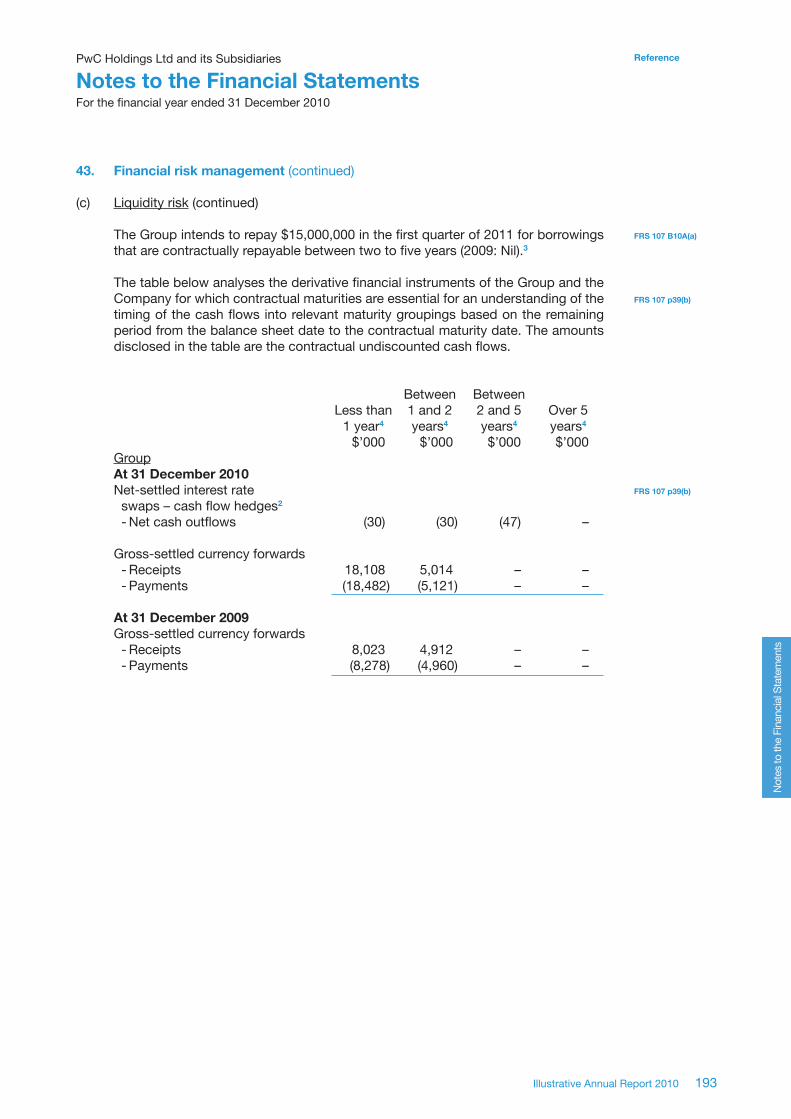
PwC Holdings Ltd and its Subsidiaries
Notes to the Financial StatementsFor the financial year ended 31 December 2010
193Illustrative Annual Report 2010
Reference
Not
es to
the
Fina
ncia
l Sta
tem
ents
FRS 107 B10A(a)
FRS 107 p39(b)
FRS 107 p39(b)
43. Financial risk management (continued)
(c) Liquidity risk (continued)
The Group intends to repay $15,000,000 in the first quarter of 2011 for borrowings that are contractually repayable between two to five years (2009: Nil).3
The table below analyses the derivative financial instruments of the Group and the Company for which contractual maturities are essential for an understanding of the timing of the cash flows into relevant maturity groupings based on the remaining period from the balance sheet date to the contractual maturity date. The amounts disclosed in the table are the contractual undiscounted cash flows. Between Between Less than 1 and 2 2 and 5 Over 5 1 year4 years4 years4 years4
$’000 $’000 $’000 $’000GroupAt 31 December 2010Net-settled interest rate swaps – cash flow hedges2 - Net cash outflows (30) (30) (47) – Gross-settled currency forwards - Receipts 18,108 5,014 – – - Payments (18,482) (5,121) – – At 31 December 2009 Gross-settled currency forwards - Receipts 8,023 4,912 – – - Payments (8,278) (4,960) – –
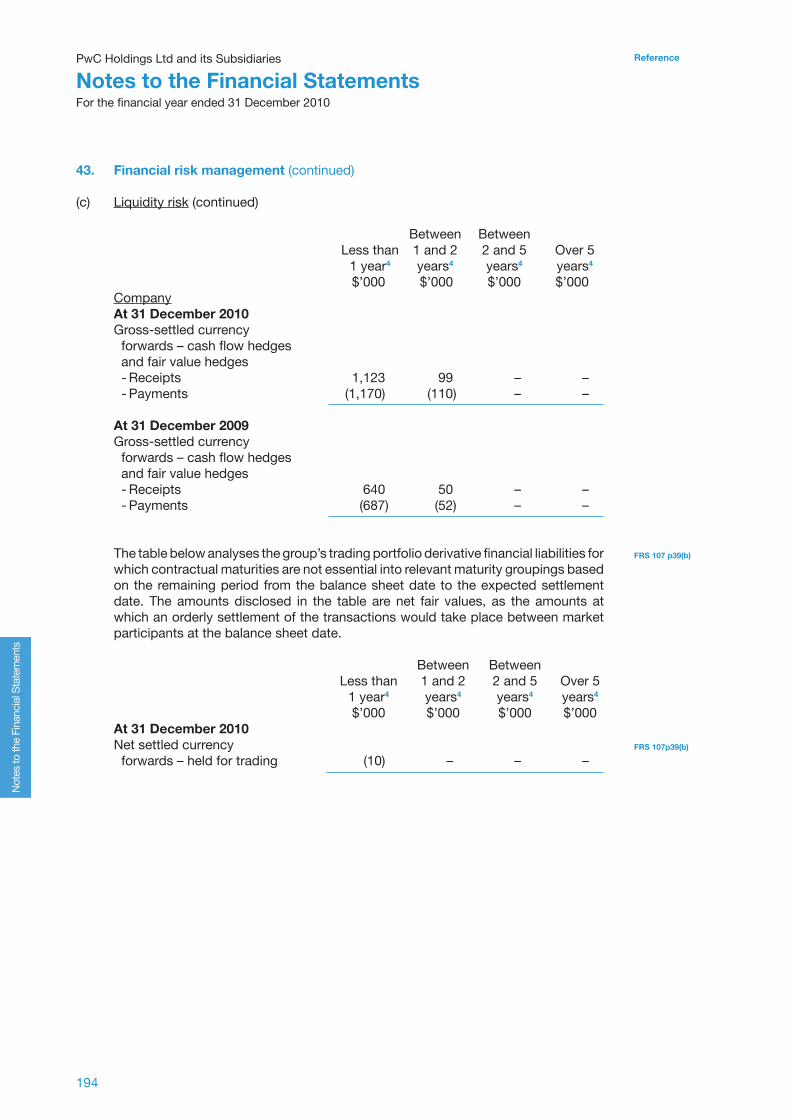
194
ReferencePwC Holdings Ltd and its Subsidiaries
Notes to the Financial StatementsFor the financial year ended 31 December 2010
Not
es to
the
Fina
ncia
l Sta
tem
ents
FRS 107 p39(b)
FRS 107p39(b)
43. Financial risk management (continued)
(c) Liquidity risk (continued) Between Between Less than 1 and 2 2 and 5 Over 5 1 year4 years4 years4 years4
$’000 $’000 $’000 $’000CompanyAt 31 December 2010Gross-settled currency forwards – cash flow hedges and fair value hedges - Receipts 1,123 99 – – - Payments (1,170) (110) – – At 31 December 2009 Gross-settled currency forwards – cash flow hedges and fair value hedges - Receipts 640 50 – – - Payments (687) (52) – –
The table below analyses the group’s trading portfolio derivative financial liabilities for which contractual maturities are not essential into relevant maturity groupings based on the remaining period from the balance sheet date to the expected settlement date. The amounts disclosed in the table are net fair values, as the amounts at which an orderly settlement of the transactions would take place between market participants at the balance sheet date.
Between Between Less than 1 and 2 2 and 5 Over 5 1 year4 years4 years4 years4
$’000 $’000 $’000 $’000At 31 December 2010Net settled currency forwards – held for trading (10) – – –
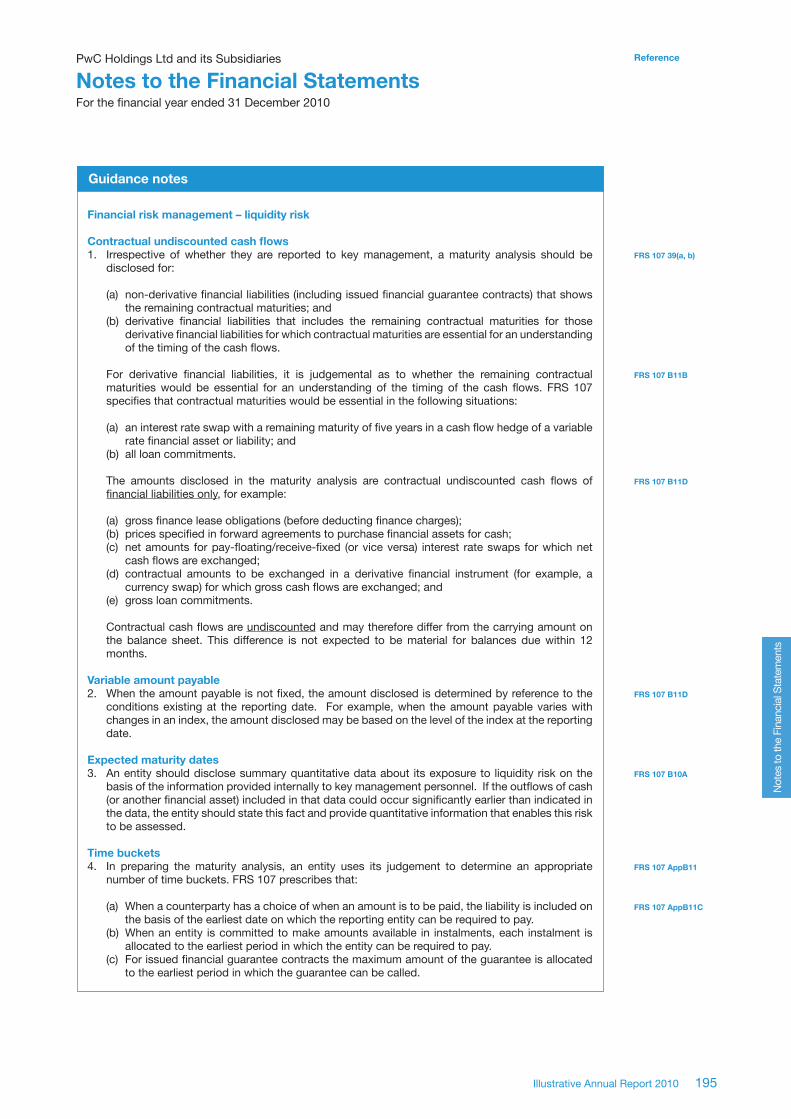
PwC Holdings Ltd and its Subsidiaries
Notes to the Financial StatementsFor the financial year ended 31 December 2010
195Illustrative Annual Report 2010
Reference
Not
es to
the
Fina
ncia
l Sta
tem
ents
FRS 107 39(a, b)
FRS 107 B11B
FRS 107 B11D
FRS 107 B11D
FRS 107 B10A
FRS 107 AppB11
FRS 107 AppB11C
Financial risk management – liquidity risk
Contractual undiscounted cash flows1. Irrespective of whether they are reported to key management, a maturity analysis should be
disclosed for:
(a) non-derivative financial liabilities (including issued financial guarantee contracts) that shows the remaining contractual maturities; and
(b) derivative financial liabilities that includes the remaining contractual maturities for those derivative financial liabilities for which contractual maturities are essential for an understanding of the timing of the cash flows.
For derivative financial liabilities, it is judgemental as to whether the remaining contractual maturities would be essential for an understanding of the timing of the cash flows. FRS 107 specifies that contractual maturities would be essential in the following situations:
(a) an interest rate swap with a remaining maturity of five years in a cash flow hedge of a variable rate financial asset or liability; and
(b) all loan commitments.
The amounts disclosed in the maturity analysis are contractual undiscounted cash flows of financial liabilities only, for example:
(a) gross finance lease obligations (before deducting finance charges);(b) prices specified in forward agreements to purchase financial assets for cash;(c) net amounts for pay-floating/receive-fixed (or vice versa) interest rate swaps for which net
cash flows are exchanged;(d) contractual amounts to be exchanged in a derivative financial instrument (for example, a
currency swap) for which gross cash flows are exchanged; and(e) gross loan commitments.
Contractual cash flows are undiscounted and may therefore differ from the carrying amount on the balance sheet. This difference is not expected to be material for balances due within 12 months.
Variable amount payable2. When the amount payable is not fixed, the amount disclosed is determined by reference to the
conditions existing at the reporting date. For example, when the amount payable varies with changes in an index, the amount disclosed may be based on the level of the index at the reporting date.
Expected maturity dates3. An entity should disclose summary quantitative data about its exposure to liquidity risk on the
basis of the information provided internally to key management personnel. If the outflows of cash (or another financial asset) included in that data could occur significantly earlier than indicated in the data, the entity should state this fact and provide quantitative information that enables this risk to be assessed.
Time buckets4. In preparing the maturity analysis, an entity uses its judgement to determine an appropriate
number of time buckets. FRS 107 prescribes that:
(a) When a counterparty has a choice of when an amount is to be paid, the liability is included on the basis of the earliest date on which the reporting entity can be required to pay.
(b) When an entity is committed to make amounts available in instalments, each instalment is allocated to the earliest period in which the entity can be required to pay.
(c) For issued financial guarantee contracts the maximum amount of the guarantee is allocated to the earliest period in which the guarantee can be called.
Guidance notes

196
ReferencePwC Holdings Ltd and its Subsidiaries
Notes to the Financial StatementsFor the financial year ended 31 December 2010
Not
es to
the
Fina
ncia
l Sta
tem
ents
FRS 1(135),IG10
FRS 1(135)(a)
FRS 1(135)(a)
FRS 1(135)(c)
FRS 1(135)(b)
FRS 1(135)(d)
FRS 1 IG10
FRS 1(136)
43. Financial risk management (continued)
(d) Capital risk
The Group’s objectives when managing capital are to safeguard the Group’s ability to continue as a going concern and to maintain an optimal capital structure so as to maximise shareholder value. In order to maintain or achieve an optimal capital structure, the Group may adjust the amount of dividend payment, return capital to shareholders, issue new shares, buy back issued shares, obtain new borrowings or sell assets to reduce borrowings.
Management monitors capital based on a gearing ratio1,2. The Group and the Company are also required by the banks to maintain a gearing ratio of not exceeding 70% (2009: 70%). The Group’s and Company’s strategies, which were unchanged from 2009, are to maintain gearing ratios within 45% to 50% and 60% to 70% respectively.
The gearing ratio is calculated as net debt divided by total capital. Net debt is calculated as borrowings plus trade and other payables less cash and cash equivalents. Total capital is calculated as total equity plus net debt.
Group Company 2010 2009 2010 2009 $’000 $’000 $’000 $’000 Net debt 122,605 79,228 66,182 69,523Total equity 136,129 98,156 45,226 34,592Total capital3 258,734 177,384 111,408 104,115 Gearing ratio 47% 45% 59% 67%
The Group and the Company are in compliance with all externally imposed capital requirements for the financial years ended 31 December 2009 and 2010.
Guidance notes
Financial risk management – Capital risk
1. This publication illustrates the capital risk disclosure for a reporting entity that monitors its capital using a gearing ratio. Other entities may use different and/or more complex methods to monitor capital. An entity decides, in the light of its circumstances, which measures are more suitable to monitor its capital and how much detail it should disclose. For instance, some entities may monitor capital based on Return on Capital Employed, Economic Value Added, or dividend payout ratio.
2. An entity may be subject to a number of different capital requirements. For example, a conglomerate may include entities that undertake insurance activities and banking activities and those entities may also operate in several jurisdictions. When an aggregate disclosure will not provide useful information, the entity shall disclose separate information for each capital requirement to which the entity is subject.
3. The word “capital” denotes the Company’s overall funding; it does not mean “equity capital”.

PwC Holdings Ltd and its Subsidiaries
Notes to the Financial StatementsFor the financial year ended 31 December 2010
197Illustrative Annual Report 2010
Reference
Not
es to
the
Fina
ncia
l Sta
tem
ents
FRS 107p27B(a)
43. Financial risk management (continued)
(e) Fair value measurements
The following table presents assets and liabilities measured at fair value and classified by level of the following fair value measurement hierarchy:
(a) quoted prices (unadjusted) in active markets for identical assets or liabilities (Level 1);
(b) inputs other than quoted prices included within Level 1 that are observable for the asset or liability, either directly (is as prices) or indirectly (i.e. derived from prices) (Level 2); and
(c) c) inputs for the asset or liability that are not based on observable market data (unobservable inputs) (Level 3).1
Level 1 Level 2 Level 3 Total Group $’000 $’000 $’000 $’0002010Assets Financial assets at fair value through profit or loss 10,785 – – 10,785 Derivative financial instruments – 1,353 111 1,464Financial assets, available-for-sale 11,901 – 5,347 17,248 Total assets 22,686 1,353 5,458 29,497 Liabilities Contingent consideration payable – – 350 350Derivative financial instruments – 575 – 575Total liabilities – 575 350 925
2009Assets Financial assets at fair value through profit or loss 8,326 – – 8,326 Derivative financial instruments – 564 – 564Financial assets, available-for-sale 7,673 – 5,264 12,937Total assets 15,999 564 5,264 21,827 Liabilities Derivative financial instruments – 284 – 284
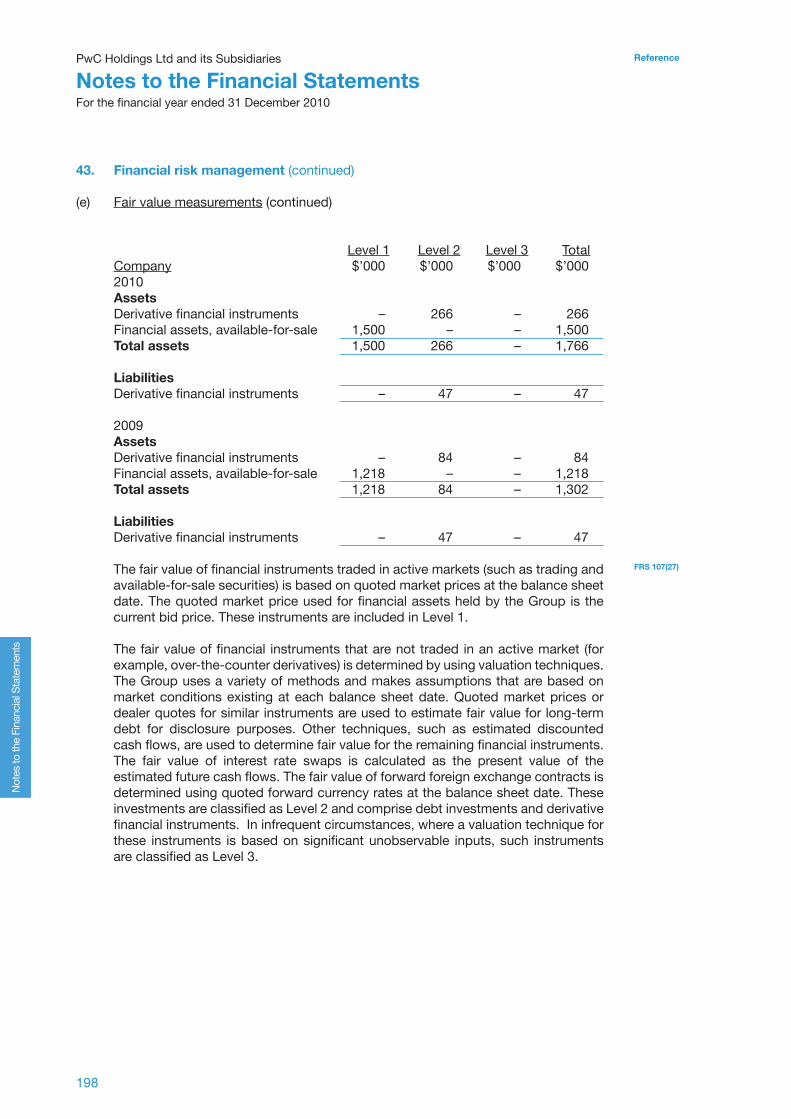
198
ReferencePwC Holdings Ltd and its Subsidiaries
Notes to the Financial StatementsFor the financial year ended 31 December 2010
Not
es to
the
Fina
ncia
l Sta
tem
ents
43. Financial risk management (continued)
(e) Fair value measurements (continued)
Level 1 Level 2 Level 3 Total Company $’000 $’000 $’000 $’0002010Assets Derivative financial instruments – 266 – 266Financial assets, available-for-sale 1,500 – – 1,500 Total assets 1,500 266 – 1,766 Liabilities Derivative financial instruments – 47 – 47
2009Assets Derivative financial instruments – 84 – 84Financial assets, available-for-sale 1,218 – – 1,218Total assets 1,218 84 – 1,302 Liabilities Derivative financial instruments – 47 – 47
The fair value of financial instruments traded in active markets (such as trading and available-for-sale securities) is based on quoted market prices at the balance sheet date. The quoted market price used for financial assets held by the Group is the current bid price. These instruments are included in Level 1.
The fair value of financial instruments that are not traded in an active market (for example, over-the-counter derivatives) is determined by using valuation techniques. The Group uses a variety of methods and makes assumptions that are based on market conditions existing at each balance sheet date. Quoted market prices or dealer quotes for similar instruments are used to estimate fair value for long-term debt for disclosure purposes. Other techniques, such as estimated discounted cash flows, are used to determine fair value for the remaining financial instruments. The fair value of interest rate swaps is calculated as the present value of the estimated future cash flows. The fair value of forward foreign exchange contracts is determined using quoted forward currency rates at the balance sheet date. These investments are classified as Level 2 and comprise debt investments and derivative financial instruments. In infrequent circumstances, where a valuation technique for these instruments is based on significant unobservable inputs, such instruments are classified as Level 3.
FRS 107(27)

PwC Holdings Ltd and its Subsidiaries
Notes to the Financial StatementsFor the financial year ended 31 December 2010
199Illustrative Annual Report 2010
Reference
Not
es to
the
Fina
ncia
l Sta
tem
ents
43. Financial risk management (continued)
(e) Fair value measurements (continued)
The following table presents the changes in Level 3 instruments.
Financial assets, available Contingent 2010 Derivatives -for-sale consideration Total $’000 $’000 $’000 $’000Beginning of financial year – 5,264 – 5,264Transfers 115 – – 115 Purchases – 50 – 50Acquisition of a subsidiary – – (300) (300) Fair value gains/ (losses) recognised in - other comprehensive income – 33 – 33 - profit or loss (4) – (50) (54) End of financial year 111 5,347 (350) 5,108
Total gains or (losses) for the period included in profit or loss for assets and liabilities held at the end of the reporting period (4) – (50) (54)
2009Beginning of financial year – 5,000 – 5,000 Purchases – 254 – 254Fair value gains/ (losses) recognised in - other comprehensive income – 10 – 10 - profit or loss – – – – End of financial year – 5,264 – 5,264 Total gains /(losses) recognised in profit or loss for assets and liabilities held at the end of financial year – – – –
During the financial year ended 31 December 2010, the Group transferred a held-for-trading forward foreign exchange contract from Level 2 to Level 3 as the counterparty for the derivative encountered significant financial difficulties which resulted to a significant increase in the discount rate due to increased counterparty credit risk which is not based on observable inputs. The carrying amount less impairment provision of trade receivables and payables are assumed to approximate their fair values. The fair value of financial liabilities for disclosure purposes is estimated based on quoted market prices or dealer quotes for similar instruments by discounting the future contractual cash flows at the current market interest rate that is available to the Group for similar financial instruments. The fair value of current borrowings approximates their carrying amount.
FRS 107(27B)(c)
FRS 107(27B)(c)(iv)
FRS 107(29)(a)FRS 107(27A)
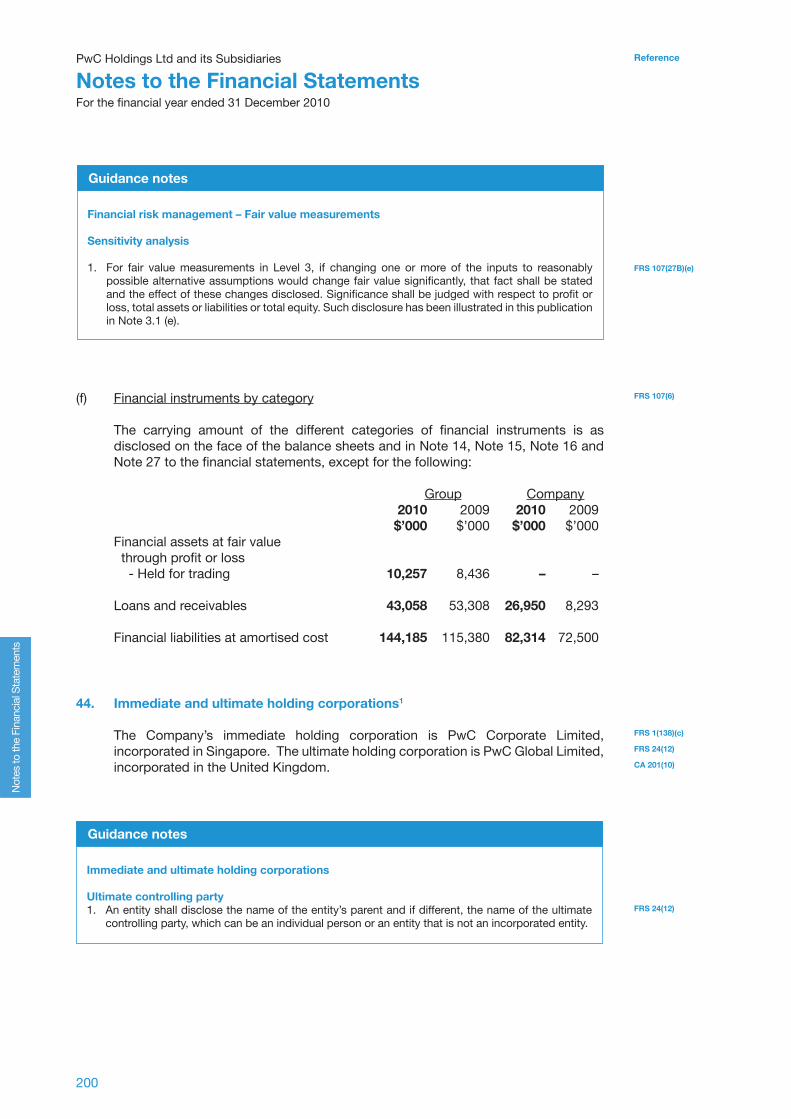
200
ReferencePwC Holdings Ltd and its Subsidiaries
Notes to the Financial StatementsFor the financial year ended 31 December 2010
Not
es to
the
Fina
ncia
l Sta
tem
ents
Guidance notes
Financial risk management – Fair value measurements
Sensitivity analysis
1. For fair value measurements in Level 3, if changing one or more of the inputs to reasonably possible alternative assumptions would change fair value significantly, that fact shall be stated and the effect of these changes disclosed. Significance shall be judged with respect to profit or loss, total assets or liabilities or total equity. Such disclosure has been illustrated in this publication in Note 3.1 (e).
FRS 107(27B)(e)
FRS 107(6)(f) Financial instruments by category
The carrying amount of the different categories of financial instruments is as disclosed on the face of the balance sheets and in Note 14, Note 15, Note 16 and Note 27 to the financial statements, except for the following:
Group Company 2010 2009 2010 2009 $’000 $’000 $’000 $’000Financial assets at fair value through profit or loss - Held for trading 10,257 8,436 – – Loans and receivables 43,058 53,308 26,950 8,293
Financial liabilities at amortised cost 144,185 115,380 82,314 72,500
44. Immediate and ultimate holding corporations1
The Company’s immediate holding corporation is PwC Corporate Limited, incorporated in Singapore. The ultimate holding corporation is PwC Global Limited, incorporated in the United Kingdom.
FRS 1(138)(c)
FRS 24(12)
CA 201(10)
FRS 24(12)
Guidance notes
Immediate and ultimate holding corporations
Ultimate controlling party1. An entity shall disclose the name of the entity’s parent and if different, the name of the ultimate
controlling party, which can be an individual person or an entity that is not an incorporated entity.
PwC Holdings Ltd and its Subsidiaries
Notes to the Financial StatementsFor the financial year ended 31 December 2010
201Illustrative Annual Report 2010
Reference
Not
es to
the
Fina
ncia
l Sta
tem
ents
45. Related party transactions
In addition to the information disclosed elsewhere in the financial statements, the following transactions took place between the Group and related parties at terms agreed between the parties:
(a) Sales and purchases of goods and services
Group 2010 2009 $’000 $’000
Sales of goods and/or services to - associated companies 1,800 1,792 - other related parties 470 729 2,270 2,521 Purchases of materials from - associated companies 16,286 17,504 - fellow subsidiaries 70,601 60,504 86,887 78,008 Purchase of plant and equipment from other related parties 600 – Payments made on behalf and reimbursed by the immediate holding corporation 186 153 Professional fees received from other related parties 212 149 Technical fees received from other related parties 15 10 Other related parties comprise mainly companies which are controlled or significantly influenced by the Group’s key management personnel and their close family members.
Outstanding balances at 31 December 2010, arising from sale/purchase of goods and services, are unsecured and receivable/payable within 12 months from balance sheet date and are disclosed in Notes 17 and 30 respectively.
FRS 24(17,22)
FRS 24(18)(d)
FRS 24(18)(g)
FRS 24(18)(d)
FRS 24(18)(g)
FRS 24(18)(g)
FRS 24(18)(a)
FRS 24(18)(g)
FRS 24(18)(g)
FRS 24(9)
FRS 24(17)(b)(i)
202
ReferencePwC Holdings Ltd and its Subsidiaries
Notes to the Financial StatementsFor the financial year ended 31 December 2010
Not
es to
the
Fina
ncia
l Sta
tem
ents
45. Related party transactions (continued) (b) Key management personnel compensation
Key management personnel compensation is as follows: Group 2010 2009 $’000 $’000
Wages and salaries 3,620 2,066Employer’s contribution to defined contribution plans, including Central Provident Fund 203 98Termination benefits 100 –Other long-term benefits 33 23Share option expense 300 280 4,256 2,467 Details on directors’ remuneration are disclosed in the Corporate Governance Report.
46. Segment information1
Management has determined the operating segments based on the reports reviewed by the Executive Committee (“Exco”) that are used to make strategic decisions. The Exco comprises the Chief Executive Officer, the Chief Financial Officer, and the department heads of each business within each geographic segment.
The Exco considers the business from both a geographic and business segment perspective. Geographically, management manages and monitors the business in the three primary geographic areas Singapore, China and the Philippines. All geographic locations are engaged in the manufacture and sale of electronic parts. In addition, China and the Philippines also derive revenues from the sale of household and office furniture, while the Singapore segment derives revenue from construction of specialised equipment.
Other services included within Singapore, China, the Philippines and Vietnam include investment holding and provision of logistic services; but these are not included within the reportable operating segments, as they are not included in the reports provided to the Exco. The results of these operations are included in the “all other segments” column.
In the prior year, the Group carried out glass manufacturing operations in Malaysia. However, this was discontinued in the current period (see Note 11).
FRS 24(16)
FRS 24(16)(a)
FRS 24(16)(b)
FRS 24(16)(d)
FRS 24(16)(c)
FRS 24(16)(e)
DV
FRS 108(22)(a)
FRS 108(22)(b)
FRS 108(16)
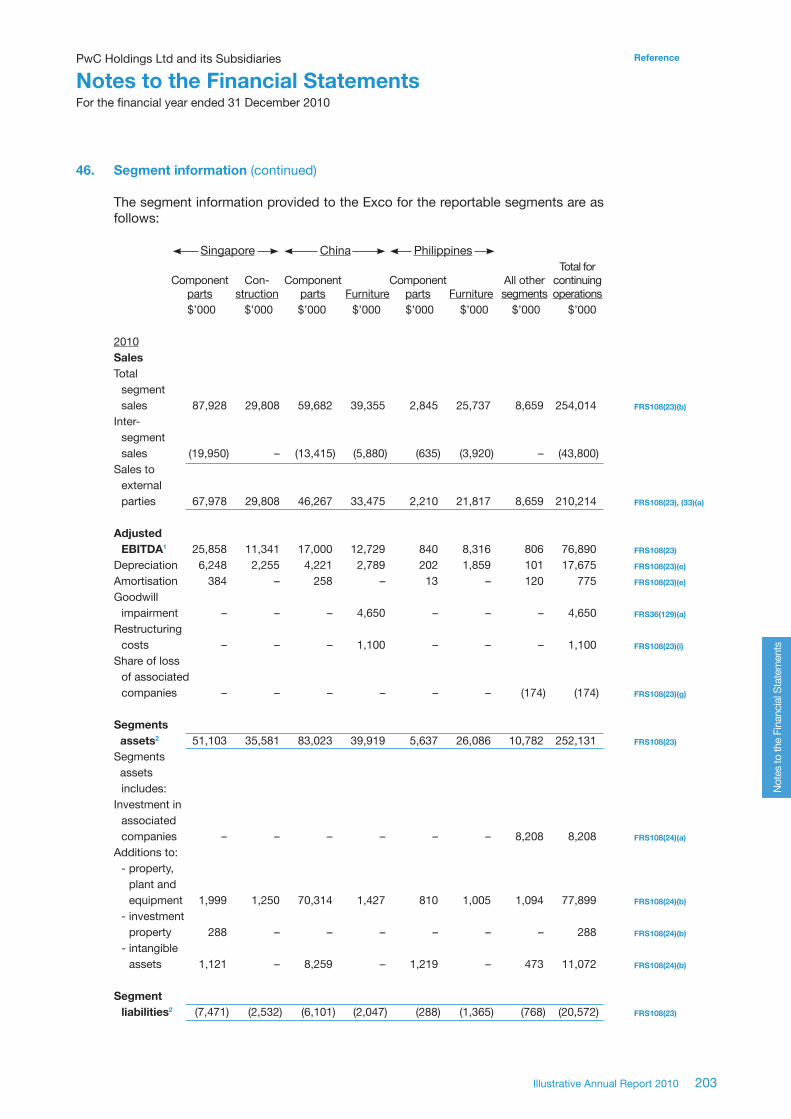
PwC Holdings Ltd and its Subsidiaries
Notes to the Financial StatementsFor the financial year ended 31 December 2010
203Illustrative Annual Report 2010
Reference
Not
es to
the
Fina
ncia
l Sta
tem
ents
46. Segment information (continued)
The segment information provided to the Exco for the reportable segments are as follows:
Singapore China Philippines Total for Component Con- Component Component All other continuing parts struction parts Furniture parts Furniture segments operations $’000 $’000 $’000 $’000 $’000 $’000 $’000 $’000
2010 Sales Total segment sales 87,928 29,808 59,682 39,355 2,845 25,737 8,659 254,014Inter- segment sales (19,950) – (13,415) (5,880) (635) (3,920) – (43,800)Sales to external parties 67,978 29,808 46,267 33,475 2,210 21,817 8,659 210,214 Adjusted EBITDA1 25,858 11,341 17,000 12,729 840 8,316 806 76,890Depreciation 6,248 2,255 4,221 2,789 202 1,859 101 17,675Amortisation 384 – 258 – 13 – 120 775Goodwill impairment – – – 4,650 – – – 4,650Restructuring costs – – – 1,100 – – – 1,100Share of loss of associated companies – – – – – – (174) (174) Segments assets2 51,103 35,581 83,023 39,919 5,637 26,086 10,782 252,131Segments assets includes: Investment in associated companies – – – – – – 8,208 8,208Additions to: - property, plant and equipment 1,999 1,250 70,314 1,427 810 1,005 1,094 77,899 - investment property 288 – – – – – – 288 - intangible assets 1,121 – 8,259 – 1,219 – 473 11,072 Segment liabilities2 (7,471) (2,532) (6,101) (2,047) (288) (1,365) (768) (20,572)
FRS108(23)(b)
FRS108(23), (33)(a)
FRS108(23)
FRS108(23)(e)
FRS108(23)(e)
FRS36(129)(a)
FRS108(23)(i)
FRS108(23)(g)
FRS108(23)
FRS108(24)(a)
FRS108(24)(b)
FRS108(24)(b)
FRS108(24)(b)
FRS108(23)

204
ReferencePwC Holdings Ltd and its Subsidiaries
Notes to the Financial StatementsFor the financial year ended 31 December 2010
Not
es to
the
Fina
ncia
l Sta
tem
ents
46. Segment information (continued)
Singapore China Philippines Total for Component Con- Component Component All other continuing parts struction parts Furniture parts Furniture segments operations $’000 $’000 $’000 $’000 $’000 $’000 $’000 $’000
2009 Sales Total segment sales 77,194 16,527 25,601 15,621 2,274 6,214 4,429 147,860Inter- segment sales (21,356) – (7,049) (5,075) (637) (1,383) – (35,500)Sales to external parties 55,838 16,527 18,552 10,546 1,637 4,831 4,429 112,360 Adjusted EBITDA Depreciation 3,064 1,389 1,162 1,398 1,057 932 580 9,582Amortisation 235 – 89 42 81 28 40 515Share of loss of associated companies – – – – – – (145) (145) Segments assets2 40,493 28,213 26,964 59,596 2,785 29,397 10,494 197,942Segments assets includes: Investment in associated companies – – – – – – 8,569 8,569Additions to: - property, plant and equipment 2,324 530 882 420 801 280 274 5,511 - intangible assets 399 – 151 – 138 – 2,040 2,728 Segment liabilities2 (5,247) (802) (1,781) (3,300) (211) (2,200) (900) (14,441)
FRS108(23)(b)
FRS108(23),(33)(a)
FRS108(23)
FRS108(23)(e)
FRS108(23)(e)
FRS108(23)(g)
FRS108(23)
FRS108(24)(a)
FRS108(24)(b)
FRS108(24)(b)
FRS108(23)

PwC Holdings Ltd and its Subsidiaries
Notes to the Financial StatementsFor the financial year ended 31 December 2010
205Illustrative Annual Report 2010
Reference
Not
es to
the
Fina
ncia
l Sta
tem
ents
46. Segment information (continued)
Sales between segments are carried out at arm’s length. The revenue from external parties reported to the Exco is measured in a manner consistent with that in the statement of comprehensive income.
The Exco assesses the performance of the operating segments based on a measure of Earnings before interest, tax, depreciation and amortisation (“adjusted EBITDA”)1. This measurement basis excludes the effects of expenditure from the operating segments such as restructuring costs and goodwill impairment that are not expected to recur regularly in every period. Interest income and finance expenses are not allocated to segments, as this type of activity is driven by the Group Treasury, which manages the cash position of the group. Since the Exco reviews adjusted EBITDA, the results of discontinued operations are not included in the measure of adjusted EBITDA.
FRS 108(27)(a)
FRS108(27)(b),(28)
FRS 108(23)
FRS108(28)(b)(a) Reconciliations (i) Segment profits
A reconciliation of adjusted EBITDA to profit before tax and discontinued operations is as follows:
2010 2009 $’000 $’000
Adjusted EBITDA for reportable segments 76,684 44,069Other segments EBITDA 206 686Depreciation (17,675) (9,582)Amortisation (775) (515)Restructuring costs (1,100) –Goodwill impairment (4,650) –Finance expense (7,073) (9,060)Interest income 1,180 620Profit before tax and discontinued operations 46,797 26,218
Guidance notes
Segment information
EBITDA1. The measure of profit that is reported here depends on what the Chief Operating Decision Maker
reviews. EBITDA should not be used if that is not the measure of profit that the CODM reviews.
Reporting segment assets and liabilities2. The Annual Improvements 2009, effective for annual periods beginning on or after 1 Jan 2010,
requires an entity to report a measure of total assets and liabilities for each reportable segment only if such amounts are regularly provided to the Chief Operating Decision Maker, This publication discloses the measure of total assets and liabilities for each reportable segment as this is regularly provided to the chief operating decision maker of PwC Holding Ltd.

206
ReferencePwC Holdings Ltd and its Subsidiaries
Notes to the Financial StatementsFor the financial year ended 31 December 2010
Not
es to
the
Fina
ncia
l Sta
tem
ents
FRS 108(27)(c)
46. Segment information (continued)
(ii) Segment assets
The amounts provided to the Exco with respect to total assets are measured in a manner consistent with that of the financial statements. For the purposes of monitoring segment performance and allocating resources between segments, the Exco monitors the property, plant and equipment, intangible assets, inventories, receivables, operating cash and investment properties attributable to each segment. All assets are allocated to reportable segments other than deferred income tax assets, short-term bank deposits, derivative financial instruments, financial assets at fair value through profit or loss, available-for-sale financial assets and held-to- maturity financial assets.
Segment assets are reconciled to total assets as follows:
2010 2009 $’000 $’000
Segment assets for reportable segments 241,349 187,448Other segment assets 10,782 10,494Unallocated: Assets associated with disposal group 3,333 – Deferred income tax assets 3,319 3,228 Short-term bank deposits 9,530 5,414 Derivative financial instruments 1,464 564 Financial assets at fair value through profit or loss, available-for-sale financial assets and held-to-maturity financial assets 30,155 22,856 299,932 230,004

PwC Holdings Ltd and its Subsidiaries
Notes to the Financial StatementsFor the financial year ended 31 December 2010
207Illustrative Annual Report 2010
Reference
Not
es to
the
Fina
ncia
l Sta
tem
ents
FRS 108(27)(d)
FRS 108(32)
FRS 108(32)
46. Segment information (continued)
(iii) Segment liabilities
The amounts provided to the Exco with respect to total liabilities are measured in a manner consistent with that of the financial statements. These liabilities are allocated based on the operations of the segment. All liabilities are allocated to the reportable segments other than income tax liabilities, borrowings and derivative financial instruments.
Segment liabilities are reconciled to total liabilities as follows:
2010 2009 $’000 $’000
Segment liabilities for reportable segments 19,804 13,541Other segment liabilities 768 900 Unallocated: Liabilities associated with disposal group 220 – Income tax liabilities 2,942 3,833 Deferred tax liabilities 11,670 8,406 Borrowings 127,824 104,884 Derivative financial instruments 575 284 163,803 131,848
(b) Revenue from major products and services
Revenues from external customers are derived mainly from the sale of electronic parts, sale of household and office furniture and construction of specialized equipment. Investment holding and provision of logistic services are included in “Others”. Breakdown of the revenue is as follows:
2010 2009 $’000 $’000Sales for continuing operations Component parts 116,455 76,027Furniture 55,292 15,377Construction 29,808 16,527Others 8,659 4,429 210,214 112,360
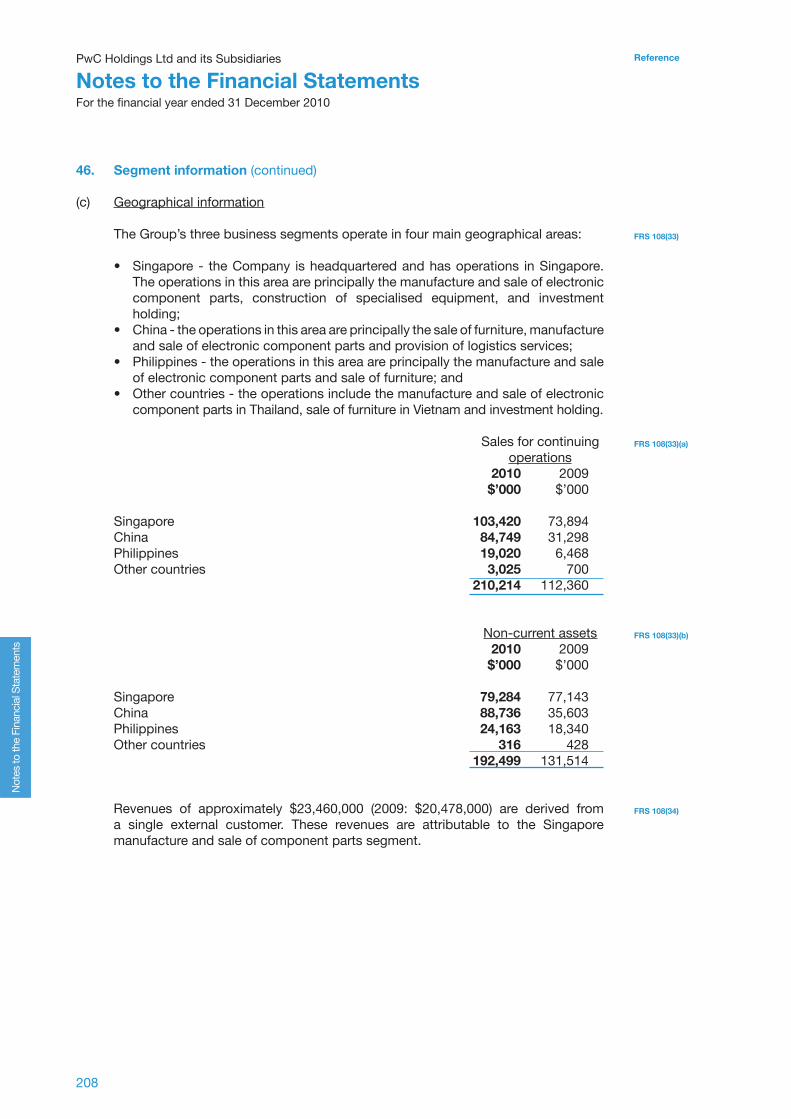
208
ReferencePwC Holdings Ltd and its Subsidiaries
Notes to the Financial StatementsFor the financial year ended 31 December 2010
Not
es to
the
Fina
ncia
l Sta
tem
ents
FRS 108(33)
FRS 108(33)(a)
FRS 108(33)(b)
FRS 108(34)
46. Segment information (continued)
(c) Geographical information
The Group’s three business segments operate in four main geographical areas:
• Singapore - the Company is headquartered and has operations in Singapore. The operations in this area are principally the manufacture and sale of electronic component parts, construction of specialised equipment, and investment holding;
• China - the operations in this area are principally the sale of furniture, manufacture and sale of electronic component parts and provision of logistics services;
• Philippines - the operations in this area are principally the manufacture and sale of electronic component parts and sale of furniture; and
• Other countries - the operations include the manufacture and sale of electronic component parts in Thailand, sale of furniture in Vietnam and investment holding.
Sales for continuing operations
2010 2009 $’000 $’000
Singapore 103,420 73,894China 84,749 31,298Philippines 19,020 6,468Other countries 3,025 700 210,214 112,360
Non-current assets
2010 2009 $’000 $’000
Singapore 79,284 77,143China 88,736 35,603Philippines 24,163 18,340Other countries 316 428 192,499 131,514
Revenues of approximately $23,460,000 (2009: $20,478,000) are derived from a single external customer. These revenues are attributable to the Singapore manufacture and sale of component parts segment.

PwC Holdings Ltd and its Subsidiaries
Notes to the Financial StatementsFor the financial year ended 31 December 2010
209Illustrative Annual Report 2010
Reference
Not
es to
the
Fina
ncia
l Sta
tem
ents
47. Business combinations
On 1 October 2010, the Group acquired 70% of equity interest of XYZ Electronics Pte Ltd (now known as PwC Components (China) Pte Ltd (“PwC China”)). The principal activity of PwC China is that of manufacturing and trading of electronic components parts in China. As a result of the acquisition, the Group is expected to increase its presence in China. It also expects to reduce costs through economies of scale.
$’000(a) Purchase consideration1,2
Cash paid 13,700Contingent consideration (Note (e) below) 300Total purchase consideration 14,000Less: Indemnification asset3 (Note (i) below) (200)Consideration transferred for the business 13,800
(b)EffectoncashflowsoftheGroup
Cash paid (as above) 13,700Less: cash and cash equivalents in subsidiary acquired (300) Cash outflow on acquisition 13,400
At fair value(c)Identifiableassetsacquiredandliabilitiesassumed $’000 Cash and cash equivalents 300Property, plant and equipment (Note 28) 67,784Trademarks and licences (included in intangibles) (Note 29(b)) 4,000Investment in associated companies (Note 23) 389Financial assets, available-for-sale (Note 16) 473Inventories 1,122Trade and other receivables (Note (f) below) 1,585Total assets 75,653
Trade and other payables (15,000)Borrowings (41,359) Contingent liability (included in provisions) (Notes 35 and (h) below) (300)Current tax liability (Note 10(b)) (100)
Deferred tax liabilities (Note 36) (3,753) Total liabilities (60,512)
Total identifiable net assets 15,141Less: Non-controlling interest at fair value (Note (j) below) (5,600)Add: Goodwill (Notes 29(a) and (k) below) 4,259Consideration transferred for the business 13,800
FRS 103(B64)(a-d)
FRS 103(B64)(f)(i)
FRS 103(B64)(f)(iii)
FRS 103(B64)(f)
FRS 103(B64)(g)(i)
FRS 7(40)(b)
FRS 7(40)(c)
FRS 7(40)(a)
FRS 103(B64)(i)
FRS 7(40)(d)
FRS 103(B64)(o)(i)

210
ReferencePwC Holdings Ltd and its Subsidiaries
Notes to the Financial StatementsFor the financial year ended 31 December 2010
Not
es to
the
Fina
ncia
l Sta
tem
ents
47. Business combinations (continued)
(d)Acquisition-relatedcosts
Acquisition-related costs of $550,000 are included in administrative expenses in the consolidated statement of comprehensive income and in operating cash flows in the consolidated statement of cash flows.
(e) Contingent consideration
The Group is required to pay the former owners of PwC China $1,000,000 in cash if PwC China achieves a cumulative net profit of $6,000,000 for the period from 1 October 2010 to 30 September 2012.
The fair value of the contingent consideration as at the acquisition date was estimated to amount to $300,000 based on an income approach. This fair value was based on an estimated cumulative net profit of PwC China ranging from $5,000,000 to $6,250,000 for the relevant period, discounted at 8% per annum.
As at 31 December 2010, the fair value of the contingent consideration is estimated to have increased by $50,000, as the estimated cumulative net profit in PwC China for the relevant period has been revised to be in the region of $5,300,00 to $6,400,000. The increase in the fair value of the contingent consideration has been recognised in administrative expenses in the statement of comprehensive income.
(f)Acquiredreceivables
The fair value of trade and other receivables is $1,585,000 and includes trade receivables with a fair value of $1,510,000. The gross contractual amount for trade receivables due is $1,680,000, of which $170,000 is expected to be uncollectible.
(g)Provisionalfairvalues
The fair value of the acquired identifiable intangible assets of $4,000,000 (trademarks and licences) has been provisionally determined pending receipt of the final valuation reports from the independent valuers.
(h)Contingentliability
A contingent liability of $300,000 has been recognised for a pending lawsuit in which the entity is a defendant. The claim has arisen from a customer alleging defective products. It is expected that a decision on this case will be reached by the relevant court of law by the end of 2012. The potential undiscounted amount of all future payments that the Group could be required to make is estimated to be between $200,000 and $500,000, if an adverse decision is made. As at 31 December 2010, there has been no change in the amount recognised for the liability since the acquisition date, as there has been no change in the range of outcomes or assumptions used to develop the estimates.
FRS 103(B64)(m)
FRS 103(B64)(f)(iii)
FRS 103(B64)(g)
FRS 103(B67)(b)
FRS 103(B64)(h)
FRS 103(B67)(a)
FRS 103(B64)(j)
FRS 103(B67)(c)
FRS 37(84,85)

PwC Holdings Ltd and its Subsidiaries
Notes to the Financial StatementsFor the financial year ended 31 December 2010
211Illustrative Annual Report 2010
Reference
Not
es to
the
Fina
ncia
l Sta
tem
ents
47. Business combinations (continued)
(i) Indemnificationasset 3
The seller of PwC China has contractually agreed to indemnify the Group for the claim that may become payable in respect of the lawsuit disclosed in (h) above, up to a maximum amount of $200,000. As is the case with the indemnified liability there has been no change in the amount recognised for the indemnification asset since the acquisition date.
(j)Non-controllinginterests
The group has chosen to recognise the 30% non-controlling interest at its fair value of $5,600,000. The fair value was estimated by applying a market approach and an income approach. The fair value estimates are based on:
• an assumed discount rate of 8% per annum;• an assumed terminal value based on a range of terminal EBITDA multiples
between three and five times; • long-term sustainable growth rate of 2.2%;• assumed financial multiples of companies deemed to be similar to PwC
China; and• assumed adjustments because of the lack of control or lack of marketability
that market participants would consider.
(k)Goodwill The goodwill of $4,259,000 arising from the acquisition is attributable to the
distribution network in China and the synergies expected to arise from the economies of scale in combining the operations of the Group with those of PwC China.
(l)Revenueandprofitcontribution
The acquired business contributed revenue of $4,500,000 and net profit of $675,000 to the Group for the period from 1 October 2010 to 31 December 2010.
Had PwC China been consolidated from 1 January 2010, consolidated revenue and consolidated profit for the year ended 31 December 2010 would have been $230,214,000 and $35,276,000 respectively.
FRS 103(27),(57)
FRS 103(B64)(g)
FRS 103(B64)(o)
FRS 103(B64)(e)
FRS 103(B64)(q)
212
ReferencePwC Holdings Ltd and its Subsidiaries
Notes to the Financial StatementsFor the financial year ended 31 December 2010
Not
es to
the
Fina
ncia
l Sta
tem
ents
FRS 103(B64)(f)(iv)
FRS 103(B64)(p)
FRS 103(27)
FRS 103(B64)(g)
Equity interests issued as purchase consideration1. When equity interests are issued or issuable as part of the cost of acquisition, the entity shall
disclose the number of instruments or interests issued and the method of determining their fair value.
Business combination achieved in stages2. Where the business combination was achieved in stages, the fair value of the previously held
interest immediately before the acquisition date shall form part of the total purchase consideration. That acquisition-date fair value shall be disclosed together with the amount of any gain or loss recognised as a result of remeasuring to fair value the previously held interest, and the line item in the statement of comprehensive income where that gain or loss is included.
Indemnification assets3. When the seller agrees to contractually indemnify the acquirer for the outcome of a contingency
or uncertainty related to a specific asset or liability, the acquirer recognises an indemnification asset with an equivalent amount deducted from the consideration transferred for the business combination. The amount recognised, a description of the arrangement and an estimate of the range of outcomes shall be disclosed.
Guidance notes
48. Events occurring after balance sheet date
On 25 February 2011, the Group issued $4,300,000 6.5% Singapore-dollar bonds to finance the purchase of an additional 40% interest in PwC A Property (Hong Kong) Limited (“PwC Hong Kong”) and new equipment in the construction segment. The bonds are repayable on 25 February 2015.
On 1 March 2011, the Group acquired an additional 40% interest in PwC Hong Kong, a company incorporated in Hong Kong which is engaged in investment holding, for a cash consideration of $3,500,000. The fair value of the Group’s share of the identifiable net assets of PwC Hong Kong at the date of acquisition has been provisionally determined at $2,500,000. Acquisition-related costs of $120,000 have been incurred and will be included in administrative expenses in the statement of comprehensive income for the year ended 31 December 2011. Details of the assets acquired and liabilities assumed, non-controlling interest that will be recognised, revenue and profit contribution of PwC Hong Kong and the effect on the cash flows for the Group are not disclosed, as the accounting for this acquisition is still incomplete at the time these financial statements have been authorised for issue. PwC Hong Kong will be consolidated with effect from 1 March 2011.1
FRS 10(21)
FRS 10(21)
FRS 10(22)(a)
FRS 103(B66)
Guidance notes
Business combinations occurring after balance sheet date but before the financial statementsare authorised for issue1. FRS 103 (revised) requires an acquirer to disclose the same information for business combinations
occurring after balance sheet date but before the financial statements are authorized for issue as what is disclosed for business combinations occurring during the reporting period. The only exception is if the accounting for such business combination is incomplete at the time the financial statements are authorized for issue, in which case the acquirer shall describe which disclosures could not be made and the reasons why.
PwC Holdings Ltd and its Subsidiaries
Notes to the Financial StatementsFor the financial year ended 31 December 2010
213Illustrative Annual Report 2010
Reference
Not
es to
the
Fina
ncia
l Sta
tem
ents
49. New or revised accounting standards and interpretations
Below are the mandatory standards, amendments and interpretations to existing standards that have been published1, and are relevant for the Group’s accounting periods beginning on or after 1 January 2011 or later periods and which the Group has not early adopted:
• Amendments to FRS 24 – Related party disclosures (effective for annual periods beginning on or after 1 January 2011)
• Amendments to FRS 32 Financial instruments: Presentation – classification of rights issues (effective for annual periods beginning on or after 1 February 2010)
• Amendments to INT FRS 114 – Prepayments of a minimum funding requirement (effective for annual periods commencing on or after 1 January 2011)
• INT FRS 119 Extinguishing financial liabilities with equity instruments (effective for annual periods commencing on or after 1 July 2010)
The management anticipates that the adoption of the above FRSs, INT FRSs and amendments to FRS in the future periods will not have a material impact on the financial statements of the Group and of the Company in the period of their initial adoption, except for the amendments to FRS 24 – Related party disclosures.
The amendment removes the requirement for government-related entities to disclose details of all transactions with the government and other government- related entities. It also clarifies and simplifies the definition of a related party. However, the revised definition of a related party will also mean that some entities will have more related parties and will be required to make additional disclosures.
Management is currently considering the revised definition to determine whether any additional disclosures will be required and has yet to put systems in place to capture the necessary information. It is therefore not possible to disclose the financial impact, if any, of the amendment on the related party disclosures.
FRS 8(30)(a)
FRS 8(30)(b)

214
ReferencePwC Holdings Ltd and its Subsidiaries
Notes to the Financial StatementsFor the financial year ended 31 December 2010
Not
es to
the
Fina
ncia
l Sta
tem
ents
FRS 8(30) New or revised accounting standards and interpretations published at the date of issuance ofthe financial statements but not yet effective
1. FRS 8 requires an entity to disclose the possible effects of future adoption of new or revised accounting Standards and Interpretations that have been issued up to the date of issuance of the financial statements but are not yet effective.
2. It is not required to list all FRSs, INT FRSs and amendments to FRS that have been issued but are not effective at date of authorization of financial statements. Only those relevant to the entity’s operations should be indicated.
3. The list of FRSs issued but not effective yet is complete as of June 30, 2010. The potential impact of any new or revised FRSs, INT FRSs and amendments to FRS issued after that date but before the issue date of the financial statements should also be covered and disclosed.
4. The following are illustrative disclosures that could be considered if the change in accounting policy is substantial or may have a material impact on the financial statements:
• Amendments to FRS 32 Financial Instruments: Presentation – Classification of Rights Issues (effective for annual periods beginning on or after 1 February 2010) - The amendment addresses the accounting for rights issues (rights, options or warrants) denominated in a currency other than the functional currency of the issuer. Prior to the amendment, such rights issues were accounted for as derivative liabilities. The amendment requires that, if such rights are issued pro rata to an entity’s existing shareholders for a fixed amount of any currency, they should be classified as equity, regardless of the currency in which the exercise price is denominated. The amendment is effective for annual periods beginning on or after 1 Feb 2010. <describepossibleimpactfortheGroup>
• Amendments to INT FRS 114 – Prepayments of a minimum funding requirement (effective for annual periods beginning on or after 1 January 2011) - This amendment will have a limited impact as it applies only to companies that are required to make minimum funding contributions to a defined benefit pension plan. It removes an unintended consequence of IFRIC 14 related to voluntary pension prepayments when there is a minimum funding requirement. It applies for annual periods beginning on or after 1 Jan 2011. <describepossibleimpactfortheGroup>
• INT FRS 119 Extinguishing Financial Liabilities with Equity Instruments (effective for annual periods commencing on or after 1 July 2010) - This interpretation clarifies the accounting when an entity renegotiates the terms of its debt with the result that the liability is extinguished through the debtor issuing its own equity instruments to the creditor. A gain or loss is recognised in the profit and loss account based on the fair value of the equity instruments compared to the carrying amount of the debt.The interpretation applies retrospectively, from the beginning of the earliest comparative period presented, for annual periods beginning on or after 1 July 2010. <describepossibleimpactfortheGroup>
Guidance notes
50. Authorisation of financial statements
These financial statements were authorised for issue in accordance with a resolution of the Board of Directors of PwC Holdings Limited on 19 March 2011.
FRS 10(17)

PwC Holdings Ltd and its Subsidiaries
Notes to the Financial StatementsFor the financial year ended 31 December 2010
215Illustrative Annual Report 2010
Reference
Not
es to
the
Fina
ncia
l Sta
tem
ents
51. Listing of significant1 companies in the Group
Country of Equity holding business/ 2010 2009Name of companies Principal activities incorporation % % Significant subsidiaries held by the Company PwC Construction Pte Ltd(a) Construction of Singapore 100 100 specialised equipment
PwC Property (Singapore) Investment holding Singapore 100 100 Pte Ltd(a)
PwC Furniture (PRC) Co., Sale of furniture China 85 85 Ltd(d) PwC Components (Singapore) Manufacture of Singapore 45 45 Pte Ltd(a),(h) component parts PwC Components (PRC) Co., Manufacture of China 80 80 Ltd(d) component parts PwC Components (China) Manufacture of China 70 – Pte Ltd(d),(g) component parts PwC Furniture (Philippines) Sale of furniture Philippines 70 70 Pte Ltd(b)
PwC Logistics (PRC) Co. Provision of China – 100 Ltd(d) logistics services PwC Glass Sdn Bhd(c) Manufacture of glass Malaysia 70 70 Significant joint venture held by the Company PwC JV Logistics (PRC) Co., Provision of China 60 60 Ltd(d),(f) logistics services Significant associated companies held by the Company PwC A Property (Hong Kong) Investment holding Hong Kong 35 35 Limited(e)
PwC A Furniture Sdn Bhd(c) Sale of furniture Malaysia 25 25
(a) Audited2byPricewaterhouseCoopersLLP,Singapore(i)
(b) Audited2byPricewaterhouseCoopersLLP,Philippines(i)
(c) Audited2byTan&Co.3,Malaysia (d) Audited2byGreatWallCPACompanyLimited3,People’sRepublicofChina (e) Notrequiredtobeaudited2underthelawsofthecountryofincorporation (f) NotconsolidatedastheentityisnotcontrolledbytheGroupanddeemedtobeajointventureastheGroupshares
thecontroloftheentity (g) Financialyearendson30Septemberastheyareacquiredduringthefinancialyear4
(h) DeemedtobeasubsidiaryastheGroupcontrolstheentityviavetorights (i) In accordance to Rule 716 of The Singapore Exchange Securities Trading Limited – Listing Rules, the Audit
Committee andBoard of Directors of theCompany confirmed that they are satisfied that the appointment of differentauditorsforitssubsidiariesandsignificantassociatedcompanieswouldnotcompromisethestandardand effectivenessoftheauditoftheCompany.
SGX 715-718
FRS 31(56)
FRS 27(40)(d)
FRS 27(40)(e), CA 200(1)FRS 27(40)(c)

216
ReferencePwC Holdings Ltd and its Subsidiaries
Notes to the Financial StatementsFor the financial year ended 31 December 2010
Not
es to
the
Fina
ncia
l Sta
tem
ents
Guidance notes
Listing of significant companies in the Group
1. The term “significant” is not defined in FRS. However, in the SGX-ST Listing Manual, a subsidiary or associated company is considered significant if its net tangible assets represent 20% or more of the issuer’s consolidated net tangible assets, or its pre-tax profits account for 20% or more of the issuer’s consolidated pre-tax profits. In the absence of a formal definition in FRS, it is preferable to adopt this definition set out in the SGX-ST Listing Manual.
2. Companies listed on the Singapore Exchange are also required to disclose name(s) of auditing firm(s) of its significant subsidiaries and associated companies. It is a good practice for listed companies to inform the auditing firm(s) that their name(s) will be disclosed in the financial statements.
3. It shall be noted that under the SGX-ST Listing Manual, an issuer may appoint different auditors for its subsidiaries or significant associated companies provided that:
(i) the issuer’s board and audit committee are satisfied that the appointment would not compromise the standard and effectiveness of the audit of the issuer; or
(ii) the issuer’s subsidiary or associated company, is listed on a stock exchange.
4. It shall be noted that under the Companies Act, a holding company is required to ensure that the financial year of its subsidiaries coincides with its financial year within two years after incorporation and/or acquisition.
SGX 718
SGX 717
SGX 716
CA 200(1)