reference strips and precision sensors for nitrogen management
TRANSCRIPT
Precision Agriculture Seminar
February 24, 2015
Boise, ID
Reference Strips
and Precision Sensors
Olga WalshAssistant Professor, Cropping Systems Specialist
Parma Research & Extension Center
University of Idaho
Presentation Outline:
1. Precision Ag (PA) benefits to
producers (specific example)
2. Level of PA adoption
3. Future of PA
4. Yield goal vs Yield potential
5. How sensors work
6. Reference strips
7. Misconceptions
8. Idaho research
Precision ag: Specific benefits
to producers
next few slides from Mr. Robert
Blair (2009 Precision Ag Farmer of the Year
2011 Eisenhower Fellow in Ag
2012 McCloy Fellow in Ag
Fourth-generation farmer Kendrick, Idaho)

Variable Rate Technology (VRT) VRT includes computer controllers and
associated hardware to vary output of fertilizer
and chemicals.
Utilize application map and GPS info to control
the hardware that varies the application rate.
Yield-goal/map based systems
Yield-potential/”on-the-go” systemsRT200, 6 GreenSeeker
sensor system
Sense and spray on the go
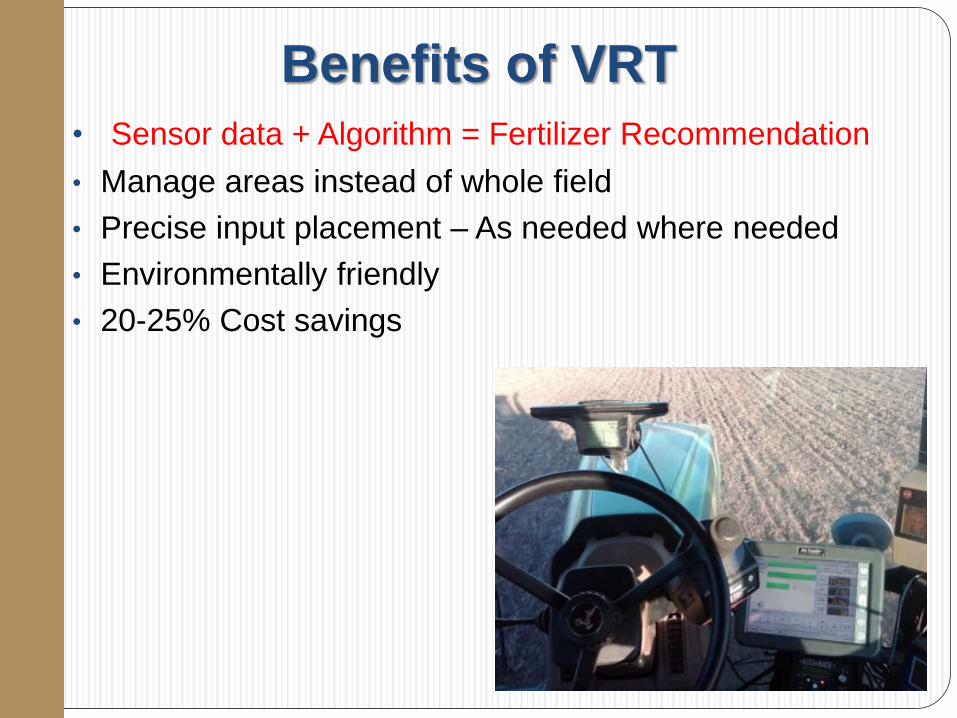
Benefits of VRT
• Sensor data + Algorithm = Fertilizer Recommendation
• Manage areas instead of whole field
• Precise input placement – As needed where needed
• Environmentally friendly
• 20-25% Cost savings

2009 NITROGEN HIT A RECORD HIGH
N cost was $.80 - $.90 per pound
100 pounds of N cost between $80 to $90 per acre
N costs on 500 acres of winter wheat at $.85/lb
at a 100 lb rate totaled:
$42,500
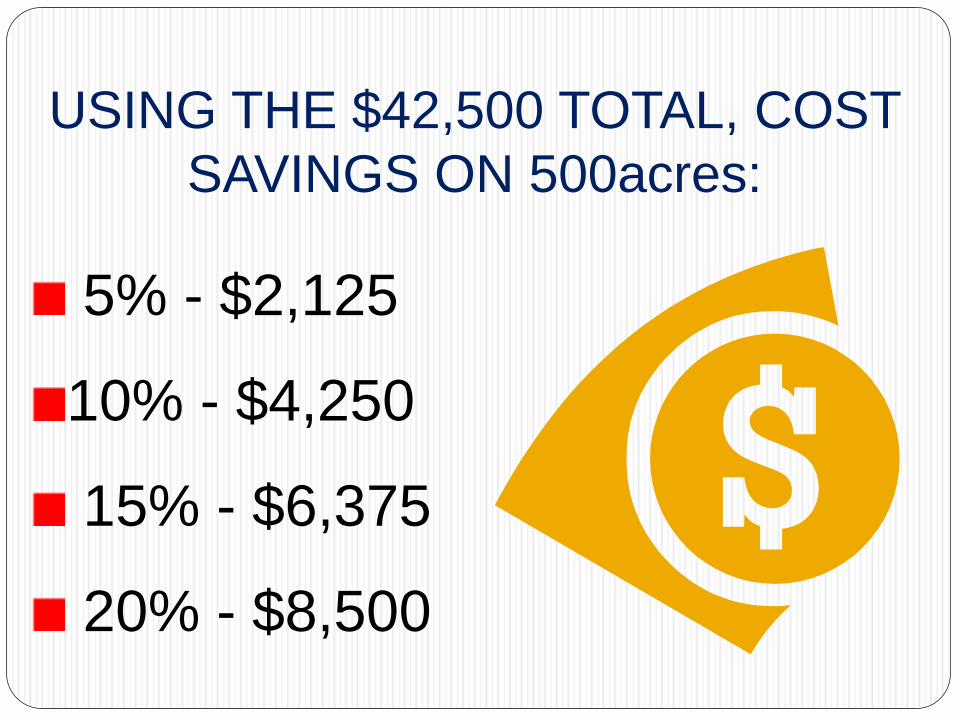
USING THE $42,500 TOTAL, COST
SAVINGS ON 500acres:
5% - $2,125
10% - $4,250
15% - $6,375
20% - $8,500

APPLICATION
Guidance
/Steering
VR Fertilizer
Seed Control
Auto Boom
NET
SAVINGS
2.5%
21%
5%
5%
PERCENT
SAVINGS
$10,137
$17,850
$2,716
$4,600
TOTAL PRECISION AG SAVINGS = $35,303

Current Idaho projects
Systems for Improving Water and
Nitrogen Use Efficiency in Spring
Wheat (WUE and NUE)
Precision Sensing for Improved
Wheat Production (N, wheat varietal
nurseries, diseases, pests)

Level of Precision Ag Adoption
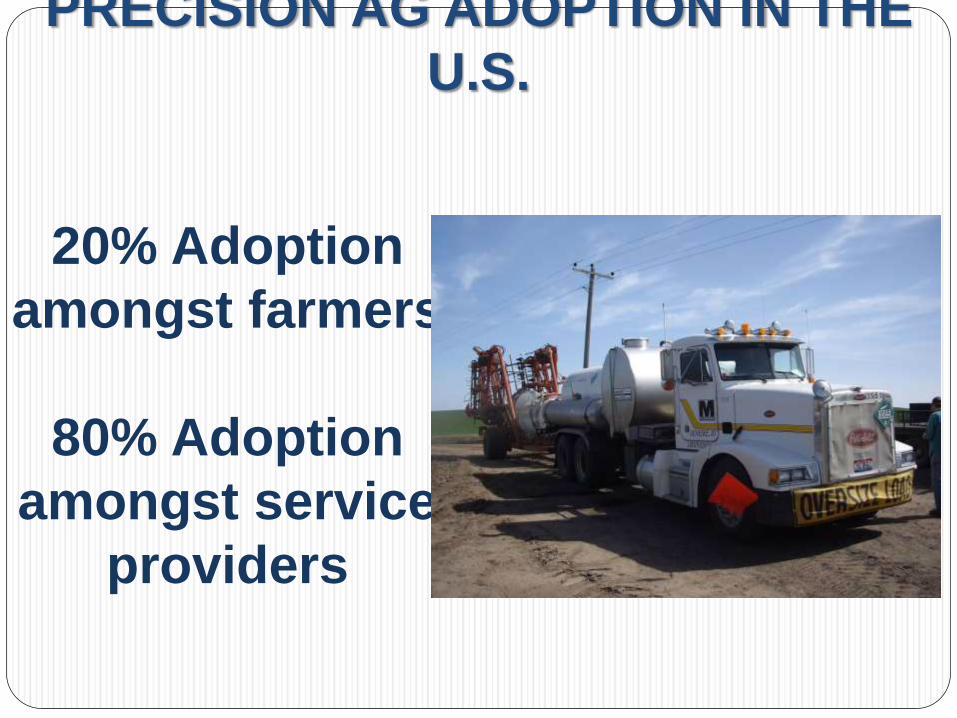
PRECISION AG ADOPTION IN THE
U.S.
20% Adoption
amongst farmers
80% Adoption
amongst service
providers
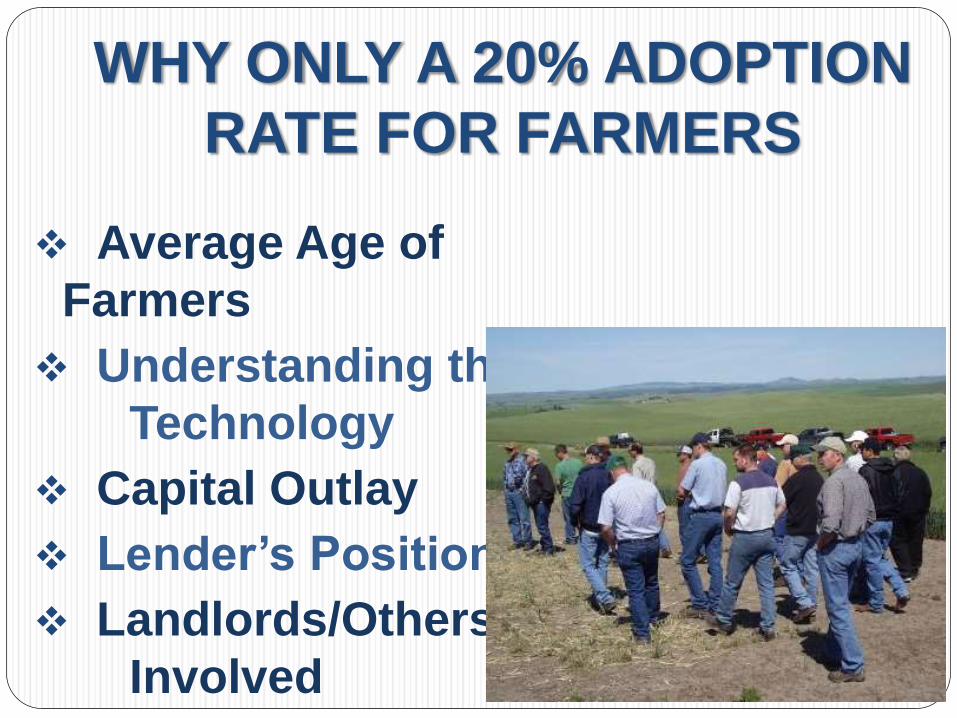
WHY ONLY A 20% ADOPTION
RATE FOR FARMERS
Average Age of
Farmers
Understanding the
Technology
Capital Outlay
Lender’s Position
Landlords/Others
Involved

Future of Precision Ag
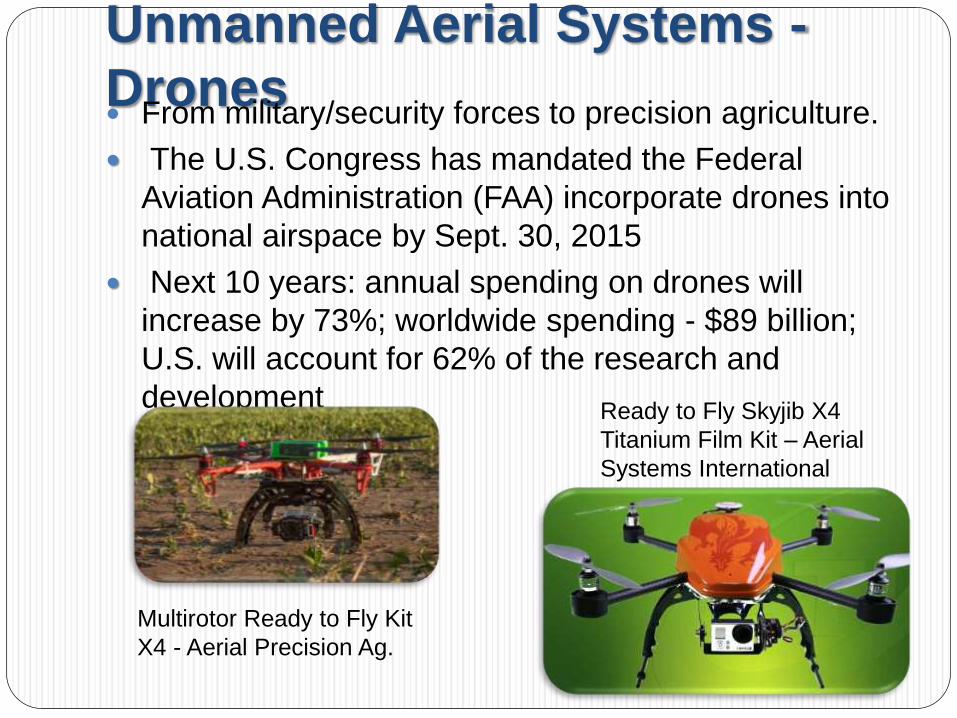
Unmanned Aerial Systems -
Drones From military/security forces to precision agriculture.
The U.S. Congress has mandated the Federal
Aviation Administration (FAA) incorporate drones into
national airspace by Sept. 30, 2015
Next 10 years: annual spending on drones will
increase by 73%; worldwide spending - $89 billion;
U.S. will account for 62% of the research and
development
Multirotor Ready to Fly Kit
X4 - Aerial Precision Ag.
Ready to Fly Skyjib X4
Titanium Film Kit – Aerial
Systems International

Robotics
Chemical Applications in Orchards
Mechanical Weeding
Autonomous TractorsBlue River Technology - $3.1
million funding to develop
agricultural robots to kill
weeds and thin out plants
Vision Robotics Corporation
– harvesting robots

Yield goal vs Yield potential
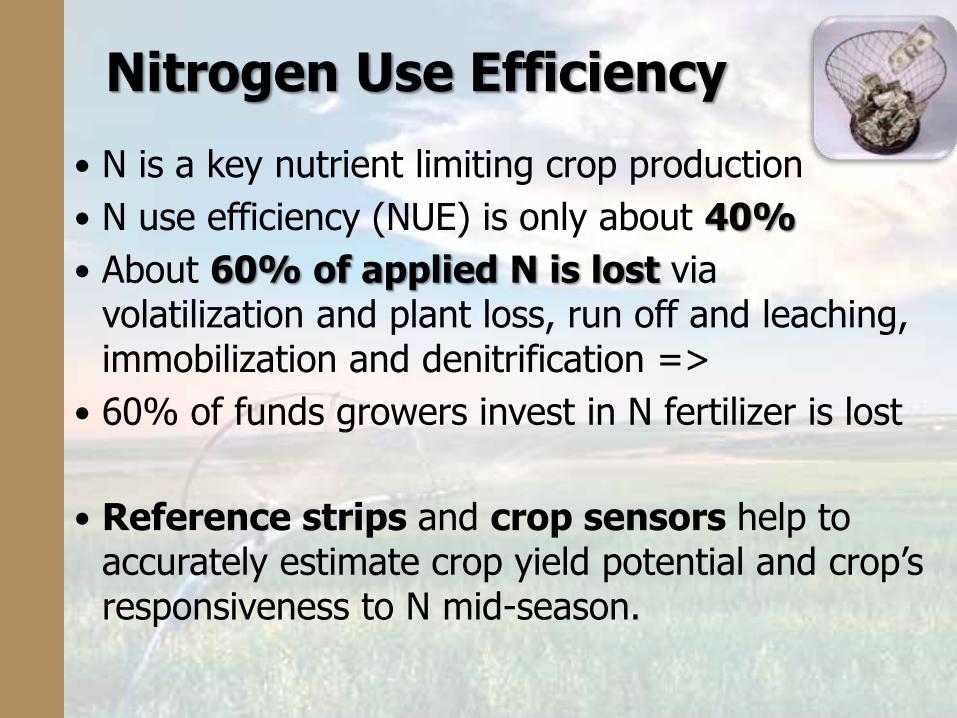
Nitrogen Use Efficiency
N is a key nutrient limiting crop production
N use efficiency (NUE) is only about 40%
About 60% of applied N is lost via volatilization and plant loss, run off and leaching, immobilization and denitrification =>
60% of funds growers invest in N fertilizer is lost
Reference strips and crop sensors help to accurately estimate crop yield potential and crop’s responsiveness to N mid-season.

Yield Goal vs Yield Potential
• Yield Goal:
Average yield for past 5 years + 30% (just in case we have a good year)
Based on past (historical data)
Uses average N rates
• Yield Potential:
Estimated using in-season data
Based on current crop nutrient status
Precise N rate (crop- and site-specific)
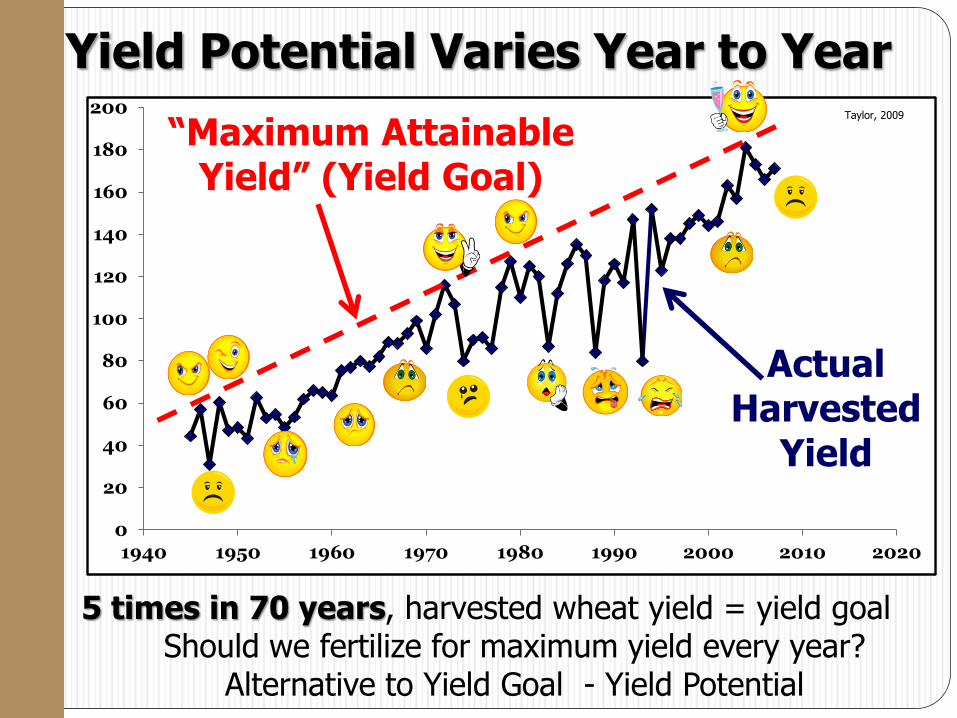
Yield Potential Varies Year to Year
0
20
40
60
80
100
120
140
160
180
200
1940 1950 1960 1970 1980 1990 2000 2010 2020
“Maximum Attainable Yield” (Yield Goal)
ActualHarvested
Yield
Taylor, 2009
5 times in 70 years, harvested wheat yield = yield goalShould we fertilize for maximum yield every year?
Alternative to Yield Goal - Yield Potential
How Sensors Work

Crop Sensors
hollandscientific.com; topconpositioning.com; nue.okstate.edu; agleader.com

Why use crop sensors?
Feed the crop, maintain the soil
Nitrogen = fuel for plant growth and development
To achieve highest efficiency – need to provide the crop with exactly how much it needs (no more and no less)

Why use crop sensors? Sensors = plant fuel gages, tell us:
How much the crop needs to reach yield potential
How much the crop received already from the soil (residual N, mineralization, rainfall …)
Do we always add the same amount of fuel no matter what?
Should we apply the same amount of N every year to every field?
E F
1/2
E F
1/2
E F
1/2

Potential and Response
Research showed that both crop yield potentialAND crop response to applied N changes:
year to year (temporal variability) and
field to field (spatial variability)
To get good estimates of N fertilizer demand, both the crops ability to respond to additional N and the grain yield potential must be known.
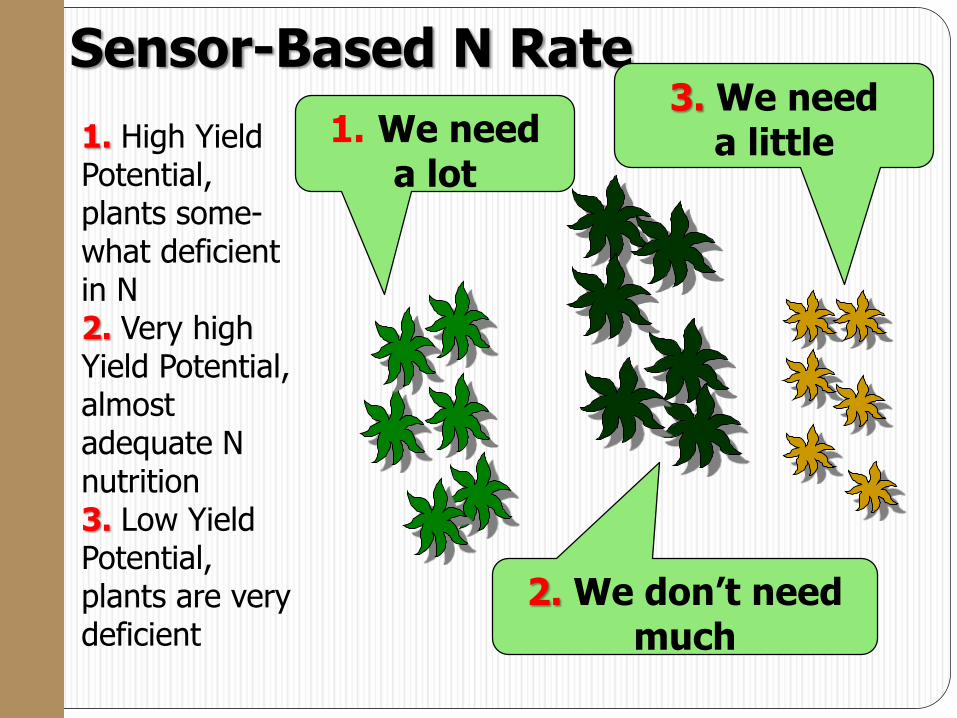
Sensor-Based N Rate
1. We needa lot
2. We don’t need much
3. We needa little1. High Yield
Potential, plants some-what deficient in N2. Very high Yield Potential, almost adequate N nutrition3. Low Yield Potential, plants are very deficient

Reference Strips

Nitrogen Reference Strips
Reference Strip Conrad, MT
Everything is relative and understood in comparison
The easiest way to assess nitrogen status –establish a non-limiting N strip and compareit to the rest of the field

Help, My Strips Did Not Work!
I can’t see my Reference Strip in my field, everything looks the same
It worked! – Enough N was delivered to the crop “for free”
Your crop probably will not benefit from addition of N fertilizer
Aren’t you glad you did not apply that high N rate to the whole field/farm?
www.blog.iastatebk.com, 2013
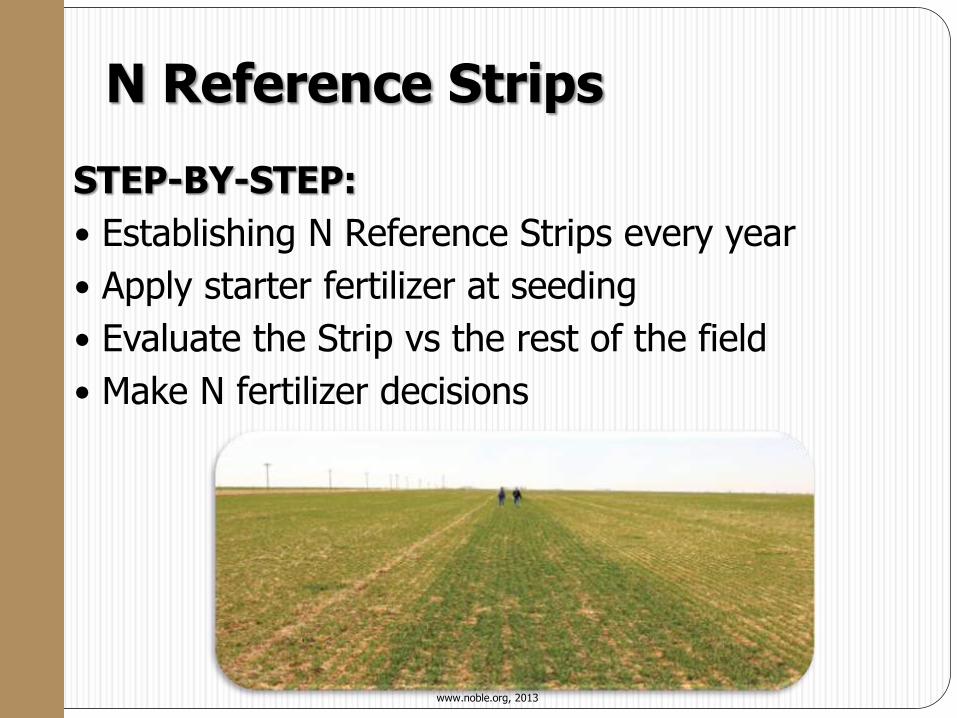
N Reference Strips
STEP-BY-STEP:
Establishing N Reference Strips every year
Apply starter fertilizer at seeding
Evaluate the Strip vs the rest of the field
Make N fertilizer decisions
www.noble.org, 2013
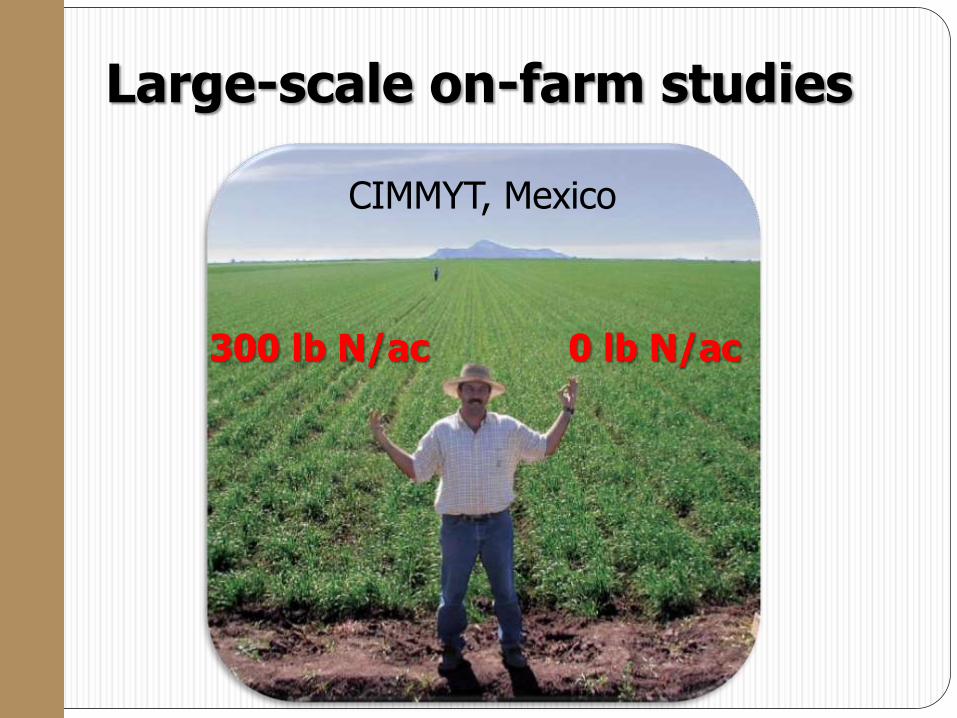
CIMMYT, Mexico
300 lb N/ac 0 lb N/ac
Large-scale on-farm studies

Sensor Basics
• Emits light and measures reflectance from plants
• Red light is used for photosynthesis (absorbed)
• NearInfrared light – not enough energy, not used (reflected)
• Sensor reading - Similar to a plant physical examination
Lightgeneration
Light signal
Lightdetection
? Calculate NDVI
“Sensor”
www.nue.okstate.edu, 2014
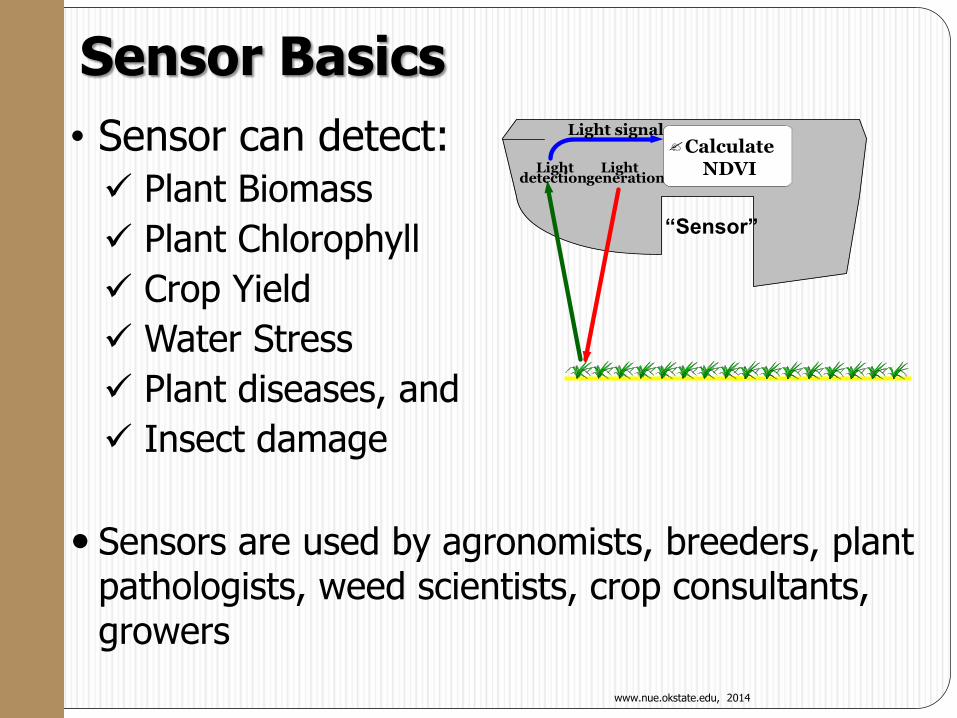
Sensor Basics
• Sensor can detect: Plant Biomass
Plant Chlorophyll
Crop Yield
Water Stress
Plant diseases, and
Insect damage
Sensors are used by agronomists, breeders, plant pathologists, weed scientists, crop consultants, growers
Lightgeneration
Light signal
Lightdetection
?Calculate NDVI
“Sensor”
www.nue.okstate.edu, 2014

red
redNIR
NIR
30%50%
60% 8%
NDVI = (NIR-red)/(NIR+red)
Sensor detects the amount of light reflected from the crop and calculates NDVI Tubana, 2007
NDVI = 0.76
NDVI = 0.25
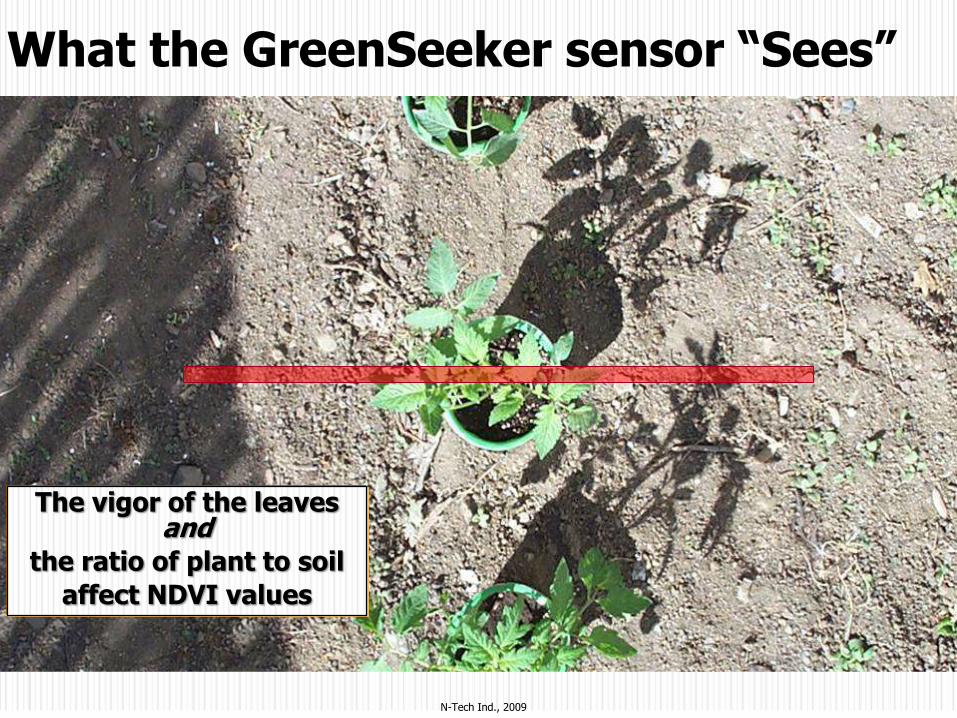
What the GreenSeeker sensor “Sees”
The vigor of the leaves and
the ratio of plant to soil
affect NDVI values
N-Tech Ind., 2009

N-Tech Ind., 2009
What the GreenSeeker sensor “Sees”
Most Common Misconceptions About Sensors
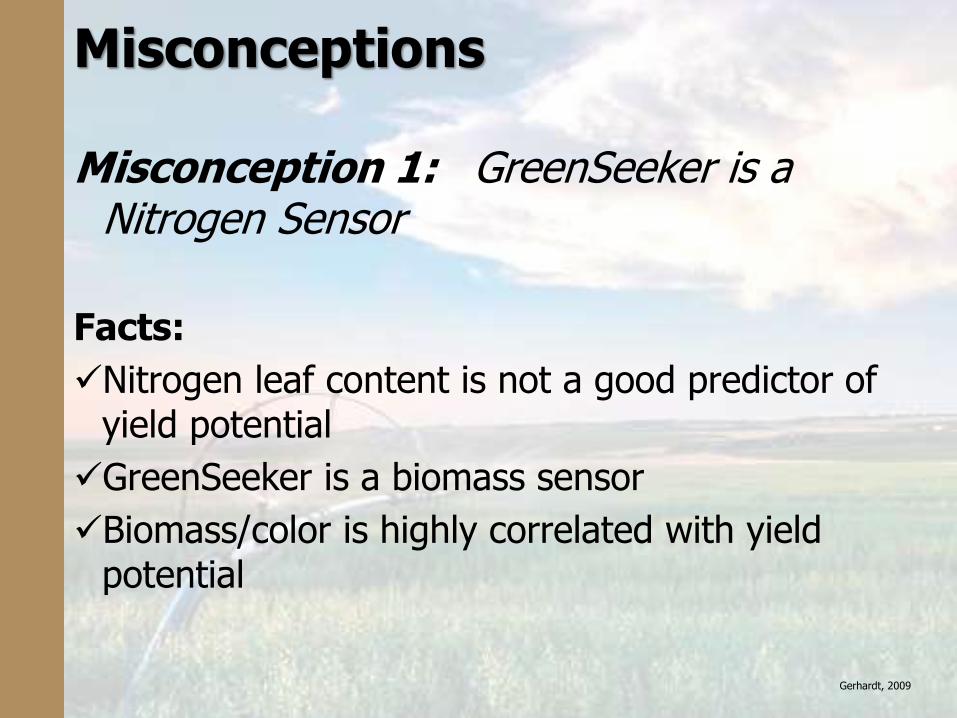
Misconceptions
Misconception 1: GreenSeeker is a Nitrogen Sensor
Facts:
Nitrogen leaf content is not a good predictor of yield potential
GreenSeeker is a biomass sensor
Biomass/color is highly correlated with yield potential
Gerhardt, 2009

Misconceptions
Misconception 2: “I can see variability with my eyes—I don’t need a sensor”
Facts:
We can see macro variation in a field, but not subtle changes
We cannot remember where the variations are and to what degree
A flat rate is typically not the optimal answer to variability
Gerhardt, 2009

Misconceptions
Misconception 3: “I can do variable rate N with historic data—I don’t have the time nor the need for an in-season device.”
Facts:
In certain seasons, 1 year of quality in-season data can be more valuable than 10 years of historic data
Averaging information has bias that will limit the high end and over estimate the low end
In wet years hills do best, in dry years the lower areas do best Gerhardt, 2009
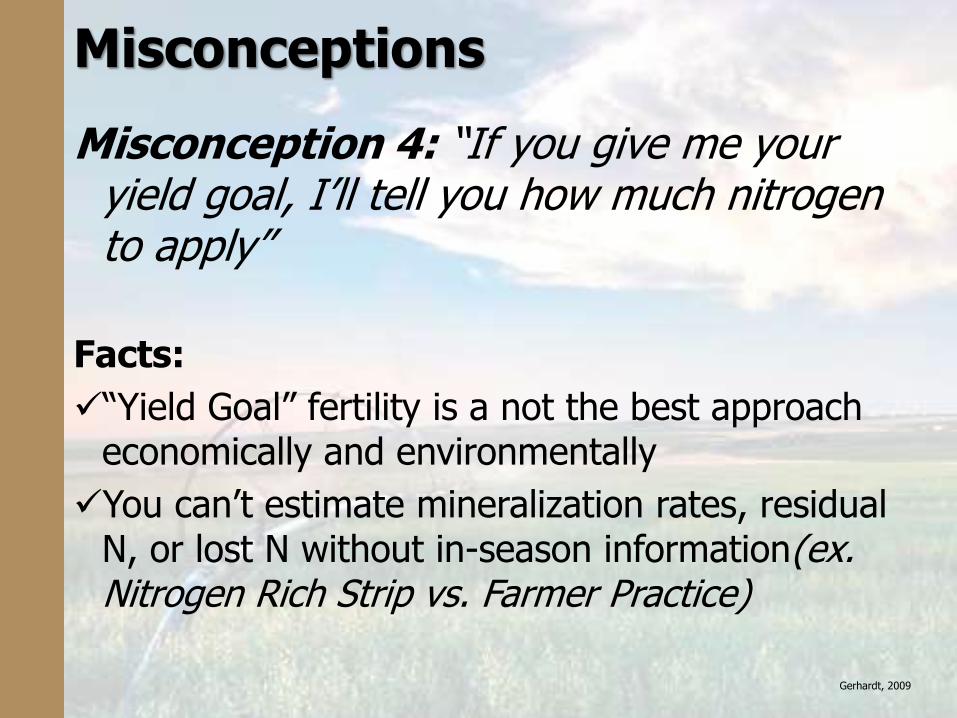
Misconceptions
Misconception 4: “If you give me your yield goal, I’ll tell you how much nitrogen to apply”
Facts:
“Yield Goal” fertility is a not the best approach economically and environmentally
You can’t estimate mineralization rates, residual N, or lost N without in-season information(ex. Nitrogen Rich Strip vs. Farmer Practice)
Gerhardt, 2009

Idaho research

Sensor-Based Work in Idaho
Pre-Season Variable Rate Nitrogen in Potatoes
Cook, Hopkins, Ellsworth, Bowen, and Funk (University of Idaho, Idaho Falls and Twin Falls)
2 growing seasons (2003-04), 5 fields, Eastern ID
Objective: To compare traditional and sensor-based variable rate fertilization
Results:
Support the concept of variable rate N application in potato production
The recognized increase in yield and quality more than compensated for the increased cost of this method of variable rate N fertilization

Sensor-Based Work in Idaho
In-Season Variable Rare N in Potato and Barley Production Using Optical Sensing Instrumentation (2004)
Bowen, Hopkins, Ellsworth, Cook, and Funk (University of Idaho at Idaho Falls and Twin Falls)
Objective: To evaluate the use of optical sensing instrumentation to help manage in-season N for potato and malt barley
1 growing season, 4 potato fields, 5 barley fields
Results: Sensors can be used to prescribe variable N rates to malt barley at jointing and to potatoes prior to row closure

A research assistant for Dr. Bryan Hopkins (currently a soil scientist at Brigham Young University, Utah)
evaluates sugarbeet canopy health using a GreenSeeker, Idaho
Sugar Producer, 2013
Thank you!
Olga Walsh
Assistant Professor, Cropping Systems Specialist
Parma Research & Extension Center
University of Idaho
(208) 722-6701 (ext 218)
Blog: Idaho Crops & Soils –
www.idcrops.blogspot.com
Follow us on Twitter: https://twitter.com/IDCrops
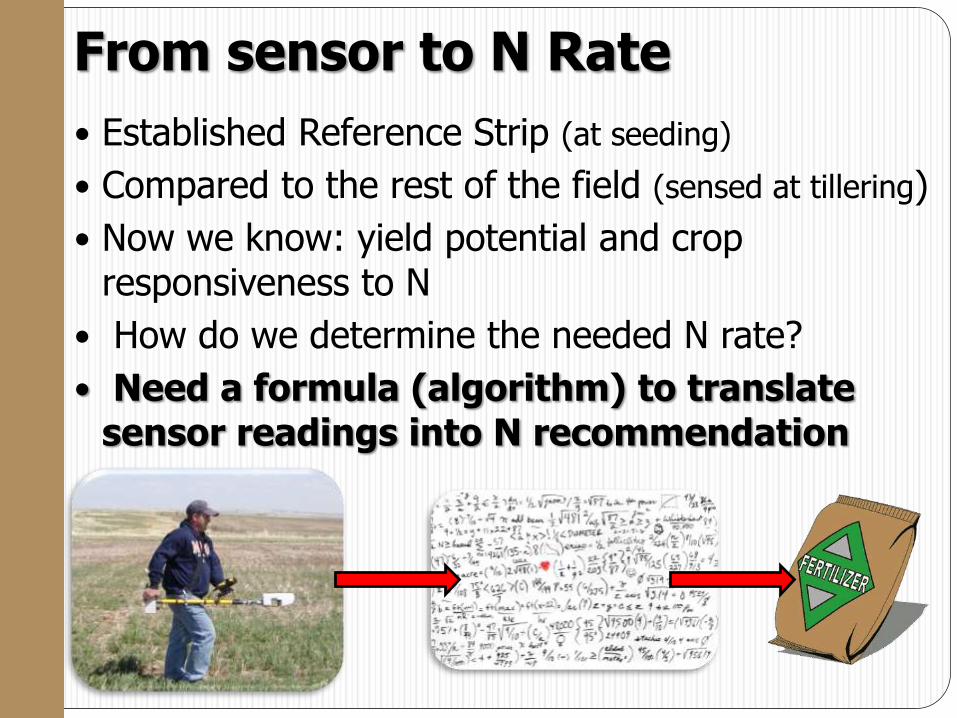
From sensor to N Rate
Established Reference Strip (at seeding)
Compared to the rest of the field (sensed at tillering)
Now we know: yield potential and crop responsiveness to N
How do we determine the needed N rate?
Need a formula (algorithm) to translate sensor readings into N recommendation
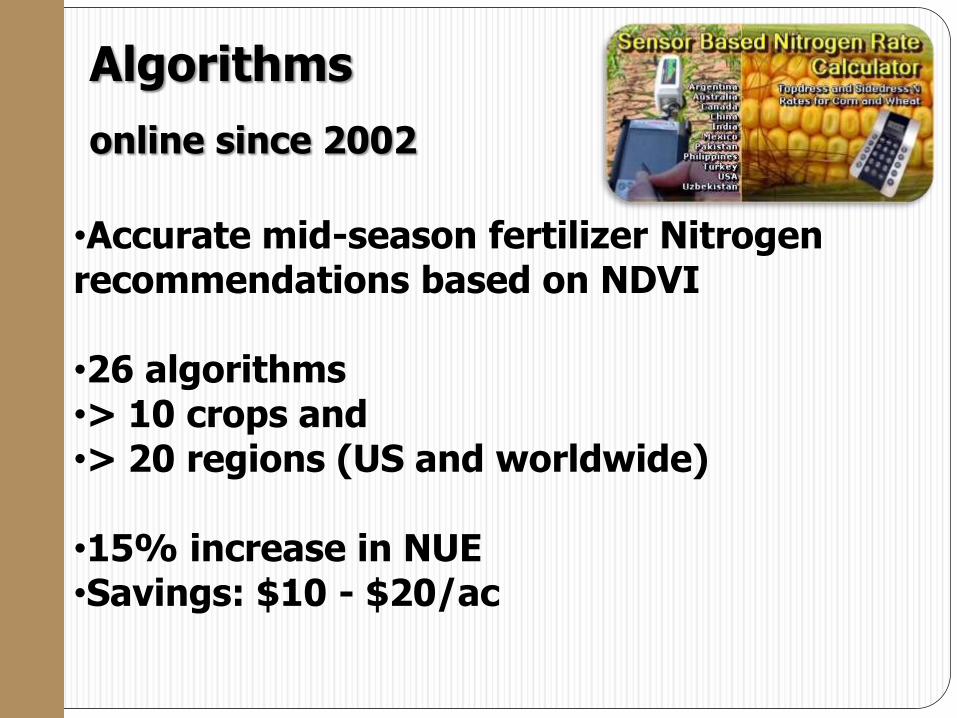
Algorithms
•Accurate mid-season fertilizer Nitrogen recommendations based on NDVI
•26 algorithms•> 10 crops and•> 20 regions (US and worldwide)
•15% increase in NUE•Savings: $10 - $20/ac
online since 2002

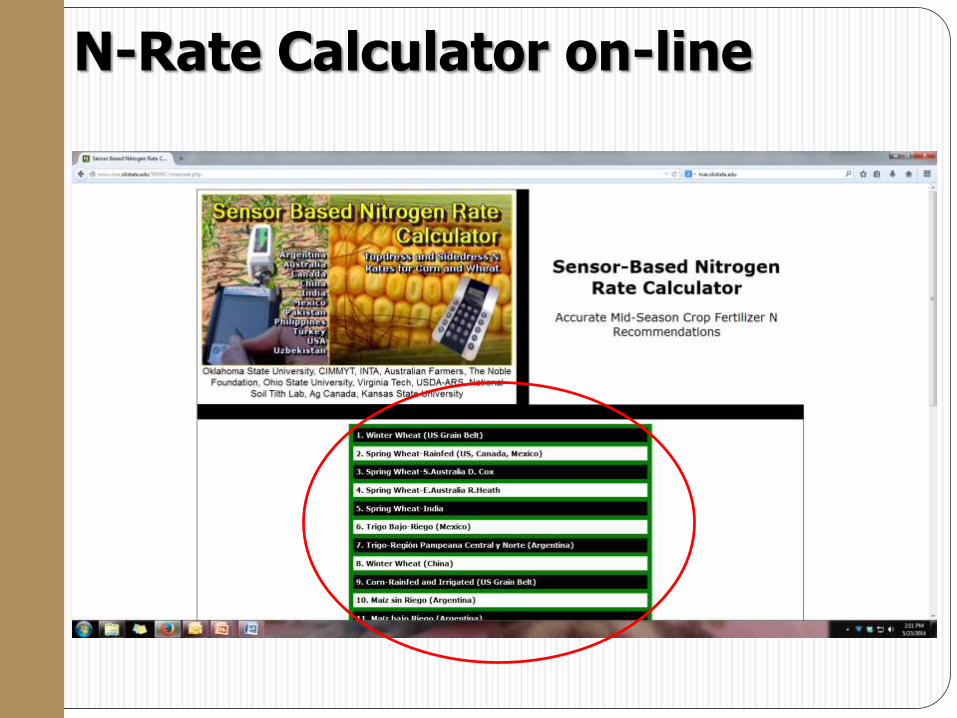
N-Rate Calculator on-line
www.nue.okstate.edu
N-Rate Calculator on-line

N-Rate Calculator on-line
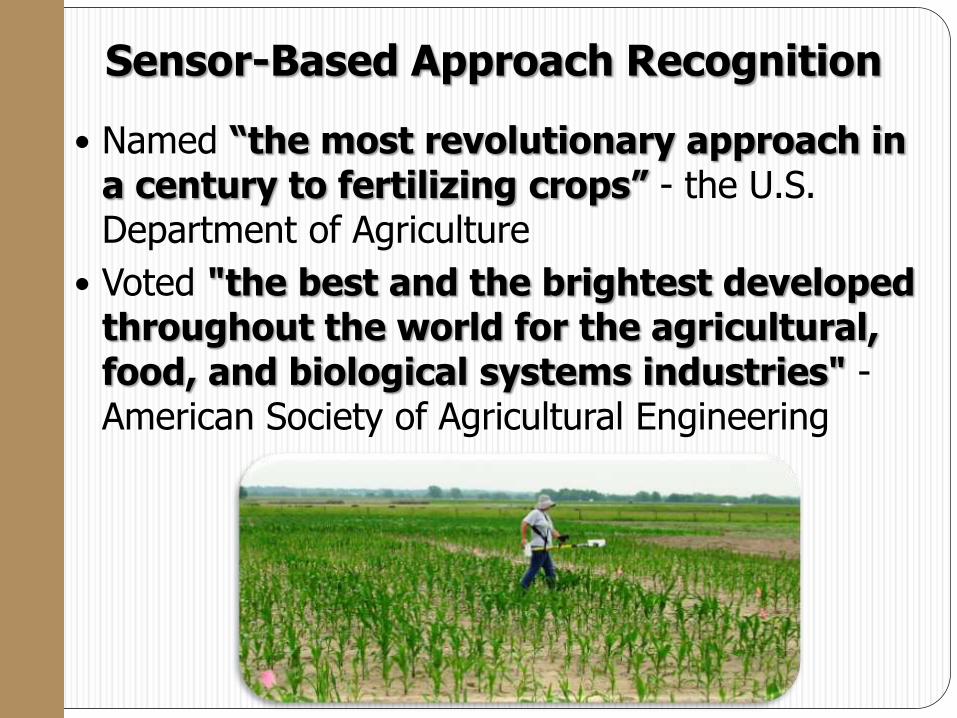
Sensor-Based Approach Recognition
Named “the most revolutionary approach in a century to fertilizing crops” - the U.S. Department of Agriculture
Voted "the best and the brightest developed throughout the world for the agricultural, food, and biological systems industries" -American Society of Agricultural Engineering