reference upper-air observations for climate · reference upper-air observations for climate ......
TRANSCRIPT

REFERENCE UPPER-AIR OBSERVATIONS FOR CLIMATE
From Concept to Reality
by G. E. bodEkEr, S. bojinSki, d. Cimini, r. j. dirkSEn, m. HaEffElin, j. W. HanniGan, d. f. HurSt, t. lEblanC, f. madonna, m. maturilli, a. C. mikalSEn, r. PHiliPona,
t. rEalE, d. j. SEidEl, d. G. H. tan, P. W. tHornE, H. VömEl, and j. WanG
The Global Climate Observing System (GCOS) Reference Upper-Air Network (GRUAN) has evolved from aspiration to reality and is now delivering reference-quality upper-air data products to a variety of users.
Photo of an upper-air balloon at the time of burst in the stratosphere. The camera was mounted on the balloon package, looking up. Photo courtesy of GRUAN Lead Centre, Lindenberg, Germany
F ive years ago, this publication announced ambitious plans for an atmospheric observing network to provide, for the first time, reference-quality (Immler et al. 2010, hereafter I2010) in
situ and ground-based remote sensing observations of upper-air essential climate variables (ECVs; Seidel et al. 2009; Bojinski et al. 2014). This network would support climate monitoring and research, as well as broader components of the global observing system (GOS), its research, and applications. Now the Global Climate Observing System (GCOS) Reference Upper-Air Network (GRUAN) has moved from concept to reality (Fig. 1). This update summarizes

the path GRUAN has taken over the past five years, milestones achieved, challenges overcome, and its road map for the future.
GRUAN has transformed since the 2005 workshop to define its observational requirements, from a plea by climate researchers for reference upper-air mea-surements to a concept for a global network providing such measurements to a community collaborating to
actualize coordinated, certified measurement pro-grams at sites comprising a truly reference-quality climate observing network.
This paper documents the next chapter in the story of how the GRUAN community has progressed in achieving the goal of constructing an observing network that, ultimately, will meet the challenges of climate science in the twenty-first century. If
AFFILIATIONS: bodEkEr—Bodeker Scientific, Alexandra, New Zealand; bojinSki—Space Programme, World Meteorological Organization, Geneva, Switzerland; Cimini—Istituto di Metodologie per l’Analisi Ambientale, Consiglio Nazionale delle Ricerche, Potenza, and Centro di Eccellenza di Telerilevamento e Modellistica Numerica per la Previsione di Eventi Severi, University of L’Aquila, L’Aquila, Italy; dirkSEn and VömEl—Lindenberg Meteorological Observatory, Deutscher Wetterdienst, Lindenberg, Germany; HaEffElin—L’Institut Pierre-Simon Laplace, Centre National de la Recherche Scientifique, Paris, France; HanniGan—Atmospheric Chemistry Division, National Center for Atmospheric Research, Boulder, Colorado; HurSt—Cooperative Institute for Research in Environmental Sciences, University of Colorado, and Global Monitoring Division, NOAA/Earth System Research Laboratory, Boulder, Colorado; lEblanC—Jet Propulsion Laboratory, California Institute of Technology, Wrightwood, California; madonna— Istituto di Metodologie per l’Analisi Ambientale Consiglio Nazionale delle Ricerche, Potenza, Italy; maturilli—Alfred Wegener Institute, Helmholtz Centre for Polar and Marine Research, Potsdam,
Germany; mikalSEn—Nansen Environmental and Remote Sensing Center, Bergen, Norway; PHiliPona—Federal Office of Meteorology and Climatology MeteoSwiss, Payerne, Switzerland; rEalE—NOAA/Center for Satellite Applications and Research, College Park, Maryland; SEidEl—NOAA/Air Resources Laboratory, College Park, Maryland; tan—European Centre for Medium-Range Weather Forecasts, Reading, United Kingdom; tHornE— Department of Geography, Maynooth University, Maynooth, County Kildare, Ireland; WanG—University at Albany, State University of New York, Albany, New YorkCORRESPONDING AUTHOR: Gregory E. Bodeker, Bodeker Scientific, 42 Russell Street, Alexandra, 9320, New ZealandE-mail: [email protected]
The abstract for this article can be found in this issue, following the table of contents.DOI:10.1175/BAMS-D-14-00072.1
In final form 6 February 2015©2016 American Meteorological Society
Fig. 1. Distribution of GRUAN sites at the time of publication of this article. Sites with certified measurement programs are shown in red, while sites in the process of being certified, or awaiting certification, are shown in blue. Previous GRUAN sites that are now inactive are shown in yellow. Sites for which GRUAN processed data are available are circled in green.
124 JANUARY 2016|

Fig. 2. GRUAN heritage and governance structure. Green arrows show reporting responsibilities, while red arrows show guidance responsi-bilities. Blue arrows show specific paths for guidance to GRUAN from the World Climate Research Programme (WRCP) and from WMO’s techni-cal commissions. Gray arrows show how GRUAN connects to the highest governing bodies. Gray box denotes what is referred to as “GRUAN.” (#1) WCRP identifies scientific and research requirements, while WMO identi-fies operational requirements. (#2) WG-GRUAN members are approved by Atmospheric Observation Panel for Climate (AOPC). (#3) The GCOS Steering Committee (GCOS SC) provides guidance to AOPC on GRUAN operations. (#4) GRUAN sites are contributed by members of WMO. UNEP = United Nations Environment Programme, IOC = Intergovernmental Oceanographic Commission, ICSU = International Council for Science, CBS = WMO Commission for Basic Systems, CAS = Commission for Atmospheric Sciences, and CCL = Commission for Climatology.
momentum within GRUAN is sustained, then in 50 years’ time researchers will be able to look back on the past five decades with con-fidence in the quality of the measurements, some-thing that is not true for the record over the past 50 years, in which most long-term upper-air mea-surement records contain significant ambiguity and uncertainty (Seidel et al. 2011a; Thorne et al. 2011).
K e y a s p e c t s o f t h e GRUAN chronicle, summa-rized here, are the organiza-tion and management of GRUAN; the establishment and certif ication of net-work sites; the current and planned data products; the scientific basis for GRUAN operations; and GRUAN’s contributions to the broader GOS. These advances have capitalized on the exper-tise, engagement, coop-eration, and dedication of the international research community. We encourage interested readers to partici-pate in the work of the GRUAN community to further develop and enhance the network.
HOW IS GRUAN MANAGED AND ORGA-NIZED? GRUAN is a heterogeneous network that includes sites supported by both research institutes and national weather services. With this in mind, the GRUAN governance structure (Fig. 2) was finalized in 2012 at a World Meteorological Orga nization (WMO) Integrated Global Observing System (WIGOS) pilot project meeting (WMO 2012). This structure enables WMO, through its technical commissions, to guide GRUAN on operational practices and procedures; to assist GRUAN to extend its operations to include a near-real-time operational mode of data delivery; and, in doing so, to assist in nurturing additional participation of WMO members in the desired GRUAN expansion (see “Outcomes of the GRUAN Network Expansion Workshop” section). Having sites emerge from both the research and operational
measurement communities requires careful man-agement and recognition of competing demands on different stations. Through the GRUAN Lead Centre (located in Lindenberg, Germany), the task team of site representatives, and the Working Group on GRUAN (WG-GRUAN), efforts are being made to provide appropriate support and guidance to all sites. The WG-GRUAN and its task teams, including ex-officio members and invited experts, meet annually at GRUAN implementation and coordination meetings (ICMs), which provide a forum for communication, coordination, WG-wide decision making, community building, and sharing of ideas and expertise (Fig. 3).
A key recent development has been the publication of The GCOS Reference Upper-Air Network (GRUAN) Manual (WMO 2013b) and The GCOS Reference Upper-Air Network (GRUAN) Guide (WMO 2013a). The manual describes mandatory operating protocols that are expected of participating sites, the GRUAN Lead Centre, and the WG-GRUAN to achieve
125JANUARY 2016AMERICAN METEOROLOGICAL SOCIETY |

Fig. 3. Attendees at the sixth GRUAN ICM held on 10–14 Mar 2014 near the GRUAN site of Howard University, Beltsville, Maryland (WMO 2014b).
GRUAN’s goals. The guide establishes the phi-losophy under which GRUAN operates and informs current and future GRUAN sites of the expected modus operandi of GRUAN. The guide also defines requirements for GRUAN site operations, including requirements on measurement uncertainty and the long-term stability of measurement time series. The mandatory practices detailed in these two documents reflect GRUAN’s primary goal of providing reference-quality observations of the atmospheric column while accommodating the diverse attributes of sites within the network.
WHAT OBSERVATIONAL DATA PRODUCTS AND SERVICES IS GRUAN PROVIDING? The foundation for GRUAN data product development. Key concepts of metrology (the science of measurements) form the theoretical basis for the creation of GRUAN data products and the pathway for establishing a reference-quality upper-air climate observation (I2010). Primary considerations include the choice of an appropriate instrument; protocols for collecting and archiving raw data and metadata; complete documentation of the measurement process to ensure repeatability, and traceability to the International System of Units (SI) or other internationally accepted standards; and a comprehensive uncertainty analysis.
Many existing upper-air climate data records omit archives of the raw data and the metadata required to 1) assess uncertainties in the measurements, 2) assess the temporal homogeneity of the record, and 3) allow reprocessing of the raw data. The collection of raw data and metadata is therefore a focus of GRUAN operations. Furthermore, historically, for many operational upper-air measurement programs, the use of quality assurance/quality control (QA/QC) proce-dures to maintain data quality has not been a high pri-ority since criteria for defining data quality of upper-air measurements cannot easily be established. GRUAN data products therefore include details of how a mea-surement is calibrated, conducted, corrected and quality controlled. In this way GRUAN establishes a long-term climate context for QA/QC procedures, thereby assuring that data inconsistencies due to instrumental differences and changes are minimized. This, in turn, requires identifying and quantifying these differences. Measurement uncertainties themselves are validated through comparisons with complementary measure-ments. Complete details of each GRUAN data product are documented in the international peer-reviewed literature for scrutiny and validation.
To fulfill the requirements for reference observa-tions, each GRUAN product emanates from a tailored raw data and metadata collection tool, deployed at
126 JANUARY 2016|

Fig. 4. Contributions of the various uncertainty terms to the total uncertainty estimate of the GRUAN tem-perature correction for a specific sounding performed at Lindenberg on 27 Sep 2013 (from Dirksen et al. 2014). Total uncertainty is the geometric sum of the squared individual uncertainties. Correction model is the estimated vertically resolved error on the temper-ature based on the estimated actinic flux. This error is subtracted from the measured temperature profile to produce the corrected ambient temperature.
each measurement site, to collate, screen, verify, and transmit to a centralized processing facility the data and metadata required to generate the product. Centralized data processing—together with high standards in hardware, software, and data process-ing; managed changes; and routine intercomparisons with measurements from complementary systems—ensures consistency across all GRUAN sites and consequent networkwide data homogeneity. Data products are disseminated from the central processing facility to the user communities through the National Oceanic and Atmospheric Administration (NOAA) National Climatic Data Center (NCDC).
The GRUAN Vaisala RS92 radiosonde data product. While the Vaisala RS92 radiosonde is used worldwide, including at 14 of the GRUAN sites, the proprietary “black box” nature of the Vaisala correction algo-rithms precludes the direct use of Vaisala-processed RS92 radiosonde data as a reference product. Tailored GRUAN data processing has therefore been devel-oped to correct temperature, pressure, humidity, and wind profiles for all known systematic biases and to generate vertically resolved estimates of the measure-ment random uncertainties (Dirksen et al. 2014).
The dominant source of RS92 measurement biases, solar radiation, causes temperature warm biases (partially compensated by ventilation) and humidity dry biases (Fig. 4). The humidity sensor also suffers from slow response times at cold temperatures. The corrections for radiation-related biases, and their uncertainties, are based on outcomes of experiments made at the GRUAN Lead Centre. Below 25-km altitude, GRUAN temperature sensor corrections are ~0.05 K smaller than those estimated by Vaisala, while at higher altitudes GRUAN corrections slightly exceed those of Vaisala (Fig. 6 of Dirksen et al. 2014). However, as Vaisala-corrected temperature profiles lie within the estimated uncertainties of GRUAN-corrected profiles, both corrected profiles are statistically indistinguishable. Because it is not clear which correction model (GRUAN or Vaisala) is more accurate, the temperature corrections used in the GRUAN processing are the average of the Lead Centre–determined temperature sensor corrections and those reconstructed using the publicly available Vaisala solar radiation correction table (Dirksen et al. 2014).
The response of the RS92 polymer humidity sensor slows with decreasing temperature. Below 233 K the response time is ~20 s, introducing cor-related humidity measurement uncertainties in the upper troposphere/lower stratosphere (UT/LS). The
time-lag correction and other minor corrections applied in the GRUAN processing of humidity mea-surements are discussed in Dirksen et al. (2014).
Other GRUAN products in development. GRUAN data products are also being developed for several other radiosondes. Following I2010 and Dirksen et al. (2014), the Centre National de la Recherche Scienti-fique (CNRS)/Météo-France and MeteoSwiss have been working with MétéoModem and Meteolabor, respectively, to describe, analyze, and quantify all sources of uncertainty in their temperature and relative humidity measurements; and to develop new radiation corrections to reduce temperature measurement uncertainties (Philipona et al. 2013). Multisonde measurements during two campaigns at Payerne, Switzerland, using the MétéoModem M10, the Meteolabor SRS-C34, and the Vaisala RS92 radiosondes, led to new correction methods for radiation-induced dry biases and time-lag errors in relative humidity measurements (Miloshevich et al. 2004). In close collaboration with the GRUAN Lead Centre, MeteoSwiss developed a data product for its SRS-C34 radiosonde that contains raw and corrected data with uncertainties for all measured variables. Similarly, CNRS is developing a data product for the M10 radiosonde that could allow for expansion of GRUAN to two French sites—the Site Instrumental de Recherche par Télédétection Atmosphérique (SIRTA)
127JANUARY 2016AMERICAN METEOROLOGICAL SOCIETY |

observatory, Paris, France (Haeffelin et al. 2005) and the Maïdo Observatory on Réunion Island (Baray et al. 2013)(see Fig. 1).
GRUAN sites are required to measure at least one high-quality water vapor profile in the UT/LS each month using the best instrumentation possible, typi-cally a balloonborne frost point hygrometer (WMO 2013a). GRUAN is currently developing water vapor profile data products, based on high-resolution (5–10 m) frost point temperature measurements, that include water vapor partial pressures (deter-mined directly from frost point temperatures), water vapor mixing ratios and relative humidities calcu-lated using concomitant radiosonde measurements of pressure and temperature, and altitude-dependent measurement uncertainty estimates for each of these parameters. Frost point hygrometer measurement uncertainties arise primarily from imprecise control of the amount of frost deposited on the chilled mirror. Smaller uncertainties propagate from the calibration of thermistors, spatial nonuniformities in mirror tem-perature, and errors in the pressure and temperature measurements by the linked radiosondes.
The t raceabi l it y of ground-based Globa l Navigation Satellite Systems (GNSS) total column water vapor (TCWV) measurements to high-precision (atomic clock) timing makes it appealing for climate observations. TCWV measurements at hourly reso-lution, or better, will be derived from ground-based GNSS measurements at all participating GRUAN sites. The data will be uniformly processed at the GRUAN central processing facility for GNSS measurements at GeoForschungsZentrum (GFZ) Potsdam, Germany. The TCWV product will provide consistent observational data to validate other water vapor measurement techniques, such as radiosondes, and will play an important role in studying high-frequency atmospheric variability.
The GRUAN lidar program provides a complete framework for all aspects of the planned lidar activi-ties, covering temperature, ozone, and water vapor profiles from near the ground into the stratosphere. The program is focused not only on suitable instru-ment design and standard operating procedures but also on a networkwide, standardized, and compre-hensive metadata recording system, and on central-ized and consistent data processing. At each site a GRUAN Lidar Instrumentation and Measurement Protocol document describes the full, uninterrupted history of the contributing instrument from the day of its certification. Centralized data processing is achieved through the GRUAN Lidar Analysis Software Suite.
GRUAN data products from Fourier transform spectroscopy (FTS) will initially include total columns of water vapor, methane, carbon dioxide, and ozone retrieved from high-resolution spectra acquired in the midinfrared to near-infrared using solar-viewing geometry that maximizes the signal-to-noise ratio. For some species, partial columns will also be retrieved. The archival of raw FTS spectra at the GRUAN central processing facility for FTS, in addition to being consistent with the needs of reference-quality observations, also presents an exciting opportunity for GRUAN—ongoing develop-ments in laboratory spectroscopy may enable future reanalysis of archived spectra for additional species. The FTS remote sensing technique and associated retrieval method provide a robust theoretical frame-work for tracking sources of uncertainty through to the GRUAN data products. The current focus is on including ongoing and consistent use of internal instrument calibrations and SI-traceable auxiliary data in the retrieval process.
Microwave radiometer (MWR) observations are used to infer temperature and water vapor profiles, TCWV, and total cloud liquid water. Work is under-way to investigate calibration methodologies for SI traceability (Walker 2011); to disentangle the associ-ated uncertainty (Paine et al. 2014); to monitor and manage changes (Löhnert and Maier 2012); and, finally, to make the entire data life cycle transparent, documented, and accessible (Cadeddu et al. 2013). Reciprocal links with other existing MWR networks, such as the Atmospheric Radiation Measurement Program (ARM; Cadeddu et al. 2013) and the network of ground-based MWRs (MWRnet; Cimini et al. 2012), are being established. MWR adds value to GRUAN by providing temperature and water vapor profile measurements that complement other instru-ments and that sample time–altitude cross sections continuously at high (e.g., 1 min) resolution.
Facilitating the use of GRUAN data products in satellite cal/val. The satellite calibration and validation (cal/val) community has been identified as a key group of users of GRUAN data products. In support of satellite cal/val, since July 2014 the NOAA Products Validation System (NPROVS; Reale et al. 2012) has routinely processed satellite collocations with measurements at GRUAN sites. The specific use of the measurement uncertainties available with the GRUAN reference observations provides significant advantages in validation. This is relevant not only for the satellite products but also for radiative transfer modeling and satellite sensor monitoring, including
128 JANUARY 2016|

the transfer of uncertainty budget information from the geophysical profile to sensor/radiative transfer model space. Similarly, the collocation information arising from this comparison provides a valuable piece of metadata to GRUAN profiles and allows for comparisons between stations across GRUAN for each satellite. Currently, the analysis contains no specified uncertainty on the satellite measurements and also no consideration of collocation uncertainty (Fassò et al. 2014). Collocation experiments based on GRUAN profiles, satellite soundings, and GNSS-based radio occultations are expected to provide further insight (WMO 2014a).
WHERE WILL NEW SITES BE ESTABLISHED? Outcomes of the GRUAN Network Expansion Workshop. To guide the expansion of GRUAN to 35–40 sites, a workshop to develop network design and expansion criteria was held in 2012. Four primary applications of GRUAN data were considered, namely, climate change detection and attribution; satellite calibration and validation; atmospheric process studies; and numerical weather prediction (NWP).
It was agreed that the complete range of climate regimes should be sampled by GRUAN sites in both hemispheres (polar, midlatitude, subtropical, and tropical). Sites should span a variety of surfaces, such as forest, deserts, snow, and ice, as well as small and remote islands (representing ocean conditions), remote mountain sites, and regions influenced by urban pollution. Sites should provide information about a variety of large-scale modes of variability, such as El Niño–Southern Oscillation. Observations are required at peak amplitudes and at the nodes of patterns. Sites in the tropics, South America, Africa, and Antarctica are strongly desired to address the current dearth of sites in these regions. All else being equal, sites with an existing history of measurements should be selected. There are many facets where GRUAN operation can benefit from the skills and expertise already available through allied atmospheric observation networks. GRUAN sites can serve as anchor points within the wider global upper-air observing network. Strategic placement to best facilitate comparisons with observations from these wider networks will be considered.
Developing observational products for radiation, clouds, and wind profiles was seen as the next priority. It was noted that clear-sky conditions minimize uncertainties from radiative transfer modeling, whereas for process studies, sites exhibiting a wide range of phe-nomena over a short time are preferable. Collocation of observations with the satellite-based measurements is
essential for satellite characterization and would offer synergistic benefit to the broader GOS and to NWP applications (e.g., Peubey and Bell 2014). As such, analyses to optimize observing schedules and thus to avoid making excessive measurements are desirable. Assessment techniques such as observing system simu-lation experiments, observing system experiments, and ensemble data assimilation impact studies could give insights into how a site might affect NWP or reanalyses. However, in their present form, these techniques do not readily measure what are arguably the most valuable, but “indirect,” benefits of a GRUAN site; for example, GRUAN measurements in some region may indirectly lead to an improvement in the quality of observations at nearby sites and to better-calibrated satellite observa-tions. Thus, NWP-based studies to assess the utility of sites would need careful development in collaboration with the NWP community.
The GRUAN site assessment and certif ication process. GRUAN recognizes that vigilance is required to con-sistently and reliably meet the high standards it has set for itself. To ensure that all sites within GRUAN operate at a level that maintains GRUAN’s status as a reference-quality upper-air climate monitoring net-work, sites are required to undergo formal assessment and certification. Much of the scientific benefit that will accrue from GRUAN results from the required homogeneity of the reference-quality standard of the measurements made at network sites. The site certifi-cation process assures all stakeholders (users and the participating sites) that all sites operate to the same reference-quality standards.
Sites submit individual GRUAN data streams for certification as they are developed, documented, and deployed. Therefore, sites need not submit all instruments to the process, although they are strongly encouraged to do so. Site assessment and certification is the joint responsibility of the WG-GRUAN and the GRUAN Lead Centre. Sites seeking to become GRUAN sites are assessed first as to their ability to meet the mandatory operating protocols and then as to the added value they bring to the network. This added value includes expertise in future data products to be developed in GRUAN, value to key users of the site, contributions to task teams and GRUAN science activities, and measurement heritage. To promptly identify potential problems, site reviews are per-formed annually based onsite reports and assessments of site data f low and performance by the GRUAN Lead Centre. More complete audits of sites will be un-dertaken every three to four years. Site responsibilities are demanding, but there are some carrots to balance
129JANUARY 2016AMERICAN METEOROLOGICAL SOCIETY |

the sticks: GRUAN-certified measurement programs are recognized by funding agencies and data users as state of the art. Measurements from GRUAN-certified programs are anchored to a reference network that provides traceability to internationally recognized measurement standards.
New sites coming into GRUAN. Most of the 15 sites that were originally identified as candidates for hosting GRUAN-certified measurement programs remain today (Fig. 1). The first site to host a GRUAN-certified RS92 radiosonde measurement program is Ny-Ålesund, which is located in the high Arctic (Fig. 5). With Ny-Ålesund being a supersite for international and interdisciplinary Arctic research, the atmospheric observations at the German–French Alfred Wegener Institute–Paul Emile Victor (AWIPEV) research base provide a large suite of measurements. RS92 radiosondes are launched daily at noon. To comply with GRUAN requirements, the radiosonde launch procedure was restructured and optimized in terms of timing and demands on operators. While the standard Vaisala ground check and an additional measurement in a test chamber with 100% relative humidity were already standard, additional surface measurements in a ventilated weather hut were introduced. The measurement program certifica-tion process has stimulated site operators to reassess the operating protocols for other measurement programs that are candidates for generating GRUAN data products. The GRUAN measurement ethos has thereby already effected improvements in these measurement programs for the benefit of the long-term datasets and the site. Sites from Africa, South America, Antarctica, and small islands are being actively encouraged to join GRUAN.
HOW DOES SCIENCE INFORM GRUAN OPERATIONS AND PLANS? The success of GRUAN is contingent on the network operating at the highest possible standard. This is best achieved through research to inform GRUAN operations, published in the peer-reviewed literature for scrutiny by the global community. Examples of GRUAN research follow.
The process of quantifying and correcting known measurement biases is challenging. In support of understanding solar radiation–induced biases in radiosonde measurements, Philipona et al. (2012) reported simultaneous solar shortwave radiation, thermal longwave radiation, and air temperature measurements with radiosondes from the Earth’s surface to 35-km altitude during both daytime and
nighttime. They then demonstrated that under sun-shaded and unshaded conditions, solar radiation produces a radiative heating of about 0.2 K near the surface that linearly increases to about 1 K at 32 km (Philipona et al. 2013).
The correction schemes developed for the RS92 radiosonde data products have proven useful for de-veloping correction methods for historical radiosonde data (Wang et al. 2013) and for validating the preflight corrections applied in the Vaisala ground-station software (Yu et al. 2015). The algorithm developed by Wang et al. (2013) to correct for the solar radiation dry bias in historical radiosonde humidity data led to a reduction in mean biases and better agreement with independent measurements.
Given the limited resources available at many sites, various studies have been undertaken to answer important questions concerning the detection of long-term trends in different ECVs:
1) How often do measurements need to be made so that measurement frequency is not the limiting factor in detecting trends? What is the trade-off between making low-cost high-frequency measurements and high-cost low-frequency measurements?
2) Where should measurements be made? Are there regions where trends may be more readily detectable?
3) For how long will measurements need to be made to detect expected trend?
Boers and van Meijgaard (2009) used an ensemble of simulations from a regional climate model to esti-mate the expected change in water vapor at ~300 hPa between 1950 and 2100. They concluded that it would be necessary to conduct observations at Cabauw for at least 50 years before a statistically significant trend would be detectable (within 20% of the model-projected trend). Whiteman et al. (2011) also investi-gated the time to detect water vapor trends at ~200 hPa and concluded that, under the most optimistic sce-narios and assuming no measurement uncertainties, it would take at least 12 years of daily observations at the Southern Great Plains site in northern Oklahoma. The differences between these studies result from the different data sources, methodologies, geographic locations, and pressure levels used. Whiteman et al. (2011) also concluded that trend detection times at 200 hPa are much more sensitive to the frequency of measurements than to the random measurement uncertainties because of the high natural variability in upper-tropospheric water vapor.
130 JANUARY 2016|

Validating derived measurement uncertainties requires access to observations of atmospheric pro-files using different, complementary, nominally col-located measurements. In practice there may be some spatial and/or temporal separation between measure-ments. A spatial drift in a profile measurement, such as that obtained from a radiosonde, can complicate intercomparisons with profile measurements from
other fixed systems (e.g., lidar) and with space-based profile measurements. To provide a quantitative basis for determining the effects of balloon drift on the spatial representativeness of radiosonde measure-ments, Seidel et al. (2011b) generated a comprehensive climatology of radiosonde drift distance and ascent time from 2 years of data from 419 radiosonde sites, with particular attention to GRUAN sites. Typical
Fig. 5. Images of GRUAN operations at Ny-Ålesund. (top) Sequence of launch condition photos from the Norwegian Polar Institute webcam on Zeppelin Mountain on 27–29 May 2013. (middle) Launch of an ozonesonde. (from bottom left to bottom right) GRUAN site plaque, 100% relative humidity chamber, and ventilated weather hut for outside launch condition comparison.
131JANUARY 2016AMERICAN METEOROLOGICAL SOCIETY |
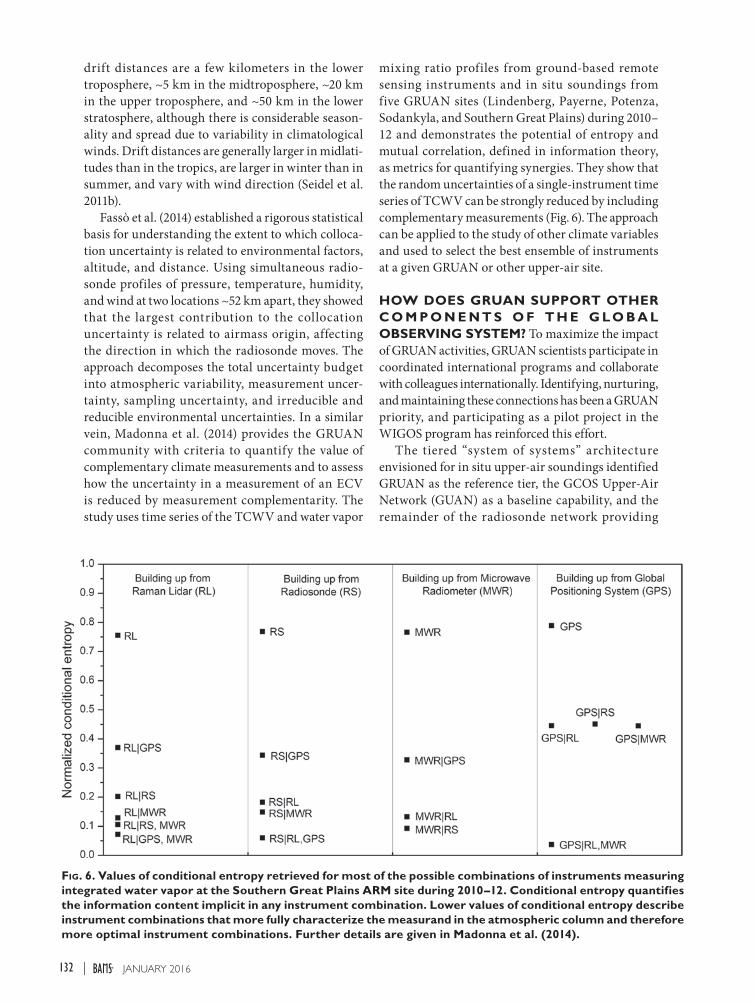
Fig. 6. Values of conditional entropy retrieved for most of the possible combinations of instruments measuring integrated water vapor at the Southern Great Plains ARM site during 2010–12. Conditional entropy quantifies the information content implicit in any instrument combination. Lower values of conditional entropy describe instrument combinations that more fully characterize the measurand in the atmospheric column and therefore more optimal instrument combinations. Further details are given in Madonna et al. (2014).
drift distances are a few kilometers in the lower troposphere, ~5 km in the midtroposphere, ~20 km in the upper troposphere, and ~50 km in the lower stratosphere, although there is considerable season-ality and spread due to variability in climatological winds. Drift distances are generally larger in midlati-tudes than in the tropics, are larger in winter than in summer, and vary with wind direction (Seidel et al. 2011b).
Fassò et al. (2014) established a rigorous statistical basis for understanding the extent to which colloca-tion uncertainty is related to environmental factors, altitude, and distance. Using simultaneous radio-sonde profiles of pressure, temperature, humidity, and wind at two locations ~52 km apart, they showed that the largest contribution to the collocation uncertainty is related to airmass origin, affecting the direction in which the radiosonde moves. The approach decomposes the total uncertainty budget into atmospheric variability, measurement uncer-tainty, sampling uncertainty, and irreducible and reducible environmental uncertainties. In a similar vein, Madonna et al. (2014) provides the GRUAN community with criteria to quantify the value of complementary climate measurements and to assess how the uncertainty in a measurement of an ECV is reduced by measurement complementarity. The study uses time series of the TCWV and water vapor
mixing ratio profiles from ground-based remote sensing instruments and in situ soundings from five GRUAN sites (Lindenberg, Payerne, Potenza, Sodankyla, and Southern Great Plains) during 2010–12 and demonstrates the potential of entropy and mutual correlation, defined in information theory, as metrics for quantifying synergies. They show that the random uncertainties of a single-instrument time series of TCWV can be strongly reduced by including complementary measurements (Fig. 6). The approach can be applied to the study of other climate variables and used to select the best ensemble of instruments at a given GRUAN or other upper-air site.
HOW DOES GRUAN SUPPORT OTHER C O M P O N E N T S O F T H E G L O B A L OBSERV ING SYSTEM? To maximize the impact of GRUAN activities, GRUAN scientists participate in coordinated international programs and collaborate with colleagues internationally. Identifying, nurturing, and maintaining these connections has been a GRUAN priority, and participating as a pilot project in the WIGOS program has reinforced this effort.
The tiered “system of systems” architecture envisioned for in situ upper-air soundings identified GRUAN as the reference tier, the GCOS Upper-Air Network (GUAN) as a baseline capability, and the remainder of the radiosonde network providing
132 JANUARY 2016|

regional detail (Seidel et al. 2009). Realizing this vision requires close connections between GRUAN and the remaining components. Examples of knowl-edge transfer leading to improvements beyond GRUAN include the following:
• Developing GRUAN data products for radiosonde models used at GRUAN sites has improved our understanding of instrument performance; modi-fications to the MétéoModem sonde are being implemented throughout the Modem network (see “Other GRUAN products in development” section).
• GRUAN instruments provided reference obser-vations for a radiosonde intercomparison. For the first time in more than half a century of the WMO Commission for Instruments and Methods of Observation (CIMO) upper-air campaigns, sonde biases (not merely differences) could be assessed (Nash et al. 2011).
• GRUAN experience in station performance tracking is helping GUAN address long-standing network management and monitoring concerns.
• GRUAN planning efforts are contributing to discussions regarding the future composition and operation of GUAN
In 2012, GRUAN partnered with the Network for the Detection of Atmospheric Composition Change to realize benefits of sustained cooperation and joint development of data streams and analysis capabilities. In 2014, WIGOS convened a meeting of GRUAN, the Global Space-Based Inter-Calibration System, and the GNSS radio occultation community to explore potential synergies and cobenefits (WMO 2014). Through these and other cooperative activities, GRUAN is well placed to contribute to the Global Framework for Climate Services and the European Commission’s Copernicus Climate Change Service (see www.gfcs-climate.org/ and www.ecmwf.int /en/about/what-we-do/copernicus/copernicus -climate-change-service). These initiatives recognize that sustained observations of the highest quality are part of the essential infrastructure for generating the climate data needed for societal benefit in key sectors such as disaster risk reduction, agriculture, health, and resource management (WMO 2011).
HOW CAN INDIVIDUALS AND INSTITU-TIONS PARTICIPATE IN GRUAN? There are many ways to get involved in GRUAN and such engagement has many benefits. The pool of skills, expertise, and knowledge developed within GRUAN
is not a conserved quantity, and new sites entering the network will benefit from the considerable invest-ment of time and finances to date by existing sites. For a marginal additional investment to meet the requirements of GRUAN, the quality of measure-ments at new sites can be improved at a much smaller cost than if the site were to work in isolation. National Meteorological Services and sites interested in joining GRUAN should contact the Lead Centre to initiate discussions and to become informed on require-ments. Instrument experts are always welcome to provide insights on the development, assessment, and improvement of GRUAN data streams and to contrib-ute to the work of the GRUAN task teams. Finally, all GRUAN data products are served without restriction for use by researchers. The use of measurements with robust uncertainty estimates has many potential applications, and readers are strongly encouraged both to use and provide constructive feedback on GRUAN products as they are developed and deployed.
THE FUTURE OF GRUAN. As documented above, the GRUAN community has made sig-nificant advances toward achieving the goal of a global reference-quality upper-air climate observing system that was first envisaged in the mid-2000s. To meet the clearly articulated observational needs of organizations such as the Intergovernmental Panel on Climate Change, and to maintain existing momentum, GRUAN needs the commitment of national meteorological services in supporting the operation of GRUAN sites, in establishing new sites in regions currently not represented in the network, in demonstrating the utility of GRUAN reference data by the climate research community, and in committing long-term support from national funding agencies. While the WG-GRUAN remains committed to meeting the needs of the global climate community, fulfilling those needs will require resourcing by a wide range of national and international agencies. We, as representatives of the GRUAN community, look forward to reporting on further progress in a future article.
ACKNOWLEDGMENTS. Part of the research was carried out at the Jet Propulsion Laboratory, California Institute of Technology, under a contract with the National Aeronautics and Space Administration.
REFERENCESBaray, J. L., and Coauthors, 2013: Maïdo observa-
tory: A new high-altitude station facility at Reunion
133JANUARY 2016AMERICAN METEOROLOGICAL SOCIETY |
Island (21°S, 55°E) for long-term atmospheric remote sensing and in situ measurements. Atmos. Meas. Tech., 6, 2865–2877, doi:10.5194/amt-6-2865 -2013.
Boers, R., and E. van Meijgaard, 2009: What are the demands on an observational program to detect trends in upper tropospheric water vapor anticipated in the 21st century? Geophys. Res. Lett., 36, L19806, doi:10.1029/2009GL040044.
Bojinski, S., M. Vertraete, T. C. Peterson, C. Richter, A. Simmons, and M. Zemp, 2014: The concept of essential climate variables in support of climate research, applications, and policy. Bull. Amer. Meteor. Soc., 95, 1431–1443, doi:10.1175/BAMS-D-13-00047.1.
Cadeddu, M. P., J. C. Liljegren, and D. D. Turner, 2013: The Atmospheric Radiation Measurement (ARM) Program network of microwave radiometers: Instrumentation, data, and retrievals. Atmos. Meas. Tech., 6, 2359–2372, doi:10.5194/amt-6-2359-2013.
Cimini, D., and Coauthors, 2012: An international network of ground-based microwave radiometers for the assimilation of temperature and humidity profiles into NWP models. Proc. Ninth Int. Symp. on Tropospheric Profiling, L’Aquila, Italy, European Space Agency, P45. [Available online at http://cetemps.aquila.infn.it/istp/proceedings/Session _P_Posters/P45_Cimini.pdf.]
Dirksen, R. J., M. Sommer, F. J. Immler, D. F. Hurst, R. Kivi, and H. Vömel, 2014: Reference quality upper-air measurements: GRUAN data processing for the Vaisala RS92 radiosonde. Atmos. Meas. Tech., 7, 4463–4490, doi:10.5194/amt-7-4463-2014.
Fassò, A., R. Ignaccolo, F. Madonna, B. B. Demoz, and M. Franco-Villoria, 2014: Statistical modelling of collocation uncertainty in atmospheric thermody-namic profiles. Atmos. Meas. Tech., 7, 1803–1816, doi:10.5194/amt-7-1803-2014.
Haeffelin, M., and Coauthors, 2005: SIRTA, a ground-based atmospheric observatory for cloud and aerosol research. Ann. Geophys., 23, 253–275, doi:10.5194 /angeo-23-253-2005.
Immler, F. J., J. Dykema, T. Gardiner, D. N. Whiteman, P. W. Thorne, and H. Vömel, 2010: Reference quality upper-air measurements: Guidance for develop-ing GRUAN data products. Atmos. Meas. Tech., 3, 1217–1231, doi:10.5194/amt-3-1217-2010.
Löhnert, U., and O. Maier, 2012: Operational profiling of temperature using ground-based microwave radiometry at Payerne: Prospects and challenges. Atmos. Meas. Tech., 5, 1121–1134, doi:10.5194/amt -5-1121-2012.
Madonna, F., M. Rosoldi, J. Güldner, A. Haefele, R. Kivi, M. P. Cadeddu, D. Sisterson, and G. Pappalardo, 2014:
Quantifying the value of redundant measurements at GRUAN sites. Atmos. Meas. Tech., 7, 3813–3823, doi:10.5194/amt-7-3813-2014.
Miloshevich, L. M., A. Paukkunen, H. Vömel, and S. J. Oltmans, 2004: Development and validation of a time-lag correction for Vaisala radiosonde humidity mea-surements. J. Atmos. Oceanic Technol., 21, 1305–1327, doi:10.1175/1520-0426(2004)021<1305:DAVOAT >2.0.CO;2.
Nash, J., T. Oakley, H. Vömel, and L. Wei, 2011: WMO intercomparison of high quality radiosonde systems. IOM-107, WMO/TD-1580, 249 pp.
Paine, S. N., D. D. Turner, and N. Küchler, 2014: Understanding thermal drift in liquid nitrogen loads used for radiometric calibration in the field. J. Atmos. Oceanic Technol., 31, 647–655, doi:10.1175 /JTECH-D-13-00171.1.
Peubey, C., and W. Bell, 2014: The influence of frequency shifts in microwave sounder channels on NWP analyses and forecasts. J. Atmos. Oceanic Technol., 31, 788–807, doi:10.1175/JTECH-D-13-00016.1.
Philipona, R., A. Kräuchi, and E. Brocard, 2012: Solar and thermal radiation profiles and radiative forcing measured through the atmosphere. Geophys. Res. Lett., 39, L13806, doi:10.1029/2012GL052087.
—, and Coauthors, 2013: Solar and thermal radiation errors on upper-air radiosonde temperature mea-surements. J. Atmos. Oceanic Technol., 30, 2382–2393, doi:10.1175/JTECH-D-13-00047.1.
Reale, T., B. Sun, F. H. Tilley, and M. Pettey, 2012: The NOAA Products Validation System (NPROVS). J. Atmos. Oceanic Technol., 29, 629–645, doi:10.1175 /JTECH-D-11-00072.1.
Seidel, D. J., and Coauthors, 2009: Reference upper-air observations for climate: Rationale, progress, and plans. Bull. Amer. Meteor. Soc., 90, 361–369, doi:10.1175/2008BAMS2540.1.
—, N. P. Gillett, J. R. Lanzante, K. P. Shine, and P. W. Thorne, 2011a: Stratospheric temperature trends: Our evolving understanding. Wiley Interdiscip. Rev.: Climate Change, 2, 592–616, doi:10.1002/wcc.125.
—, B. Sun, M. Pettey, and A. Reale, 2011b: Global radiosonde balloon drift statistics. J. Geophys. Res., 116, D07102, doi:10.1029/2010JD014891.
Thorne, P. W., J. R. Lanzante, T. C. Peterson, D. J. Seidel, and K. P. Shine, 2011: Tropospheric tem-perature trends: History of an ongoing controversy. Wiley Interdiscip. Rev.: Climate Change, 2, 66–88, doi:10.1002/wcc.80.
Walker, D. K., 2011: Microwave radiometric standards development at US National Institute of Standards and Technology. IEEE Geoscience and Remote Sensing Newsletter, No. 161, Institute of Electrical
134 JANUARY 2016|

and Electronic Engineers, Inc., Piscataway, NJ, 59–62
Wang, J., L. Zhang, A. Dai, F. Immler, M. Sommer, and H. Vömel, 2013: Radiation dry bias correction of Vaisala RS92 humidity data and its impacts on his-torical radiosonde data. J. Atmos. Oceanic Technol., 30, 197–214, doi:10.1175/JTECH-D-12-00113.1.
Whiteman, D. N., K. C. Vermeesch, L. D. Oman, and E. C. Weatherhead, 2011: The relative importance of random error and observation frequency in detecting trends in upper tropospheric water vapor. J. Geophys. Res., 116, D21118, doi:10.1029/2011JD016610.
WMO, 2011: Climate knowledge for action: A global framework for climate services; Empowering the most vulnerable. Rep. of the High-Level Taskforce for the Global Framework for Climate Services, WMO-1065, 240 pp. [Available online at ftp://ftp .wmo.int/Documents/SESSIONS/Cg-XVI/English /DOCs/d11-1(1)_1065_HLT_report_en.pdf.]
—, 2012: Report from the WIGOS Pilot Project Meeting on GRUAN observing practices and governance. WMO Final Rep., GCOS-155, 22 pp.
[Available online at www.wmo.int/pages/prog/gcos /Publications/gcos-155.pdf.]
—, 2013a: The GCOS Reference Upper-Air Network (GRUAN) guide. Version 1.1.0.3, WIGOS Tech. Rep. 2013-03, GCOS-171, 116 pp. [Available online at www .wmo.int/pages/prog/gcos/Publications/gcos-171.pdf.]
—, 2013b: The GCOS Reference Upper-Air Network (GRUAN) manual. Version 1.1.0.3, WIGOS Tech. Rep. 2013-02, GCOS-170, 11 pp. [Available online at www.wmo.int/pages/prog/gcos/Publications /gcos-170.pdf.]
—, 2014a: GRUAN-GSICS-GNSSRO WIGOS Workshop on Upper-Air Obser v ing System Integration and Application. Final Rep., 59 pp. [Available online at www.wmo.int/pages/prog /www/WIGOS-WIS/reports/3G-WIGOS-WS2014 .pdf.]
Yu, H., P. E. Ciesielski, J. Wang, H.-C. Kuo, H. Vömel, and R. Dirksen, 2015: Evaluation of humidity cor-rection methods for Vaisala RS92 tropical sound-ing data. J. Atmos. Oceanic Technol., 32, 397–411, doi:10.1175/JTECH-D-14-00166.1.
BEST SELLER! “ Here before you is the complete guide to writing a good scientific paper….
Prepare to absorb what may prove the most valuable advice you will receive as a scientist.” — from the Foreword by Prof. Kerry Emanuel, Massachusetts Institute of Technology
Eloquent Science: A Practical Guide to Becoming a Better Writer, Speaker, and Atmospheric Scientist DAVID M. SCHULTZ
A MUST- HAVE!
What started out as a communications workshop for undergrads in atmospheric science evolved into a book that would benefit scientists at any stage in their careers. Drawing on Schultz’s experience as a journal editor and prolific writer, the insights of his colleagues, and the best advice from hundreds of sources, this must-have reference includes: n Tips for writing and reviewing scientific papers and a peek into
the operations of the publishers of scientific journals n Guidance on creating and delivering effective scientific presentations n Experts’ advice on citing others’ work, critiquing scientific
papers, communicating with the media, and more LIST $45 MEMBER $30 © 2009, PAPERBACK, 440 PAGES, ISBN 13: 978-1-878220-91-2, AMS CODE: ESCI
O R D E R T O D A Y ! ONLINE AMS BOOKSTORE www.ametsoc.org/amsbookstore OR use the order form in this magazine
half-page horizontal -- 6.5” x 4.5625”: Final 135JANUARY 2016AMERICAN METEOROLOGICAL SOCIETY |

*Cost for delivery outside of the U.S. is $40.95. Weatherwise is available to AMS Members through a cooperative agreement with Taylor & Francis Group LLC, the publishers of Weatherwise.
Want your own?Then order a personal subscription at the same great price.
Written for a general audience, Weatherwise offers a colorful and nontechnical look at recent discoveries in meteorology and climatology. Check out the latest table of contents at www.weatherwise.org.
Looking for the perfect present for the weather enthusiast in your life? Want to make a valuable contribution to your local library or community college? Send a subscription to Weatherwise magazine (calendar year) for just $24.95*—That’s nearly 50% off the list price!
Contact Member Services by e-mail at [email protected] or by phone at617-227-2425 to place all of your Weatherwise orders today!
Could Atmospheric Conditions Have Sunk the Titanic?
MARCH / APRIL 2013 WWW.WEATHERWISE.ORG
HURRICANE
SANDY
GIVE A GREAT GIFT AT A GREAT PRICE
AMS MEMBERS