refinery outages: first half 2017 - u.s. energy ... · pdf filerefinery outages: first half...
TRANSCRIPT

Planned Refinery Outages in the United States: December 2017-June 2018
February 2018
Independent Statistics & Analysis
www.eia.gov
U.S. Department of Energy
Washington, DC 20585

U.S. Energy Information Administration | Refinery Outages: December 2017 to June 2018 i
This report was prepared by the U.S. Energy Information Administration (EIA), the statistical and analytical agency within the U.S. Department of Energy. By law, EIA’s data, analyses, and forecasts are independent of approval by any other officer or employee of the United States Government. The views in this report therefore should not be construed as representing those of the U.S. Department of Energy or other federal agencies.
U.S. Energy Information Administration | Refinery Outages: December 2017 to June 2018 ii
Table of Contents
1. Preface ...................................................................................................................................................... 1
2. Executive Summary ................................................................................................................................... 2
3. Methodology: Refinery Modeling and Base Cases ................................................................................... 3
4. Recent Market Conditions ........................................................................................................................ 4
5. East Coast Regional Outage Review .......................................................................................................... 7
6. Midwest (PADD 2) Regional Outage Review ........................................................................................... 11
7. Gulf Coast Regional Outage Review ........................................................................................................ 16
8. Rocky Mountain Regional Outage Review .............................................................................................. 20
9. West Coast Regional Outage Review ...................................................................................................... 24
U.S. Energy Information Administration | Refinery Outages: December 2017 to June 2018 iii
Tables Table 1. East Coast (PADD 1) planned refinery capacity outages ................................................................. 7 Table 2. Midwest (PADD 2) planned refinery capacity outages ................................................................. 11 Table 3. Gulf Coast (PADD 3) planned refinery capacity outages ............................................................... 16 Table 4. Rocky Mountain (PADD 4) planned refinery capacity outages ..................................................... 20 Table 5. West Coast (PADD 5) planned refinery capacity outages ............................................................. 24
Figures Figure 1. U.S. refinery production base-case results vs. 2016 actual ........................................................... 4 Figure 2. East Coast (PADD 1) planned refinery capacity outages ................................................................ 9 Figure 3. East Coast (PADD 1) production losses as a result of planned outages....................................... 10 Figure 4. East Coast (PADD 1) petroleum product inventories, 2016–present .......................................... 10 Figure 5. Midwest (PADD 2) planned refinery capacity outages ................................................................ 13 Figure 6. Midwest (PADD 2) production losses as a result of planned outages ......................................... 14 Figure 7. Midwest (PADD 2) petroleum product inventories, 2016–present ............................................. 14 Figure 8. Gulf Coast (PADD 3) planned refinery capacity outages .............................................................. 18 Figure 9. Gulf Coast (PADD 3) production losses as a result of planned outages....................................... 19 Figure 10. Gulf Coast (PADD 3) petroleum product inventories, 2016–present ........................................ 19 Figure 11. Rocky Mountain (PADD 4) planned refinery capacity outages .................................................. 22 Figure 12. Rocky Mountain (PADD 4) production losses as a result of planned outages ........................... 22 Figure 13. Rocky Mountain (PADD 4) petroleum product inventories, 2016–present .............................. 23 Figure 14. West Coast (PADD 5) planned refinery capacity outages .......................................................... 26 Figure 15. West Coast (PADD 5) production losses as a result of planned outages ................................... 26 Figure 16. West Coast (PADD 5) petroleum product inventories, 2016–present....................................... 27

February 2018
U.S. Energy Information Administration | Refinery Outages: December 2017 to June 2018 1
1. Preface In this report, the U.S. Energy Information Administration (EIA) examines U.S. refinery outages planned for December 2017 through June 2018 and the implications for available refinery production capacity, petroleum product markets, and the supply of gasoline, diesel fuel, and jet fuel. EIA’s dissemination of this analysis is intended to benefit market participants who may otherwise be unable to access such information.
Refinery outages result from both the planned shutdown of refinery units for maintenance and upgrades as well as from unplanned shutdowns from a variety of causes such as mechanical failure, bad weather, power failures, fire, and flooding. Operators typically schedule planned maintenance when refined petroleum product consumption is relatively low—in the fall and winter when there is less demand for transportation fuels in the United States.
This report analyzes the potential implications of planned shutdowns of various refinery units as reported by Industrial Info Resources (IIR) using individual refinery models from PRISM software developed by Baker & O’Brien, Inc. The IIR data used in this analysis are as of October 17, 2017. The specific refinery units analyzed are atmospheric crude distillation units (ACDU), fluidized catalytic cracking units (FCCU), catalytic reforming units (CRU), hydrocracking units (HU), and coking units (CU). Definitions of these units can be found in the EIA glossary. A more detailed discussion of the methodology can be found below in Section 3.
This report focuses on how planned refinery outages may affect the adequacy of regional gasoline, diesel fuel, and jet fuel by region, using Petroleum Administration for Defense Districts (PADDs)1.
National supply and demand balances are insufficient to understand these dynamics across the United States because they have very limited implications for the regional adequacy of petroleum product supply because of pipeline infrastructure, geography, and marine shipping regulations that constrain the amount of product that can flow between different regions. In most regions of the country, most petroleum products are primarily supplied by in-region refinery production.
Unplanned outages are, by definition, unexpected and vary widely. As a result, historical averages do not provide good estimates of future unplanned outages. This report does not attempt to estimate future unplanned outages.
1 See http://www.eia.gov/todayinenergy/detail.php?id=4890 for a comprehensive explanation of PADDs.

February 2018
U.S. Energy Information Administration | Refinery Outages: December 2017 to June 2018 2
2. Executive Summary The U.S. Energy Information Administration’s (EIA’s) latest analysis of planned refinery outages for the period from December 2017 through June 2018 finds that such outages are not expected to cause a shortfall in the supply of petroleum products—including gasoline, jet fuel, and distillate fuel—relative to expected demand, either nationally or within any U.S. region. EIA has reached this conclusion notwithstanding the current high level of U.S. gasoline demand, which in 2017 was close to the record high seen in 2016.
EIA’s national and regional conclusions are the result of simulating regional monthly supply based on a set of assumptions about refinery operations. The report considers planned shutdowns of refinery units as reported by Industrial Info Resources (IIR) and provides EIA's analysis of the implications of outages affecting atmospheric crude distillation units (ACDU), fluidized catalytic cracking units (FCCU), catalytic reforming units (CRU), hydrocracking units (HU), and coking units (CU).
Regional supply and demand balances are more valuable than national balances because pipeline infrastructure, geography, and marine shipping regulations constrain the amount of product that can flow between regions in the United States. Barring unusually high unplanned outages, planned outages that extend beyond schedule, or higher-than-expected demand, the supply of gasoline, jet fuel, and distillate fuel is expected to be adequate in all regions through June 2018.
Planned refinery maintenance in the East Coast is expected to be moderate from December 2017 through June 2018, except for outages due to maintenance on fluidized catalytic cracking capacity in February, which exceed the previous 10-year maximum. Planned maintenance for crude distillation capacity is expected to be moderate, reaching a peak average of 193,000 barrels per day (b/d) in April, or 14% of regional capacity. There are no announced plans for maintenance on hydrocracking and coking units, and reforming capacity maintenance is lower than the previous year and previous 10-year average. Production losses associated with planned maintenance could be offset by movements from other regions, imports, and by drawing down inventories.
Planned outages in the Midwest region for December 2017 through June 2018 are close to or higher than the previous 10-year average, and are concentrated in March and April. Nevertheless, EIA expects supply of petroleum products to be adequate to meet domestic demand in the Midwest during the first half of 2018. Production losses from planned outages in the Midwest in March and April are estimated to average 333,000 b/d and 216,000 b/d in gasoline, 77,000 b/d and 46,000 b/d in jet fuel, and 155,000 b/d and 110,000 b/d in distillate fuel, respectively.
Planned outages in the Gulf Coast region from December 2017 through June 2018 are moderate, and regional inventories appear to be sufficient to offset lost production from those planned outages. More than half of the refining capacity in the United States is located in the Gulf Coast region2, and, as a result, produces far more petroleum products than it consumes. The region’s surplus production supplies other U.S. regions, mainly the East Coast and the Midwest, as well as international markets.
2 The regions used in this report are the Petroleum Administration for Defense Districts (PADDs). See https://www.eia.gov/todayinenergy/detail.php?id=4890 for a comprehensive explanation of PADDs.

February 2018
U.S. Energy Information Administration | Refinery Outages: December 2017 to June 2018 3
EIA’s calculations indicate that planned refinery outages in the Gulf Coast are expected to result in light production losses in petroleum products. Planned outages are expected to peak in February, with expected average losses of 222,000 b/d in gasoline and 195,000 b/d in distillate fuel. From December 2017 through June 2018, total estimated production loss as a result of the planned outages accounts for 28.8% of existing gasoline inventory, 40.0% of jet fuel inventory, and 55.5% of existing distillate inventory. Regional inventories will likely be sufficient to make up for lost in-region production. Gulf Coast refinery operations were significantly disrupted in September 2017 following Hurricane Harvey and this led to some changes for planned maintenance.
Planned refinery maintenance for the Rocky Mountain region is expected to be moderate from December 2017 through June 2018. Because oil consumption in the Rocky Mountain region is low compared with other parts of the country and inventories of petroleum products are above or close to the 10-year average, the planned maintenance should not affect product availability.
Planned outages in the West Coast region from December 2017 through June 2018 of atmospheric crude distillation capacity and fluidized catalytic cracking capacity are close to the 10-year average. Planned maintenance on both types of units is concentrated in January and February. Planned maintenance on reforming and coking capacity is lower than the 10-year average, and there are no announced plans for maintenance on hydrocracking capacity. The production losses from planned maintenance are expected to peak in January and February, with expected average losses of 115,000 b/d and 122,000 b/d in gasoline, 24,000 b/d and 21,000 b/d in jet fuel, and 41,000 b/d and 39,000 b/d in distillate fuel, respectively.
Although unanticipated events could result in some issues, EIA’s review found no region in which planned refinery outages are likely to lead to inadequate gasoline, distillate, or jet fuel supplies from December 2017 through June 2018.
3. Methodology: Refinery Modeling and Base Cases This report uses the methodology adopted in EIA’s February 2017 report to examine potential production implications of refinery unit outages. EIA subscribes to PRISM software, developed by Baker & O’Brien Inc., and uses this tool to simulate the shutdown of various refinery units and the subsequent potential impact on regional petroleum supply.
PRISM includes detailed computer models of 118 of the 137 operating U.S. refineries reported on by EIA. Each refinery model contains individual refinery unit simulations that can be manipulated to change unit operations, including a complete shutdown of the unit. The remaining refinery units can be modeled through operational changes, by use of inventoried or purchased feedstocks, and by changes in refinery crude slates. EIA then simulates the resulting petroleum product output with units down for planned maintenance. To assess production losses resulting from planned maintenance, however, these results must be compared with a more normal mode of refinery operations, thereby requiring that EIA also simulate refinery base cases.
A base case for each refinery in the PRISM database was developed to represent high-utilization operations using nonconfidential data with the following assumptions:
February 2018
U.S. Energy Information Administration | Refinery Outages: December 2017 to June 2018 4
• Identify projected crude imports based on EIA’s historical Company Level Import data, which identifies source country, API gravity level, and sulfur level. Crudes from these projected sources are matched to crudes in the PRISM database.
• Buy intermediate feedstocks as necessary to fill conversion units • Assign 90% utilization to key units, including crude distillation units, fluidized catalytic crackers,
hydrocrackers, cokers, and reformers • Limit production of unfinished products
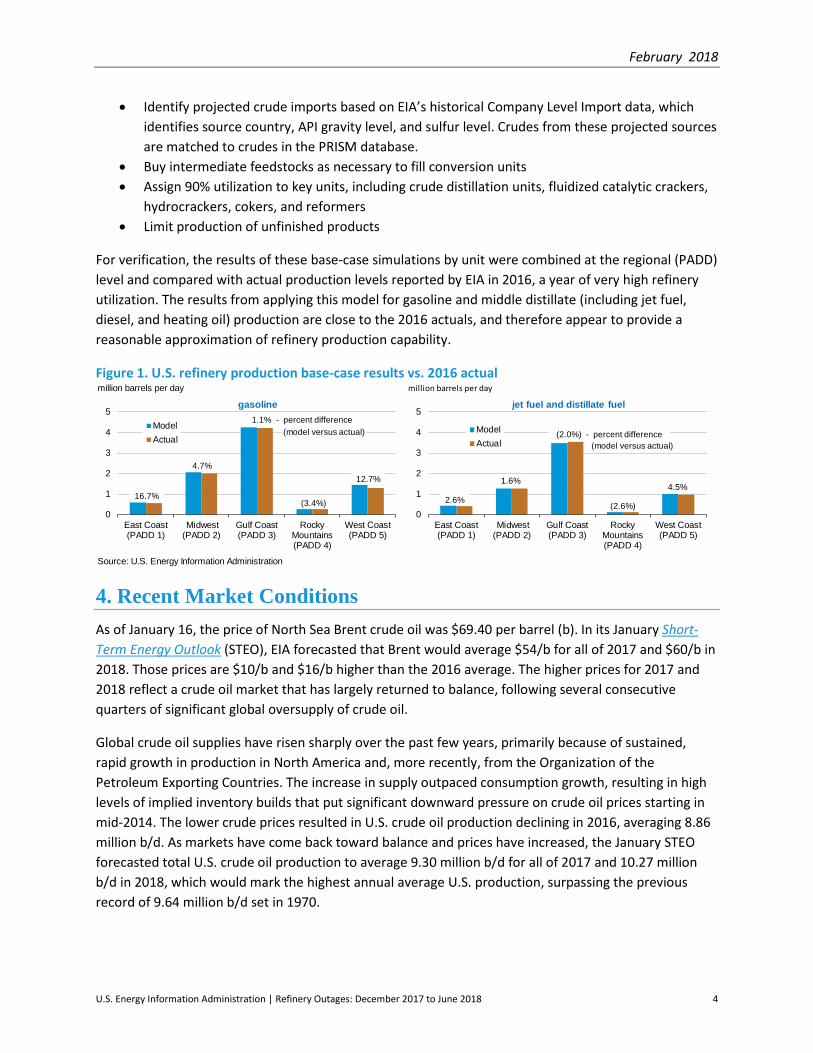
For verification, the results of these base-case simulations by unit were combined at the regional (PADD) level and compared with actual production levels reported by EIA in 2016, a year of very high refinery utilization. The results from applying this model for gasoline and middle distillate (including jet fuel, diesel, and heating oil) production are close to the 2016 actuals, and therefore appear to provide a reasonable approximation of refinery production capability.
Figure 1. U.S. refinery production base-case results vs. 2016 actual
4. Recent Market Conditions As of January 16, the price of North Sea Brent crude oil was $69.40 per barrel (b). In its January Short-Term Energy Outlook (STEO), EIA forecasted that Brent would average $54/b for all of 2017 and $60/b in 2018. Those prices are $10/b and $16/b higher than the 2016 average. The higher prices for 2017 and 2018 reflect a crude oil market that has largely returned to balance, following several consecutive quarters of significant global oversupply of crude oil.
Global crude oil supplies have risen sharply over the past few years, primarily because of sustained, rapid growth in production in North America and, more recently, from the Organization of the Petroleum Exporting Countries. The increase in supply outpaced consumption growth, resulting in high levels of implied inventory builds that put significant downward pressure on crude oil prices starting in mid-2014. The lower crude prices resulted in U.S. crude oil production declining in 2016, averaging 8.86 million b/d. As markets have come back toward balance and prices have increased, the January STEO forecasted total U.S. crude oil production to average 9.30 million b/d for all of 2017 and 10.27 million b/d in 2018, which would mark the highest annual average U.S. production, surpassing the previous record of 9.64 million b/d set in 1970.
million barrels per day million barrels per day
Source: U.S. Energy Information Administration
0
1
2
3
4
5
East Coast(PADD 1)
Midwest(PADD 2)
Gulf Coast(PADD 3)
RockyMountains(PADD 4)
West Coast(PADD 5)
ModelActual
gasoline
16.7%
12.7%
(3.4%)
1.1% - percent difference
4.7%
(model versus actual)
0
1
2
3
4
5
East Coast(PADD 1)
Midwest(PADD 2)
Gulf Coast(PADD 3)
RockyMountains(PADD 4)
West Coast(PADD 5)
ModelActual
jet fuel and distillate fuel
2.6%
1.6%
(2.0%) - percent difference(model versus actual)
(2.6%)
4.5%

February 2018
U.S. Energy Information Administration | Refinery Outages: December 2017 to June 2018 5
Global consumption of petroleum and other liquid fuels grew by 1.44 million b/d in 2017, reaching an average of 98.39 million b/d for the year. Although the rate of consumption growth slowed in 2017 compared with 2016, EIA’s January STEO forecasted that consumption growth will average 1.72 million b/d in 2018 and 1.65 million b/d in 2019, driven by the countries outside of the Organization for Economic Cooperation and Development (OECD). EIA expected non-OECD consumption growth to account for 1.22 million b/d and 1.31 million b/d of the global growth in 2018 and 2019, respectively. India and China were expected to be the largest contributors to non-OECD petroleum consumption growth in 2018 and 2019.
With continued access to price-advantaged crude oil and natural gas, sophisticated upgrading equipment, and a strategic location compared with demand centers in Latin America, U.S. refineries have been running at or near record-high levels. Through October 2017, gross refinery inputs averaged 16.8 million b/d, on pace to be the fourth consecutive year of record annual averages since EIA began collecting data in 1985. Refinery production of gasoline and distillate has increased to supply growing demand in global markets, contributing to a widening U.S. petroleum product trade surplus.
Refinery wholesale gasoline margins (the difference between the wholesale price of gasoline and the price of Brent crude oil) averaged 25 cents/gal in December. This level was lower than the 32 cents/gal average in December 2016, but it was 8 cents/gal higher than the five-year average for December. Refinery wholesale gasoline margins averaged 41 cents/gal in 2017, which was relatively unchanged from the 2016 level but 8 cents/gal higher than the previous five-year average. In the January STEO, EIA forecasted refinery wholesale gasoline margins to average 37 cents/gal in 2018 and 34 cents/gal in 2019.
Record-high U.S. refinery runs in 2016 contributed to high U.S. gasoline, distillate (diesel fuel and heating oil), and jet fuel inventories. Inventories for all three fuels remained elevated for much of 2017 until September. Starting in the fourth quarter of 2017, inventories drew and ended the year near the previous five-year average.
Rising crude oil prices have led to increases in gasoline and distillate prices in recent months. In the January STEO, EIA expected the retail price of regular gasoline to average $2.51 per gallon (gal) during the first quarter of 2018, 19 cents/gal higher than at the same time last year. The diesel fuel retail price was expected to average $2.65/gal in 2017, which was 34 cents/gal higher than the average in 2016. The diesel price was forecasted to average $2.95/gal in 2018 and $3.01/gal in 2019, driven higher primarily by higher crude oil prices and growing global diesel demand. EIA expects rising diesel consumption to contribute to gradually increasing diesel refinery margins.
U.S. motor gasoline consumption remained nearly flat from 2016 to 2017 at an average of slightly more than 9.3 million b/d in EIA’s January STEO. U.S. motor gasoline consumption was forecasted to increase by 30,000 b/d (0.3%) in 2018. If EIA’s January STEO projected growth is realized, 2018 would be the highest level of annual average U.S. gasoline consumption on record, slightly surpassing the previous record set in 2016.
According to the January STEO, U.S. distillate consumption averaged more than 3.9 million b/d during 2017, an increase of 50,000 b/d from 2016 levels. U.S. distillate fuel consumption growth was forecasted

February 2018
U.S. Energy Information Administration | Refinery Outages: December 2017 to June 2018 6
to accelerate in 2018, with expected annual average growth of 100,000 b/d (2.5%), resulting in average consumption of more than 4.0 million b/d, followed by growth of 10,000 b/d (0.4%) in 2019. U.S. economic activity and industrial output are projected to grow strongly in both 2018 and 2019, contributing to higher distillate use.
U.S. participation in the global petroleum products markets has increased steadily in the past several years. Total U.S. product exports averaged 5.1 million b/d through the first 10 months of 2017, 520,000 b/d higher than during the same period in 2016. Exports generally act as a stabilizer in U.S. product markets, similar to inventories, as this supply can be diverted to domestic markets if product balances tighten, depending on the structure of sales contracts. Supplying overseas markets with product from economically-efficient U.S. refineries also helps balance global product supply and demand, which in turn helps U.S. regions that rely on imports. Through the first 10 months of 2017, the U.S. East Coast imported an average of 0.7 million b/d of total gasoline and distillate.

February 2018
U.S. Energy Information Administration | Refinery Outages: December 2017 to June 2018 7
5. East Coast Regional Outage Review Planned refinery maintenance in the East Coast (PADD 1) is expected to be moderate from December 2017 through June 2018, except for outages due to maintenance on fluidized catalytic cracking capacity in February. The East Coast region includes all states in New England, the Central Atlantic, and the Lower Atlantic.
The East Coast is structurally short of refinery capacity—regional consumption is higher than regional production—so the region relies on transfers of petroleum products from other regions, primarily from the Gulf Coast, and on imports from the actively traded Atlantic Basin market. As a result, refinery outages in other parts of the country, and in the countries from which gasoline and distillate are imported, can affect East Coast supply. Planned maintenance at refineries on the Gulf Coast should not adversely affect supply of gasoline and distillate to the East Coast, because some of the substantial volumes of gasoline and distillate typically exported from the Gulf Coast can be diverted to domestic markets if product balances tighten.
The East Coast has nine operable refineries with 1.4 million barrels per stream day3 (b/sd) of atmospheric crude distillation capacity, 0.5 million b/sd of fluidized catalytic cracking capacity, 0.2 million b/sd of catalytic reforming capacity, 45,000 b/sd of hydrocracking capacity, and 82,000 b/sd of coking capacity.
Refinery maintenance planned by refiners in the East Coast from December 2017 through June 2018 is moderate, except for fluidized catalytic cracking capacity in February, which exceeds the previous 10-year maximum. Maintenance for crude distillation capacity is planned to average 193,000 b/d, or 14% of regional capacity, in April. Maintenance for fluidized catalytic cracking capacity is planned to average 145,000 b/d, or 29% of regional capacity, in February and 170,000 b/d, or 34% of regional capacity, in March. Maintenance for reforming capacity is planned to average 28,000 b/d, or 11% of regional capacity, in January and 41,000 b/d, or 16% of regional capacity, in April (Table 1 and Figure 2).
Table 1. East Coast (PADD 1) planned refinery capacity outages
Atmospheric crude oil distillation
Month
thousand barrels per day as percentage of
capacity
Dec-17 to Jun-18
planned outages
Dec-16 to Jun-17
planned outages
2008-17 average planned outages
Dec-17 to Jun-18
planned outages
Dec-16 to Jun-17
planned outages
December 0 41 73 0% 3% January 0 41 80 0% 3%
3 Stream day capacity is the maximum number of barrels of input that a distillation facility can process within a 24-hour period when running at full capacity under optimal crude and product slate conditions with no allowance for downtime. Barrels per calendar day is a measure of the amount of input that a distillation unit can process in a 24-hour period under usual operating conditions. It takes into account both planned and unplanned maintenance. Stream day capacity is typically about 6% higher than calendar day capacity.

February 2018
U.S. Energy Information Administration | Refinery Outages: December 2017 to June 2018 8
February 0 218 119 0% 16% March 68 311 186 5% 23% April 193 95 90 14% 7% May 90 4 46 7% 0% June 0 0 38 0% 0%
Fluidized catalytic cracking
Month
thousand barrels per day as percentage of
capacity
Dec-17 to Jun-18
planned outages
Dec-16 to Jun-17
planned outages
2008-17 average planned outages
Dec-17 to Jun-18
planned outages
Dec-16 to Jun-17
planned outages
December 0 0 16 0% 0% January 0 0 30 0% 0% February 145 0 40 29% 0% March 170 57 89 34% 11% April 17 72 42 3% 14% May 0 0 18 0% 0% June 0 0 8 0% 0%
Reforming
Month
thousand barrels per day as percentage of
capacity
Dec-17 to Jun-18
planned outages
Dec-16 to Jun-17
planned outages
2008-17 average planned outages
Dec-17 to Jun-18
planned outages
Dec-16 to Jun-17
planned outages
December 0 28 22 0% 11% January 28 43 22 11% 17% February 0 27 23 0% 11% March 15 41 37 6% 17% April 41 14 26 16% 6% May 19 1 14 8% 0% June 0 0 14 0% 0%
Hydrocracking
Month
thousand barrels per day as percentage of
capacity
Dec-17 to Jun-18
planned outages
Dec-16 to Jun-17
planned outages
2008-17 average planned outages
Dec-17 to Jun-18
planned outages
Dec-16 to Jun-17
planned outages
December 0 0 4 0% 0% January 0 0 6 0% 0% February 0 0 6 0% 0% March 0 1 7 0% 2% April 0 4 6 0% 9% May 0 1 4 0% 2% June 0 0 4 0% 0%
Coking

February 2018
U.S. Energy Information Administration | Refinery Outages: December 2017 to June 2018 9
Month
thousand barrels per day as percentage of
capacity
Dec-17 to Jun-18
planned outages
Dec-16 to Jun-17
planned outages
2008-17 average planned outages
Dec-17 to Jun-18
planned outages
Dec-16 to Jun-17
planned outages
December 0 0 11 0% 0% January 0 0 10 0% 0% February 0 0 13 0% 0% March 0 0 18 0% 0% April 0 0 18 0% 0% May 0 0 16 0% 0% June 0 0 10 0% 0%
Source: U.S. Energy Information Administration, using IIR data as of October 17, 2017
Figure 2. East Coast (PADD 1) planned refinery capacity outages thousand barrels per day
Source: U.S. Energy Information Administration, using IIR data as of October 17, 2017
Crude distillation
0
100
200
300
400
500
Jan Mar May Jul Sep Nov
2008-17 range 2008-17 avg2016 20172018 first half
Fluidized catalytic cracking
050
100150200250300
Jan Mar May Jul Sep Nov
2008-17 range 2008-17 avg2016 20172018 first half
Reforming
0
50
100
150
Jan Mar May Jul Sep Nov
2008-17 range 2008-17 avg2016 20172018 first half
Hydrocracking
0
10
20
30
40
50
Jan Mar May Jul Sep Nov
2008-17 range 2008-17 avg2016 20172018 first half
Coking
0
20
40
60
80
100
Jan Mar May Jul Sep Nov
2008-17 range 2008-17 avg2016 20172018 first half

February 2018
U.S. Energy Information Administration | Refinery Outages: December 2017 to June 2018 10
In February and March, EIA projects average losses due to planned outages to be 96,000 b/d and 119,000 b/d in gasoline, 0 b/d and 10,000 b/d in jet fuel, and 27,000 b/d and 38,000 b/d in distillate fuel (Figure 3).
Figure 3. East Coast (PADD 1) production losses as a result of planned outages thousand barrels per day
Source: U.S. Energy Information Administration
EIA’s total estimated production losses in gasoline, jet fuel, and distillate fuel due to planned outages account for 15.3%, 4.1%, and 4.6%, respectively, of existing regional inventories as of October 20 (Figure 4). These levels suggest that production losses in the East Coast could be covered by existing product inventory.
Figure 4. East Coast (PADD 1) petroleum product inventories, 2016–present
0
20
40
60
80
100
120
140
160
180
Dec-17 Jan-18 Feb-18 Mar-18 Apr-18 May-18 Jun-18
distillate
jet fuel
gasoline
Source: U.S. Energy Information Administration, Weekly Petroleum Status Report
404856647280
Jan Mar May Jul Sep Nov
10-yr range 10-yr avg 2016 2017
gasolinemillion barrels
579
111315
Jan Mar May Jul Sep Nov
jet fuelmillion barrels
20304050607080
Jan Mar May Jul Sep Nov
distillate fuelmillion barrels

February 2018
U.S. Energy Information Administration | Refinery Outages: December 2017 to June 2018 11
6. Midwest (PADD 2) Regional Outage Review Planned outages in the Midwest region (PADD 2) for December 2017 through June 2018 are close to or higher than the previous 10-year average, and are concentrated in March and April. Nevertheless, supply of petroleum products is likely to be adequate to meet domestic demand in the Midwest during the first half of 2018. The Midwest region includes North Dakota, South Dakota, Nebraska, Kansas, Oklahoma, Missouri, Iowa, Minnesota, Wisconsin, Illinois, Indiana, Michigan, Ohio, Kentucky, and Tennessee.
Midwest refineries produce most of the gasoline and distillate fuel consumed in the region, particularly during the winter months when gasoline demand is seasonally lower. The Midwest also receives supplies from other regions, primarily from the Gulf Coast. Planned Gulf Coast refinery maintenance is not expected to affect the supply of gasoline and distillate available to the Midwest.
The Midwest has 27 operable refineries with combined atmospheric crude distillation capacity of 4.3 million barrels per stream day4 (b/sd), fluidized catalytic cracking capacity of 1.3 million b/sd, catalytic reforming capacity of 0.9 million b/sd, hydrocracking capacity of 0.4 million b/sd, and coking capacity of 0.6 million b/sd.
Inventories can act as a source of supplemental supply during outages. Supplemental supply into the Midwest from the Gulf Coast should also be available if needed. However, the time required for resupply to reach the Midwest from the Gulf Coast varies considerably across the region because of its size. Resupply can reach Oklahoma, Kansas, and Missouri from the Gulf Coast within 7–10 days, but it may take close to 30 days to reach the northernmost states at the end of the supply line. As a result, significant unplanned outages in the northernmost states are more likely to lead to supply disruptions.
Refinery maintenance in the Midwest is planned by refiners to be close to or higher than the 10-year maximum levels in March and April, but lower in other months. Maintenance for crude distillation capacity is planned to average 500,000 b/d, or 12% of regional capacity, in March. Maintenance for reforming capacity is planned to average 96,000 b/d, or 11% of regional capacity, in March and 117,000 b/d, or 13% of regional capacity in April. Maintenance for hydrocracking capacity is planned to average 59,000 b/d, or 17% of regional capacity, in March and 63,000 b/d, or 18% of regional capacity, in April. Maintenance for coking capacity is planned to average 166,000 b/d, or 29% of regional capacity, in March and 74,000 b/d, or 13% of regional capacity, in April (Table 2 and Figure 5).
Table 2. Midwest (PADD 2) planned refinery capacity outages
Atmospheric crude oil distillation Month thousand barrels per day
as percentage of capacity
4 Stream day capacity is the maximum number of barrels of input that a distillation facility can process within a 24-hour period when running at full capacity under optimal crude and product slate conditions with no allowance for downtime.

February 2018
U.S. Energy Information Administration | Refinery Outages: December 2017 to June 2018 12
Dec-17 to Jun-18
planned outages
Dec-16 to Jun-17
planned outages
2008-17 average planned outages
Dec-17 to Jun-18
planned outages
Dec-16 to Jun-17
planned outages
December 0 0 60 0% 0% January 0 0 54 0% 0% February 82 0 100 2% 0% March 500 187 315 12% 4% April 294 141 306 7% 3%
May 61 116 173 1% 3%
June 8 26 91 0% 1%
Fluidized catalytic cracking
Month
thousand barrels per day as percentage of
capacity
Dec-17 to Jun-18
planned outages
Dec-16 to Jun-17
planned outages
2008-17 average planned outages
Dec-17 to Jun-18
planned outages
Dec-16 to Jun-17
planned outages
December 0 0 4 0% 0% January 0 0 4 0% 0% February 0 0 17 0% 0% March 107 10 52 8% 1% April 114 50 78 8% 4%
May 13 47 62 1% 3%
June 2 10 26 0% 1%
Reforming
Month
thousand barrels per day as percentage of
capacity
Dec-17 to Jun-18
planned outages
Dec-16 to Jun-17
planned outages
2008-17 average planned outages
Dec-17 to Jun-18
planned outages
Dec-16 to Jun-17
planned outages
December 0 0 1 0% 0% January 0 7 4 0% 1% February 10 15 14 1% 2% March 96 22 54 11% 2% April 117 19 68 13% 2%
May 12 21 44 1% 2%
June 1 4 18 0% 0%
Hydrocracking
Month
thousand barrels per day as percentage of
capacity
Dec-17 to Jun-18
planned outages
Dec-16 to Jun-17
planned outages
2008-17 average planned outages
Dec-17 to Jun-18
planned outages
Dec-16 to Jun-17
planned outages

February 2018
U.S. Energy Information Administration | Refinery Outages: December 2017 to June 2018 13
December 0 0 0 0% 0% January 0 0 1 0% 0% February 0 17 4 0% 5% March 59 9 23 17% 3% April 63 0 18 18% 0%
May 0 0 6 0% 0%
June 0 0 2 0% 0%
Coking
Month
thousand barrels per day as percentage of
capacity
Dec-17 to Jun-18
planned outages
Dec-16 to Jun-17
planned outages
2008-17 average planned outages
Dec-17 to Jun-18
planned outages
Dec-16 to Jun-17
planned outages
December 0 20 7 0% 4% January 0 0 2 0% 0% February 9 0 4 1% 0% March 166 57 33 29% 10% April 74 21 36 13% 4%
May 0 5 27 0% 1%
June 0 8 19 0% 1%
Source: U.S. Energy Information Administration, using IIR data as of October 17, 2017
Figure 5. Midwest (PADD 2) planned refinery capacity outages thousand barrels per day
Crude distillation
0
200
400
600
800
1,000
Jan Mar May Jul Sep Nov
2008-17 range 2008-17 avg2016 20172018 first half
Fluidized catalytic cracking
0
50
100
150
200
250
300
Jan Mar May Jul Sep Nov
2008-17 range 2008-17 avg2016 20172018 first half
Reforming
0
30
60
90
120
150
180
Jan Mar May Jul Sep Nov
2008-17 range2008-17 avg201620172018 first half
Hydrocracking
020406080
100120140
Jan Mar May Jul Sep Nov
2008-17 range 2008-17 avg2016 20172018 first half

February 2018
U.S. Energy Information Administration | Refinery Outages: December 2017 to June 2018 14
Source: U.S. Energy Information Administration, using IIR data as of October 17, 2017
In March and April, EIA projects average losses due to planned outages to total 333,000 b/d and 216,000 b/d in gasoline, 77,000 b/d and 46,000 b/d in jet fuel, and 155,000 b/d and 110,000 b/d in distillate fuel (Figure 6).
Figure 6. Midwest (PADD 2) production losses as a result of planned outages thousand barrels per day
Source: U.S. Energy Information Administration
EIA’s total estimated production losses in gasoline, jet fuel, and distillate fuel due to planned outages account for 41.1%, 55.2%, and 33.8%, respectively, of existing regional inventories as of October 20 (Figure 7). The regional inventories will likely be sufficient to make up for lost in-region production.
Figure 7. Midwest (PADD 2) petroleum product inventories, 2016–present
Coking
0
50
100
150
200
Jan Mar May Jul Sep Nov
2008-17 range 2008-17 avg2016 20172018 first half
0
100
200
300
400
500
600
Dec-17 Jan-18 Feb-18 Mar-18 Apr-18 May-18 Jun-18
distillate
jet fuel
gasoline

February 2018
U.S. Energy Information Administration | Refinery Outages: December 2017 to June 2018 15
Source: U.S. Energy Information Administration, Weekly Petroleum Status Report
404550556065
Jan Mar May Jul Sep Nov
10-yr range 10-yr avg 2016 2017
gasolinemillion barrels
56789
10
Jan Mar May Jul Sep Nov
jet fuelmillion barrels
202428323640
Jan Mar May Jul Sep Nov
distillate fuelmillion barrels
February 2018
U.S. Energy Information Administration | Refinery Outages: December 2017 to June 2018 16
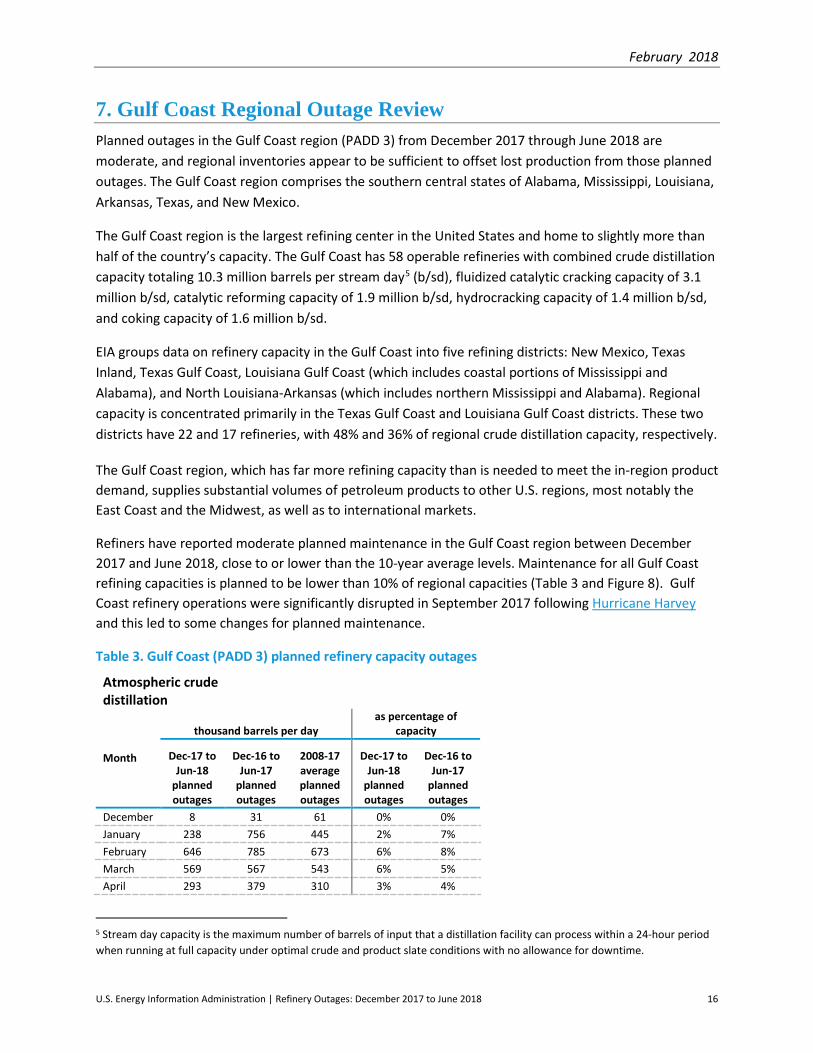
7. Gulf Coast Regional Outage Review Planned outages in the Gulf Coast region (PADD 3) from December 2017 through June 2018 are moderate, and regional inventories appear to be sufficient to offset lost production from those planned outages. The Gulf Coast region comprises the southern central states of Alabama, Mississippi, Louisiana, Arkansas, Texas, and New Mexico.
The Gulf Coast region is the largest refining center in the United States and home to slightly more than half of the country’s capacity. The Gulf Coast has 58 operable refineries with combined crude distillation capacity totaling 10.3 million barrels per stream day5 (b/sd), fluidized catalytic cracking capacity of 3.1 million b/sd, catalytic reforming capacity of 1.9 million b/sd, hydrocracking capacity of 1.4 million b/sd, and coking capacity of 1.6 million b/sd.
EIA groups data on refinery capacity in the Gulf Coast into five refining districts: New Mexico, Texas Inland, Texas Gulf Coast, Louisiana Gulf Coast (which includes coastal portions of Mississippi and Alabama), and North Louisiana-Arkansas (which includes northern Mississippi and Alabama). Regional capacity is concentrated primarily in the Texas Gulf Coast and Louisiana Gulf Coast districts. These two districts have 22 and 17 refineries, with 48% and 36% of regional crude distillation capacity, respectively.
The Gulf Coast region, which has far more refining capacity than is needed to meet the in-region product demand, supplies substantial volumes of petroleum products to other U.S. regions, most notably the East Coast and the Midwest, as well as to international markets.
Refiners have reported moderate planned maintenance in the Gulf Coast region between December 2017 and June 2018, close to or lower than the 10-year average levels. Maintenance for all Gulf Coast refining capacities is planned to be lower than 10% of regional capacities (Table 3 and Figure 8). Gulf Coast refinery operations were significantly disrupted in September 2017 following Hurricane Harvey and this led to some changes for planned maintenance.
Table 3. Gulf Coast (PADD 3) planned refinery capacity outages
Atmospheric crude distillation
Month
thousand barrels per day as percentage of
capacity
Dec-17 to Jun-18
planned outages
Dec-16 to Jun-17
planned outages
2008-17 average planned outages
Dec-17 to Jun-18
planned outages
Dec-16 to Jun-17
planned outages
December 8 31 61 0% 0% January 238 756 445 2% 7% February 646 785 673 6% 8% March 569 567 543 6% 5% April 293 379 310 3% 4%
5 Stream day capacity is the maximum number of barrels of input that a distillation facility can process within a 24-hour period when running at full capacity under optimal crude and product slate conditions with no allowance for downtime.

February 2018
U.S. Energy Information Administration | Refinery Outages: December 2017 to June 2018 17
May 97 146 189 1% 1% June 0 42 123 0% 0%
Fluidized catalytic cracking
Month
thousand barrels per day as percentage of
capacity
Dec-17 to Jun-18
planned outages
Dec-16 to Jun-17
planned outages
2008-17 average planned outages
Dec-17 to Jun-18
planned outages
Dec-16 to Jun-17
planned outages
December 0 30 41 0% 1% January 139 256 168 5% 8% February 111 571 330 4% 19% March 86 552 237 3% 18% April 18 209 105 1% 7% May 0 90 63 0% 3% June 0 27 26 0% 1%
Reforming
Month
thousand barrels per day as percentage of
capacity
Dec-17 to Jun-18
planned outages
Dec-16 to Jun-17
planned outages
2008-17 average planned outages
Dec-17 to Jun-18
planned outages
Dec-16 to Jun-17
planned outages
December 1 32 20 0% 2% January 24 162 110 1% 9% February 64 205 132 3% 11% March 80 145 95 4% 8% April 88 155 69 5% 8% May 14 41 57 1% 2% June 0 48 43 0% 3%
Hydrocracking
Month
thousand barrels per day as percentage of
capacity
Dec-17 to Jun-18
planned outages
Dec-16 to Jun-17
planned outages
2008-17 average planned outages
Dec-17 to Jun-18
planned outages
Dec-16 to Jun-17
planned outages
December 0 35 7 0% 3% January 68 160 69 5% 12% February 119 163 97 9% 12% March 76 127 64 6% 9% April 84 155 72 6% 11% May 10 39 34 1% 3% June 17 44 28 1% 3%
Coking Month thousand barrels per day
as percentage of capacity

February 2018
U.S. Energy Information Administration | Refinery Outages: December 2017 to June 2018 18
Dec-17 to Jun-18
planned outages
Dec-16 to Jun-17
planned outages
2008-17 average planned outages
Dec-17 to Jun-18
planned outages
Dec-16 to Jun-17
planned outages
December 0 0 5 0% 0% January 54 50 54 3% 3% February 139 85 138 9% 5% March 150 143 115 9% 9% April 151 92 69 9% 6% May 101 30 61 6% 2% June 0 13 34 0% 1%
Source: U.S. Energy Information Administration, using IIR data as of October 17, 2017
Figure 8. Gulf Coast (PADD 3) planned refinery capacity outages thousand barrels per day
Source: U.S. Energy Information Administration, using IIR data as of October 17, 2017
Crude distillation
0200400600800
1,0001,200
Jan Mar May Jul Sep Nov
2008-17 range 2008-17 avg2016 20172018 first half
Fluidized catalytic cracking
0100200300400500600
Jan Mar May Jul Sep Nov
2008-17 range 2008-17 avg2016 20172018 first half
Reforming
050
100150200250300
Jan Mar May Jul Sep Nov
2008-17 range 2008-17 avg2016 20172018 first half
Hydrocracking
050
100150200250300
Jan Mar May Jul Sep Nov
2008-17 range 2008-17 avg2016 20172018 first half
Coking
0
70
140
210
280
350
Jan Mar May Jul Sep Nov
2008-17 range 2008-17 avg2016 20172018 first half
February 2018
U.S. Energy Information Administration | Refinery Outages: December 2017 to June 2018 19
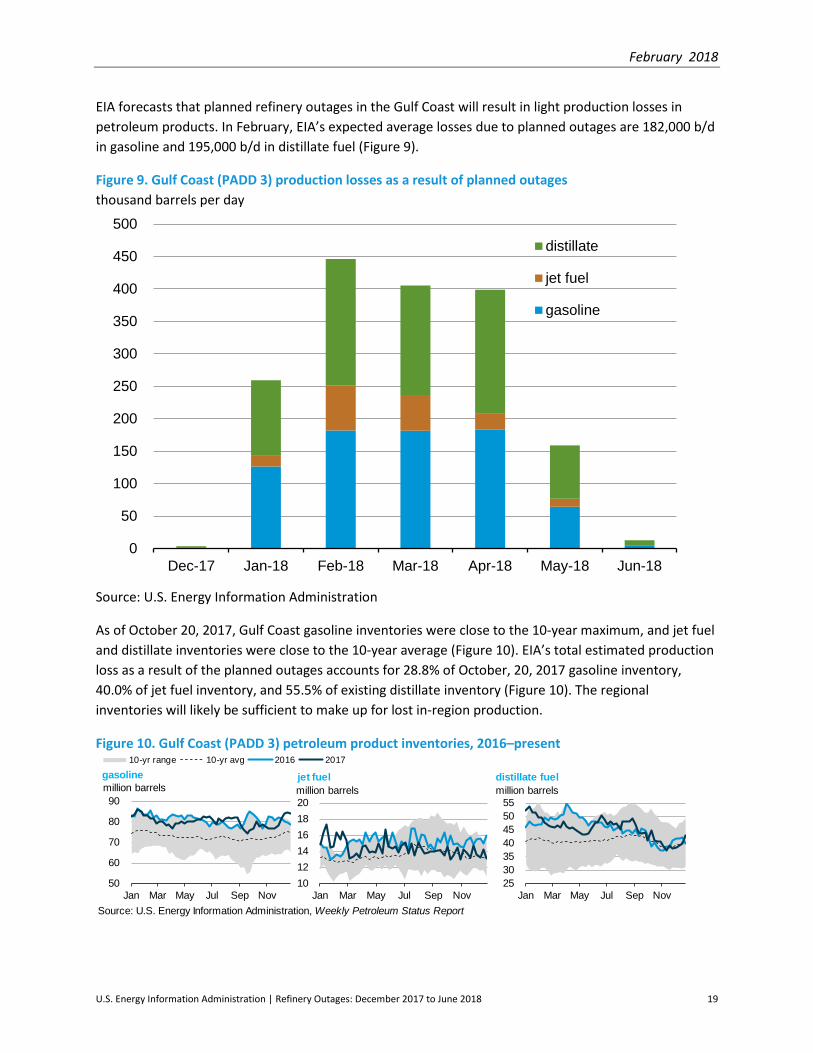
EIA forecasts that planned refinery outages in the Gulf Coast will result in light production losses in petroleum products. In February, EIA’s expected average losses due to planned outages are 182,000 b/d in gasoline and 195,000 b/d in distillate fuel (Figure 9).
Figure 9. Gulf Coast (PADD 3) production losses as a result of planned outages thousand barrels per day
Source: U.S. Energy Information Administration
As of October 20, 2017, Gulf Coast gasoline inventories were close to the 10-year maximum, and jet fuel and distillate inventories were close to the 10-year average (Figure 10). EIA’s total estimated production loss as a result of the planned outages accounts for 28.8% of October, 20, 2017 gasoline inventory, 40.0% of jet fuel inventory, and 55.5% of existing distillate inventory (Figure 10). The regional inventories will likely be sufficient to make up for lost in-region production.
Figure 10. Gulf Coast (PADD 3) petroleum product inventories, 2016–present
0
50
100
150
200
250
300
350
400
450
500
Dec-17 Jan-18 Feb-18 Mar-18 Apr-18 May-18 Jun-18
distillate
jet fuel
gasoline
Source: U.S. Energy Information Administration, Weekly Petroleum Status Report
50
60
70
80
90
Jan Mar May Jul Sep Nov
10-yr range 10-yr avg 2016 2017
gasolinemillion barrels
101214161820
Jan Mar May Jul Sep Nov
jet fuelmillion barrels
25303540455055
Jan Mar May Jul Sep Nov
distillate fuelmillion barrels
February 2018
U.S. Energy Information Administration | Refinery Outages: December 2017 to June 2018 20
8. Rocky Mountain Regional Outage Review Planned refinery maintenance for the Rocky Mountain region (PADD 4) are moderate from December 2017 through June 2018. The Rocky Mountain region includes Idaho, Montana, Wyoming, Utah, and Colorado.
Although refineries in the Rocky Mountain region supply most of the in-region gasoline and distillate demand, the region does receive small volumes of products from refineries in the Midwest and the Gulf Coast, which are possible sources of supplemental supply during a shortage. The Rocky Mountain region has 16 operating refineries and the smallest refining capacity of any PADD region in the United States, with combined atmospheric crude distillation capacity of 0.7 million barrels per stream day6 (b/sd), fluidized catalytic cracking capacity of 0.2 million b/sd, catalytic reforming capacity of 0.1 million b/sd, hydrocracking capacity of 61,000 b/sd, and total coking capacity of 91,000 b/sd.
Refinery maintenance for the Rocky Mountain region is planned by refiners to be moderate in December 2017 through June 2018. Because consumption in the Rocky Mountain region is low and inventories of petroleum products are above or close to the 10-year average, the planned maintenance should not affect product availability.
Table 4. Rocky Mountain (PADD 4) planned refinery capacity outages
Atmospheric crude distillation
Month
thousand barrels per day as percentage of
capacity
Dec-17 to Jun-18
planned outages
Dec-16 to Jun-17
planned outages
2008-17 average planned outages
Dec-17 to Jun-18
planned outages
Dec-16 to Jun-17
planned outages
December 0 0 3 0% 0% January 0 0 3 0% 0% February 0 0 8 0% 0% March 74 0 42 10% 0% April 118 18 58 16% 2% May 47 55 25 6% 8% June 48 20 21 6% 3%
Fluidized catalytic cracking
Month
thousand barrels per day as percentage of
capacity
Dec-17 to Jun-18
planned outages
Dec-16 to Jun-17
planned outages
2008-17 average planned outages
Dec-17 to Jun-18
planned outages
Dec-16 to Jun-17
planned outages
December 0 0 0 0% 0%
6 Stream day capacity is the maximum number of barrels of input that a distillation facility can process within a 24-hour period when running at full capacity under optimal crude and product slate conditions with no allowance for downtime.
February 2018
U.S. Energy Information Administration | Refinery Outages: December 2017 to June 2018 21
January 0 0 0 0% 0% February 0 0 2 0% 0% March 8 0 10 4% 0% April 35 9 20 16% 4% May 14 20 11 7% 9% June 17 7 1 8% 3%
Reforming
Month
thousand barrels per day as percentage of
capacity
Dec-17 to Jun-18
planned outages
Dec-16 to Jun-17
planned outages
2008-17 average planned outages
Dec-17 to Jun-18
planned outages
Dec-16 to Jun-17
planned outages
December 0 0 0 0% 0% January 0 5 1 0% 4% February 0 0 1 0% 0% March 10 4 11 7% 3% April 4 9 14 3% 7% May 1 12 4 0% 9% June 10 4 1 7% 3%
Hydrocracking
Month
thousand barrels per day as percentage of
capacity
Dec-17 to Jun-18
planned outages
Dec-16 to Jun-17
planned outages
2008-17 average planned outages
Dec-17 to Jun-18
planned outages
Dec-16 to Jun-17
planned outages
December 0 0 0 0% 0% January 0 0 0 0% 0% February 0 0 0 0% 0% March 0 0 1 0% 0% April 0 0 3 0% 0% May 0 0 0 0% 0% June 12 0 4 20% 0%
Coking
Month
thousand barrels per day as percentage of
capacity
Dec-17 to Jun-18
planned outages
Dec-16 to Jun-17
planned outages
2008-17 average planned outages
Dec-17 to Jun-18
planned outages
Dec-16 to Jun-17
planned outages
December 0 0 0 0% 0% January 0 0 1 0% 0% February 0 0 1 0% 0% March 0 0 1 0% 0% April 8 2 4 9% 2% May 5 16 2 5% 18%

February 2018
U.S. Energy Information Administration | Refinery Outages: December 2017 to June 2018 22
June 12 6 2 14% 6%
Source: U.S. Energy Information Administration, using IIR data as of October 17, 2017 Figure 11. Rocky Mountain (PADD 4) planned refinery capacity outages thousand barrels per day
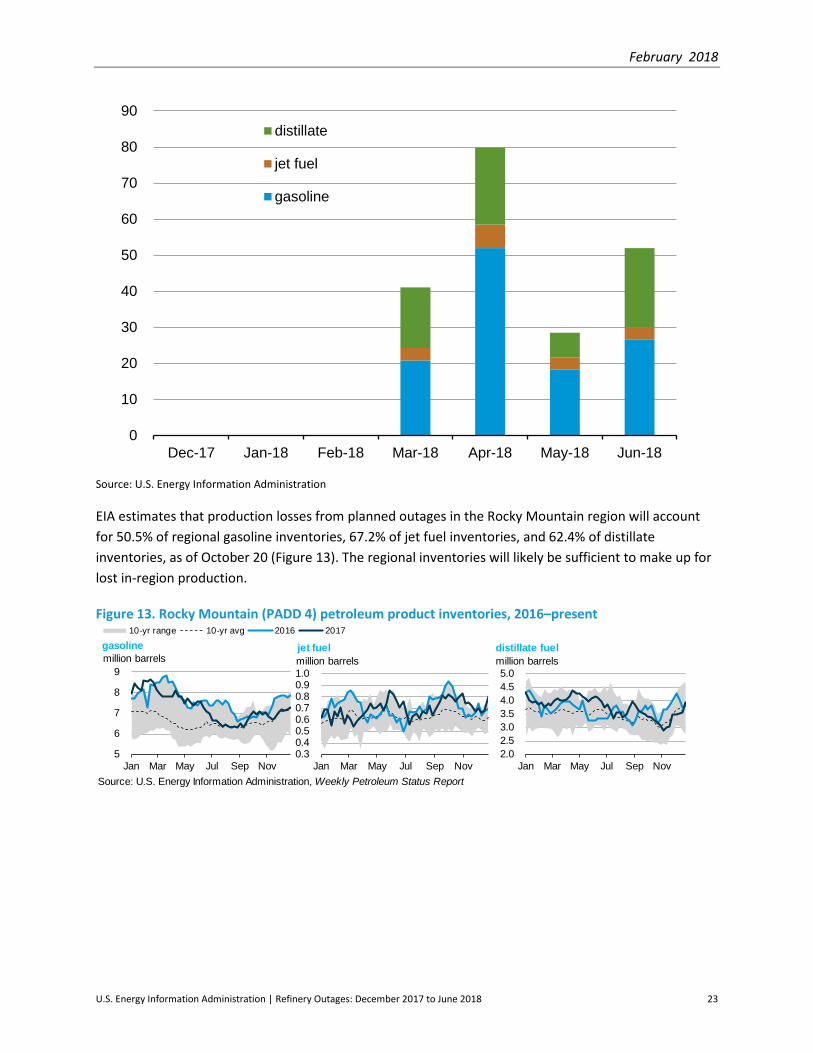
Source: U.S. Energy Information Administration, using IIR data as of October 17, 2017 EIA projects that refinery outages in the Rocky Mountain region due to planned outages will result in light production losses in petroleum products. In April, EIA expects average losses to total 52,000 b/d in gasoline and 21,000 b/d in distillate fuel (Figure 12). Figure 12. Rocky Mountain (PADD 4) production losses as a result of planned outages thousand barrels per day
Crude distillation
0
50
100
150
Jan Mar May Jul Sep Nov
2008-17 range 2008-17 avg2016 20172018 first half
Fluidized catalytic cracking
0102030405060
Jan Mar May Jul Sep Nov
2008-17 range 2008-17 avg2016 20172018 first half
Reforming
0
10
20
30
40
Jan Mar May Jul Sep Nov
2008-17 range 2008-17 avg2016 20172018 first half
Hydrocracking
0
5
10
15
20
25
Jan Mar May Jul Sep Nov
2008-17 range 2008-17 avg2016 20172018 first half
Coking
0
5
10
15
20
25
Jan Mar May Jul Sep Nov
2008-17 range 2008-17 avg2016 20172018 first half
February 2018
U.S. Energy Information Administration | Refinery Outages: December 2017 to June 2018 23
Source: U.S. Energy Information Administration EIA estimates that production losses from planned outages in the Rocky Mountain region will account for 50.5% of regional gasoline inventories, 67.2% of jet fuel inventories, and 62.4% of distillate inventories, as of October 20 (Figure 13). The regional inventories will likely be sufficient to make up for lost in-region production.
Figure 13. Rocky Mountain (PADD 4) petroleum product inventories, 2016–present
0
10
20
30
40
50
60
70
80
90
Dec-17 Jan-18 Feb-18 Mar-18 Apr-18 May-18 Jun-18
distillate
jet fuel
gasoline
Source: U.S. Energy Information Administration, Weekly Petroleum Status Report
5
6
7
8
9
Jan Mar May Jul Sep Nov
10-yr range 10-yr avg 2016 2017
gasolinemillion barrels
0.30.40.50.60.70.80.91.0
Jan Mar May Jul Sep Nov
jet fuelmillion barrels
2.02.53.03.54.04.55.0
Jan Mar May Jul Sep Nov
distillate fuelmillion barrels
February 2018
U.S. Energy Information Administration | Refinery Outages: December 2017 to June 2018 24
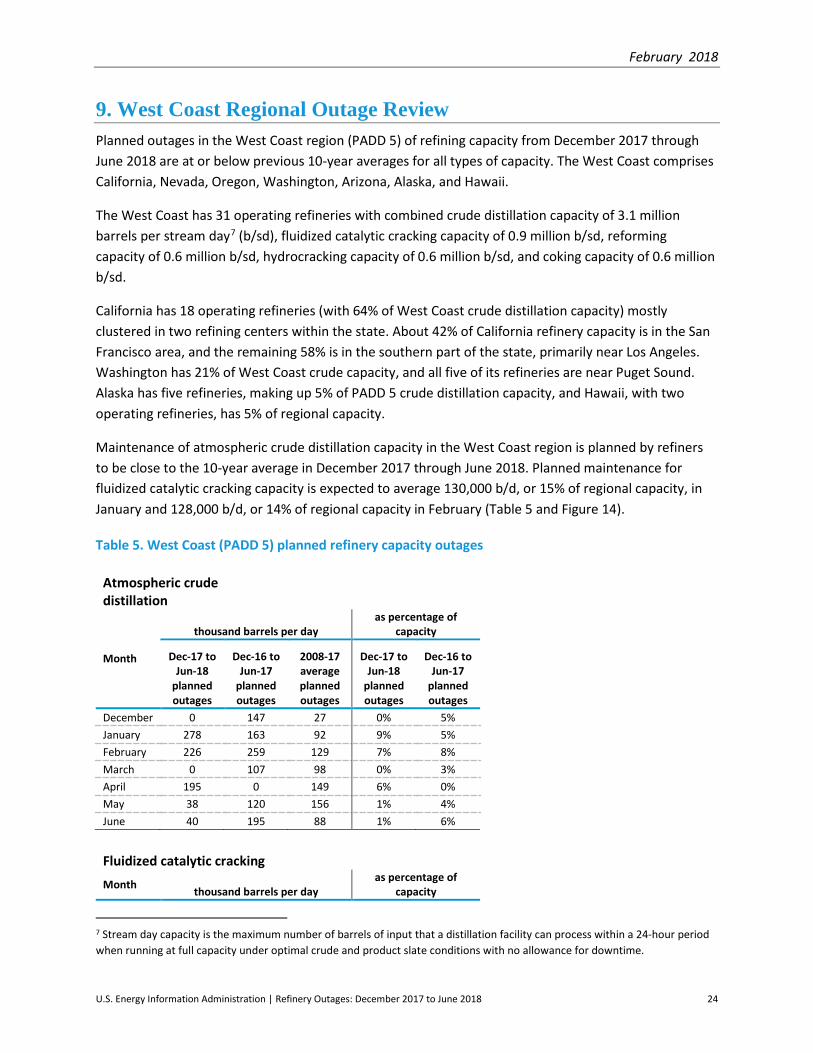
9. West Coast Regional Outage Review Planned outages in the West Coast region (PADD 5) of refining capacity from December 2017 through June 2018 are at or below previous 10-year averages for all types of capacity. The West Coast comprises California, Nevada, Oregon, Washington, Arizona, Alaska, and Hawaii.
The West Coast has 31 operating refineries with combined crude distillation capacity of 3.1 million barrels per stream day7 (b/sd), fluidized catalytic cracking capacity of 0.9 million b/sd, reforming capacity of 0.6 million b/sd, hydrocracking capacity of 0.6 million b/sd, and coking capacity of 0.6 million b/sd.
California has 18 operating refineries (with 64% of West Coast crude distillation capacity) mostly clustered in two refining centers within the state. About 42% of California refinery capacity is in the San Francisco area, and the remaining 58% is in the southern part of the state, primarily near Los Angeles. Washington has 21% of West Coast crude capacity, and all five of its refineries are near Puget Sound. Alaska has five refineries, making up 5% of PADD 5 crude distillation capacity, and Hawaii, with two operating refineries, has 5% of regional capacity.
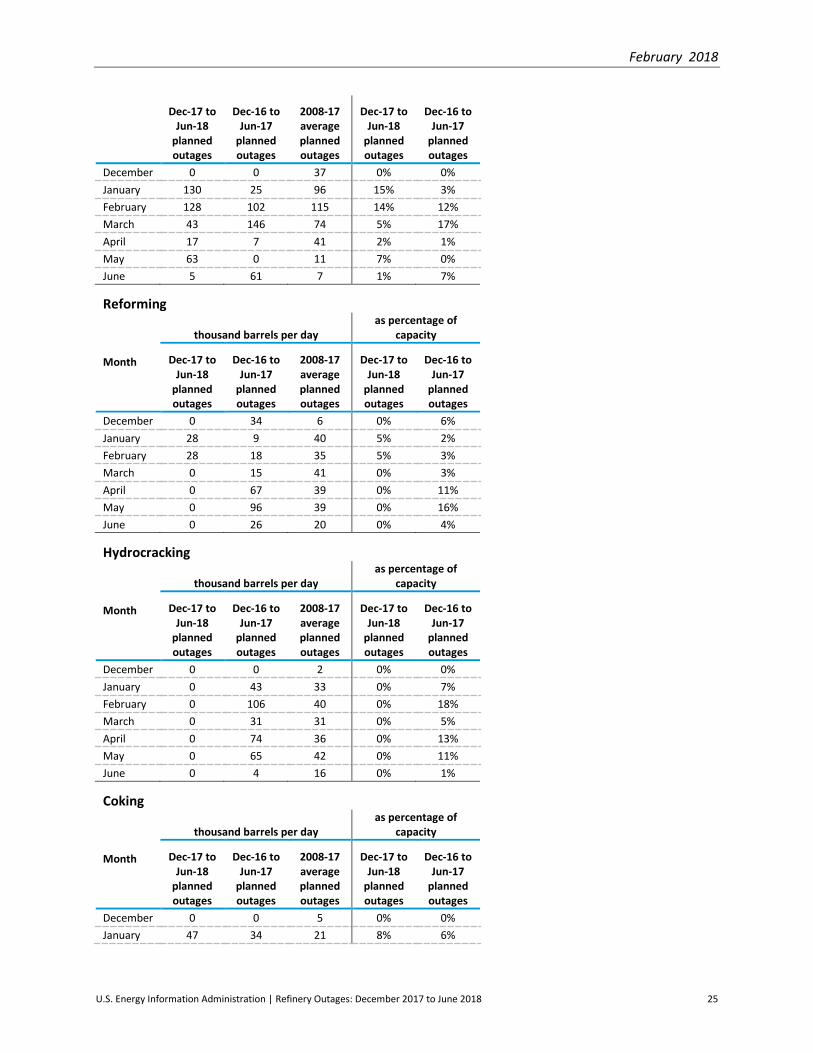
Maintenance of atmospheric crude distillation capacity in the West Coast region is planned by refiners to be close to the 10-year average in December 2017 through June 2018. Planned maintenance for fluidized catalytic cracking capacity is expected to average 130,000 b/d, or 15% of regional capacity, in January and 128,000 b/d, or 14% of regional capacity in February (Table 5 and Figure 14).
Table 5. West Coast (PADD 5) planned refinery capacity outages
Atmospheric crude distillation
Month
thousand barrels per day as percentage of
capacity
Dec-17 to Jun-18
planned outages
Dec-16 to Jun-17
planned outages
2008-17 average planned outages
Dec-17 to Jun-18
planned outages
Dec-16 to Jun-17
planned outages
December 0 147 27 0% 5% January 278 163 92 9% 5% February 226 259 129 7% 8% March 0 107 98 0% 3% April 195 0 149 6% 0% May 38 120 156 1% 4% June 40 195 88 1% 6%
Fluidized catalytic cracking Month thousand barrels per day
as percentage of capacity
7 Stream day capacity is the maximum number of barrels of input that a distillation facility can process within a 24-hour period when running at full capacity under optimal crude and product slate conditions with no allowance for downtime.
February 2018
U.S. Energy Information Administration | Refinery Outages: December 2017 to June 2018 25
Dec-17 to Jun-18
planned outages
Dec-16 to Jun-17
planned outages
2008-17 average planned outages
Dec-17 to Jun-18
planned outages
Dec-16 to Jun-17
planned outages
December 0 0 37 0% 0% January 130 25 96 15% 3% February 128 102 115 14% 12% March 43 146 74 5% 17% April 17 7 41 2% 1% May 63 0 11 7% 0% June 5 61 7 1% 7%
Reforming
Month
thousand barrels per day as percentage of
capacity
Dec-17 to Jun-18
planned outages
Dec-16 to Jun-17
planned outages
2008-17 average planned outages
Dec-17 to Jun-18
planned outages
Dec-16 to Jun-17
planned outages
December 0 34 6 0% 6% January 28 9 40 5% 2% February 28 18 35 5% 3% March 0 15 41 0% 3% April 0 67 39 0% 11% May 0 96 39 0% 16% June 0 26 20 0% 4%
Hydrocracking
Month
thousand barrels per day as percentage of
capacity
Dec-17 to Jun-18
planned outages
Dec-16 to Jun-17
planned outages
2008-17 average planned outages
Dec-17 to Jun-18
planned outages
Dec-16 to Jun-17
planned outages
December 0 0 2 0% 0% January 0 43 33 0% 7% February 0 106 40 0% 18% March 0 31 31 0% 5% April 0 74 36 0% 13% May 0 65 42 0% 11% June 0 4 16 0% 1%
Coking
Month
thousand barrels per day as percentage of
capacity
Dec-17 to Jun-18
planned outages
Dec-16 to Jun-17
planned outages
2008-17 average planned outages
Dec-17 to Jun-18
planned outages
Dec-16 to Jun-17
planned outages
December 0 0 5 0% 0% January 47 34 21 8% 6%
February 2018
U.S. Energy Information Administration | Refinery Outages: December 2017 to June 2018 26
February 32 60 30 6% 10% March 0 18 23 0% 3% April 46 3 31 8% 0% May 9 26 34 2% 4% June 0 25 20 0% 4%
Source: U.S. Energy Information Administration, using IIR data as of October 17, 2017
Figure 14. West Coast (PADD 5) planned refinery capacity outages thousand barrels per day
Source: U.S. Energy Information Administration, using IIR data as of October 17, 2017
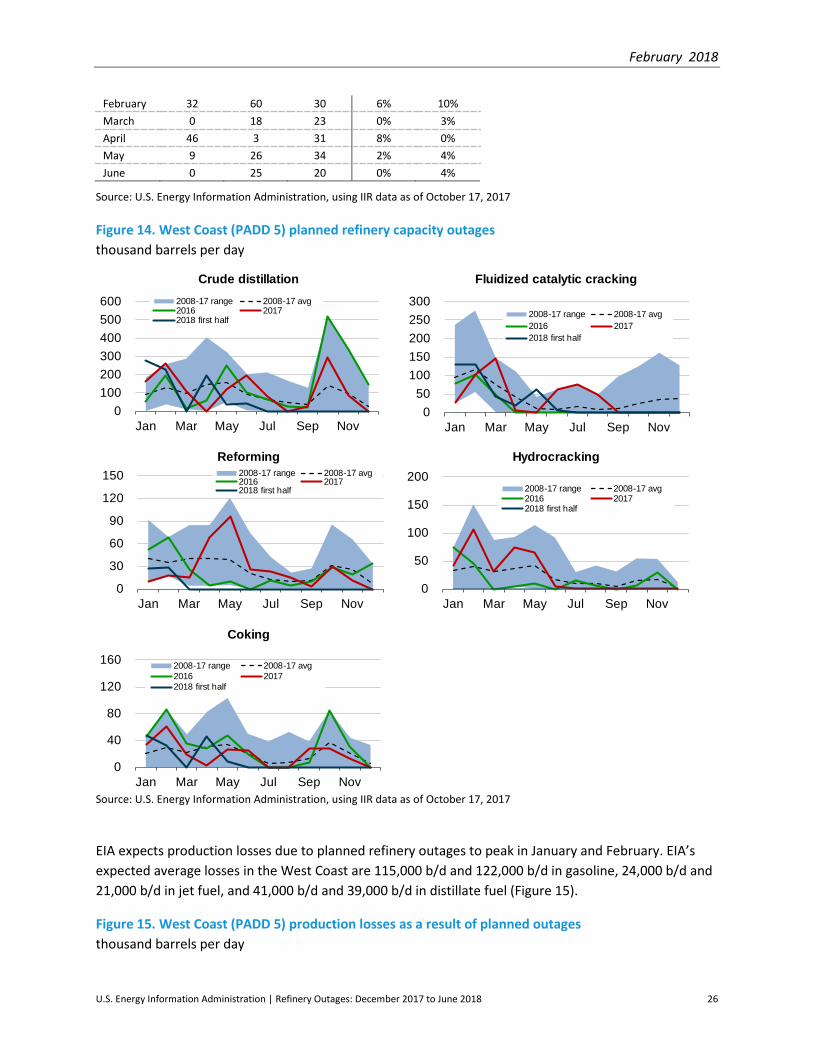
EIA expects production losses due to planned refinery outages to peak in January and February. EIA’s expected average losses in the West Coast are 115,000 b/d and 122,000 b/d in gasoline, 24,000 b/d and 21,000 b/d in jet fuel, and 41,000 b/d and 39,000 b/d in distillate fuel (Figure 15).
Figure 15. West Coast (PADD 5) production losses as a result of planned outages thousand barrels per day
Crude distillation
0100200300400500600
Jan Mar May Jul Sep Nov
2008-17 range 2008-17 avg2016 20172018 first half
Fluidized catalytic cracking
050
100150200250300
Jan Mar May Jul Sep Nov
2008-17 range 2008-17 avg2016 20172018 first half
Reforming
0
30
60
90
120
150
Jan Mar May Jul Sep Nov
2008-17 range 2008-17 avg2016 20172018 first half
Hydrocracking
0
50
100
150
200
Jan Mar May Jul Sep Nov
2008-17 range 2008-17 avg2016 20172018 first half
Coking
0
40
80
120
160
Jan Mar May Jul Sep Nov
2008-17 range 2008-17 avg2016 20172018 first half
February 2018
U.S. Energy Information Administration | Refinery Outages: December 2017 to June 2018 27
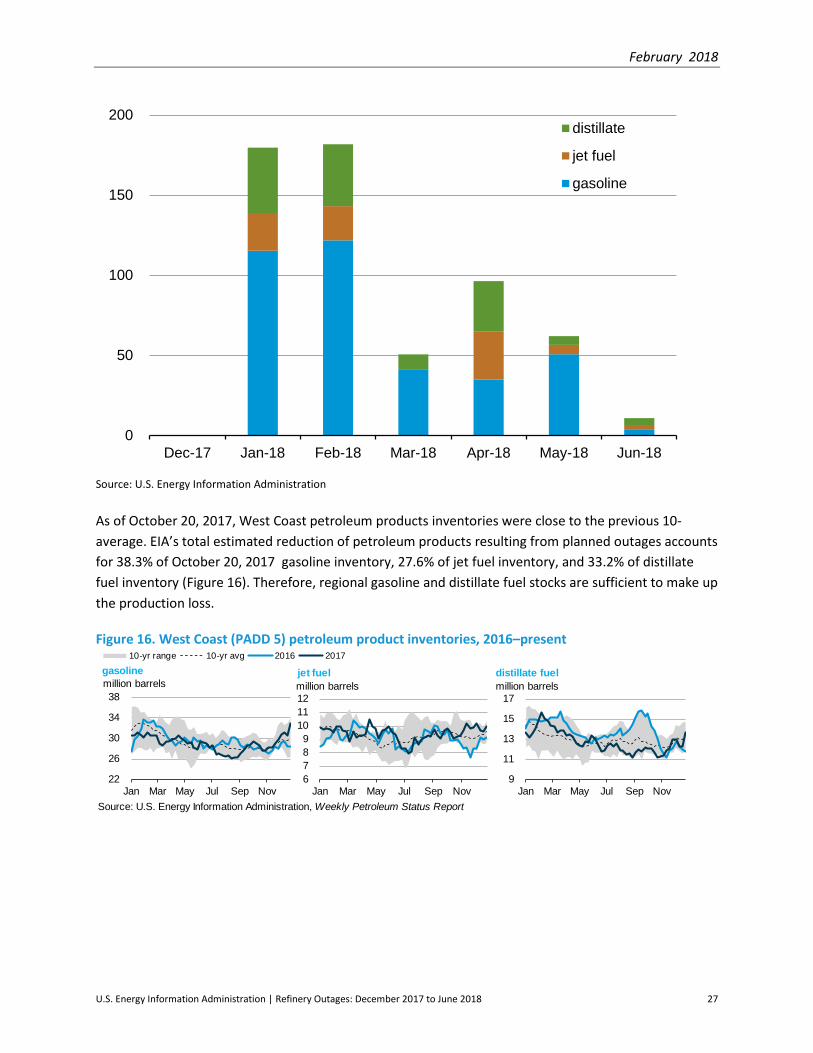
Source: U.S. Energy Information Administration As of October 20, 2017, West Coast petroleum products inventories were close to the previous 10-average. EIA’s total estimated reduction of petroleum products resulting from planned outages accounts for 38.3% of October 20, 2017 gasoline inventory, 27.6% of jet fuel inventory, and 33.2% of distillate fuel inventory (Figure 16). Therefore, regional gasoline and distillate fuel stocks are sufficient to make up the production loss.
Figure 16. West Coast (PADD 5) petroleum product inventories, 2016–present
0
50
100
150
200
Dec-17 Jan-18 Feb-18 Mar-18 Apr-18 May-18 Jun-18
distillate
jet fuel
gasoline
Source: U.S. Energy Information Administration, Weekly Petroleum Status Report
22
26
30
34
38
Jan Mar May Jul Sep Nov
10-yr range 10-yr avg 2016 2017
gasolinemillion barrels
6789
101112
Jan Mar May Jul Sep Nov
jet fuelmillion barrels
9
11
13
15
17
Jan Mar May Jul Sep Nov
distillate fuelmillion barrels