refinery technology profiles - national energy … library/research/coal...refinery technology...
TRANSCRIPT

Refinery Technology Profiles
GASIFICATION And Supporting Technologies
Prepared for
U.S. Department of Energy National Energy Technology Laboratory
Energy Information Administration
Prepared by
John J. Marano, Ph.D. Consultant
June 2003

National Energy Technology Laboratory 06/30/03
ii
ACKNOWLEDGEMENTS The author would like to express appreciation to all the individuals who contributed to the successful completion of this project and the preparation of this report. This includes Patricia Rawls (DOE/NETL), Gary Stiegel (DOE/NETL), Russell Maxwell (Parsons/NETL), Massood Ramezan (SAIC/NETL), James Kendell (DOE/EIA), Han-Lin Lee (DOE/EIA), and Elizabeth May (SAIC/EIA) for helpful suggestions and comments during the execution of this work. Elizabeth and Han-Lin worked diligently to implement the results of this study within EIA’s NEMS model. Howard McIlvried (SAIC/NETL) is to be thanked for providing peer review of this report, and finally, to the many members of the Gasification Technology Council who provided feedback on this project – thank you all. Appendix B, Gasification Markets, was prepared by Russell Maxwell. Much of the information presented in this appendix was derived from the SFA Pacific Gasification Database and from the report, “Potential of Gasification in the U.S. Refining Industry,” prepared for NETL by David Gray and Glen Tomlinson of Mitretek Systems (June 2002). This information proved extremely useful in the implementation phase of this project. This work was jointly funded by U.S. DOE National Energy Technology Laboratory and the Energy Information Administration.
DISCLAIMER This report was prepared at the request of the U.S. DOE National Energy Technology Laboratory (NETL) and the Energy Information Administration (EIA). Any conclusions, comments or opinions expressed in this report are solely those of the author and do not represent any official position held by NETL, EIA, DOE, or the U.S. Government. Information contained herein has been based on the best data available to the author at the time of the report’s preparation. In many cases, it was necessary to interpolate, extrapolate, estimate, and use engineering judgment to fill in gaps in these data. Therefore, all results presented here should be interpreted in the context of the specific requirements for accuracy dictated by the end use application of these data.

National Energy Technology Laboratory 06/30/03
iii
EXECUTIVE SUMMARY
Macroeconomic models such as the Energy Information Administration’s (EIA) National Energy Modeling System (NEMS) require accurate representations of technologies in order to match the current performance of the U.S. energy sector and to realistically forecast future trends. However, these representations are not rigorous models based on first principles; rather, they are pragmatic “snapshots” of the performance of existing or future industrial technologies. One attempts to develop data describing a process’s operating envelope, based on a given set of inputs and empirical cause-and-effect relationships. Special care must be taken to ensure that these relationships are realistic and do not predict impossible, highly unlikely or inconsistent results. Developing these relationships can be especially difficult when the technology is not yet commercial or is proprietary. Considerable care is necessary to translate existing, available information into realistic process representations using sound engineering and economic principles and judgment. Gasification has been proposed as a means of converting petroleum coke (petcoke) and other petroleum residuals and refinery waste streams into power, steam and hydrogen for use in the production of clean fuels. Gasification units are already in operation within a small number of refineries in the U.S. and Europe, and it is expected other refineries will add these units in the future. The National Energy Technology Laboratory (NETL) has developed profiles for refinery gasification options, which may be included in future versions of NEMS used for making EIA’s annual energy forecasts. This project involved: • Review of existing data within NEMS for refinery hydrogen, power and steam generation • Review of NETL reports and the open literature on commercial refinery gasification
projects and conceptual designs • Identification of potential refinery feedstocks for gasification (petcoke, pitch, etc.) • Development of profile data for the gasifier, air separation, gas cleanup, combined heat and
power generation, and hydrogen production subsystems • Identification and development of models to be incorporated into NEMS • Review of existing studies dealing with market potential and penetration for refinery
gasification systems The data and models contained in this report may be used to perform sensitivity analyses on gasification technology within the petroleum refining sector under a range of possible future scenarios. The models can be used to examine a range of gasification technology options for producing hydrogen, power, and steam. This report includes an overview of refinery gasification and supporting technologies and a description of the methodology used in the analysis. A comparison is provided of this newly developed data with the current performance of the technology and the research goals of DOE’s fossil energy programs. The profiles are consistent with existing refinery based gasification plants constructed and operated since 1996.

National Energy Technology Laboratory 06/30/03
iv
The information contained in this report was used to generate the following tables for implementation in the Petroleum Marketing Module (PMM) within NEMS: GSF/GSH – In-refinery gasification-to-syngas and/or hydrogen plant
CHP – Combined heat and power plant Since including gasification in the PMM will change the results of past simulations, care should be taken when updating the model. It would be worthwhile to perform a series of validation runs both with and without refinery gasification to determine the magnitude of these differences. The following sensitivity cases would be useful for testing the new models:
1. Petcoke vs. Heavy Oil feedstock 2. Power and Steam vs. Hydrogen, Power and Steam production 3. Effects of unit reliability and sparing 4. Benefits of the elimination of landfill disposal of petcoke, avoided emissions of criteria
pollutants, disposal of refinery hazardous wastes and the availability of air products for refinery applications
It would also be extremely beneficial to assess the impact that future R&D might have on refinery gasification technologies. This would involve developing new data reflecting anticipated improvements in performance and cost of gasification and combined heat and power generation. However, it must be kept in mind that the PMM forecast only projects aggregate regional conditions, which could over- or under-estimate the market penetration potential of gasification technology. In conclusion, the information provided in this report should be very useful to the EIA in extending the capabilities of the PMM model and improving the quality of EIA’s Annual Energy Outlook forecasts. It is of equal importance to NETL, providing a new capability which may be used in future analyses for assessing the benefits of targeted R&D programs in gasification and in power and hydrogen generation.
National Energy Technology Laboratory 06/30/03
v
TABLE OF CONTENTS
ACKNOWLEDGEMENTS..................................................................................................ii DISCLAIMER......................................................................................................................ii EXECUTIVE SUMMARY .................................................................................................. iii LIST OF FIGURES .............................................................................................................vi LIST OF TABLES ...............................................................................................................vi COMMON ACRONYMS ................................................................................................. vii I. Introduction....................................................................................................................... 1 II. Overview of Refinery Gasification..................................................................................... 3
Benefits of Refinery-Based Gasification.............................................................................. 5 Future of Refinery Gasification............................................................................................ 7
III. Process Description......................................................................................................... 9 Chemistry.......................................................................................................................... 9 Process Variables .............................................................................................................. 9 Process Flowsheet........................................................................................................... 10
Feed Preparation.......................................................................................................... 11 Gasifier ........................................................................................................................ 11 Syngas Cooling ............................................................................................................ 12 Slag/Soot Handling System........................................................................................... 12 Air Separation Unit....................................................................................................... 12 Acid Gas Removal....................................................................................................... 13 Sulfur Plant................................................................................................................... 14 Cogeneration Plant ....................................................................................................... 14 Hydrogen Plant ............................................................................................................ 15 Refinery Integration...................................................................................................... 17
IV. Methodology ................................................................................................................ 19 V. Refinery Gasification Technology Profiles........................................................................ 22 VI. Data Comparisons ........................................................................................................ 29 VII. Recommendations & Conclusions ................................................................................ 31 References.......................................................................................................................... 33 Data Resources................................................................................................................... 34 APPENDIX A - PMM Input Tables for GSF/GSH and CHP.............................................. 36 APPENDIX B - Gasifcation Markets Summary................................................................... 38

National Energy Technology Laboratory 06/30/03
vi
LIST OF FIGURES
Figure 1. Possible Products from Synthesis Gas………………….………………… 3
Figure 2. Simple Block Flow Diagram for Gasification……………………………. 11
Figure 3. Hydrogen Production & Purification Options……………………………. 15
Figure 4. Block Flow Diagram for PPM Gasification Models……………………… 20
LIST OF TABLES
Table 1. Typical Feedstocks for Refinery Gasification………………………………. 4
Table 2. Existing and Planned U.S. Refinery Gasification Capacity………………… 8
Table 3. Quench Gasification Operating Conditions.………………………………… 10
Table 4. Sources of Information on Quench Gasification Process…………………… 19
Table 5. Quench Gasification Process Profile for Syngas……………………………. 24
Table 6. Quench Gasification Process Profile for Hydrogen………………………… 25
Table 7. Cryogenic Air Separation Unit Profiles…………………………………….. 26
Table 8. Acid Gas Removal Unit Profiles……………………………………………. 27
Table 9: Combined Heat and Power Process Profile…………………………………. 27
Table 10. ISBL Capital Costs for Gasification Components…………………………. 28
Table 11. Total Capital Cost for Refinery Gasification………………………………. 28
Table 12. Operating Labor for Refinery Gasification………………………………… 28
Table 13. Predicted Performance of Petcoke Based IGCC…………………………… 30
Table 14. Predicted Performance of Heavy Oil Based IGCC………………………… 30

National Energy Technology Laboratory 06/30/03
vii
COMMON ACRONYMS AGR - Acid Gas Removal API - American Petroleum Institute ASU - Air Separation Unit bbl - Barrel CC - Combined Cycle CHP - Combined Heat & Power DL - Direct Liquefaction DOE - U.S. Department of Energy EIA - DOE Energy Information Administration EMM - Electricity Marketing Module EPA - Environmental Protection Agency FCCU - Fluid Catalytic Cracking Unit FOE - Fuel oil equivalent FT - Fischer-Tropsch GSH - Gasification-to-hydrogen GSF - Gasification-to-syngas GT - Gas Turbine HHV - Higher Heating Value @ 60oF HRSG - Heat Recovery Steam Generator HTM - Hydrogen Transport Membrane IGCC - Integrated Gasification Combined Cycle ISBL - Inside Battery Limit LHV - Lower Heating Value @ 60oF LP - Linear Programming M - 1,000 MM - 1,000,000 MDEA - Methyl-Diethanol Amine MTBE - Methyl Tert-Butyl Ether NEMS - National Energy Modeling System NETL - National Energy Technology Laboratory OSBL - Outside Batter Limit OVC - Other Variable Costs PCD - Per Calendar Day PMM - Petroleum Marketing Module POX - Partial Oxidation PSA - Pressure Swing Absorption PSD - Per Stream Day scf - Standard cubic feet SDA - Solvent De-Asphalting SRU - Sulfur Recovery Unit ST - Steam Turbine TGT - Tail Gas Treating TPD - Tons Per Day USGC - U.S. Gulf Coast WGS - Water Gas Shift

National Energy Technology Laboratory 06/30/03
1
I. Introduction Macroeconomic models such as the Energy Information Administration’s (EIA) National Energy Modeling System (NEMS) require accurate representations of technologies in order to match the current performance of the U.S. energy sector and to realistically forecast future trends. However, these representations are not rigorous models based on first principles; rather, they are pragmatic “snapshots” of the performance of existing or future industrial technologies. One attempts to develop data describing a process’s operating envelope, based on a given set of inputs and empirical cause-and-effect relationships. Special care must be taken to ensure that these relationships are realistic and do not predict impossible, highly unlikely or inconsistent results. Developing these relationships can be especially difficult when the technology is not yet commercial or is proprietary. Considerable care is necessary to translate existing, available information into realistic process representations using sound engineering and economic principles and judgment. The Petroleum Marketing Module (PMM) within NEMS uses a “lumped-model” approach to describe the petroleum refining industry. All the refineries within a given geographic region within the United States are grouped together into a single aggregate refinery. The operations of the industry are then modeled using five regional refineries with a Linear Programming (LP) simulation for the entire U.S. petroleum market. This approach is an extreme idealization of the existing refining infrastructure, necessitated by the size and complexity of the system that NEMS is meant to represent. There are over 100 refineries operating within the borders of the United States. They vary in size from under 50,000 BPCD to over 400,000 BPCD and in complexity, possessing a wide range of capabilities to convert the crude oil barrel into gasoline, jet and diesel fuel. The markets they serve also vary, with differing product quantities and qualities required in different regions. In general, refinery aggregation should be adequate for mid- and long-term forecasting. For short-term forecasting, many of the assumptions used within NEMS, especially those concerned with local and seasonal variations, are overly simplified, and a more detailed modeling approach is required. Currently, EIA addresses these problems by using the PMM and NEMS to perform sensitivity studies to identify the impacts of regulatory changes, import restrictions, etc. Gasification has been proposed as a means of converting petroleum coke (petcoke) and other petroleum residuals and refinery waste streams into power, steam and hydrogen for use in the production of clean fuels. Gasification units are already in operation within a small number of refineries in the U.S. and Europe, and it is expected that other refineries will add these units in the future. The Energy Information Administration (EIA) has requested that the National Energy Technology Laboratory (NETL) develop profiles for refinery gasification options, which may be included in future version of NEMS as part of EIA’s annual energy forecasts. This project involved: • Review of existing data within NEMS for refinery hydrogen, power and steam generation • Review of NETL reports and the open literature on commercial refinery gasification projects and
conceptual designs • Identification of potential refinery feedstocks for gasification (petcoke, pitch, etc.)

National Energy Technology Laboratory 06/30/03
2
• Development of profile data for the gasifier, air separation, gas cleanup, combined heat and power generation, and hydrogen production subsystems
• Identification and development of models to be incorporated into NEMS • Review of existing studies dealing with market potential and penetration for refinery gasification
systems The data and models contained in this report may be used to perform sensitivity analyses on gasification technology within the petroleum refining sector under a range of possible future scenarios. The models can be used to examine a range of gasification technology options for producing hydrogen, power, and steam. This report includes an overview of refinery gasification and supporting technologies and a description of the methodology used in the analysis. A comparison is provided of this newly developed data with the current performance of the technology and the research goals of DOE’s fossil energy programs. Recommendations are also provided for possible future NEMS cases to be run with these models. Appendix A contains the refinery gasification data in a format suitable for implementation in the PMM.

National Energy Technology Laboratory 06/30/03
3
II. Overview of Refinery Gasification Gasification has a long history of research, development and commercialization stretching back more than 50 years. Over 129 plants have been constructed and operated worldwide, and as many as 34 new plants are in various stages of planning and construction [1]. The majority of the existing plants were constructed for the production of synthesis gas or syngas, a mixture containing carbon monoxide (CO) and hydrogen (H2), used in the manufacture of a wide variety of chemicals. The wide range of uses for syngas is depicted in Figure 1. The second largest application has been the production of liquid fuels via the Fischer-Tropsch synthesis. Almost all of these units are located in South Africa, although future plants may be built in a variety of locations around the world for the conversion of stranded natural gas to liquid fuels. Near-term development of gasification technology is focused on the clean production of electric power. This application has been the subject of a number of commercial ventures and demonstrations in recent years. Within the U.S., major demonstration projects supported by the DOE have been sited at Tampa Electric’s power station in Polk County, FL (1996) and Global Energy’s Wabash River station in Indiana (1995). These projects have been based on coal and employ Integrated Gasification Combined Cycle (IGCC) plant configurations. Petcoke has also been tested in these facilities. Commercial applications worldwide have focused on petroleum refining, many involving the trigeneration of hydrogen, power and steam. Recent projects include U.S. refineries in El Dorado, KS (Frontier Oil, formerly Texaco), Coffeyville, KS (Farmland Industries), Delaware City, DE (Motiva), and Baytown, TX (ExxonMobil); and European refineries in Falconara, It. (API), Sicily, It. (ISAB), Sardinia, It. (Sarlux), and Pernis, Neth. (Shell). These refinery applications are the main focus of this report.
Figure 1. Possible Products from Synthesis Gas
Combined Heat & Power Generation
Hydrogen
FT Syncrude
Methanol&
Higher Alcohols
SynGas
To Hydrogenations (pet refining & other)To HydrocrackingTo Ammonia SynthesisPossible Fuel-Cell Fuel
To Oxo Chemicals &Derivatives
Possible Fuel-Cell Fuel
MTBEFormaldehydeDMEAcetic AcidAcetaldehydeAcetic AnhydrideChloromethanesDMTMMAMethyl Amine
Urea (fertilizers)
To Refinery UpgradingTo Naphtha Steam CrackerAlpha OlefinsLube Oil Base StockSpecialty Waxes
Gasoline & Diesel Fuel
Ethylene &Propylene

National Energy Technology Laboratory 06/30/03
4
A wide variety of feedstocks can be considered for gasification, ranging from solids to liquids to gaseous streams. Although when the feed is a gas or liquid, the operation is frequently referred to as partial oxidation (POX). From a process perspective, partial oxidation of gases and liquids is very similar to the gasification of solids. The term “gasification” will be used to refer to all these applications within this report. The major requirement for a suitable feedstock is that it contains a significant content of carbon and hydrogen. Solid feedstocks include coal, petcoke, biomass, and other solid waste streams. There are many hydrocarbon containing gas and liquid streams that may be used as a feedstock for gasification. However, the streams most commonly employed are generally low-value by-products or waste streams generated by other processes. Refinery feedstocks often considered are process off-gas streams and residual oils such as vacuum resid, visbreaker tar, and deasphalter pitch. These residuals are often referred to generically as “heavy oils.” This report develops profile data for both petcoke and heavy oils. Table 1 lists typical compositions and properties of these feedstocks. Refinery off-gases are not considered here.
Table 1. Typical Feedstocks for Refinery Gasification
Major developers/licensors of gasification technologies include ChevronTexaco, Shell, Global Energy and others. Each of these technologies has its own unique features, which are discussed briefly later in this report. The profiles developed here are primarily based on the Texaco quench gasification process. Supporting technologies include air separation, acid gas removal, hydrogen separation and combined-cycle power generation. All major commercial applications of gasification technology have relied on
UnitsVacuum
ResdiudeVisbreaker
TarAsphalt Petcoke
Ultimate AnalysisC wt/wt 84.9% 86.1% 85.1% 88.6% H " 10.4% 10.4% 9.1% 2.8% Na " 0.5% 0.6% 0.7% 1.1% Sa " 4.2% 2.4% 5.1% 7.3% O " 0.5% 0.0% Ash " 0.0% 0.1% 0.2% Total wt/wt 100.0% 100.0% 100.0% 100.0%
H2/C Ratio mol/mol 0.727 0.720 0.640 0.188
Density Specific Gravity 60o/60o 1.028 1.008 1.070 0.863API Gravity oAPI 6.2 8.88 0.8 -Heating Values
HHV (dry) M Btu/lb 17.72 18.6 17.28 14.85LHV (dry) " 16.77 17.6 16.45 14.48
a Nitrogen & sulfur contents vary widely.

National Energy Technology Laboratory 06/30/03
5
cryogenic air fractionation processes; however, novel membrane separation-based technologies are currently under development for this application. Major suppliers of cryogenic air separation unit (ASU) include Air Liquide, Air Products & Chemicals, Linde and Praxair. A wide variety of acid gas removal technologies have been employed. Major providers of these technologies include Lurgi and UOP. UOP is also a major supplier of hydrogen purification technologies. Gas turbine technologies used in combined-cycle power generation systems are available from General Electric and Siemens/Westinghouse. Benefits of Refinery-Based Gasification The recent interest within the U.S. in petroleum refinery-based gasification has been driven by a number of issues currently facing refiners:
• U.S. refiners are shifting crude oil slates to heavier, sour crude oils requiring increases in refinery coking capacity
• Coking capacity worldwide has been increasing, providing fewer outlets for U.S. high-sulfur petcoke
• The disposal of refinery generated hazardous wastes has become a major issue for U.S. refiners • U.S. refiners are coming under increasing pressure to reduce emissions of criteria pollutants and
greenhouse gases generated at their facilities • U.S. refiners’ hydrogen needs are rising rapidly due to requirements to produce ultra-low sulfur
fuels • Low sulfur fuels and other possible fuel regulations (such as an MTBE ban) may lead to refiners
becoming “short” of light products (gasoline, jet, and diesel fuel) Coking capacity in the U.S. rose by about 60% in the past decade, while in the rest of the world capacity rose by about 170% [2]. Current U.S. coking capacity stands at about 2,240,000 BPCD and for the rest of the world at 1,910,000 BPCD [3]. Visbreaking capacity in the U.S. declined by over 50% in the last decade to about 44,000 BPCD. Solvent Deasphalting capacity for fuels production is also small in the U.S. at 360,000 BPCD, but has been steadily increasing [4]. While some of the petcoke produced in the U.S. is of a quality suitable for the production of specialty carbon products, the majority is high in sulfur content and only suitable for use as a substitute for or co-feed with coal as a boiler fuel. Traditionally, U.S. Gulf Coast refineries producing high-sulfur coke have sold this coke into overseas markets at roughly breakeven values of less than $5 per ton [5]. The increase in petroleum coking internationally has constrained growth in these markets for U.S. refiners. Refiners located in the interior of the U.S. are facing even more difficult challenges in marketing their petcoke. In some instances, petcoke is being sent to landfills at a significant cost to the refiner. At the same time that the disposal of petcoke is becoming a problem, the U.S. EPA has been tightening enforcement of regulations pertaining to solid, liquid and gaseous emissions from petroleum refineries. Solid and liquid wastes are suitable supplemental feedstocks for gasification, and significant savings can be achieved by disposing of hazardous materials in this way. Frontier Oil’s El Dorado, Kansas, refinery (formerly owned by Texaco) supplements petcoke with acid soluble oils, phenolic residue, and recycled filter cake [6]. Special permitting was required for this plant; however, the EPA has recently proposed

National Energy Technology Laboratory 06/30/03
6
rules which will make it easier to dispose of hazardous wastes in this manner. Based on public comment, it is anticipated that the rule making process will move forward; however, modifications may be made, delaying implementation. Solid waste is reduced by over 95% by gasification versus conventional boilers, and fresh water use is reduced by about one half. Airborne emissions from IGCC power generation of criteria pollutants and of the greenhouse gas CO2 are also much lower than those generated from the burning of petcoke in conventional boilers. Reductions are: SO2, ~86%; NOx, ~73%; CO, ~80%; VOCs, ~12%; PM, ~65%; and CO2, ~14%. While facing the many challenges discussed above, refiners are also being forced to make significant changes to their products. Before the end of the decade, refiners will be required to produce both low-sulfur gasoline and ultra-low sulfur diesel products. This has necessitated refineries to upgrade and expand desulfurization capacity. Desulfurization is primarily accomplished by hydrotreating high-sulfur streams found in the refinery. Severe hydrotreating requiring significant consumption of hydrogen is necessary to reach the very low levels of sulfur being required, 30 ppm for gasoline and 15 ppm for diesel fuel. It is anticipated that the drive toward cleaner fuels will continue into the next decade, resulting in further increases in demand for hydrogen within the refinery. The relative cost of hydrogen from gasification of low-value residuals versus hydrogen from steam reforming of natural gas is very sensitive to the price of natural gas. As the demand for both hydrogen and natural gas increases in the future, gasification will become a more attractive option for supplying hydrogen to the refinery [7]. Other changes to gasoline specifications will also impact refiners. A possible phase-out of the gasoline additive MTBE and lower volatility specifications will result in refiners being “short” on gasoline. Refiners will need to find new gasoline blending streams to make up the loss in gasoline volume which will result from removal of MTBE and high volatility components. This loss of light product is exacerbated by the requirement for low sulfur and the switching of some refiners from light to heavy crude oils. Both result in losses in gasoline, jet, and diesel fuel volumes [4]. For the heavy oil refinery, these losses may be balanced by the conversion of petcoke to fuels via gasification and Fischer-Tropsch synthesis. This option has not yet been demonstrated, but is a viable consideration for providing the refiner with additional yield of light products from heavy crude oil. In summary, major benefits of refinery-based gasification are:
• Source of power, steam and air products (oxygen and nitrogen) for refinery use or for export and sale
• Source of syngas for both hydrogen and refinery light products (FT synthesis) • Greater efficiencies for power generation than for the combustion of residuals in conventional
boilers • Much lower air emissions than for either direct combustion in conventional boilers or
incineration • Smaller solid waste stream than for direct combustion • Residuals are consumed where produced; thus, no off-site transportation or storage is required • Potential to dispose of other refinery waste streams, including hazardous materials

National Energy Technology Laboratory 06/30/03
7
Many of the benefits listed above are site specific. Based on various literature sources, the potential savings to a refinery may be estimated (for preliminary analyses) as:
• Waste Disposal - 2,000 – 3,000 $ per Calendar Day (PCD) • High-Purity Hydrogen - 3,000 – 22,000 $ PCD • FCCU O2 for Air Enrichment - 4,000 – 25,000 $ PCD • SRU O2 for Air Enrichment - 1,500 – 2,400 $ PCD • Refinery Nitrogen - 2,500 $ PCD
Future of Refinery Gasification There are currently five gasification facilities located at U.S. refineries. These are listed in Table 2. Of these, all but the Convent, LA, facility, have been constructed since 1996. Another two refinery-based gasification plants are in various stages of planning, engineering and construction, and are targeted for completion in 2005/2006. In addition, the two existing IGCC-based power plants have been operated on petcoke or mixtures of petcoke and coal, and two petcoke-based IGCC projects are under consideration. About 63% of the existing refinery gasification capacity is based on petcoke as the feedstock, and 37% is based on heavy oil. The two planned facilities are based on petcoke. Appendix B contains a summary of gasification technology markets based on previous work conducted by NETL and its contractors. In the U.S., combined visbreaking and solvent deasphalting (SDA) capacity in the U.S. is only about one-fifth that of coking capacity. Thus, growth in refinery gasification will most likely be driven by future supply and demand for petcoke. As mentioned earlier, coking capacity in the U.S. grew by about 60% over the last decade. This trend is expected to continue, albeit, possibly at a slower rate. There are significant benefits to integrating deasphalting and gasification, which potentially could lead to growth in SDA capacity in the future [9]. Visbreaking is unlikely to make a comeback in the U.S. anytime soon. International projects have been predominantly based on visbreaker tar due to the greater proportion of these units located in European refineries. A previous study conducted by Mitretek for NETL [7] identified 40 refineries within the U.S. which produce sufficient quantities of petcoke (>1,000 TPD) to be considered candidates for the addition of petcoke gasification. This number could increase significantly if more U.S. refineries initiate heavy oil upgrading projects in the future. The Mitretek analysis assumed a 2010 world oil price of $23/bbl and a natural gas price of $3.80/MM Btu. Production from the plants was hydrogen meeting 45% of the requirements for the production of ultra-low sulfur diesel and power satisfying 100% of the refineries’ needs with surplus power available for sale. Simple economic paybacks were estimated to be between four and five years. Thus, these projects would be considered reasonable economic investments. It appears that the slow rate of development is associated with the perception of risk that is always a concern with new and complex technologies and with uncertainties relative to the future price of natural gas. As more-and-more refinery gasification projects are implemented worldwide, associated perceptions of risk should decrease.

National Energy Technology Laboratory 06/30/03
8
Table 2. Existing and Planned U.S. Refinery Gasification Capacity
Units Petcoke Heavy Oil ProductU.S. East Coast - PADD 1
Motiva Enterprises - Deleware City TPD 2100 CogenU.S. Midwest - PADD 2
Frontier Oil - El Dorado, KS TPD 170 CogenFarmland Industries - Coffeyville, KS " 1100 HydrogenTotal for PADD 2 TPD 1270
U.S. Gulf Coast - PADD 3Motiva Enterprises - Convent, LA TPD 826 HydrogenExxonMobil - Baytown, TX " 1116 SyngasTotal for PADD 3 - existing TPD 1942TECO/Citgo - Lake Charles, LA " 5548 Cogen/HydrogenShell - Deer Park, TX " 5056 Cogen/SyngasTotal for PADD 3 - planned TPD 10604
Total Exisitng U.S. Capacity TPD 3370 1942
Total Planned U.S. Capacity TPD 10604 -
Based on recent construction history and plans, growth in petcoke supply and favorable economic paybacks, a market penetration rate of possibly one plant every two years would not seem unreasonable. This would result in 7 to 9 plants by 2010 and as many as 17 plants by 2025. Gasification plant capacities of 1,000 to 2,000 TPD are typical; however, the planned facilities listed in Table 2 are over 5,000 TPD.

National Energy Technology Laboratory 06/30/03
9
III. Process Description Chemistry The chemistry of gasification is quite complex. Although the exact sequence of reactions occurring is a function of the starting material, at typical reaction conditions the species formed by these reactions are the same: CO, CO2, H2 and H2O with some methane. The following are the major reactions which one would expect from the gasification of petcoke and residual oils: Exothermic Reactions:
Partial Combustion: C + ½ O2 → CO (1) Complete Combustion: C + O2 → CO2 (2) Water-Gas-Shift: CO + H2O ↔ CO2 + H2 (3) Methanation: C + 2 H2 → CH4 (4) CO + 3 H2 ↔ CH4 + H2O (5) Endothermic Reactions:
Boudard Reaction: C + CO2 → 2 CO (6) Steam-Carbon Reaction: C + H2O → CO + H2 (7) Hydrogen Liberation: 2 H → H2 (8)
C and H in the above reactions denote carbon and hydrogen bound up in the feedstock. The feedstock may also contain sulfur, nitrogen, oxygen and “mineral matter.” The former are liberated during gasification as H2S, COS, NH3, HCN and H2O. A hydrolysis step may be necessary to convert trace quantities of COS and HCN to H2S and NH3, respectively, depending on the end use of the syngas. The mineral matter (ash or metals) leaving the gasifier is bound up in slag or metal cake product. The Water-Gas-Shift (WGS) reaction (3) is used to convert CO in the product syngas to additional hydrogen. For hydrogen production, this reaction is carried out in single or multiple stage WGS reactors. Process Variables At the high temperatures that are employed in refinery gasification applications, many gasification reactions are equilibrium controlled. Methanation is favored at lower temperatures; thus, little methane is produced. Since the gasifier is operated at essentially adiabatic conditions, the heat liberated by the exothermic reactions listed above must balance with the heat required by the endothermic reactions and the heat required to heat the feed streams. The extent of complete combustion which occurs is a function of the amount of oxygen co-fed to the gasifier. Gasification temperature is controlled by the addition of water or steam. For slurried feedstocks, the slurry water accomplishes this control. For other feedstocks, such as heavy oils, steam is injected with the feedstock to control temperature. Steam injection may also be used to adjust the composition of the product syngas.

National Energy Technology Laboratory 06/30/03
10
Table 3 summarizes relevant operating conditions for the quench gasification process considered for profile development in this report.
Table 3. Quench Gasification Operating Conditions
Process Flowsheet
A simple block flow diagram of a gasification facility as it might be used within a petroleum refinery is shown in Figure 2. Gasification-based systems are typically highly integrated processes. The complex consists of a number of distinct processing steps/plants. These are: feed preparation, gasifier, air separation unit (ASU), syngas clean-up, sulfur recovery unit (SRU), and downstream process options such as cogeneration, hydrogen production, Fischer-Tropsch synthesis, or methanol synthesis. Any given instillation may or may not contain all of these plants depending on the feedstock employed, products desired, and the availability of spare capacity in preexisting plants at the refinery. For example, if the refinery has spare sulfur plant capacity or can revamp its existing sulfur plant to gain capacity, the sulfur plant would be considered outside the battery limits of the gasification complex. Other OSBL plants include waste water treatment, cooling water supply and other common plant utility systems. FT and methanol synthesis were not considered in the development of the profiles presented later in this report.
Oxygen Purity Typically greater than 95%.
Oxygen Requirement240 to 290 scf/MM scf of syngas, or0.42 to 0.59 molar O2/C feed ratio, or20 to 30% of theoretical O2 requirement for complete combustion.
Slurry Concentration 60 to 65% for solid feedstocks.
Carbon Conversion Typically greater than 99%.
Syngas H2/CO Ratio ~1.75 w/Natural Gas, ~0.94 w/Naphtha, ~0.92 w/Orimulsion, ~0.83 w/Vacuum Resid, ~0.61 w/Petcoke.
Syngas HHV 82 to 87% of HHV of feed.
Cold Gas + Steam Efficiency
About 90% for quench vs. 94% for radiant syngas cooler.
Pressure Rangein reaction zone
300 to 1200 psig, preferrably 500 to 850 psig, high pressures may eliminate product gas recompression.
Temperature Rangein reaction zone normally 2000 to 2600
oF, typically around 2500
oF, as high as 2800
oF.
Temperature Rangeentering syngas coolers 390-750
oF.
Temperature Rangeexiting syngas coolers Less than 250
oF.

National Energy Technology Laboratory 06/30/03
11
Figure 2. Simple Block Flow Diagram for Gasification
Feed Preparation Feed preparation and handling are not major concerns when feeding liquids and gases; however, for solids special preparation and feeding systems are required. There are two distinct approaches used with solid feedstocks, wet feed systems and dry feed systems. Wet feed systems employ grinding and slurrying with water to prepare a mixture containing between 60 and 65% solids, which may be pumped to the gasifier. The Global and Texaco gasifiers are wet feed systems. Dry feed systems also require grinding of the solid and employ lock hoppers to pressurize the feed. The solid is then transported to the gasifier using a carrier gas such as N2. CO2 can also be used as a carrier and has certain advantages when considering the downstream conversion of the syngas via the FT or methanol synthesis. The Shell gasifier is an example of a dry feed system. The Texaco gasifier at the El Dorado, Kansas, refinery employs a dual feeding system. The primary feed is a petcoke/water slurry. Other feeds (refinery waste streams) which are liquids are fed via a secondary system. Gasifier As mentioned previously, there are many different systems that have been employed for gasification. Only the Texaco and Shell entrained-flow processes will be described here. As mentioned above, Texaco employs a slurry feeding system for solids. The gasifier is a vertical cylindrical, refractory-lined pressure vessel. Shell employs a horizontal vessel with double walled construction and refractory lining. The Texaco gasifier operates at higher pressures (up to 1,100 psig) than the Shell gasifier (about 400
FeedPrep Gasifier Syngas
Clean-up
ASU
Co-Gen
RefineryResiduals
Air
Steam
Oxygen
Nitrogen
Slag
H2Plant
FTS
MTS
Power
FT Fuels
Methanol
H2S, NH3 , etc.
SRU
Sulfur
Hydrogen
FeedPrep Gasifier Syngas
Clean-up
ASU
Co-Gen
RefineryResiduals
Air
Steam
Oxygen
Nitrogen
Slag
H2Plant
FTS
MTS
Power
FT Fuels
Methanol
H2S, NH3 , etc.
SRU
Sulfur
Hydrogen

National Energy Technology Laboratory 06/30/03
12
psig). In general, the syngas leaving the Texaco gasifier will have a higher H2/CO ratio. Thus, for hydrogen production less shift conversion is required. Syngas Cooling High-temperature cooling of the raw syngas may be accomplished either using a water quench or a radiant heat exchanger. The radiant heat exchanger produces high-pressure steam which may be used in a steam turbine to improve the overall efficiency of the gasification process. This is the system employed in the Shell gasification process. A quench system as employed by Texaco is slightly less efficient but may be more reliable and less costly. The quench system also has advantages when hydrogen is the desired product, since it produces sufficient steam in the syngas for the downstream water-gas-shift conversion. Texaco also provides a version of their process which employs a radiant cooler. The raw syngas must be further cooled due to temperature limitations of existing commercial acid gas removal technologies. Medium and low pressure steam is generated in these convective syngas coolers. Slag/Soot Handling System Gasifiers may also be classified as either slagging or non-slagging. Petcoke, like coal, contains inorganic ash components. At the high temperatures employed for gasification of these feedstocks, the ash is fused forming a molten slag which must be removed from the gasifier. In the Texaco gasifier, this slag coats the inner walls of the gasifier and flows downward into a separate chamber where it is quenched and solidified using recycled water. The slag is periodically removed and disposed of as a non-leachable solid waste stream. Slag may have value as a construction material. Petcoke typically contains insufficient ash content to properly coat the gasifier vessel, and a fluxing agent is used to supplement the petcoke feed. Local soils have been used as fluxing agents at El Dorado. Heavy oil feedstocks typically do not produce a slag stream. Both petcoke and heavy oils also produce particulate matter (soot or fly slag) which is entrained and must be removed from the raw syngas product. This is normally accomplished using a water scrubber, with the water recycled directly or indirectly to the gasifier. The flyslag contains unconverted carbon, fused ash from solid feedstocks, and fused trace metals found in heavy oils (primarily vanadium and nickel). Improved performance is achieved by recovering and recycling unconverted carbon to the gasifier. Since heavy oil gasifiers do not produce a slag product, trace metals must be removed and recovered from the flyslag. This has been traditionally accomplished using a naphtha extraction unit to remove and recycle the carbon, though other methods are also employed. The concentrated metal cake recovered can be sold into the metals reclamation industry. Air Separation Unit All oxygen-blown gasifiers currently in operation employ cryogenic air separation to produce nearly pure oxygen (i.e., greater than 95%) for the gasification process. Feed air is conditioned to remove trace impurities and to produce bone-dry air which is fed to the main air compressor. Compressed air is then fed to a “cold box” which includes all of the sub-ambient temperature components of the process. These include a system of highly thermally integrated fractionation columns which separate the

National Energy Technology Laboratory 06/30/03
13
air into oxygen and nitrogen. The purity of the oxygen produced is a function of the complexity of the fractionation system. Purities greater than about 97% require an additional column to remove trace quantities of argon found in air. Depending on the gasifier’s operating pressure, the oxygen product may require compression. The nitrogen may also require compression if it is to be co-fed with the syngas to a gas turbine. These requirements for compression make air separation a very power intensive process. For this reason a variety of techniques can be employed to reduce electric power consumption. Superheated high-pressure steam which may be generated in the gasification or CHP block can be used to drive the ASU compressors. Also, the main air compressor may be integrated with the air compressor associated with the gas turbine. The compressed air required by the ASU is extracted from the GT air compressor at the required intermediate pressure. Operations that have employed this approach have generally limited this “air-side” integration to around 50% to maintain process reliability. As mentioned in the benefits section of this report, the presence of the ASU within the refinery can provide additional benefits to the refiner. The ASU is a source of nitrogen, which is used to purge and blanket equipment, and oxygen, which may be used in oxygen enriched air combustion. Oxygen enriched air combustion can be used to debottleneck the FCCU regenerator allowing either for increased throughput or processing of lower quality residuals in the FCCU. Enriched air may also be used to increase the throughput of the refinery SRU. In addition, the ASU can produce a variety of air products, oxygen, nitrogen, and argon, for export and sale. Acid Gas Removal The impurities H2S, COS, NH3 and HCN in the raw syngas must be removed prior to end use. As mentioned above, a hydrolysis step may be used to convert trace quantities of COS and HCN to H2S and NH3, respectively. Ammonia can be removed from the syngas using a sour water stripper. Any residual ammonia will be converted to N2 in the downstream combustion sections of the plant prior to release of any flue gas. All commercial acid gas removal (AGR) processes employ a (lean) solvent which is used to absorb the acid gases (H2S and/or CO2) from the raw syngas. The (rich) solvent is then regenerated in one or more strippers to produce concentrated H2S and/or CO2 waste streams. The H2S stream is routed to the sulfur recovery unit; whereas, the CO2 may be vented, co-fed to the gas turbine, or even sequestered, if warranted. Many solvents have been used for AGR. The three of most current interest for gasification systems are amine, in particular MDEA (methyl diethanol amine), methanol (Rectisol solvent) and selexol. Amines are chemical solvents, where a weak electrolytic bond is formed between the acid gas and the amine. Various amines are available; MDEA is a selective amine. It is used to preferentially remove H2S, while leaving CO2 in the syngas. Typical absorber operating temperatures with amines are between 80o and 120oF. Physical solvents, such as methanol and selexol, employ lower temperatures to improve the solubility of the acid gases. The Rectisol process operates below 0oF, requiring a refrigeration system. In general, more energy is required to regenerate a chemical versus a physical

National Energy Technology Laboratory 06/30/03
14
solvent. The profiles presented later employ MDEA when the syngas is to be used for cogeneration and Rectisol when hydrogen is the desired product. Further work is needed to characterize the selexol process. Sulfur Plant The sulfur plant typically employs two separate processing steps to produce a liquid or solid sulfur product and a low-sulfur flue gas from the acid gas stream from the AGR plant. These units are the Sulfur Recovery Unit or SRU and the Tail Gas Treating unit or TGT. The Claus process is the most widely used process for sulfur recovery. The Claus process occurs in two steps. In the first step, H2S is oxidized to SO2, which is reduced in the second step to elemental sulfur. Multiple fixed-bed reactors are used to carry out this process. The purpose of the TGT is to remove trace sulfur compounds from waste gas leaving the SRU before this stream is sent to an incinerator and stack. A number of processes are available for TGT, and many employ amine absorption systems. The SCOT (Shell Claus Offgas Treatment) process is of this type. Tail gas recycle to the gasifier has been employed as a means of achieving zero emissions of sulfur oxides from the gasification facility. For the data developed here for implementation in the PMM, the SRU and TGT have been assumed to be OSBL plants. Any additional sulfur plant capacity required will be made available within the PMM by expanding the capacity of the existing PMM sulfur plant (SUL). Therefore, no data profiles for SRU and TGT are included in this report. Cogeneration Plant The combined heat and power (CHP) block may consist of up to three different units, a gas turbine (GT), which combusts the fuel and expands the hot exhaust gases to recover power, a heat recovery steam generator (HRSG) or waste heat boiler, which produces steam from the hot exhaust from the gas turbine, and a steam turbine (ST), which expands the steam generated in the HRSG to recover additional power. In combined-cycle mode, the CHP block maximizes the production of power and produces no residual steam. In cogeneration mode, both power and steam are produced. The steam is exported to the refinery for process heating and other applications. The CHP can be extremely complex or relatively simple depending on the given application. For example, the petcoke gasification unit at the El Dorado refinery does not include a steam turbine. All the steam generated in the HRSG is exported to the refinery. Complex systems will include an economizer to preheat boiler feed water, steam reheat cycles, multiple levels of steam production, multiple extraction and injection points in the steam turbine and a surface condenser used to condense the steam turbine exhaust at near vacuum pressures. All of these options are designed to improve power cycle efficiency. Steam generated in the gasifier syngas coolers may also be routed to the HRSG or directly to the ST. Steam exported to the refinery may be provided by extracting steam from the steam turbine at intermediate pressures. It is normal for the ST to have three stages employing different steam inlet pressures and conditions.

National Energy Technology Laboratory 06/30/03
15
The gas turbine is also a relatively complex piece of equipment. It includes an air compressor, which is connected to the same shaft and driven by the turbine, a combustion chamber, the expander and generator. The upper operating temperature of the GT is limited by materials of construction; and therefore, a diluent is used to directly quench the syngas or indirect cooling with water may be used. Diluent also increases the volumetric flowrate through the device and serves to suppress NOx formation. Steam from the HRSG, CO2 from the AGR, and N2 from the ASU have been used or proposed for this application. Hydrogen Plant When hydrogen is desired as a co-product from gasification, the flowsheet for the gasification block becomes more complex. Not only can hydrogen be recovered from the cleaned syngas to produce a high-purity hydrogen stream for refining, but also the CO in the syngas can be shifted via Reaction (3) above to further maximize hydrogen production. In such a system, roughly 98% or more of the CO can be converted to hydrogen. Figure 3 shows a schematic for a number of process options available for producing and purifying hydrogen and integrating with the combined heat and power block [10].
Figure 3. Hydrogen Production & Purification Options
No existing gasification facility employs all of these technologies, though there are a variety of combinations used in practice. A description of the components is provided below. CO Shift - CO in the syngas is converted to additional hydrogen via the water-gas-shift reaction. High, medium and low temperature shift catalysts may be used individually or in combinations to optimize conversion. High per pass conversions are favored by high temperatures; however, equilibrium is favored by lower temperatures. Sulfur tolerant shift catalysts are available, and in some designs acid gas removal is carried out downstream of the shift reactors.
HTS / LTSCO Shift
HTMMembrane P S A
Expander Gas Turbine H R S G
CleanSyngas
Power Power Steam
Non-Permeate FiredOff Gas
High-PurityHydrogen
- optional - - optional -
- optional -
HTS / LTSCO Shift
HTMMembrane P S A
Expander Gas Turbine H R S G
CleanSyngas
Power Power Steam
Non-Permeate FiredOff Gas
High-PurityHydrogen
- optional - - optional -
- optional -

National Energy Technology Laboratory 06/30/03
16
HTM Membrane - In a Hydrogen Transport Membrane unit, the recovery of high purity hydrogen is based on the relative rates at which different compounds in the syngas permeate the membrane. Membrane units contain bundles of small hollow fibers in order to maximize the surface area available for H2 transport. High pressure drops make this purification technology unattractive when used standalone. PSA - With Pressure Swing Absorption, selective adsorption of methane, CO, CO2, and H2O occurs on specially designed beds of sorbent materials at high pressures. Adsorbed compounds must be cyclically removed by reducing pressure to produce a low to medium-Btu fuel gas. 99.8% purity hydrogen can be produced with PSA. Multiple adsorption beds are normally required to achieve this high purity. Systems are typically designed to recover about 90% of the hydrogen in the syngas feed. The purge gas may be recycled to achieve higher H2 recoveries; however, this is rarely done except in the production of ammonia from H2 and N2. Hydrogen production and separation systems rarely contain all three components described above; however, systems using two of the three are common. Examples include Sarlux and Farmland Industries gasification plants. Grassroots designs typically only employ a single WGS stage; however, adding a LTS after HTS is used in revamps to incrementally improve H2 recovery. The optimal design of a hydrogen production and purification system is based on the following set of criteria:
• hydrogen demand • required hydrogen delivery purity and pressure • hydrogen recovery efficiency • total plant integration opportunities • system reliability, availability and maintenance requirements • capital and operating costs
An important factor in the design of hydrogen production and purification systems is integration with the CHP block. Both HTM and PSA produce off-gas streams that may be used as fuel. The simplest designs employ a CO boiler to produce stream. Advanced designs, as would be found with gasification-based systems, will include a GT and HRSG. The non-permeate from the HTM and the purge gas stream from the PSA may be fired directly in the GT or post-fired to boost feed gas temperature to the HRSG. Power recovery by means of an expander is also an option, depending on the operating pressure of the gasifier. Other technologies have been used for hydrogen purification. Cryogenic distillation employs a liquid nitrogen wash stream. Purities of 97% can be achieved cryogenically but involve stiff penalties relative to total hydrogen recovery. Cryogenic systems are most often found in ammonia synthesis plants. Methanation systems are also used to convert residual CO and CO2 in the product hydrogen stream to methane and water. Carbon oxides are catalyst poisons in most catalytic hydroprocessing systems. There are a number of drawbacks to methanation. It consumes hydrogen and lowers the purity due to the residual methane and other impurities that are not removed. Hydrogen purities are limited to about

National Energy Technology Laboratory 06/30/03
17
85% unless this process in combined with some other technology. It also requires high conversion in the WGS reactors, normally requiring at least two stages and upstream bulk CO2 removal. Combined CO and CO2 content of the feed gas is limited to about 1% to control temperature rise across the catalyst bed due to the high exothermicity of the methanation reactions. This older, conventional technology has been in use in steam methane reforming units and is slowly being replaced as these units are revamped. Advanced technologies are being developed for hydrogen production and purification. A promising approach utilizes a hydrogen membrane reactor which combines the WGS reaction and membrane separation within a single device. The benefits are higher conversion at lower operating temperatures. H2 is continuously removed from the reaction zone via the membrane, thus removing the equilibrium constraint and improving conversion for the WGS reaction. Refinery Integration The refinery gasification and CHP blocks integrate with the rest of the petroleum refinery through a number of systems. Obviously, the refinery is the source of the gasification feedstocks of interest petcoke, heavy oil residuals and refinery waste streams. The products, hydrogen, power and steam, are used throughout the refinery. Hydrogen is used to remove sulfur, nitrogen and other impurities from intermediate and finished product streams. It is also used in hydrocracking operations to convert heavy distillates and oils into lighter products, naphtha, kerosene and diesel. Hydrocracking and severe hydrotreating require high-purity hydrogen (99+%). Less severe hydrotreating can employ lower purity hydrogen (90+%). Refiners have begun to optimize hydrogen use by cascading hydrogen through the refinery. High purity hydrogen is used only where required and lower purity hydrogen purged from these applications is used for services that do not require as high purity hydrogen. Sources of hydrogen within the refinery and their purities are: naphtha reformer (65-90%), high-pressure (severe) hydroprocessing (75-90%), low-pressure hydroprocessing (50-75%) and fluid catalytic cracking (10-20%) [11]. Petroleum refineries require hydrogen to be available 95% of the time. Electric power and high-pressure steam (600+ psi) can be used to drive compressors, blowers, pumps, etc. In general, electric power will be used for small and intermittent loads; however, high-pressure steam can also be used to generate electricity. Natural gas and refinery gases are normally used to generate steam in a separate boiler. High-efficiency refineries employ gas turbine/HRSG systems and also can generate high-pressure steam internally from waste heat available from fired heaters used in many areas of the refinery to preheat reactor and distillation feed streams. The off-gas from the FCCU is often used to raise steam. Medium and low pressure steam is also generated in the cooling of process streams. Steam has a number of other important uses within the refinery, such as process heating, steam tracing, reducing the partial pressure in fractionation systems, and stripping out low-boiling components to stabilize product streams.
Other integration opportunities have been mentioned previously. Oxygen can be used to debottleneck combustion systems throughout the refinery, and nitrogen can be used for purging and blanketing

National Energy Technology Laboratory 06/30/03
18
equipment. The gasification plant and refinery may share a common amine stripper and/or sulfur plant, waste water treatment and cooling water systems.

National Energy Technology Laboratory 06/30/03
19
IV. Methodology A large number of sources were reviewed to compile the information presented here on refinery gasification and supporting technologies. A listing of all of the resources used is provided at the end of the report. Table 4 summarizes the major sources consulted. The methodology used to analyze literature data for these technologies is the same as that previously employed for other refinery technologies [12,13]. To clarify terminology used in the tables presented later in this report, a summary of this methodology follows.
Table 4. Sources of Information on Quench Gasification Process Commercial Projects & Conceptual Designs
Data collected includes process yields, catalyst and chemicals usage, utilities usage, by-product and waste production, plant capacity, capital and operating costs, and product properties. Each data item was characterized based on source, and the data set was then analyzed using simple statistics and engineering judgment to establish the following aggregated values:
Feedstock Products
Frontier OilEl Dorado Kansas Refinery (1996)
170 TPDPetcoke & Refinery Wastes
Power & Steam
Motiva EnterpriseDelaware City Refinery (2001)
2,000 TPDFluid Petcoke
Power & Steam
Farmland IndustriesCoffeyville Kansas Refinery (2000)
1,100 TPDPetcoke
Hydrogen for Ammonia
Citgo/TECO Front-End DesignLake Charles Louisiana IGCC (2001)
5,000 TPDPetcoke
Hydrogen, Power & Steam
Texaco/DOE DesignEarly Entrance Coproduction Plant (2002)
1,235 TPDPetcoke
FT Fuels, Power & Steam
API EnergiaFalconara Italy Refinery (2001)
1,510 TPDVisbreaker Tar
Power & Steam
Texaco Design E. European Refinery (1994)
1,710 TPDAsphalt & Vacuum Residue
Hydrogen & Power
ISABSicily Italy IGCC (2000)
3,170 TPDDeasphalter Pitch Hydrogen, Power & Steam
SarluxSardinia Italy Refinery (2001)
3,300-3,900 TPDVisbreaker Tar
Hydrogen, Power & Steam
Parsons/CalTex Feasibility StudyYosu Korea Refinery (2001)
3,100-5,500 TPDVacuum Residue
Various Combinations ofHydrogen, Power & Steam
Tampa Electric/DOE CCT ProgramPolk Power Station IGCC (1996)
2,200 TPDBituminous Coal
Power
EG&G/DOE Base (Design) CasesTexaco Gasifier Based IGCC (2000)
2,750-3,010 TPDBituminous Coal Power
Bechtel/AMOCO/DOE DesignDirect Liquefaction Baseline (1993)
10,500 TPDBit. Coal & DL Ash Concentrate
Hydrogen, Power & Steam
Dates given in parentheses are either date of start-up for exisitng plants or date of publishing for designs.

National Energy Technology Laboratory 06/30/03
20
Representative - Most probable value, typical of well-run operation by majority of large refiners Average - Mean value for all refinery or merchant units Normal Range - Range of values that would be considered normal, reflecting variations in feed, design, operating conditions and product requirements Worst Practice - Poor operation, possibly the result of system upset Best Practice - What might be theoretically possible under optimal feed and operating conditions. The ‘Worst Practice’ and ‘Best Practice’ categories have not been used in the present analysis, since the application of gasification technology within refineries is a rather new development, and only a relatively small number of plants are currently operational. For this same reason, ‘Average’ and ‘Representative’ are not considered separately. In some cases, a normal range could not be established, and values that appeared inconsistent were omitted from consideration.
Figure 4. Block Flow Diagram for PPM Gasification Models
Process data profiles were developed for two modes of operation for the gasification plant, syngas production (GSF) and hydrogen production (GSH), and for two possible feedstocks, petcoke and heavy oil. An additional profile was developed for a combined heat and power plant (CHP) to be associated with the syngas mode of operation. The sulfur plant was not considered, since this unit is already modeled within the PMM. Also, other applications for syngas are outside the scope of this current project; therefore, FT and methanol synthesis have not been included. Figure 4 shows the block
GSF/GSH
CHP
H2S HH2 NGS
KWH
STM
SGS
KWH STM
FUL
CKH
ASX
Gasification Block(Prep + ASU + Gasifier + Clean-up)
Combined Heat & Power Block(GT + HRSG + ST)
GSF/GSH
CHP
H2S HH2 NGS
KWH
STM
SGS
KWH STM
FUL
CKH
ASX
Gasification Block(Prep + ASU + Gasifier + Clean-up)
Combined Heat & Power Block(GT + HRSG + ST)

National Energy Technology Laboratory 06/30/03
21
flow diagram for the new GSF/GSH and CHP models for the PMM. Referring back to Figure 2, GSF and GSH incorporate Feed Prep, Gasifier, ASU (Air Separation Unit), and Syngas Clean-up. GSH also includes the Hydrogen Plant. The gasifier is assumed to be a quench gasifier. Petcoke requires a slagging operation; whereas, heavy oil does not. Data for the acid gas removal (AGR), syngas clean-up step, and for the ASU were developed separately and then added to GSF/GSH. Only data for the ASU with electricity driven compressors was incorporated in the present profiles. GSF is based on the data for amine-based AGR and GSH is based on the Rectisol process. CHP has two modes of operation. The combined-cycle (CC) mode, which only produces power, includes a gas turbine, heat recovery steam generator and steam turbine. The cogeneration (Cogen) mode includes a gas turbine and heat recovery steam generator, but no steam turbine. All the steam produced from the waste heat in the gas turbine exhaust is exported to the refinery. CHP is also co-fed natural gas in proportion of syngas-to-natural gas of 9 to 1. This is consistent with a plant using natural gas as back-up fuel. By combining the multiple modes of operation for both GSF/GFH and CHP, a wide range of operations can be modeled, maximum hydrogen production to maximum power production to maximum steam production. Thus, the PMM can optimize the operation of these two new refinery units to maximize the profitability of the refinery.

National Energy Technology Laboratory 06/30/03
22
V. Refinery Gasification Technology Profiles Process data for refinery gasification are reported on a per ton basis. This is different than the basis used for other refinery units, which are normally reported on a volume basis. The feedstocks are also reported on a dry basis. The yields of hydrogen and H2S, which are gases, are reported on a 1,000 standard cubic feed per ton basis (M scf/ton). The yield of syngas is reported on a million Btu per ton basis, since it will be burned as a fuel in CHP. Within the PMM, all the gases are reported on a fuel oil equivalent (FOE) basis. That is, the units reported for these gases are FOE bbl (barrels) per ton of feed. The normal operating ranges reported reflect variations in feedstock composition and properties and variations in levels of conversion. Table 5 contains the process data profile for gasification to produce syngas, and Table 6 contains the process data profile for gasification to produce hydrogen. Footnotes common to both tables appear following Table 6. Data consistency relative to gasifier performance has been maintained between the information reported in Tables 5 and 6. A carbon balance has also been maintained across the gasification unit. Steam generation and consumption, power consumption, cooling water circulation, fuel gas consumption, water balance information and catalysts and chemicals usage have been estimated based on individual components of the gasification process. Tables 7 and 8 contain data for the ASU and AGR units. Four separate air separation unit designs are listed in Table 7. Designs 1 and 2 were used to estimate the values reported in Table 5 for the ASU. In Tables 5 and 6, it is assumed that the ASU uses all electric compressor drives and is not integrated with the air compressor in the CHP plant. Three acid gas removal designs are listed in Table 8. Designs 1 and 2 use MDEA, an amine used to selectively remove H2S. Designs 1 and 2 are the basis for the values reported in Table 5. Design 3 is for the Rectisol process, which employs methanol as the solvent. The physical solvents methanol and Selexol are most often employed when the product from gasification is hydrogen. Design 3 is the basis for the values reported in Table 6. Table 9 contains the process profile data for the combined heat and power plant CHP. Power and steam production, efficiencies, and utility consumption are reported for two modes of operation, combined-cycle (CC) and cogeneration (Cogen). The basis is per million Btu of fuel fed, calculated from the lower heating value (LHV) of the fuel. Within the PMM, fuel gas is reported on an FOE basis. Total inside battery limit (ISBL) capital costs for the various components of the refinery gasification plant are reported in Table 10 in a variety of units. All are on a per stream day basis. Capital costs are affected by plant size (economies of scale). The values reported here are for nominal size units and must be adjusted for other sizes using a capital cost scaling exponent. Per stream day capacities can be converted to per calendar day capacities by multiplying by a factor that reflects the fraction of time the unit is operating. To calculate the contribution of the capital cost to operating costs requires the use of a capital charge factor, which is a function of corporate financial practices and current economic conditions. Capital costs must also be adjusted for location and cost escalation. Costs reported in the main tables of this report are for a U.S. Gulf Coast (USGC) location based on year 2000 conditions (year 2000 dollars). Adjustments for inflation were made using the Nelson-Farrar Cost Indexes reported in the Oil & Gas Journal. Table 11 reports the capital costs to be used in the PMM for a

National Energy Technology Laboratory 06/30/03
23
nominal 2,000 tons per calendar day gasification plant. Four cases are given, representing different configurations and levels of operation: one vs. two 50% processing trains and on-stream factors of 0.85 (typical of hydroprocessing plants) and 0.96 (typical of refinery as a whole). For the PMM model, Scenario 2 was selected based on the assumption that two trains would provide a reliable supply of hydrogen even if one gasification train were to be off stream. Operating costs (fixed, variable and total) are expressed on a variety of bases throughout the tables. Total operating costs consist of fixed and variable components. The variable component includes the costs of feedstocks, catalysts and chemicals, utilities, waste disposal or treatment, and any running royalty charges. Variable operating costs can be estimated based on the information contained in the tables (e.g., steam consumption, catalyst usage, etc.), by applying costs to these items. The term ‘Other Variable Costs’ (OVC), unless noted otherwise, is the total variable cost less the costs of feedstocks, steam, electric power and fuel, which are considered separately in the EIA’s PMM refinery model. Fixed operating costs include maintenance, direct and indirect labor, capital charges, and other miscellaneous costs. Only direct operating labor is reported in the tables. The other components of fixed costs are normally factored from operating labor or from total capital cost. Operating labor is reported in Table 12 for single and dual train plants on a dollars per calendar day basis and must be adjusted for location and inflation. The dual train data were used for developing the base models for the PMM. The labor costs reported are for a U.S. Gulf Coast location based on year 2000 conditions. The labor cost was based on estimates of manpower requirements. The number of operators is a function of the number of pieces and types of equipment used in the process and not necessarily of unit capacity. Only a slight increase in operating labor is required for two trains versus one.

National Energy Technology Laboratory 06/30/03
24
Table 5. Quench Gasification Process Profile for Syngas
Representative / Average
Petcokea Heavy Oilb
High-Sulfur Petcoke HHV (dry) M Btu/lb 14.85 - 12.6 15.4LHV (dry) " 14.48 - 13.9 16.1Sulfur Content (dry) ton/ton 0.05 - 0.04 0.07
SDA Pitch Specific Volume bbl/ton - 5.34 <5.7Higher Heating Value (HHV) M Btu/lb - 17.28 <18.6Lower Heating Value (LHV) " - 16.45 <17.6Sulfur Content ton/ton - 0.05 0.04 0.07
Other Feed Streams Oxygen (pure) ton/ton 1.05 1.08 1.04 1.18HP Steamc
M lb/ton 0 0.225
Process Efficienciesd
Cold Gas (HHV) Btu/Btu 75.4% 78.2% <87%Cold Gas + Net Steam (HHV) " 88.8% 92.8% <95%Syngas HHV Btu/scf 261 293 259 307Syngas LHV " 244 270 242 283
Process YieldsClean Syngas (LHV) MM Btu/ton 20.9 25.0 <28Acid Gase (pure H2S) M scf/ton 1.18 1.18 >0.94 <1.65Waste Gas (pure CO2) " 0 0Slag / Metal Cakef
ton/ton 0.022 0.0028 <0.044Steam Generation
HP Steam M lb/ton 0 0MP Steam " 3.91 4.86LP Steam " 1.58 1.97
Steam ConsumptionAir Separation Unit M lb/ton 0 0 <2.34Acid Gas Removal " 1.03 1.11 0.54 1.63Total Steam Consumed M lb/ton 1.03 1.11 0.54 3.97
Power ConsumptionAir Separation Unit kWh/ton 480 493 0.5 616Gasification " 26 21 14.6 33Acid Gas Removal " 13 14 3.6 25Total Power Consumed kWh/ton 520 528 18.7 674
Cooling Water CirculationAir Separation Unit M gal/ton 0.01 0.01 <10.6Gasification " 4.04 4.04 <6.2Acid Gas Removal " 5.12 5.52 1.8 9.1Total Cooling Water Circulated M gal/ton 9.17 9.57 1.8 25.9
Water BalanceGasification Make-Up Water M lb/ton ~0 ~0AGR Wash Water M lb/ton 0 0Solids Handling Blowdown " 0.175 0.306 <1.04Boiler Blowdowng
" 0.055 0.068Total Waste Water Produced M lb/ton 0.230 0.375
Catalysts & ChemicalsAir Separation Unit $/ton 0 0Gasification " 0.829 0.829Acid Gas Removal " 0.307 0.331Total Cat.& Chem. Consumed $/ton 1.136 1.160
Desing Basis: ISBL - Feed Handling, Gasifier, Slag/Metal Cake Handling, Low Temperature Gas Cooling,
Air Separation Unit (Table 7 - Designs 1&2), Acid Gas Removal (Table 8 - Designs 1&2),
OSBL - Cogeneration, Sulfur Plant, Wastewater Treatment, Utlities.
See Table Notes which follow Table 6 for a descripotion of footnotes.
UnitsNormalRange

National Energy Technology Laboratory 06/30/03
25
Table 6. Quench Gasification Process Profile for Hydrogen
Representative / Average
Petcokea Heavy Oilb
High-Sulfur Petcoke HHV (dry) M Btu/lb 14.85 - 12.6 15.4LHV (dry) " 14.48 - 13.9 16.1Sulfur Content (dry) ton/ton 0.05 - 0.04 0.07
SDA Pitch Specific Volume bbl/ton - 5.34 <5.7HHV M Btu/lb - 17.28 <18.6LHV " - 16.45 <17.6Sulfur Content ton/ton - 0.05 0.04 0.07
Other Feed Streams Oxygen (pure) ton/ton 1.05 1.08 1.04 1.18HP Steamc
M lb/ton 0 0.225Conversion
Raw Syngas M scf/ton 85.73 92.43 >79H2 Concentration mol/mol 32.9% 37.7% 32% 46%CO Concentration " 43.4% 50.8% 35% 53%CO Conversion mol/mol 98% 98%H2 Recovery " 90% 90% <99+%
Process YieldsHydrogenh (pure) M scf/ton 58.16 72.81 <86.6Acid Gase (pure H2S) " 1.18 1.18 >0.94 <1.65Waste Gas (pure CO2) " 47.17 22.77Purge Gasi (260 Btu/lb LHV) MM Btu/ton 1.98 2.47Slag / Metal Cakef ton/ton 0.022 0.0028 <0.044
Steam GenerationHP Steam M lb/ton 0.89 1.11MP Steam " 2.47 3.08LP Steam " 2.72 3.39
Steam ConsumptionAir Separation Unit M lb/ton 0 0 <2.34Hydrogen Purification " 0.54 0.58Total Steam Consumed M lb/ton 0.54 0.58
Power ConsumptionAir Separation Unit kWh/ton 480 493 0.5 616Gasification + Shift " 26 21 14.6 33Hydrogen Purification " 19 21Hydrogen Compression " 144 181Total Power Consumed kWh/ton 526 535
Cooling Water CirculationAir Separation Unit M gal/ton 0.01 0.01 <10.6Gasification + Shift " 6.19 6.19Hydrogen Purification " 3.70 3.99Hydrogen Compression " 2.13 2.67Total Cooling Water Circulated M gal/ton 9.90 10.19
Water BalanceGasification Make-Up Water M lb/ton 1.702 1.404AGR Wash Water M lb/ton 0.156 0.168Solids Handling Blowdown " 0.175 0.306 <1.04Boiler Blowdowng
" 0.061 0.076Total Waste Water Produced M lb/ton 0.391 0.550
Fuel Gas ConsumptionShift Reactor Startup MM Btu/ton 0.069 0.069
Catalysts & ChemicalsAir Separation Unit $/ton 0 0Gasification " 0.829 0.829Soot Extraction Naphtha " 0 0.598 <0.85Water-Gas-Shift Catalyst " 0.719 0.719 0.45 0.99Hydrogen Purification " 0.014 0.015Total Cat.& Chem. Consumed $/ton 1.562 2.161
Desing Basis: ISBL - Feed Handling, Gasifier, Slag/Metal Cake Handling, Low Temperature Gas Cooling,
CO Shift, Hydrogen Purification (PSA), Acid Gas Removal (Table 8 - Design 3 Rectisol),
Air Separation Unit (Table - Designs 1&2),
OSBL - Cogeneration, Sulfur Plant, Wastewater Treatment, Utlities.
See Table Notes which follow Table 6 for a descripotion of footnotes.
UnitsNormalRange

National Energy Technology Laboratory 06/30/03
26
Footnotes for Tables 5 & 6
Table 7. Cryogenic Air Separation Unit Profiles
Unitsa Design 1 Design 2 Design 3a Design 3bb Design 4Process - LP Cryo LP Cryo LP Cryo LP Cryo MP Cryo
Oxygen Purity vol/vol 99.5% 99.5% 99.5% 95.0% 95.0%Back-Up - LOX/LIN N/A LOX/GOX LOX/GOX NoneIntegration w/GT Extraction Air - No No No No 25% from GTBooster Compressors - GOX N/A GOX GOX GOX/GANCompressor Drives - electric electric steam steam electric/steamUnit Availibity - N/A N/A N/A N/A 98.6%
Utilities Power Consumed kWh/ton 430 481 0.571 0.524 523HP Steam Consumed M lb/ton 0 0 3.136 2.877 0MP Steam Consumed " 0 0 0.023 0.021 0.043LP Steam Consumed " 0 0 0 0 0.149LP Steam Produced M lb/ton 0 0 1.170 1.073 0Condensate Produced M lb/ton 0 0 1.989 1.824 0.192Cooling Water Circulation M gal/ton 0 0.0081 5.114 4.691 9.051
ISBL Capital Costsc
Capacity TPD 2000 2000 2000 2000 2000Specific Investment $M/TPD 28.12 17.88 23.58 21.65 20.94Scaling Exponent - 0.7028 N/A 0.70 N/A N/A
LaborOperators/Day (single train) - 4 N/A 4 4 4
N/A - Not Available, GOX - Gaseous Oxygen, GAN - Gas. Nitrogen, GOX - Liquid Oxygen, LIN - Liq. Notrogen.
aPer Ton (2000 lb) of Oxygen (pure).
bDesigns 3a and 3b differ in that 3a requires additional argon column to achieve higher oxygen purity.
cCost Basis: year 2000 USGC location.
N/A - Not Available. Dash '-' Not Applicable.
Units: 1 bbl = 42 gal (60oF, ideal liq. solution); 1 bbl = 6.05 MM Btu fuel-oil-equiv. (foe, solid or ideal gas, 60oF, 1 atm, dry-basis);
1 ton = 2000 lb (dry basis); 1 lb mol = 379 scf syngas (60
oF, 1 atm, dry-basis, ideal gas).
aHigh-Sulfur Petcoke defined as uncalcined ("green") coke with greater than 4% sulfur.
bHeavy oil residues derived from petroleum processing - Vacuum Reduced Crude, Visbreaker Tar,
Solvent Deasphalter (SDA) Pitch or similar.
cSteam addition used to moderate gasifier temperature and to control syngas composition.
dCold Gas Efficiency = (HHV of Syngas) / (HHV of Feed)
Clean Gas + Net Steam Efficiency = (HHV of Syngas + LH Vap of Steam(out) - LH Vap of Steam(in)) / (HHV of Feed)
eAssumes 99.8% Sulfur removal efficiency.
fPetcoke produces by-product slag from ash in feed and fluxing additive,
Heavy oils produce by-product metal cake containing trace metals found in feed.g
Assumes 1% of steam condensate consumption.h
Maximum value assumes total recycle of purge gas.iPurge gas is produced in hydrogen purification step.

National Energy Technology Laboratory 06/30/03
27
Table 8. Acid Gas Removal Unit Profiles
Unitsa Design 1 Design 2 Design 3Process - Amine Amine RectisolH2S Removal Efficiency vol/vol 99.9+% 99.7% 99.9+%H2S Purity " 41.7% 41.3% 28.5%CO2 Recovery " No 84.3% 94.9%CO2 Purity " - N/A 89.9%Unit Availibity - N/A 99.9% N/A
Utilities Power Consumed kWh/M scf 0.041 0.272 0.227MP Steam Consumed M lb/M scf 0 0.0002 0.0019LP Steam Consumed " 0.0063 0.0175 0.0043Wash Water Consumed " 0 0 0.0018Cooling Water Circulation M gal/M scf 0.0214 0.0981 0.0432Stripping Nitrogen M scf/M scf 0 0.244 0.053
ISBL Capital Costsb
Syngas Capacity MM SCFD 100 100 N/ASpecific Investment $M/SCFD 208 242 N/AScaling Exponent - 0.74 N/A N/A
Catalyst & ChemicalsSolvent + Activated Carbon $/M scf N/A 0.0036 0.00016
LaborOperators/Day (single train) - 6.3 4 N/A
N/A - Not Available.a Per 1000 scf of raw syngas feed.b
Cost Basis: year 2000 USGC location.
Table 9. Combined Heat and Power Process Profile
Representative / AverageCC mode Cogen mode
Gas Turbine Net Power (LHV) kWh/MM Btu 120.2 120.2GT Efficiency (LHV) - 41.0% 41.0% 38% 47%
HRSGGT Exhaust Heat Recovery MM Btu/MM Btu 0.461 0.461Steam (1000 Btu/lb) M lb/MM Btu 0.461 0.461GT + HRSG Efficiency (LHV) - 87.1% 87.1%
Steam TurbineNet Power kWh/MM Btu 44.6 -Steam Cycle Efficiency - 33.0% - 28% 35%
UtilitiesBlowdown/Waste Water M lb/MM Btu 0.00461 0.00461CW Circulation - Condenser M gal/MM Btu 0.0041 0CW Circulation - Mech.Equip. " 0.0001 0.0001Misc. Power Consumed CHP kWh/MM Btu 0.8 0.8CC Efficiency (LHV) - 55.9% 86.8%
ISBL Capital Costsb
Net Power Output MW 94.3 - 89 420Specific Investment $/kW 540 - 390 658Scaling Exponent - 0.70 -
N/A - Not Available. Dash '-' Not Applicable.
CHP - Combined Heat & Power, CC - Combined Cycle, GT - Gas Turbine, HRSG - Heat Recovery Steam Generator, ST - Steam Turbine.a Per million Btu (LHV) of fuel fed to GT.b Cost Basis: year 2000 USGC location.
Unitsa NormalRange

National Energy Technology Laboratory 06/30/03
28
Table 10. ISBL Capital Costs for Gasification Components
BaseCapacity
Units Represemtative Unitsa Scaling
Exp.
Air Separation Unit 2000 TPD O2 23.00 $M/TPD 17.88 28.12 0.70Gasification 2000 TPD feed 34.12 $M/TPD >20.59 0.76Acid Gas Removal 100 MM SCFD Syngas 224.6 $/M SCFD 0.74WGS Reactors 100 MM SCFD Syngas +167.4 $/M SCFD 0.65Hydrogen Purification - PSA 100 MM SCFD H2 +47.75 $/M SCFD 0.55GT + HRSG + ST 100 MW +530.5 $/kW 377 1012 0.70
aIn-Side Battery Limits Investment, U.S. Gulf Coast, 2000.
Normal Range
Table 11. Total Capital Cost for Refinery Gasification
Table 12. Direct Operating Labor for Refinery Gasification
Single Train Two TrainsOperating Staff $ / CD Operating Staff $ / CD
Air Separation Unit 4 744 5 850Gasification 12 2142 14 2448Acid Gas Removal 4 625 5 714Total for Gasification Block 20 3510 23 4012Hydrogen Production Option 6 1116 7 1275Power Production Option 4 744 5 850
Units Case 1 Case 2 Case 3 Case 4Calander Day Feed Capacity TPD 2000 2000 2000 2000On-Stream Factora - 0.85 0.96 0.85 0.96Number of Trains - 2 2 1 1Single-Train Stream-Day CapacitiesFeed Capacity TPD 1176 1042 2353 2083Oxygen Requirement " 1274 1128 2547 2255Syngas Production MM SCFD 109 96 217 193Hydrogen Production Option MM SCFD 86 76 171 152Power Production Option MW 201 178 402 356
Total ISBL Capital Costb
Air Separation Unit $MM 67.08 61.60 54.48 50.03Gasification " 91.19 83.14 77.22 70.39Acid Gas Removal " 47.80 43.69 39.92 36.48Total for Gasification Block $MM 206.07 188.42 171.62 156.91Hydrogen Production Option $MM +44.13 +40.88 +34.17 +31.64Power Production Option $MM +172.82 +158.71 +140.38 +128.91
aOn-stream factors are those used in PMM: 0.85 - major hydroprocessing plants, 0.96 - whole refinery/atmospheric crude unit.
bIn-Side Battery Limits Investment, U.S. Gulf Coast, 2000.
Baseline Improved Reliability

National Energy Technology Laboratory 06/30/03
29
VI. Data Comparisons It is difficult to make an overall direct comparison of the information presented here with that found in other sources. Gasification systems designed for refineries have been used to produce varying proportions of hydrogen, power and steam. More often than not, the exact proportions and conditions of these products are not reported. Also, capital costs are not typically reported, and when they are, it is usually as part of the total investment. In order, to get some idea of the accuracy of the information developed here, estimates were made for the performance of Integrated Gasification Combined Cycle (IGCC) power generation with petcoke and with heavy oil. This simplifies the comparison, since only power is produced, and more information is available in the literature for this application versus the others. However, several simplifying assumptions were necessary to adjust the data to reflect stand-alone IGCC versus in-refinery operations. As developed in the profiles given here, steam generated by syngas cooling is exported to the refinery. In IGCC operation this steam is routed to the combined-cycle plant to generate additional power. The amount of additional power generated from this steam has been estimated. In addition, it was necessary to estimate total investment based on ISBL capital costs. A factor of 0.4 was used for the ratio of OSBL to ISBL costs, and an additional factor of 0.1 was used to account for indirect costs of construction. IGCC performance predicted based on the profile data listed in Tables 5 through 12 is given in Table 13 for petcoke and Table 14 for heavy oil. A comparison with literature data is most easily made by examining the overall process efficiency for converting feedstock to power. For petcoke, this efficiency is 38.2% on a higher heating value (HHV) basis and for heavy oil it is 40.2%. The SFA Pacific database of gasification projects gives a range of efficiencies between 38% and 45% [1]. The predicted values are toward the lower end of this range, but appear consistent with the existing refinery-based gasification plants. It should be noted that the quench gasifier can be a few percentage points lower in efficiency than gasifiers employing radiant syngas coolers. It is also evident that efficiencies with heavy oil are normally a few percentage points higher than those with petcoke. EIA currently uses an efficiency of 43% for the coal-based IGCC model contained in the Electricity Marketing Module (EMM) [14]. For reference, DOE R&D goals for IGCC are 51% by 2010 and 60% by 2020. Recent improvements in efficiency can be attributed to, among other things, improvements made to gas turbines. This improvement is evident in Tables 13 and 14 by comparing the net power produced on a kWh/ton basis with the literature reported ranges circa. 1996. This comparison shows a 10 to 15% increase in output. Tables 13 and 14 also report efficiencies for cogeneration with maximum steam product (i.e., no steam turbine). These are 70.1% with petcoke and 73.3% with heavy oil. While a direct comparison cannot be made for the cogeneration mode, the literature reports that cogeneration efficiencies may be as high as 75%. Investment costs for IGCC with petcoke were estimated from the data in Table 11. For a dual train, plant this cost ranges from 1310 to 1540 $/kW and for a single train plant from 1080 to 1240 $/kW. The EMM currently uses a value of 1377 $/kW and the DOE R&D goals are 1034 $/kW by 2010 and 983 $/kW by 2020.

National Energy Technology Laboratory 06/30/03
30
Table 13. Predicted Performance of Petcoke Based IGCC
Representative / AverageCC mode Cogen mode
Power Produced GT Net Power (LHV) kWh/ton 2514 2514ST Net Power (HRSG) " 933 0ST Net Power (SGC) " 431 0Total Power Produced kWh/ton 3879 2514
Power Consumed ASU + Gasifier + AGR kWh/ton 520 520Misc. CHP " 17 17BOP (OSBL @ 0.5% Gross) " 19 13Total Power Consumed kWh/ton 556 550
Net Power Produed range of IGCC circa. 1996
Net Power Produced kWh/ton 3323 1965 2571 3056Steam Balance
Gasifier Production M lb/ton - 5.49HRSG Production " - 9.65ASU + Gasifier + AGR Cons. " - 1.03Net Steam Produced M lb/ton 0 14.11
Plant EfficiencyOverall Efficiency (HHV) - 38.2% 70.1% <75%Overall Efficiency (LHV) - 39.1% 71.9%
a Per Ton (2000 lb) of Petcoke (dry).
Unitsa NormalRange
Table 14. Predicted Performance of Heavy Oil Based IGCC
Representative / AverageCC mode Cogen mode
Power Produced GT Net Power (LHV) kWh/ton 3002 3002ST Net Power (HRSG) " 1114 0ST Net Power (SGC) " 532 0Total Power Produced kWh/ton 4648 3002
Power Consumed ASU + Gasifier + AGR kWh/ton 528 528Misc. CHP " 21 21BOP (OSBL @ 0.05% Gross) " 23 15Total Power Consumed kWh/ton 572 564
Net Power Produed range of IGCC circa. 1996
Net Power Produced kWh/ton 4076 2438 3355 3618Steam Balance
Gasifier Production M lb/ton - 6.83HRSG Production " - 11.52ASU + Gasifier + AGR Cons. " - 1.33Net Steam Produced M lb/ton 0 17.02
Plant EfficiencyOverall Efficiency (HHV) - 40.2% 73.3% <75%Overall Efficiency (LHV) - 42.3% 77.0%
a Per Ton (2000 lb) of Heavy Oil (dry).
Unitsa NormalRange

National Energy Technology Laboratory 06/30/03
31
VII. Recommendations & Conclusions The information contained in Tables 5 -12 was used to generate the following tables for implementation in the Petroleum Marketing Module (PMM) within NEMS: GSF/GSH – In-refinery gasification-to-syngas and gasification-to-hydrogen plants
CHP – Combined heat and power plant The ‘Representative/Average’ data reported in Tables 4, 6 and 9 are the values used for GSF/GSH and CHP in the aggregate PMM model of the U.S. refining industry. Appendix A contains listings of GSF/GSH and CHP in PMM format. The PMM uses a reduced data set to describe refinery operations. Much of the information needed to determine operating costs is lumped into the quantity referred to as OVC - Other Variable Costs, which includes the cost of catalysts, chemicals, cooling water, waste water treatment, etc. The information developed in this report has been kept separate and can be used to calculate OVC. Normal operating ranges can be considered for more in-depth analyses and sensitivity studies. Since including gasification in the PMM will change the results of past simulations, care should be taken when updating the model. It would be worthwhile to perform a series of validation runs both with and without refinery gasification to determine the magnitude of these differences. The following sensitivity cases would be useful for testing the new models:
1. Petcoke vs. Heavy Oil feedstock 2. Power and Steam vs. Hydrogen, Power and Steam production 3. Effects of unit reliability and sparing: Cases 1-4 of Table 11. 4. Benefits of the elimination of landfill disposal of petcoke, avoided emissions of
criteria pollutants, disposal of refinery hazardous wastes and the availability of air products for refinery applications
The items listed in 4 are difficult to assess with the PMM; however, they could be studied by applying economic credits to OVC. Rough estimates for some of these benefits were given in Section II of this report. It would also be extremely beneficial to assess the impact that future R&D might have on refinery gasification technologies. This would involve developing new data reflecting anticipated improvements in performance and cost of gasification and combined heat and power generation. However, it must be kept in mind that the PMM forecast only projects aggregate regional conditions, which could over- or under-estimate the market penetration potential of gasification technology. In conclusion, the information provided in this report should be very useful to the EIA in extending the capabilities of the PMM model and improving the quality of EIA’s Annual Energy Outlook forecasts. It is of equal importance to NETL, providing a new capability

National Energy Technology Laboratory 06/30/03
32
which may be used in future analyses for assessing the benefits of targeted R&D programs in gasification and in power and hydrogen generation.

National Energy Technology Laboratory 06/30/03
33
References
1. SFA Pacific Gasification Database, available at www.netl.doe.gov (1999)
2. Multiple sources, courtesy Pace Consultants.
3. “Worldwide refining capacity,” Oil & Gas J., 12/23/02.
4. Petroleum Supply Annual, Vol. 1, Energy Information Administration, June, 2002.
5. Swain, E.J., “Coke, sulfur recovery from U.S. refineries continues to increase,” Oil & Gas J., pp.33-39, 5/2/95.
6. DelGrego, G., “Experience with Low Value Feed Gasification at the El Dorado, Kansas Refinery,” 1999 Gasification Technologies Conference, San Francisco, CA, 10/17-20/99.
7. Gray, D.; Tomlinson, G., Potential of Gasification in the U.S. Refining Industry, DOE Contraci No. DE-AC22-95PC955054, June 2002.
8. Shore, J.; Hackworth, J., “Effects of Feed Quality and Product Specification Changes on Refined Product Supply,” NPRA Annual Meeting, March 23-25, 2003 Paper No. AM-03-09.
9. Wallace, P.S.; Anderson, M.K.; Rodarte, A.I.; Preston, W.E., “Heavy Oil Upgrading by the Separation and Gasification of Asphaltenes,” 1998 Gasification Technologies Conference, San Francisco, CA, 10/98.
10. Kwon, S.-H.; Shin, J.-W.; Heaven, D.L.; Condorelli, P., "Hydrogen production alternatives in an IGCC plant", Hydrocarbon Processing, pp.73-76, 4/99.
11. Abrado, J.M.; Khurana, V., "Hydrogen technologies to meet refiners' future needs," Hydrocarbon Processing, pp.43-23, 2/95.
12. Marano, J.J., “Refinery Technology Profiles – ALKYLATION,” DOE Contract No. DE-AM26-99FT40575, 9/02.
13. Marano, J.J., “Refinery Technology Profiles – ISOOCTANE/ISOOCTENE and Related Technologies,” DOE Contract No. DE-AM26-99FT40465, 1/03.
14. Shaffer, F.; Chan, M., Forecasting The Benefits of DOE Programs for Advanced Fossil-Fuel Electricity Generating Technologies: The EIA High Fossil Electricity Technology Case, NETL Office of Systems and Policy Support, Oct., 2002.

National Energy Technology Laboratory 06/30/03
34
Data Resources Hydrocarbon Processing , Refining 1984, 1992, 1994, 1998, 2000.Hydrocarbon Processing , Petrochemical Processes 1993, 1995, 1997, 1999, 2001.Hydrocarbon Processing , Gas Processes 1984, 1988, 1994, 1998, 2000, 2002.
Handbook of Petroleum Refining Processes, 2nd-Ed. , Robert A. Meyers (editor), McGraw-Hill, New York NY (1997).Petroleum Marketing Module Database contained in U.S. DOE EIA National Energy Modeling System (NEMS), circa. 2002.Electricity Marketing Module Database contained in U.S. DOE EIA National Energy Modeling System (NEMS), circa. 2002.Baseline Des./Econ. for Adv. Fischer-Tropsch Tech. , Topical Report Vol. I, Bechtel/AMOCO, DE-AC22-91PC90027, 10/94.
Direct Coal Liquefaction Baseline Design And System Analysis , Various Reports, Bechtel/AMOCO, DE-AC22-90PC89857, 4/93.Early Entrance Coproduction Plant, Phase 1 Preliminary Concept Report , Tecaco, DE-FC26-99FT40658, 5/01.Petroleum Refining, 3rd Ed. , by James H. Gary & Glenn E. Handwerk, Marcel Dekker, New York NY (1994).Steam, 40th Ed. , Babcock & Wilcox.
www.saras.it/4inglese/nuove_realizzazioni/Gassintesidx.htm , circa. 3/03.www.power-technology.com/projects/sarlux/specs.html , circa. 3/03.www.power-technology.com/projects/isab/specs.html , circa. 3/03.www.airliquide.com/en/business/industry/oil_gas/applications/fccu.asp , circa. 3/03.www.airliquide.com/en/business/industry/oil_gas/applications/gasification.asp , circa. 3/03.
Heaven, D.L., "Gasification converts a variety of problem feedstocks", OGJ , pp.49-54, 5/27/96.Kwon, S.-H.; Shin,J.-W.; Heaven, D.L.; Condorelli, P., "Hydrogen production alternatives in an IGCC plant", HCP , pp.73-76, 4/99.Patel, N.M.; Davis, R.A.; Eaton, A., Carlson, D.L.; Kessler, F.; Khurana, V., "'Across-the-fence' hydrogen plant starts up at California refinery", OGJ , pp.54-61, 10/3/94.Johansen, T.; Raghuraman, K.S.; Hackett, L.A., "Trends in hydrogen plant design", HCP , unknown.Farina, G.L.; Fontana, M., "Cogeneration refinery for total residue destruction", HCP , pp.52-56, 11/93.Swain, E.J., "Coke, sulfur recovery from U.S. refineries continues to increase", OGJ , pp.33-39, 1/2/95.Ramprasad, R.; Vakil, T.; Falsetti, J.; Islam, M., "Competiveness of Gasification at the Bulwer Island, Australia refinery", 1999 Gasification Technologies Conference, San Francisco, CA 12/17-20/99.Shelton, W.; Lyons, J., Texaco Gasifier IGCC Base Cases , FETC PED-IGCC-98-001 (Revision 1), 9/23/99.Dharmadhikari, S., "Consider trigeneration techniques for process plants", HCP , pp.91-100, 7/97.Johnson, J., "A Jolt for Cogeneration", C&EN , pp.33-38, 7/9/01.Falsetti, J.S.; Weissman, R.; Todd, D.M.; "India Offers Ideal Fit For Refinery-Generated Electricity", OGJ , pp.31-35, 5/25/98."Economic Viability and Outlook of IGCC from a Gas Turbine Manufacturer Perspective", 2001 Gasification Technologies Conference , Oct.7-1, 2001.DelGrego, G., "Experience with Low Value feed Gasification at the El Dorado, Kansas Refinery", 1999 Gasification Technologies Conference , Oct.17-20, 1999.Rhodes, A., "Kansas refinery starts up coke gasification unit", OGJ , pp.31-36, 8/5/96.
Gray, A; Tomlinson, G., Potential of Gasification in the U.S. refining Industry, DOE Contracr No. DE-AC22-95PC955054, June, 2000.Marzin, R.; Pereira, P.; McGrath, M.J.; Feintuch, H.M.; Thompson, G.; Houde, E., "New residue process increases conversion, produces stable residu in Curacao refinery," OGJ , pp. 79-86, 11/2/98.Cortes, J.C., "Puertollano IGCC: Operation Status," 1999 Gasification Technologies Conference, Oct.12-20, 1999.Proceedings of The 4th Biomass Conference of The Americas , vol.2, p.1351.Conficential Peer Review, The Energy Journal , 1999.Haggin, J., "Hydrogen process is kinder to environment", C&EN , p.29, 5/13/91.Philcox, J.; Fenner, G.W., "A Texas project illustrates the benefits of integrated gasification", OGJ , pp.41-46, 7/14/97.Niemann, K.; Wenzel, F., "The VEBA-COMBI-CRACKING-Technology: An update", Fuel Process Technology, 35 , pp.1-20, 1993.Marrufo, F.; Sarmiento, W., "Orimulsion an alternative source of energy", Proc. of 22nd Int. tech. Conf. On Coal Util. & Fuel Syst. , pp.13-24, 1997.Ramprasad, R.; Vakil, T.; Falsetti, J.; Islam, M., "Competitiveness of Gasification at the Bulwer Island, Australia Refinery," 1999 Gasification Technologies Conference, Oct.12-20, 1999.Wiltsire, J., "Refining - the new era," the chemical engineer , pp.20-23, 3/12/98.Abrado, J.M.; Khurana, V., "Hydrogen technologies to meet refiners' future needs," HCP , pp.43-23, 2/95.Patel, N.M.; Davis, R.A.; Eaton, E.; Carlson, D.L.; Kessler, F.; Khurana, V., "'Across-the-fence' hydrogen plant starts up at California refinery", OGJ , pp.54-61, 10/3/94.Gardner, J., "Cogeneration (hydrogen & electric power) using the Texaco Gasification Power Systems (TGPS) technology", Petrole et Techniques n o 390 , Sept./Oct., 1994.

National Energy Technology Laboratory 06/30/03
35
Narula, R.G., "Challenges and Economics of Using Petroleum Coke for Power Generation", 17th World Energy Conf., Houston, TX , Sept., 1998.Miller, G.Q., Stoecker, J., "Selection of a Hydrogen Separation Process", 1989 NPRA Annual Meeting, San Francisco, CA , March 19-21, 1989.Wang, S.I.; Nicholas, D.M.; DiMartino, "Analysis dictates H2 purification process", OGJ, pp.111-117, 2/6/84.Rhodes, A.K., "Dutch refinery nears completion of major renovation", OGJ, pp.60-67, 3/17/97.Marruffo, F.; Chirinos, M.L.; Sariento, W; Hernandez-Carstens, S.A., "Orimulsion A Clean and Abundant Energy Source", 17th World Energy Conf., Houston, TX , Sept., 1998."Texaco Gasification Process," SITE Technology Capsule , EPA 540/R-94/514a, April, 1995.Klett, M.; Rutkowski, M.D.; Rosenblatt, I.L.,"Deleware City Refinery Repowering Project," 1999 Gasification Technologies Conference, Oct.12-20, 1999.Wang, S.I.; Nic"Italian IGCC plant almost complete", OGJ, p.64, 2/8/99.Gillis, D.B.; Van Tine, F., "What's New in Solvent Deasphalting? UOP & Foster Wheeler Team Up in Solvent Deasphalting", FW Heavy Oils Conference, June 1989.HRI Marketing Brochure, "H-Oil A Unique Hydrocracking Process", circa 1990.Shrader, C.; Shah, L., "Texaco Gasification and Fischer-Tropsch (TGFT) Process", 17th Annual International Pittsburgh Coal Conference, Pittsburgh, PA, Sept.11-15, 2000.Del Bravo, R.; Starace, F.; Chellini, I.M.; Chiantore, P.V., "Italian IGCC project sets pace for new refining era", OGJ, pp.43-51, 12/9/96.Hawley, R.F.,"Motiva Enterprises LLC Deleware City Refinery Repowering Project, Overview and Project Status" 2000 Gasification Technologies Conference, Oct.9-11, 2000.Higman C.; bajohr, S.; Reimert, R., "Gasify POX Soot for Reduced Costs", 19th Annual International Pittsburgh Coal Conference, Pittsburgh, PA , Oct. 10, 2002."Tampa Electric Integrated Gasification Combined-Cycle Project-An Update," CCT Topical Report 19, DOE NETL, July 2000."CITGO Lake Charles IGCC Project Update," 2001 Gasification Technologies Conference, Oct., 2001.Ahn, Y.; Ryu, H.; Kwak, I.S., "Status of Korea Projects with Emphasis on The Yosu Refinery IGCC Project", ?? Annual International Pittsburgh Coal Conference, Pittsburgh, PA .Breckenridge, W.; Holiday, A.; Ong, J.O-Y, Sharp, C., "Use of SELEXOL Process in Coke Gasification to Ammonia Project", Laurance Reid Gas Conditioning Conference, The University of Oklahoma, Norman OK, 2/27-3/1/00.Collodi, G; Jones, R.M., "The Sarlux IGCC Project An Outline of The Construction and Commisssioning Activities" 1999 Gasification Technologies Conference, Oct.17-20, 1999.Kubek, D.J.; Sharp, C.R.; Kuper, D.E.; Clark, M.E.; Di Dio, M.; Whysall, M., "Recent Selexol, PolySep and PolyBed Operating Experience with Gasification for Power and Hydrogen" 2002 Gasification Technologies Conference, Oct.27-30, 2002.

National Energy Technology Laboratory 06/30/03
36
- APPENDIX A -
PMM Input Tables for GSF/GSH and CHP
* TABLE GSF: GASIFICATION PLANT - DEVELOPMENT VERSION * SGS PRODUCTION * TABLE GSH: GASIFICATION PLANT - DEVELOPMENT VERSION * H2 PRODUCTION * PRODUCES: MEDIUM BTU SYNGAS AND/OR HIGH-PURITY HYDROGEN * BASIS: TEXACO QUENCH GASIFICATION PROCESS * INCLUDES: FEED PREPARATION, AIR SEPARATION UNIT, GASIFIER, * SLAG/SOOT HANDLING, WATER-GAS-SHIFT (IF REQUIRED), * GAS COOLING, ACID GAS REMOVAL * DOE/NETL Report Contract No. DE-AM26-99FT40465, 6/03 * CREATED: 05/03/03 - JJM/NETL * * removed: AS1 col - em4 5-12-03 test * if added back, need to uncomment code in * subroutine PMM_COKGSF in refine.f DATA T:GSF ** CK1 AS1 CAP 1 1 CKH -1 -5.34 SGS 3.46 4.13 H2S 0.11 0.11 LOS 1.43 1.10 KWH -520 -528 STM 4460 5497 OVC -1.83 -1.97 * DATA Z:GSF ** TEXT(4) CAP 'BASIS: 1 SHORT TON MF FEED ' CKH 'HI SULFUR PETCOKE (MF-STONS) ' ASX 'SOLVENT DEASPHALTER PITCH (BBL)' SGS 'SYNGAS (FOE BBL) ' H2S 'H2S (FOE BBL) ' LOS 'VOLUME LOSS ' KWH 'ELECTRICITY (KWH) ' STM 'NET STEAM (LBS) ' OVC 'OTHER VARIABLE COSTS, $ ' * * removed: AS2 col - em4 5-12-03 test * if added back, need to uncomment code in * subroutine PMM_COKGSF in refine.f DATA T:GSH ** CK2 AS2 CAP 1 1 CKH -1 -5.34 SGS 0.33 0.41

National Energy Technology Laboratory 06/30/03
37
HH2 2.63 3.29 H2S 0.11 0.11 LOS 1.93 1.52 KWH -526 -535 STM 5546 6767 FUL -0.011 -0.011 OVC -2.42 -3.12 * DATA Z:GSH ** TEXT(4) CAP 'BASIS: 1 SHORT TON MF FEED ' CKH 'HI SULFUR PETCOKE (MF-STONS) ' ASX 'SOLVENT DEASPHALTER PITCH (BBL)' SGS 'SYNGAS (FOE BBL) ' HH2 'HYDROGEN (FOE BBL) ' H2S 'H2S (FOE BBL) ' LOS 'VOLUME LOSS ' KWH 'ELECTRICITY (KWH) ' STM 'NET STEAM (LBS) ' FUL 'FUEL (FOE BBL) ' OVC 'OTHER VARIABLE COSTS, $ ' * * * TABLE CHP: COMBINED HEAT & POWER PLANT - DEVELOPMENT VERSION * PRODUCES: POWER AND/OR STEAM FOR REFINERY OR SALE * DOE/NETL Report Contract No. DE-AM26-99FT40465, 6/03 * CREATED: 05/03/03 - JJM/NETL * NOTE: Combined NGS and SGS fuels as .1/.9 splits, em4 * * * FUEL BASIS: (check investment data in rfinvest.txt) DATA T:CHP ** CC1 CO1 CAP 1 1 SGS -0.9 -0.9 NGS -0.1 -0.1 KWH 992 722 STM 0 2790 OVC -0.095 -0.094 * DATA Z:CHP ** TEXT(4) CAP 'BASIS: 1 FOE BBL ' SGS 'SYNGAS (FOE BBL) ' NGS 'NATURAL GAS (FOE BBL) ' KWH 'ELECTRICITY (KWH) ' STM 'STEAM (LBS) ' OVC 'OTHER VARIABLE COSTS, $ ' *

National Energy Technology Laboratory 06/30/03
38
- APPENDIX B -
Gasifcation Markets Summary

Gasification/IGCC Market OpportunityCoal-Based Power Industry
Growth Replacement Total
Expected Total CoalGenerating Capacity(GWe)
25 50 75
IGCC Opportunity@ 50% Penetration(GWe)
12.5 25 37.5
No. of Single-TrainIGCC Plants(@ 250 MWe each)
50 100 150

Refinery Petcoke GasificationMarket Opportunity
• Existing Projects− 5 projects in US with 787 MWe equivalent (includes non-power)
• Projects Currently in Planning− 4 projects in US with 3324 MWe
• Opportunity for 2010 in top 40 refineries*− 40 refineries with petcoke production > 1000 tpd− Good payback: NG price > $3.80/MMBTU & WOP > $23/BBL − Potential products
• H2 : 2000 MMSCFD = 45% of internal need of 4450, plus• Power: 7.1 GWe = 100% of internal need of 4.1 GWe plus
3.0 GWe of export power
* Based on Mitretek 2000 study of petcoke gasification for NETL

Cumulative Worldwide GasificationCapacity and Growth
0
10000
20000
30000
40000
50000
60000
70000
1970
1972
1974
1976
1978
1980
1982
1984
1986
1988
1990
1992
1994
1996
1998
2000
2002
2004
2006
Planned
Real
MWth Syngas
* Based on 2001 Gasification Worldwide Database by SFA Pacific for NETL
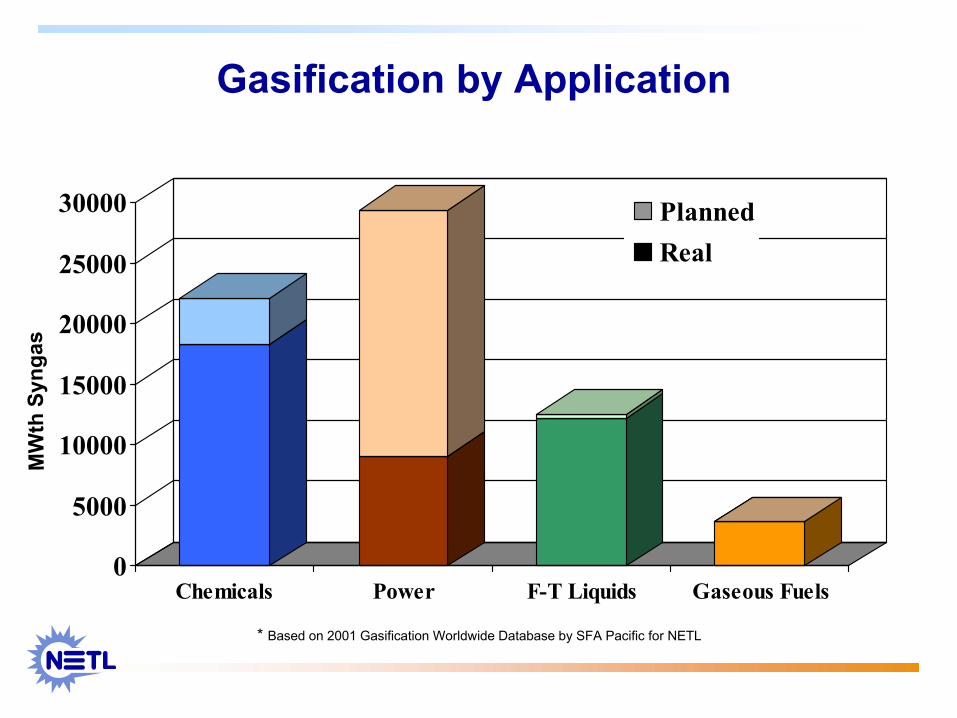
Gasification by Application
0
5000
10000
15000
20000
25000
30000
Chemicals Power F-T Liquids Gaseous Fuels
PlannedReal
MW
thSy
ngas
* Based on 2001 Gasification Worldwide Database by SFA Pacific for NETL

Gasification by Primary Feed
0
5000
10000
15000
20000
25000
30000
35000
Coal Petroleum Petcoke Gas Biomass orSolid Waste
PlannedReal
MW
thSy
ngas
* Based on 2001 Gasification Worldwide Database by SFA Pacific for NETL

Existing Gasification Plants Worldwide *Petcoke Petroleum
No. Projects 5 60
No. Gasifiers
Gasifier Technology
Equiv. MWe
Start Yrs - 1961-1990 - 1990-1999 - 2000-2001
Product
Key Locations US (In 1990-2000s)
6
Texaco (4)E-Gas (1)
787
122
3 Power2 Steam
1 CO1 Ammonia
Global, W. Terra Haute, INFrontier, El Dorado, KS
Farmland, Coffeyville, KSMotiva, Delaware City, DE
142
Texaco (34)Shell (25)Other (1)
9,231
401010
2 Power<2000;5 Power>2000
All the Rest: NH3, MeOH,Chemicals, Steam, H2
Exxon-Mobil, Baytown, TX
* Based on 2001 Gasification Worldwide Database by SFA Pacific for NETL

Planned Petroleum Waste Gasification Plants *
GasifierPlant Name Start
Year MWEq Number Technology Feed Class ProductCategory
AGIP Raffinazione, Italy 2003 249 2 Shell VisbreakerResidue Power, H2
AGIP Raffinazione, Italy 2005 224 2 Texaco VisbreakerResidue Power
Petronor (Repsol-YPF) /Iberdrola (PIEMSA), Spain 2005 903 2 Texaco Vacuum
Residue Power, H2
IGCC Normandie, France 2005 567 3 Texaco Fuel Oil Power, H2,Steam
Rafineria Gdanska, Poland 2005 271 2 Texaco VisbreakerResidue
Power, H2,Steam
Unspecified, Europe 2005 261 2 Shell Residue Power
Beijing Coking 2006 157 1 Texaco Fuel Oil Methanol
* Based on 2001 Gasification Worldwide Database by SFA Pacific for NETL

Planned U.S. Petcoke-Based Gasification Plants *
GasifierPlant Name Project
StatusStartYear MWEq Number Technology
FeedClass
ProductCategory
Eagle Energy(TECOPower/Texaco)Polk CountyGasification Plant, FL
Planning 2005 747 2 Texaco Petcoke Power
Port of PortAurthur/Sabine PowerPort Arthur GCCProject, TX
Planning 2005 1,109 3 E-GAS(Destec/Dow) Petcoke Power
TECO PowerServices/Citgo/TexacoLake Charles IGCCProject, LA
Planning 2005 768 2 Texaco Petcoke Power
Shell Deer ParkRefining, GCC Plant,TX
Planning 2006 700 2 Texaco Petcoke Power
* Based on 2001 Gasification Worldwide Database by SFA Pacific for NETL