refining & marketing: eyeing new horizons · refining & marketing: eyeing new horizons...
TRANSCRIPT

1
AMONG THE VARIOUS players in the O&G value chain, petroleum refineries have been the biggest beneficiary of the lower-for-
longer oil price environment—which has widened their crack spreads and renewed investors’ interest
in the business. In fact, the market capitalization share of pure-play refiners has nearly doubled to 12 percent in the overall industry’s market capitalization over the past five years, breaking the
Refining & marketing: Eyeing new horizons Anshu Mittal, Bala Vijayan Venkateshwaran, and Deepak Vasantlal Shah
Although many industry pundits have provided piecemeal perspectives across the phases of the downturn and recovery, a consolidated analysis of the past five years and a complete perspective covering the entire O&G value chain could help stakeholders—from executive to investor—make informed decisions for the uncertain future.
With this in mind, Deloitte analyzed 843 listed O&G companies worldwide with a revenue of more than US$50 million across the four O&G segments (upstream, oilfield services, midstream, and refining & marketing) in an effort to gain both a deeper and broader understanding of the industry. The ensuing research yielded a six-part series, Decoding the O&G downturn, which sets out to provide a big-picture reflection of the downturn and share our perspectives for consideration on the future.
In part five of the series, we explore the downstream segment—assessing its fortunes during the oil price downturn, identifying possible reasons behind its strong performance, analyzing changes in the segment, and reflecting on the trends that will likely decipher the segment’s oeuvre in the years ahead.
Refining & marketing: Eyeing new horizons
longstanding perception of it being a “disadvan-taged” O&G business.
As always, a big change in a segment’s outlook typically has many facets, both implicit and ex-plicit, which have the potential to take industry watchers and even seasoned analysts by surprise. Did all pure-play refiners perform equally or was it a mixed bag? What fueled the interest of investors in a region—margins or growth prospects? How do the segment’s stakeholders view the future? Having answers to these questions can be important to have an informed view about the future.
The dark horse comes through ...
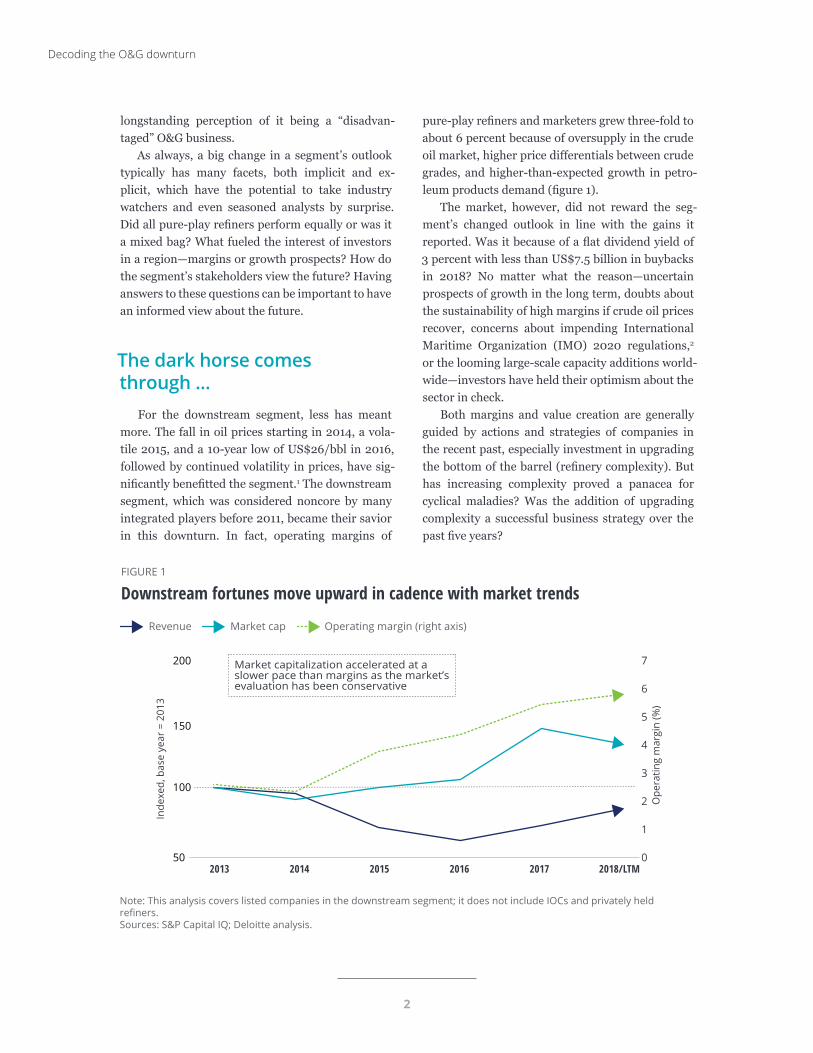
For the downstream segment, less has meant more. The fall in oil prices starting in 2014, a vola-tile 2015, and a 10-year low of US$26/bbl in 2016, followed by continued volatility in prices, have sig-nificantly benefitted the segment.1 The downstream segment, which was considered noncore by many integrated players before 2011, became their savior in this downturn. In fact, operating margins of
pure-play refiners and marketers grew three-fold to about 6 percent because of oversupply in the crude oil market, higher price differentials between crude grades, and higher-than-expected growth in petro-leum products demand (figure 1).
The market, however, did not reward the seg-ment’s changed outlook in line with the gains it reported. Was it because of a flat dividend yield of 3 percent with less than US$7.5 billion in buybacks in 2018? No matter what the reason—uncertain prospects of growth in the long term, doubts about the sustainability of high margins if crude oil prices recover, concerns about impending International Maritime Organization (IMO) 2020 regulations,2
or the looming large-scale capacity additions world-wide—investors have held their optimism about the sector in check.
Both margins and value creation are generally guided by actions and strategies of companies in the recent past, especially investment in upgrading the bottom of the barrel (refinery complexity). But has increasing complexity proved a panacea for cyclical maladies? Was the addition of upgrading complexity a successful business strategy over the past five years?
Note: This analysis covers listed companies in the downstream segment; it does not include IOCs and privately held refiners.Sources: S&P Capital IQ; Deloitte analysis.
Deloitte Insights | deloitte.com/insights
FIGURE 1
Downstream fortunes move upward in cadence with market trends
Revenue Market cap Operating margin (right axis)
Inde
xed,
bas
e ye
ar =
201
3
Ope
ratin
g m
argi
n (%
)
2013 2014 2015 2016 2017 2018/LTM50 0
1
2
3
4
5
6
7
100
150
200 Market capitalization accelerated at a slower pace than margins as the market’s evaluation has been conservative
Decoding the O&G downturn
2

Complexity and profitability: Dissonance or resonance?
US light tight oil production growth and sus-tained price differentials between Brent and WTI and between light and heavy crudes, despite the end of the US oil export ban, have principally benefitted simple refiners. Over the past five years, in fact, op-erating margins of simple refiners (with a Nelson complexity factor of less than 9)3 reached close to 7 percent in 2018, higher than what a complex refiner made in that year. Complex refiners have also re-cently come under pressure with cuts in supplies of heavy oil worldwide, leading to heavy crude trading at par or at a premium to light crude.4
The industry, however, continues to put more dollars into complex refinery configurations, re-flected in the 40 percent growth in the asset base of major complex refiners during 2013–2018. These investments probably reflect that companies aren’t expecting a sustained discount in US light crudes (current Brent–WTI spread of about US$10/bbl), don’t want to skew their product slate toward gasoline (which is already under both demand and pricing pressure), and would like to hold on to their feedstock and process flexibility (especially large refiners) (figure 2).5
These shifts and divergences have strong regional-level implications, including where new investment is going and where the most value
Notes:1. This analysis covers the top 50 listed companies in the segment owning refining assets, excluding IOCs, privately held refiners, and marketing companies.2. NCI stands for Nelson Complexity Index.Sources: S&P Capital IQ; Deloitte analysis.
Deloitte Insights | deloitte.com/insights
FIGURE 2
Globally, complex and noncomplex refiners have seen their operational results and investment priorities diverge (2013–2018)Noncomplex refiners outperformed their counterparts as crude slates turned turtle
Complex refiners (above 9 in NCI) Noncomplex refiners (NCI 9 and below)
Refiners with complex configurations have expanded as they consider it essential for the emergent energy transition
Ope
ratin
g m
argi
n (%
)
2013 2014 2015 2016 2017 20180
2
4
6
8
Noncomplex refiners
% increase in refining assets (2013–2018)
Complex refiners
0% 10% 20% 30% 40%
2.93%
1.93%
5.74%
6.91%
Refining & marketing: Eyeing new horizons
3

creation is happening. How might the competition play out across regions in these new realities, es-pecially when Middle East producers are acquiring refining assets in Asia to secure demand for their crude oil?
High margins in the west vs. growth in the east
On account of the light tight oil boom in the United States, margins of US refiners have traded US$6–10/bbl higher than Singapore refining margins. However, investors seem to have favored long-term growth in Asia over transitory high margins in the United States (which have come under increased pressure lately, and have been mixed at a product level as US gasoline refining margins fell to five-year lows in late 2018 while US
distillate margins remained above the past five-year average).6 The result: The market capitalization of Asian pure-play refiners grew by nearly 60 percent since 2013, as against only 5 percent for US pure-play refiners (figure 3).7
An option for export-oriented US refiners could be to look east to sell their rising gasoline produc-tion, but they will likely face intense competition from new capacity in Asia/Middle East as well as incumbent European capacity. Asia is projected to be the major contributor to global growth of coking units between 2018 and 2022, at around 38 percent of global planned and announced refinery coking unit capacity additions by 2022.8 Upcoming capacity additions in Asia might also disrupt the plans of Middle East refiners and push them to look for other export markets such as Europe, es-pecially for middle distillates. Although short-term demand pull for diesel due to the IMO 2020 ruling
Note: This analysis covers listed companies in the downstream segment; it does not include IOCs and privately held refiners.Sources: S&P Capital IQ; Deloitte analysis.
Deloitte Insights | deloitte.com/insights
FIGURE 3
APAC has grown to constitute the majority of global segment market capitalization Asia Pacific United States and Canada Middle East Africa
Europe Latin America and Caribbean
Tota
l mar
ket c
ap (%
)
2013 2014 2015 2016 2017 20180
10
20
30
40
50
60
70
80
90
100
165 152 174 202 296 263
136
2421
124
2318
137
2123
131
1828
157
2144
144
21
47
182315121721
Totalmarketcap (US$B)
367 334 367 393 541 492
Decoding the O&G downturn
4

may provide some relief, more intense competitive pressure may ensue on less competitive refining assets in Europe and some parts of Asia.9
The impact of these changing market dynamics is not expected to be limited to fuels, competition between regions, and collaboration among tradi-tional refining companies. Sophisticated large-scale plants incorporating crude oil-to-chemicals (COTC) technologies may change the basis of competition in petrochemicals because of their yield advan-tage. As against the global average of producing 8–10 percent naphtha from a barrel of oil from traditional refineries, these new plants can produce 40–45 percent petrochemical feedstocks. In short, the strategic focus of refiners may shift from advan-taged feedstock to market access, capital efficiency, and technology utilization.10
Rejigging the menu
While demand growth for crude oil sustains in the short-medium term, downstream players
should focus on the composition of demand. With petrochemicals expected to represent about one-third of world oil demand growth between now and 2030, and nearly half by 2050, many refiners with forward-integration possibilities are looking to adjust their strategic plans.11 According to the International Energy Agency, petrochemicals could add nearly 7 million bpd of oil demand by 2050, reaching a total of some 20 million bpd.12
Apart from their regular usage in everyday prod-ucts, petrochemical products are increasingly used to manufacture many parts of the modern energy system, including solar panels, wind turbines, bat-teries, thermal insulation, and electric vehicles, says the agency.13
Pure-play refiners (public and state-owned) are increasingly exploring value in investing in associ-ated midstream and petrochemical infrastructure, where there is a natural advantage or necessity. Such companies have shown a stronger growth in margins than pure-play refiners, as evidenced by their ~26 percent CAGR margin growth during 2013–2018. But the recognition by the market of
Note: This analysis covers listed companies in the downstream segment; it does not include IOCs and privately held refiners. Other companies include all those that do not have any refining assets, yet are active in other R&M areas.Sources: S&P Capital IQ; Deloitte analysis.
Deloitte Insights | deloitte.com/insights
FIGURE 4
Diversified refining players with petchem and midstream assets have shown the highest value expansion (2013–2018)Petchems: Key differentiator in margin growth EBIT margin CAGR (2013–2018)
Market favors refiners with midstream stakes Market cap CAGR (2013–2018)
Others
Pure-play R&M
Pure-play R&M with midstream
Pure-play R&M with midstream & petrochemicals
Others
Pure-play R&M
Pure-play R&M with midstream
Pure-play R&M with midstream & petrochemicals
12.84%
15.29% 4.37%
0.40%
19.58% 9.16%
25.53% 18.04%
Refining & marketing: Eyeing new horizons
5

their strong performance has been muted as the market waits to see if the returns can be sustained. The ROI may need to be analyzed for longer to as-certain its trajectory. This has been priced in by the markets (~10 percent CAGR in market capitaliza-tion, see figure 4).
On the other hand, surprisingly, pure-play refiners with only associated midstream business, es-pecially in the United States, seem to have garnered more attention from investors—these companies registered close to 18 percent CAGR growth in their market capitalization. Pipeline constraints due to midstream bottlenecks (which has resulted in significant transportation costs) and notable divergence in crude grades and spreads across local markets in the United States have benefitted (or reduced costs for) refiners with midstream exposure.
Although trends vary by region, pure-play refiners with elements of midstream and petro-chemical exposure seemed to have garnered more margins and delivered more shareholder returns as they have benefitted on all three fronts—advan-taged crude, midstream bottlenecks, and strong petrochemical products demand.14
Lessons from the downturnThe refining and marketing segment has
performed robustly over the past five years of a low-price environment. But challenges are already appearing on the horizon. These include ongoing price volatility in crude oil, slower growth in overall petroleum products demand in the long term, changing demand and crack-spreads at the product level, environmental and regulatory concerns such as those emanating from the IMO 2020 regulations, rising risk of overcapacity, and carbon footprint. Al-though the challenges for each company will likely be unique, the segment could benefit from the fol-lowing considerations:
• As against having a product mindset, refiners could benefit from adopting a molecular man-agement strategy (i.e., having a molecular-level understanding about refining streams and
processes, and incorporating molecular mod-eling into the overall refinery optimization) to have more agility and adaptability in their oper-ating model and stay ahead of changing demand patterns. Put simply, develop a complete capability from crude oil to end-uses through molecular characterization and modeling of refining streams.15
• Refiners should stay ahead of regulations es-pecially on the emissions front through their proactive investments in sulfur-free, high-performance, clean-burning transportation fuels by upgrading the bottom of the barrel. Refiners should bring in plant-level goals and risk control mechanisms that can enable the team to under-stand its cumulative responsibility in achieving these goals.
• Refiners should look at innovative ways of enhancing netbacks on invested capital via stra-tegic, technological, and tactical alliances that spread risk, maximize returns, sustain or grow their market share, and enable a win-win for all stakeholders (e.g., the 50:50 joint venture between Saudi Aramco and Total plans to invest around US$1 billion over the next six years in the Saudi retail fuel market).16 New refining assets that are aiming to produce both refined products and petrochemicals should invest in the latest technical processes as well achieve economies of scale in terms of size and complexity.17
In conclusion, while the last five years may have been the “best of times” for the downstream industry, there is no guarantee that the next five years will see similar good fortune. Refiners will need to be agile and invest in both technologies and human resources in such a way that they can preserve optionality in product lines and pricing. Considering downstream is an integral part of the bigger O&G ecosystem, having a perspective across the O&G value chain could be critical. Explore the entire Decoding the O&G downturn series to gain a 360-degree view on the industry.
Decoding the O&G downturn
6
1. S&P Capital IQ database, accessed January 2019.
2. Lee Hong Liang, What you need to know: The 2020 IMO fuel sulphur regulation, Seatrade Maritime News, accessed February 21, 2019.
3. Preem, “Nelson Complexity Index,” accessed February 18, 2019.
4. Liam Denning, “Gasoline pulls oil prices into reverse,” Bloomberg, November 9, 2018.
5. Serene Cheong, “Keep it simple, stupid: Complex oil refiner margins squeezed,” Bloomberg, December 14, 2018.
6. US Energy Information Administration, “This week in petroleum,” February 13, 2019.
7. Liam Denning, “Shale? Here’s the other wave washing into the oil market,” Bloomberg Businessweek, March 6, 2018.
8. TradeArabia, “Asia to see major growth in refinery coking unit capacity,” October 16, 2018.
9. Ibid.
10. Denning, “Shale? Here’s the other wave washing into the oil market;” R. J. Chang, “How will crude oil-to-chemicals reshape the global petrochemical industry,” Gulf Petrochemicals & Chemicals Association, August 1, 2018.
11. Carla Sertin, “Saudi Aramco CEO: Company’s strategy will include more downstream acquisitions,” OilandGas Middle East, November 27, 2018.
12. International Energy Agency, “Petrochemicals set to be the largest driver of world oil demand, latest IEA analysis finds,” October 5, 2018.
13. Hellenic Shipping News, “Middle East petrochemical push signals oil’s future,” February 11, 2019.
14. Ibid; Sertin, “Saudi Aramco CEO: Company’s strategy will include more downstream acquisitions.”
15. Yongwen Wu, Molecular management for refining operations, University of Manchester, 2010.
16. Saudi Aramco, “Saudi Aramco and Total invest in high-quality retail fuel network in Saudi Arabia,” February 14, 2019.
17. Chen Aizhu, Rania El Gamal, and Meng Meng, “Saudi Aramco to sign China refinery deals as crown prince visits,” Reuters, February 21, 2019.
Endnotes
Anshu Mittal is an associate vice president in Deloitte Services LP’s Research & Insights team. He is based in Hyderabad, India.
Bala Vijayan Venkateshwaran is an oil & gas manager on Deloitte Services LP’s Research & Insights team. He is based in Hyderabad, India.
Deepak Shah is an oil & gas assistant manager on Deloitte Services LP’s Research & Insights team. He is based in Mumbai, India.
About the authors
Refining & marketing: Eyeing new horizons
7