refining our future - singapore exchange
TRANSCRIPT
Refining ouR futuRe
A n n u a l R e p o r t 2 014
As a Leading OffshoreService Provider

Contents
01 / Corporate Profile
04 / Corporate Milestones
10 /
Executive Director &
Group CEO’s Statement
18 / Key Management
34 /
Financial Statements
02 / Business Segments
06 /
Our Vessels
12 / Operational and
Financial Review
20 / Financial Highlights
113 / Statistics of Shareholdings
03 / Group Structure
08 / Executive Chairman’s Statement
14 / Board of
Directors
21 /
Corporate Governance Report
115 /
Notice of Annual General Meeting
Proxy Form
Corporate Profile
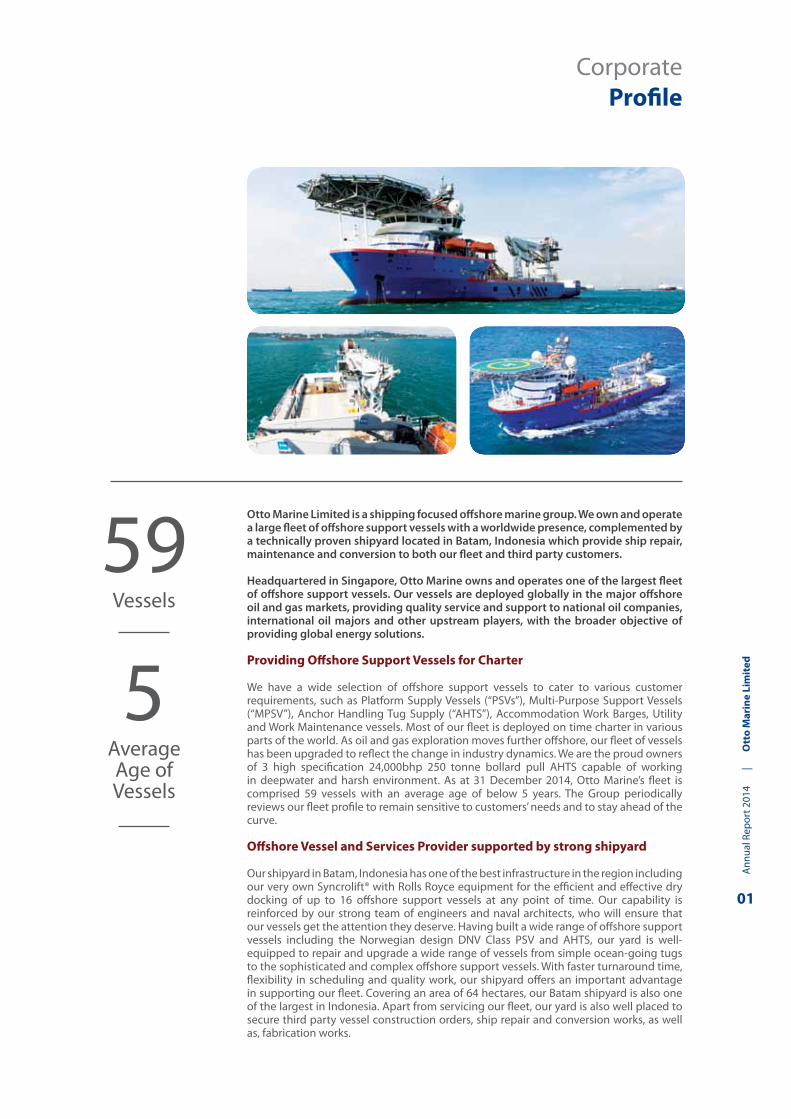
otto Marine Limited is a shipping focused offshore marine group. We own and operate a large fleet of offshore support vessels with a worldwide presence, complemented by a technically proven shipyard located in Batam, indonesia which provide ship repair, maintenance and conversion to both our fleet and third party customers.
Headquartered in Singapore, otto Marine owns and operates one of the largest fleet of offshore support vessels. our vessels are deployed globally in the major offshore oil and gas markets, providing quality service and support to national oil companies, international oil majors and other upstream players, with the broader objective of providing global energy solutions.
Providing Offshore Support Vessels for Charter
We have a wide selection of offshore support vessels to cater to various customer requirements, such as Platform Supply Vessels (“PSVs”), Multi-Purpose Support Vessels (“MPSV”), Anchor Handling Tug Supply (“AHTS”), Accommodation Work Barges, Utility and Work Maintenance vessels. Most of our fleet is deployed on time charter in various parts of the world. As oil and gas exploration moves further offshore, our fleet of vessels has been upgraded to reflect the change in industry dynamics. We are the proud owners of 3 high specification 24,000bhp 250 tonne bollard pull AHTS capable of working in deepwater and harsh environment. As at 31 December 2014, Otto Marine’s fleet is comprised 59 vessels with an average age of below 5 years. The Group periodically reviews our fleet profile to remain sensitive to customers’ needs and to stay ahead of the curve.
Offshore Vessel and Services Provider supported by strong shipyard
Our shipyard in Batam, Indonesia has one of the best infrastructure in the region including our very own Syncrolift® with Rolls Royce equipment for the efficient and effective dry docking of up to 16 offshore support vessels at any point of time. Our capability is reinforced by our strong team of engineers and naval architects, who will ensure that our vessels get the attention they deserve. Having built a wide range of offshore support vessels including the Norwegian design DNV Class PSV and AHTS, our yard is well-equipped to repair and upgrade a wide range of vessels from simple ocean-going tugs to the sophisticated and complex offshore support vessels. With faster turnaround time, flexibility in scheduling and quality work, our shipyard offers an important advantage in supporting our fleet. Covering an area of 64 hectares, our Batam shipyard is also one of the largest in Indonesia. Apart from servicing our fleet, our yard is also well placed to secure third party vessel construction orders, ship repair and conversion works, as well as, fabrication works.
59
5Vessels
Average Age ofVessels
Ann
ual R
epor
t 201
4
|
O
tto
Mar
ine
Lim
ited
01

BusinessSegments
Shipping and Chartering
21 vessels operating directly
• 1 x 3000bhp tug
• 2 x 3600bhp towing tugs
• 2 x flat top barges
• 2 x 40m AHT
• 1 x 3000bhp AHT
• 1 x 6000bhp AHTS
• 2 x 7200bhp AHTS
• 1 x 16000bhp AHTS
• 1 x 16320bhp AHTS
• 2 x 21000bhp AHTS
• 1 x Landing Craft Ship (LCT)
• 1 x 75m WMV
• 1 x Reflect Scorpio
• 1 x Surf Challenger
• 1 x Surf Ranger
• 1 x Inshore vessel
Shipyard
• Construction of complex, high-spec & environmental friendly offshore support vessels (e.g. AHTS, MPSV, offshore construction vessel)
• Repair & conversion and fabrication of a wide range of vessels (e.g. offshore support vessels, ocean-going tug)
• Sophisticated vessels for North Sea operations that meet the ABS or DNV class
• Owns 64 ha shipyard in Batam- Selective outsourcing to China shipyards- Build-to-order
• Syncrolift® system that provide dock space for up to 16 offshore support vessels
• Dry dock 44m x 145m
• 2 purpose built slipways of up to 40m x 245m
32 vessels chartered in/manned
• 1 x flat top barge
• 2 x 5150bhp AHTS
• 2 x 8000bhp AHTS
• 2 x 10800bhp AHTS
• 1 x 16000bhp AHTS
• 15 x Inshore vessels
• 2 x MT6009L MPSV
• 1 x 5150bhp OSV
• 2 x 5000dwt PSV
• 1 x 75m WMV
• 1 x 5000kW PSV
• 2 x 61m WMV
Strategic Partnerships6 operational vessels
• 3 x 5150bhp AHTS
• 1 x 8000bhp AHTS
• 1 x 21000bhp AHTS
• 1 x 5200kW SPB
Ann
ual R
epor
t 201
4
|
O
tto
Mar
ine
Lim
ited
02
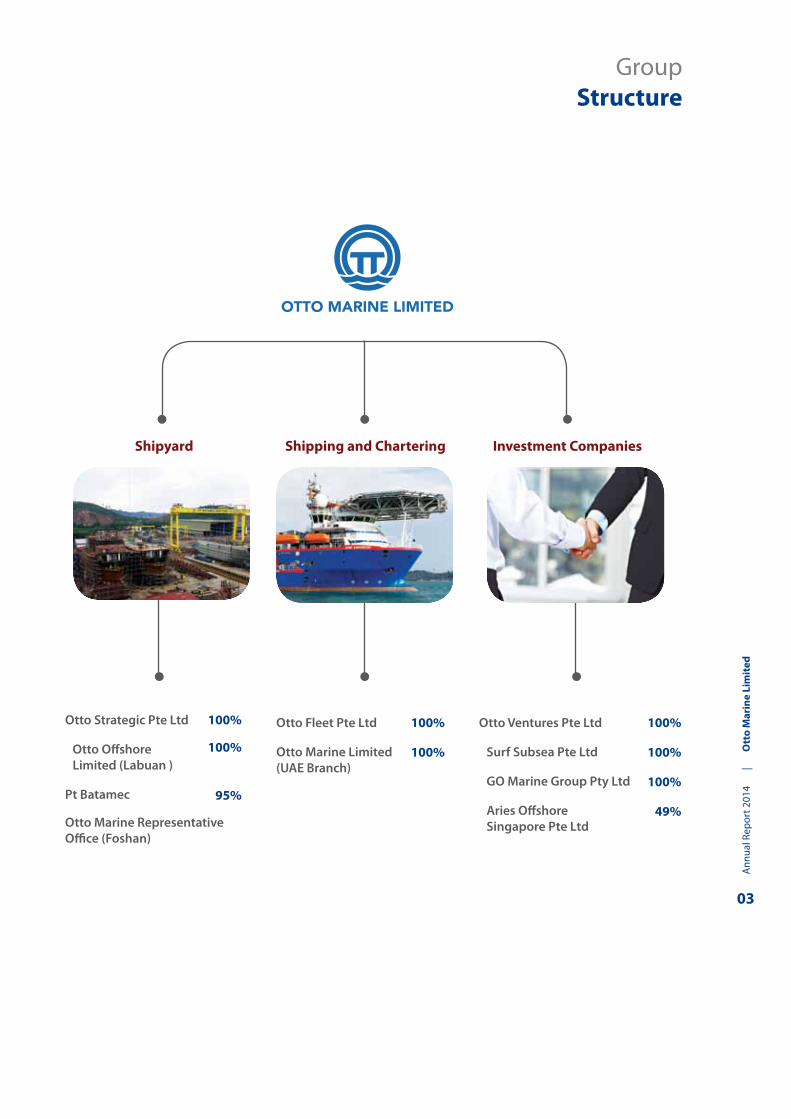
GroupStructure
otto Strategic Pte Ltd
otto offshore Limited (Labuan )
Pt Batamec
otto Marine Representativeoffice (foshan)
otto Ventures Pte Ltd
Surf Subsea Pte Ltd
go Marine group Pty Ltd
Aries offshore Singapore Pte Ltd
Shipyard Investment Companies
otto fleet Pte Ltd
otto Marine Limited (uAe Branch)
Shipping and Chartering
100%
100% 100%
100% 100%
100%
100%
49%95%
Ann
ual R
epor
t 201
4
|
O
tto
Mar
ine
Lim
ited
03
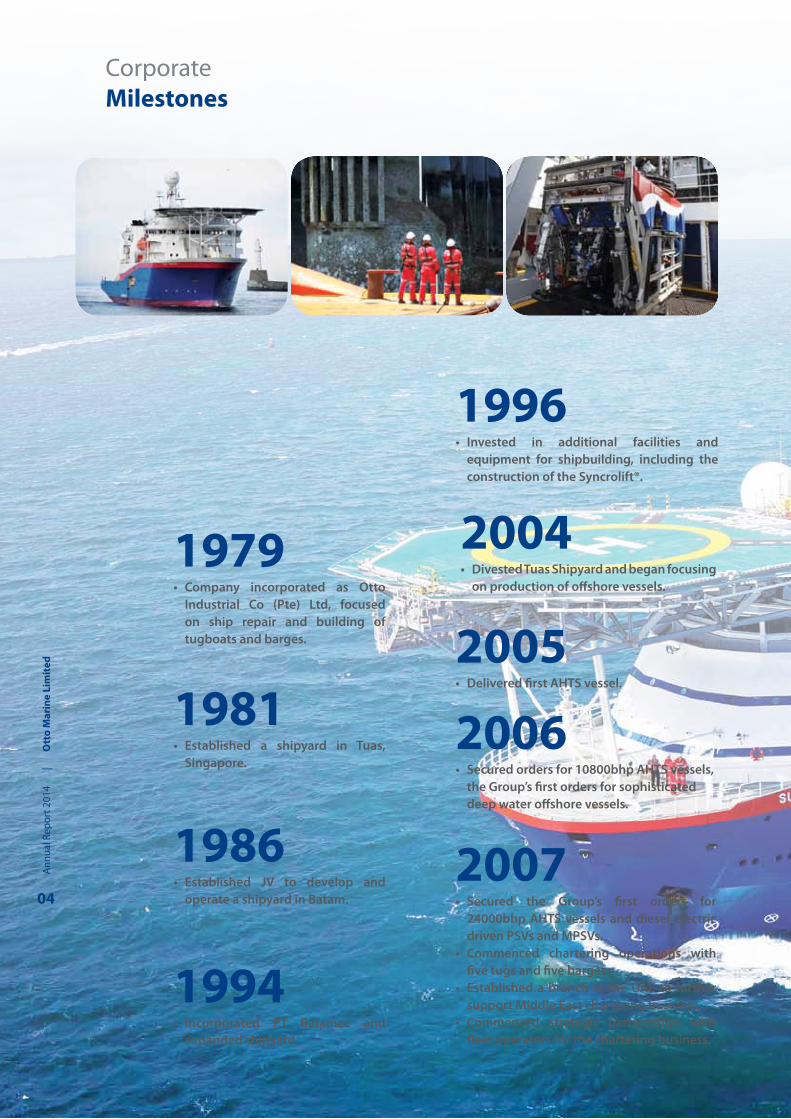
1979• Company incorporated as otto
industrial Co (Pte) Ltd, focused on ship repair and building of tugboats and barges.
1996• invested in additional facilities and
equipment for shipbuilding, including the construction of the Syncrolift®.
1981• established a shipyard in tuas,
Singapore.
2004• Divested tuas Shipyard and began focusing
on production of offshore vessels.
1986• established JV to develop and
operate a shipyard in Batam.
2005• Delivered first AHtS vessel.
1994• incorporated Pt Batamec and
expanded shipyard.
2006• Secured orders for 10800bhp AHtS vessels,
the group’s first orders for sophisticated deep water offshore vessels.
2007• Secured the group’s first orders for
24000bhp AHtS vessels and diesel electric driven PSVs and MPSVs.
• Commenced chartering operations with five tugs and five barges.
• established a branch in the uAe to further support Middle east chartering business.
• Commenced strategic partnerships with fleet operators for the chartering business.
CorporateMilestones
Ann
ual R
epor
t 201
4
|
O
tto
Mar
ine
Lim
ited
04

2008• Successfully listed on the Mainboard of
the Singapore Stock exchange raising S$97.7mn through its initial public offering on 28 november 2008.
• established a representative office in China.
• entered into agreement to build the group’s first offshore construction vessel.
2011• Acquired 55% stake in go Marine group Pty Ltd.• Deployed 3 vessels into West and South Africa.• Received class certification from Det norske
Veritas (“DnV” ) for “Deep Sea 1”.
2012• increased stake in go Marine group Pty Ltd to
90%.• Secured the following charters:
- 5 years in the north Sea worth uS$36.5mn.- 450 days in the gulf of Mexico, worth uS$14.9mn.- uS$15.1mn charter in Australia.- uS$10mn charter in Africa.
2010• established a S$500mn Mtn Programme
and a 3-year tranche of S$100mn Mtn Programme.
• Raised approximately S$92.6mn through a share placement.
• entered north American and gulf of Mexico market by taking a 19.2% stake in Surf Subsea inc.
• increased stake in Reflect geophysical Pte Ltd to 81.8%.
2013• Secured new shipbuilding contracts for two
5150bhp AHtS at uS$27.8mn.• Secured S$6.3mn in fabrication works.• Completed a rights issue and raised net proceeds
of S$62.8mn.• Delivered second unit of 24000bhp AHtS “go
Phoenix”.• Delivered third unit of 24000bhp AHtS “go
Pegasus”.• Acquired a Malaysia associate with shipping
license.• Secured shipping licence in indonesia.• Redemption of S$100mn 3-year Mtn.• Subsidiary Reflect geophysical under
liquidation.
2014• Delivered drilling vessel “norshore Atlantic”.• issued tranche of S$70mn under Mtn
programme, with 2-year tenor.• increased stake in go Marine group Pty Ltd to
100%.• entered into settlement agreement with JV
partner in connection with the termination of the joint venture investment in the Aries group.
• Disposed entire shareholding interest 49% in joint venture company, go Marine Services (M) Sdn Bhd.
2009• Strategic partnership with go Marine
group Pty Ltd in a JV company, go to Marine Pty Ltd.
• Completed a rights issue and raised net proceeds of S$115.5mn.
• Acquired a 74% stake in Reflect geophysical Pte Ltd.
• Awarded iPo of year 2008 by Marine Money.
• Awarded the “fASteSt 50 gRoWing CoMPAnY” by DP information group.
Ann
ual R
epor
t 201
4
|
O
tto
Mar
ine
Lim
ited
05
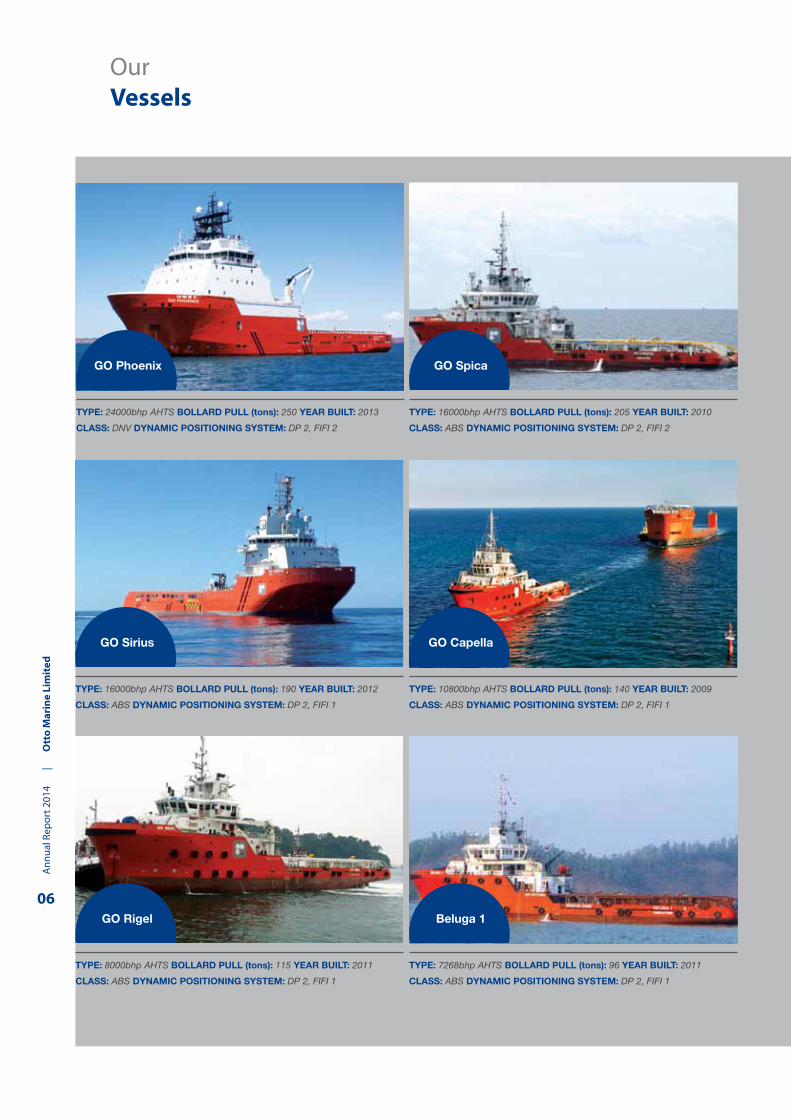
Our Vessels
TYPE: 10800bhp AHTS BOLLARD PULL (tons): 140 YEAR BUiLT: 2009
CLASS: ABS DYNAMiC POSiTiONiNG SYSTEM: DP 2, FIFI 1
TYPE: 24000bhp AHTS BOLLARD PULL (tons): 250 YEAR BUiLT: 2013
CLASS: DNV DYNAMiC POSiTiONiNG SYSTEM: DP 2, FIFI 2
TYPE: 16000bhp AHTS BOLLARD PULL (tons): 205 YEAR BUiLT: 2010
CLASS: ABS DYNAMiC POSiTiONiNG SYSTEM: DP 2, FIFI 2
TYPE: 7268bhp AHTS BOLLARD PULL (tons): 96 YEAR BUiLT: 2011
CLASS: ABS DYNAMiC POSiTiONiNG SYSTEM: DP 2, FIFI 1
TYPE: 16000bhp AHTS BOLLARD PULL (tons): 190 YEAR BUiLT: 2012
CLASS: ABS DYNAMiC POSiTiONiNG SYSTEM: DP 2, FIFI 1
TYPE: 8000bhp AHTS BOLLARD PULL (tons): 115 YEAR BUiLT: 2011
CLASS: ABS DYNAMiC POSiTiONiNG SYSTEM: DP 2, FIFI 1
GO Phoenix GO Spica
GO Sirius
GO Rigel
GO Capella
Beluga 1
Ann
ual R
epor
t 201
4
|
O
tto
Mar
ine
Lim
ited
06
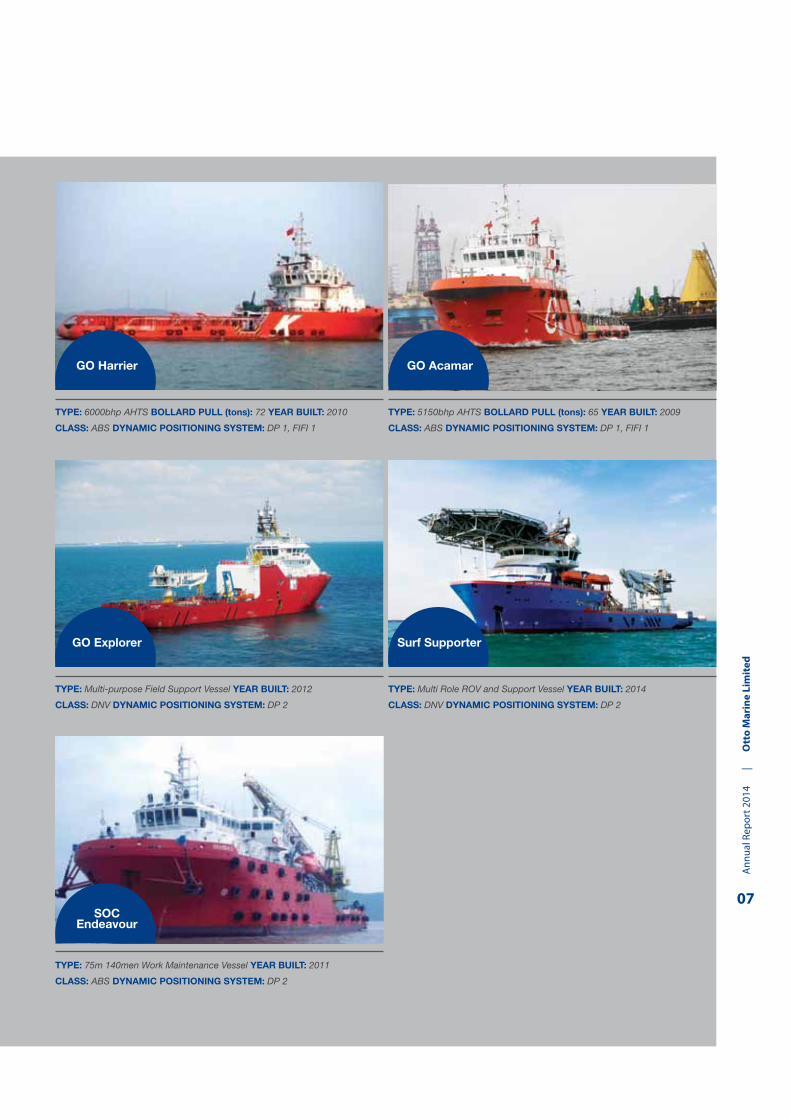
TYPE: 6000bhp AHTS BOLLARD PULL (tons): 72 YEAR BUiLT: 2010
CLASS: ABS DYNAMiC POSiTiONiNG SYSTEM: DP 1, FIFI 1
TYPE: Multi-purpose Field Support Vessel YEAR BUiLT: 2012
CLASS: DNV DYNAMiC POSiTiONiNG SYSTEM: DP 2
TYPE: Multi Role ROV and Support Vessel YEAR BUiLT: 2014
CLASS: DNV DYNAMiC POSiTiONiNG SYSTEM: DP 2
TYPE: 75m 140men Work Maintenance Vessel YEAR BUiLT: 2011
CLASS: ABS DYNAMiC POSiTiONiNG SYSTEM: DP 2
TYPE: 5150bhp AHTS BOLLARD PULL (tons): 65 YEAR BUiLT: 2009
CLASS: ABS DYNAMiC POSiTiONiNG SYSTEM: DP 1, FIFI 1
GO Harrier GO Acamar
GO Explorer
SOC Endeavour
Surf Supporter
Ann
ual R
epor
t 201
4
|
O
tto
Mar
ine
Lim
ited
07

Executive Chairman’s Statement
Dear Shareholders,
The second half of 2014 saw weaker industry sentiment
brought about by the volatile and overall decline in oil
prices. Like other companies in the oil & gas and offshore
space, we also witnessed a tough and challenging climate.
With prevailing lower oil prices, the demand for assets and
services in the sector is reduced and many companies had
to cut costs to remain competitive.
Coupled with lower utilisation resulting from mandatory
surveys and docking of several of our vessels, mobilisation
of vessels for projects and the turmoil in the industry, we
ended the year with a decline in 30.5% in external revenue
to US$355.9 million. This decline in revenue and the cost
overrun on a vessel resulted in the loss attributable to
equity holders of US$41.7 million in 2014.
Nonetheless, similar to the past 2 years, our operating cash
flows remained positive. In this challenging climate, the
Group will focus on keeping our balance sheet healthy and
increasing our operational efficiency.
Resilient Business Model
Despite the challenges we faced, we are confident that with
our focused business model, experienced management
team and premium names on our client list, we will be able
to emerge stronger from this crisis.
Our vessels and services cater to customers involved in
the entire spectrum of the oil & gas life cycle – from the
exploration phase to the development and production
stages, as well as, the decommissioning phase. Our
geographical reach spans from Australia to Asia, Africa and
Mexico. We have a strong presence in Australia servicing
oil majors. Additionally, we have made inroads in the
Indonesian offshore market which is protected by the
cabotage framework.
Our shipyard complements our shipping and chartering
business by providing the repair and maintenance
services to our own fleet of vessels. Also, the shipyard
takes on external orders for vessels repairs, maintenance
and conversion, and fabrication orders, as well as, new
shipbuilding orders for the local Indonesian market.
Yaw Chee SiewExecutive Chairman
Ann
ual R
epor
t 201
4
|
O
tto
Mar
ine
Lim
ited
08

The revenue of the subsea business increased by US$7.6
million to US$31.0 million in 2014 resulting from our
investment to expand this business. In view of the immense
growth potential of this business, the Group has appointed
UOB KayHian as advisor to evaluate the strategic options to
grow this business.
Keeping Balance Sheet Healthy
The Group strives to maintain a strong balance sheet and
improve liquidity. In 2014, we disposed of 3 units of 6,000
bhp AHTS for a total of US$37.5 million and issued S$70
million of 7% fixed rate notes that are due in 2016 under our
MTN programme to enhance our liquidity. The Group also
entered into a sale and leaseback contract for a 24,000 bhp
AHTS vessel, which will be delivered in the second quarter
of 2015. Upon completion, these will enhance our balance
sheets and improve our cash flows.
Operational Efficiency
In order to remain competitive, we have implemented cost
cutting measures which include the reduction of head count
and the salaries of executive directors and all staff. Also, the
directors’ fees for the non-executive directors are reduced.
Despite the tough industry climate, we remain dedicated to
our fleet upgrade and renewal program so as to keep the
average age of our fleet low as a younger fleet is more cost
effective to operate. We will be taking delivery of two units
of 238-men vessels in the second half of 2015. Another two
units of 238-men vessels and four PSVs will be delivered in
the next couple of years. These vessels are currently under
construction.
Outlook for the industry
The volatility of the market and overall drastic reduction in
oil prices in the last quarter of 2014 has continued into 2015.
Our order book stood at US$495 million as at 31 December
2014 with an average contract tenor of 3 to 5 years. While we
expect that market conditions in 2015 to be challenging, we
are vigilant in maintaining our Group’s presence in Australia,
Mexico, Indonesia, Africa and other key oil and gas areas.
With our committed and capable team as well as supportive
business partners, we will continuously strive towards a
good level of utilisation for the Group’s fleet.
Appreciation
I would like to congratulate Ms. Chong Sieh Jiuan on her
promotion to Chief Financial Officer in January 2015. She has
been with the Group as Chief Accounting Officer since 2008.
I would like to extend my deep appreciation to all our staff
and management for their dedication throughout these
challenging times, and to our directors for their support
and contribution. I would also like to thank our business
partners for their trust and look forward to further develop
these relationships. Finally, I would like to express my
heartfelt thanks to our shareholders and investors, their
continued trust and support inspire us to stand tall through
the adversity. With our strong and determined management
team and dedicated effort from all at Otto Marine, we are
confident that once the market turbulence is over, Otto
Marine will emerge as a stronger and dominant offshore
player in the years to come.
Yaw Chee SiewExecutive Chairman
Ann
ual R
epor
t 201
4
|
O
tto
Mar
ine
Lim
ited
09

Executive Director & Group CEO’s Statement
Dear Shareholders,
It is my pleasure to address you all again in my second year
as Executive Director and Group CEO of Otto Marine.
The Group has refined its growth strategy in 2011 to focus
on the shipping and chartering business, and entering the
Australian, North Sea, North American, Asian and African
markets; our target was to expand the shipping and
chartering business and make it a major contributor to the
Group’s revenue. In line with the strategy, we have grown the
shipping and chartering business to a decent size. In 2014,
we have had a year of restructuring and transformation,
and we have set up the stage for our future growth whilst
continuing our strong initiatives to maintain excellent HSE
and operational safety record of our fleet around the world.
Shipping and Chartering Business Back in 2009, shipyard business accounted for 95% of our
revenue, and shipping and chartering business contributed
only 4%. Over the last few years, we took solid steps in
building up the shipping and chartering business, and
emerged as a truly shipping and chartering company
today. In 2014, the Group secured over US$500 million in
new charter contracts for our fleet, and the shipping and
chartering business contributed 68% to our total revenue,
with contribution from primary markets in Australia, Mexico
and Southeast Asia. We have a global fleet of 59 OSVs with
an average age of below 5 years as at the end of 2014.
Our highly sophisticated OSV fleet is a perfect match for the
harsh sea conditions present in the mature markets such
as the North Sea. During 2014, we established our joint
venture with SeaEnergy Ship Management Ltd in the North
Sea, and I am pleased to report that it is currently operating
three vessels, namely the GO Electra, GO Pegasus and SURF
Ranger. In addition, the Group has expanded its market
into Mexico, securing five long-term vessel contracts for
the Group in 2014. We also have seven vessels operating in
emerging markets such as Angola and Nigeria, the top two
oil producing nations in Africa.
Our 49% joint venture in Indonesia with PT GO Marine
International has enhanced our capabilities and increased
our presence in cabotage markets that carry high growth
potential.
Garrick James StanleyExecutive Director & Group CEO
Ann
ual R
epor
t 201
4
|
O
tto
Mar
ine
Lim
ited
10

Fleet expansion
We have a comprehensive fleet of vessels that support the
entire oil and gas project life cycle. In 2014, we implemented
a forward-looking strategy to renew, expand and upgrade
our fleet, in order to strengthen our competitive edge, better
cater to market demand and build a base for long-term
growth; the replacement of older and small-tonnage vessels
will also reduce our risk exposure to market fluctuations
and improve our bottom line. Our upgrading plan targets
a modern OSV fleet of fuel-efficient vessels with advanced
technology, and we have placed select new build orders for
four work maintenance vessels and four PSVs to be delivered
over the next couple of years.
Subsea Services
Given our assets and capabilities, the subsea business is a
natural fit for the Group. We offer long term vessel solutions
to clients to support their subsea contracts with the oil
majors and first-tier contractors, especially in strategic niche
segments in Gulf of Mexico, Australia and the North Sea. We
have three subsea vessels and strong field experience in all
forms of deepwater construction and IMR operations; our
SURF Ranger is operating in the North Sea market, and SURF
Supporter that was delivered end of 2014 and operating in
Australia and SE Asian regions to our clients.
Going forward, we will continue to build or acquire select
assets to expand the fleet against long term secure charters.
We are also looking at strategically expanding the subsea
business and we have appointed external party to advise
us on the best option to consider, even looking at potential
listing of the subsea business in the future.
Social Responsibility
The Group strived in the development of its social
responsibilities as a corporate citizen. Otto Marine has
begun its Corporate Social Responsibility (CSR) initiative by
providing jobs preparation for two batches of adults with
psychiatric disabilities and collaborated with Community
Rehabilitation Support Services with an ongoing continual
effort to highlight awareness of mental health well-being to
all staff.
Outlook
Although the industry climate has turned less favourable
following the falling in oil price over the last few quarters,
we do not think the long-term outlook for the demand of
oil has fundamentally changed, and we have faith in our
long-term strategy to build up the shipping and chartering
business. As 2015 might be a challenging market with
increased competition, we will exert extra effort to maintain
the utilisation for our fleet, and we expect our young fleet of
vessels, especially larger vessels to capture higher utilisation
rates compared to the older and smaller ones in the market
downturn. Our diversified footprint in Australia, Mexico and
Africa will help reduce the volatilities in any single market.
The market has become increasingly eventful and the
industry is trying hard to adapt to the situation. In response
to the challenging business environment, we have taken a
few measures internally, such as rationalising management
and cost structure. Strategically, we will strive to build up a
fleet with good reputation in safety, reliability, fuel efficiency,
competitive rates and quality trained crews, and enhance
earnings security. We will also continue to focus on North
Sea, Africa, Australasia and other high-growth markets,
and penetrate high potential cabotage-protected markets
like Indonesia. Otto Marine will continue to strengthen our
position as a leading OSV charterer in Asia, and prepare the
Group for the E&P activities and the industry to recover in
future.
Garrick James StanleyExecutive Director & Group CEO
Ann
ual R
epor
t 201
4
|
O
tto
Mar
ine
Lim
ited
11
Operational and Financial Review
Overview
The Group has taken solid steps towards our goal of
building a leading OSV charterer in Asia, and it has been
encouraging to see the shipping and chartering business
progress well over the last three years. However, the Group
revenue decreased by 30.5% to US$355.9 million in 2014,
primarily due to the decline in revenue of the shipyard
business and the shipping and chartering business; vis-a-
vis the improvement in the revenue of the subsea business.
The Group’s gross profit decreased by 55.5%, from US$46.5
million to US$20.7 million, primarily due to the lower gross
profit from shipping and chartering business and cost
overrun on a vessel.
Shipyard
While the shipping and chartering business has been
gaining significance in our strategy, our shipyard remained
complementary to our main shipping and chartering
business, as it helps maintain, repair, modify and retrofit
our own vessels. The shipyard has been constantly securing
repairs and fabrication jobs; the stable income stream has
led to increased ship repair revenue in 2014.
However, with fewer shipbuilding orders as compared to
2013, shipyard revenue decreased by US$141.7 million to
US$81.1 million in 2014. The cost overrun incurred in the
construction of one vessel has hurt the gross profit for the
segment, which decreased from US$11.8 million in 2013
to US$7.0 million in 2014. On a positive note, as the ship
repair business offers better margin, the gross margin for
the segment improved from 5.3% in 2013 to 6.6% in 2014.
Shipping and Chartering
In line with our strategy to renew and upgrade our fleet, we
disposed of a few vessels during the year, and the fleet size
has been reduced from 65 vessels as at the end of 2013 to
59 vessels as at the end of 2014. In addition, the OSV market
turned increasingly competitive given the recent regional
developments and the instability of oil prices. The industry
factor coupled with the docking and mobilisation of a few
of our vessels resulted in lower utilisation rate for our fleet
in 2014. The lower charter rates have weighed on shipping
and chartering revenue too.
Ann
ual R
epor
t 201
4
|
O
tto
Mar
ine
Lim
ited
12

These factors caused the shipping and chartering revenue
to decrease by US$21.8 million in 2014, or 8.2%, to US$243.8
million in 2014. The lower utilisation and increased
depreciation have squeezed the gross profit by US$24.9
million, to US$6.4 million.
Subsea Services
Although the subsea services business is a recent venture of
ours, we have acquired comprehensive capabilities for IMR,
ROMV support and intervention services. Our three subsea
vessels are currently deployed in the Gulf of Mexico, North
Sea, and in regional waters in Australia and Southeast Asia.
In 2014, we grew the subsea services business which
reported a US$7.7 million increase in revenue to US$31.0
million. Gross profit for the segment increased by US$2.4
million to US$7.3 million. The two new subsea vessels, added
towards the end of 2014, enjoyed higher profit margin. As
a result, the gross margin of our subsea services business
improved from 21.3% in 2013 to 23.6% in 2014.
Strengthening the Financial Position
To facilitate our strategy to renew, expand and upgrade our
fleet, we issued S$70,000,000 of fixed rate notes under the
Medium Term Note Programme in July 2014.
In December 2014, our shipyard sold one AHTS vessel for
US$100 million to an unrelated third party, and GO Offshore
(L) Private Limited, one of our subsidiaries, will charter
the vessel for 8 years. The sale and leaseback enhances
contribution to our net tangible assets, and further
strengthen our balance sheet.
The Group has generated positive operating cash flow in
the last few years; even with a softened offshore chartering
market, we still reported US$36.2 million in cash from
operating activities in FY2014.
We appreciate the support from our shareholders and
investors. We strive to deliver the long-term return with our
determination and dedication, and we will emerge from this
crisis as a more focused and stronger entity.
Ann
ual R
epor
t 201
4
|
O
tto
Mar
ine
Lim
ited
13

Board ofDirectors
Yaw Chee Siew
Executive Chairman
Mr Yaw Chee Siew is the Executive Chairman of Otto
Marine. He is primarily responsible for charting the Group’s
strategic direction and devising strategies to facilitate the
growth of the Group. Prior to joining us in August 2001,
Mr Yaw founded and managed SunChase Holdings Inc.,
a US real estate development company from 1986 to
2006. Mr Yaw is also the Founding Chairman of Perdana
Parkcity Sdn Bhd, a Malaysian based developer focusing
on master planned community in Kuala Lumpur and other
parts of Malaysia, where he was responsible for guiding
and steering projects from initial planning stages to the
execution of the development.
Mr Yaw holds a Bachelor of Science degree in Real Estate,
Land Use Affairs and Finance.
Ann
ual R
epor
t 201
4
|
O
tto
Mar
ine
Lim
ited
14

Michael See Kian HengGroup Executive Director
Mr Michael See joined the Group as Chief Financial Officer
in March 2007 and promoted as the Group Chief Financial
Officer in March 2012. He was then appointed to the Board
as Executive Director in March 2013, and subsequently
promoted to Group Executive Director in February 2014.
Mr See reports to the Executive Chairman on matters
relating to the Board and corporate governance, and
to the Group CEO on business activities by providing
support to the Group CEO in the conduct of the day to
day operation of the Group’s business, in particular, in the
providing of corporate shared services, including finance
and accounting, funding, investor relations, corporate
secretarial services, procurement, office administration
and information technology. Prior to joining Otto
Marine, Mr See held various senior financial and general
management positions including Chief Financial Officer
and Managing Director in corporations in Singapore,
China and Australia, including listed entities. He is
currently an Independent Director of Nippecraft Limited.
Mr See holds a degree in accountancy and a Master of
Business Administration. Mr See is a Certified Practising
Accountant with CPA Australia and a Chartered Accountant
with the Institute of Singapore Chartered Accountants. He
is also a member of the Marketing Institute of Singapore
and the Singapore Institute of Directors.
Garrick James Stanley
Executive Director & Group CEO
Mr Garrick James Stanley joined Otto Marine as Executive
Director and Group Chief Executive Officer in August
2013. He is responsible for executing the Board’s
decisions, implementing the Group’s strategies and
policies, and overseeing the conduct of the Group’s day to
day operations. Mr Stanley was the founder of GO Marine
Group. As a Managing Director of GO Marine Group, he has
entrenched the GO brand in Australasian offshore oil and
gas industry. With over 15 years as a Master Mariner, Mr
Stanley has extensive knowledge and understanding of
the offshore operational environment - marine, technical
and people.
Mr Stanley holds an Advanced Diploma in Marine
Distribution and Transport from Freemantle Maritime
College, Australia.
Ann
ual R
epor
t 201
4
|
O
tto
Mar
ine
Lim
ited
15

Board ofDirectors
Heng Hock Cheng @ Heng Heyok Chiang
Non-Executive & Lead Independent Director
Mr Heng Hock Cheng joined the Otto Marine Board in 2011
and was appointed to the Board as Lead Independent
Director in March 2013. He is the Chairman of Nominating
and Remuneration Committees and a member of Audit
Committee. Mr Heng retired from Shell in 2006 after 34
years of service where he had served in the upstream,
downstream and gas & power divisions. He has worked
with various Shell entities in Malaysia, UK, Holland
and China, holding positions that include Engineering
Manager and Technical Director of Sarawak Shell Berhad
and Sabah Shell Petroleum Ltd in Malaysia, Managing
Director of Shell Gas & Power Malaysia and the Chairman
of Shell China based in Beijing.
Mr Heng holds a Bachelor of Science (Honours) Degree in
Chemical Engineering.
Ng Quek PengNon-Executive & Independent Director
Mr Ng Quek Peng joined the Otto Marine Board in 2012.
He serves as the Chairman of Audit Committee and a
member of Nominating and Remuneration Committees.
Mr Ng has held various positions related to the corporate
finance and securities industry in foreign and local
financial institutions during his career, including Citicorp
Investment Bank, OCBC Securities, ABN Amro Bank and
CIMB Bank. Apart from the finance industry, Mr Ng has
exposure to the direct investment industry when he was
with Temasek Holdings and in project development when
he was with GMR International which developed a power
plant in Singapore.
Mr Ng holds a Degree in Civil Engineering and is a member
of the Institute of Chartered Accountants in England and
Wales.
Ann
ual R
epor
t 201
4
|
O
tto
Mar
ine
Lim
ited
16
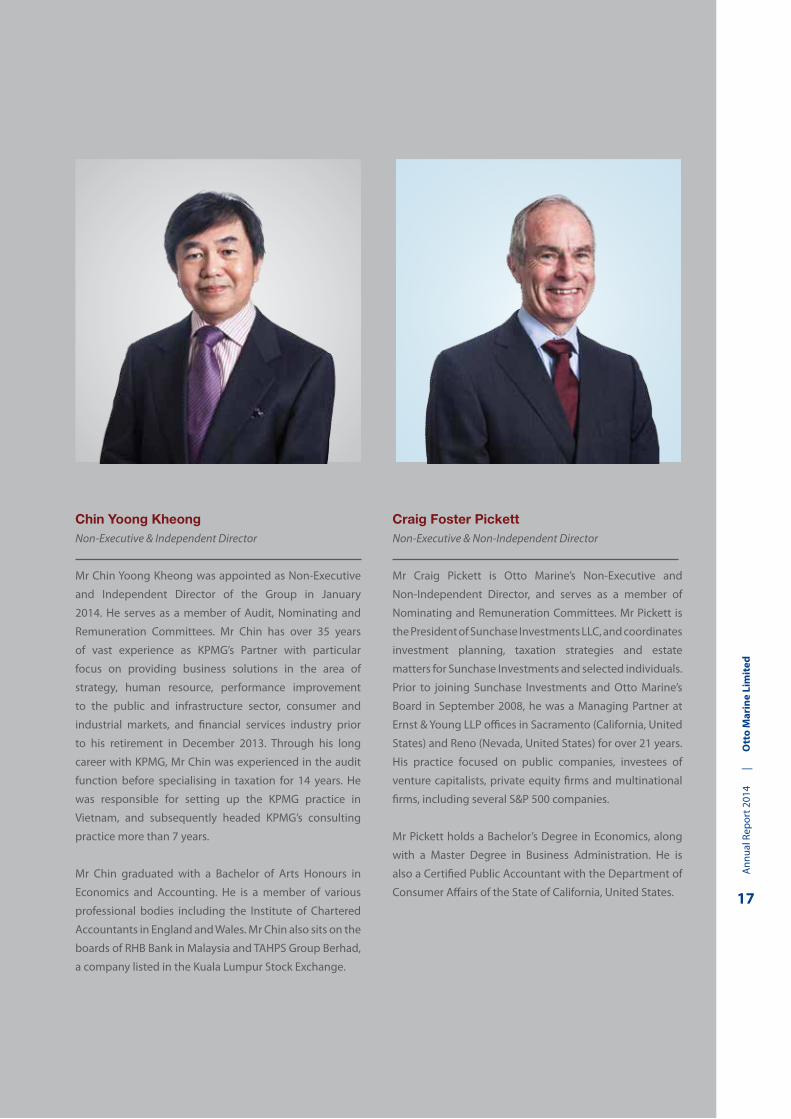
Chin Yoong KheongNon-Executive & Independent Director
Mr Chin Yoong Kheong was appointed as Non-Executive
and Independent Director of the Group in January
2014. He serves as a member of Audit, Nominating and
Remuneration Committees. Mr Chin has over 35 years
of vast experience as KPMG’s Partner with particular
focus on providing business solutions in the area of
strategy, human resource, performance improvement
to the public and infrastructure sector, consumer and
industrial markets, and financial services industry prior
to his retirement in December 2013. Through his long
career with KPMG, Mr Chin was experienced in the audit
function before specialising in taxation for 14 years. He
was responsible for setting up the KPMG practice in
Vietnam, and subsequently headed KPMG’s consulting
practice more than 7 years.
Mr Chin graduated with a Bachelor of Arts Honours in
Economics and Accounting. He is a member of various
professional bodies including the Institute of Chartered
Accountants in England and Wales. Mr Chin also sits on the
boards of RHB Bank in Malaysia and TAHPS Group Berhad,
a company listed in the Kuala Lumpur Stock Exchange.
Craig Foster PickettNon-Executive & Non-Independent Director
Mr Craig Pickett is Otto Marine’s Non-Executive and
Non-Independent Director, and serves as a member of
Nominating and Remuneration Committees. Mr Pickett is
the President of Sunchase Investments LLC, and coordinates
investment planning, taxation strategies and estate
matters for Sunchase Investments and selected individuals.
Prior to joining Sunchase Investments and Otto Marine’s
Board in September 2008, he was a Managing Partner at
Ernst & Young LLP offices in Sacramento (California, United
States) and Reno (Nevada, United States) for over 21 years.
His practice focused on public companies, investees of
venture capitalists, private equity firms and multinational
firms, including several S&P 500 companies.
Mr Pickett holds a Bachelor’s Degree in Economics, along
with a Master Degree in Business Administration. He is
also a Certified Public Accountant with the Department of
Consumer Affairs of the State of California, United States.
Ann
ual R
epor
t 201
4
|
O
tto
Mar
ine
Lim
ited
17

KeyManagement
Chong Sieh JiuanChief Financial Officer – Otto Marine
Ms Chong Sieh Jiuan is currently the Chief Financial Officer cum Joint Company Secretary for Otto Marine Limited. Ms Chong joined the Company in 2008 as Chief Accounting Officer and was promoted to Chief Financial Officer effective 1 January 2015. As Chief Financial Officer, Ms Chong is responsible for the Group’s financial and management reporting, treasury, internal system of control and procedures, corporate finance, governance and regulatory compliance and contracts review and administration. Ms Chong will also be responsible to provide proactive and timely financial advice and support to the operating businesses units. Reporting to Michael See, Group Executive Director of Otto Marine Limited, Ms Chong will also continue to assume the role as Joint Company Secretary.
Prior to joining Otto, Ms Chong was an auditor with Deloitte for approximately 10 years and CC Yang & Associates for approximately 3 years. She brought to the Group a robust knowledge of the statutory reporting requirements and compliance matters.
Ms Chong is a Chartered Accountant and graduated with a Bachelor of Accountancy.
Mok Kim WhangPresident, Shipyard – PT Batamec
Mr Mok Kim Whang joined Otto Marine in March 2013 as President of our Shipyard. Mr Mok has invaluable experience of over 46 years in the marine industry. Prior to joining us in March 2013, he was the President of Keppel Philippine Marine Inc. Mr Mok has held various other senior positions such as senior General Manager of Pan United Shipyard, Senior Vice President of ST Marine, senior General Manager of ASL, and General Manager Keppel Shipyard.
Mr Mok is a Marine Engineer by training, and successfully completed the Program for Management Development from Harvard Business School in 1995.
Lum Kin WahSenior Executive Vice President, Shipyard – PT Batamec
Mr Lum Kin Wah rejoined Otto Marine in March 2013 as Senior Executive Vice President to support shipbuilding operations. Mr Lum has more than 40 years of experience in the marine industry, rising from apprentice to a General Manager and Director in various companies including Keppel Philippines and PT Pan-United Shipyard, Indonesia. Prior to rejoining Otto, Mr Lum has held various senior positions, including Executive Director of DDW-PaxOcean Pertama Shipyard, Batam, and Managing Director of Nexus Engineering Pte Ltd, a member of the Labroy Engineering Group.
Mr Lum holds a Technician Diploma in Mechanical Engineering and a Bachelor of Science degree in Naval Architecture. He is a Chartered Engineer registered with the United Kingdom’s Engineering Council, and a member of the Royal Institute of Naval Architecture. He is also a member of the Society of Naval Architects and Marine Engineers Singapore.
Ann
ual R
epor
t 201
4
|
O
tto
Mar
ine
Lim
ited
18

Michael Sean KellyManaging Director – Africa
Mr Michael Sean Kelly joined Global Workboats (GWB) as Managing Director in July 2010. Since the operations of GWB has been merged with GO Offshore (Asia) Pte Ltd, he is responsible for operating the Accommodation Construction Maintenance Vessels globally and any fleet vessels based in Africa and securing contracts for these vessels. He has been in the maritime industry for more than 36 years, starting as an apprentice officer on offshore vessels in the late 1970s and rising to the position of Master Mariner by the age of 27. He came onshore after 15 years as Master on Anchor handlers and Accommodation workboats and took on management roles for over 15 years in South East Asia and West Africa representing ship owners. Prior to that, he was a Production Superintendent for DeBeers Marine in Cape Town, an Operations Manager in Global Industries and a Business Development Manager in Nautika Sdn Bhd. Mr Kelly also started his first own crewing business and owner operator of workboats back in 2005-Fleetchange and SeaSafe which then he sold the two Companies in 2009.
Mr Kelly graduated with a Masters in Business Administration in 2005.
Eric Ang Kim ChoonGeneral Manager - United Arab Emirates
Mr Eric Ang Kim Choon joined Otto Marine in 2006 and is currently the General Manager heading our operations in the United Arab Emirates, overseeing the Group’s business in the Persian Gulf region. Mr Ang has over 30 years of experience encompassing both operational and management roles in the building materials sector, including ready mix concrete, cement, quarrying, ceramic and precast. He also played an important role during his tenure with Resources Development Corporation Ltd in his capacity as assistant general manager, where he set up the marine business including tugs and barges operations in Singapore. During his tenure with NatSteel Ltd subsidiary companies from 1991 to 2006, Mr Ang was General Manager of Eastern Concrete Pte Ltd, National Cement Industries Pte Ltd and Eastern Bricks Pte Ltd.
Mr Ang graduated with a Bachelor of Engineering (Civil) degree in 1978, and received a Diploma in Business Administration in 1987. Mr Ang also holds a Master in Business Administration in 1992. He is a Professional Civil Engineer certified by the Professional Engineers Board of Singapore and a Senior Member of The Institution of Engineers Singapore.
Ann
ual R
epor
t 201
4
|
O
tto
Mar
ine
Lim
ited
19

FY10* FY11 FY12 FY13 FY14
Shipyard 350.4 104.6 55.4 222.8 81.1
Shipping and Chartering 28.3 241.8 276.3 265.8 243.8
Specialised Services 45.8 68.4 42.7 23.4 31.0
Total 424.5 414.8 374.4 512.0 355.9
REVENUE (US$’ MiL)
FY10 FY11 FY12 FY13 FY14Current Assets 668.5 734.9 724.6 708.1 609.1
Non-current Assets 529.6 526.5 453.2 573.7 604.3
Total Assets 1,198.1 1,261.4 1,177.8 1,281.8 1,213.4
Current Liabilities 552.5 661.3 688.0 661.8 562.7
Non-current Liabilities 279.4 322.5 267.0 316.0 390.1
Total Liabilities 831.9 983.8 955.0 977.8 952.8
Equity attributable to Otto Marine’s shareholders 366.5 296.6 239.5 304.0 263.1
FY10* FY11 FY12 FY13 FY14Net cash from (used in) operating activities (116.9) (87.4) 62.1 114.9 36.2
Net cash from (used in) investing activities (107.9) 26.3 (24.4) (42.8) (64.7)
Net cash from (used in) financing activities 183.4 15.0 (60.6) (71.6) (0.3)
Net increase (decrease) in cash and cash equivalent (41.4) (46.1) (22.9) 0.5 (28.8)
Effects of exchange rate changes on the balance of cash held in foreign currencies (3.3) (1.4) 0.5 0.7 (2.4)
Cash and cash equivalent at the beginning of the year 161.4 116.7 69.2 46.8 48.0
Cash and cash equivalent at the end of the year 116.7 69.2 46.8 48.0 16.8
FY10* FY11 FY12 FY13 FY14Revenue 424.5 414.8 374.4 512.0 355.9
Gross Profit 66.5 3.8 8.4 46.5 20.7
EBITDA 45.4 (20.5) (66.8) 62.6 20.3
EBIT 38.9 (37.6) (89.2) 39.7 (11.3)
Net profit (loss) for the year 27.5 (56.1) (113.7) 15.9 (41.6)
Net profit (loss) attributable to shareholder 29.8 (52.2) (103.1) 14.1 (41.7)
CONSOLiDATED BALANCE SHEET (US$’ MiL)
CONSOLiDATED STATEMENT OF CASH FLOW (US$’ MiL)
CONSOLiDATED PROFiT AND LOSS STATEMENTS (US$’ MiL)
FinancialHighlights
Ann
ual R
epor
t 201
4
|
O
tto
Mar
ine
Lim
ited
20

Ann
ual R
epor
t 201
4
|
O
tto
Mar
ine
Lim
ited
21
CorporateGovernance Report
The Board of Directors of Otto Marine Limited (the “Board”) recognises the importance of and is committed to
maintaining a high standard of corporate governance. The Company is guided in its corporate governance practices by
the Code of Corporate Governance 2012 (the “Code”) so as to protect shareholders’ interests and enhance long-term
shareholders’ value and corporate transparency. This Corporate Governance Report outlines the Group’s corporate
governance processes and activities during the fi nancial year ended 31 December 2014 (“FY2014”) with specifi c
reference to the Code.
PRINCIPLE 1: BOARD’S CONDUCT OF ITS AFFAIRS
The Board is responsible for the overall direction and management of the Group. Its role involves the protection and
enhancement of long-term shareholders’ value, the safe-guarding of shareholders’ and other stakeholders’ interests,
and the Company’s assets through the enhancement of corporate performance and accountability. The Board oversees
and approves the formulation of our Group’s overall long-term strategic objectives and directions, and sets its values
and standards. It is responsible for the Group’s overall performance objectives, long term fi nancial objectives, annual
budget, material investments and divestments, public fund raising exercises, quarterly and annual fi nancial performance
reviews, risk management, corporate governance practices, and ensuring the Group’s compliance with all laws and
regulations relevant to the Group’s business. The Board also considers sustainability issues, such as environmental and
social factors, as part of its strategic formulation of the Group’s objectives and directions. In addition to the foregoing,
the Board also approves the policies and guidelines of the Group, Key Management appointments, an adequate
remuneration framework and the nomination of Directors.
The Board has adopted a set of internal controls and guidelines for the Management to operate within. These internal
controls and guidelines set authorisation and approval limits for operating matters. In addition, certain matters that
specifi cally require the Board’s approval, including material investments and divestments, public fund raising exercises,
issues of new shares, and proposed dividends. The Board makes the foregoing decisions with the objective to
maximize the returns to shareholders. To assist in the execution of its responsibilities, the Board has established the
following three (3) committees:
a. the Audit Committee (the “AC”);
b. the Nominating Committee (the “NC”); and
c. the Remuneration Committee (the “RC”).
Each committee functions within clearly defi ned terms of reference and operating procedures.
The Board conducts scheduled meetings on a quarterly basis. Ad-hoc meetings can also be convened when
circumstances require. If necessary, Board meetings may be conducted by way of telephone or video conferencing as
permitted under Article 116 of the Company’s Articles of Association.
For FY2014, the Company held four (4) meetings of the AC, two (2) meetings of the NC, two (2) meetings of the RC
and four (4) meetings of the Board. The attendance of the Directors at meetings of the Board and committees as well
as the frequency of such meetings, are disclosed below. Notwithstanding such disclosure, the Board is of the view
that the contribution of each Director should not be focused only on his attendance at meetings of the Board and/or
committees. A Director’s contribution extends beyond the confi nes of the formal environment of such meetings, through
the sharing of views, advice, experience and strategic networking relationships which would further the interests of the
Company.
The Company worked closely with a professional corporate secretarial fi rm, DMS Corporate Services Pte. Ltd., to
provide its Directors with regular updates on the latest corporate governance and listing policies. The Directors are
provided with updates on changes in the relevant laws and regulations from time to time to enable them to make
informed decisions and to ensure that they are competent in carrying out their expected roles and responsibilities. The
Board may also request further explanations, briefi ngs or information on any aspect of the Company’s operations or
business issues from the Management. During the year, the Board was briefed and/or updated on the changes under
the Code and on general duties and responsibilities of directors under the relevant legislation.
The Board ensures that each new Director receives an induction upon joining the Board to ensure that they understand
their duties as directors and how to discharge such duties. New Directors are encouraged to go to the Company
shipyard and other facilities. Meetings with Key Management are also conducted to familiarise the new Directors with
the business activities, strategic directions, policies and corporate governance practices of the Group.

Ann
ual R
epor
t 201
4
|
O
tto
Mar
ine
Lim
ited
22
CorporateGovernance Report
As part of the Company’s continuing education programme for all Directors, the Board encourages Directors to attend
relevant seminars and courses conducted by the Singapore Institute of Directors (“SID”) and the SGX-ST at the
Company’s expenses.
Directors’ Attendance at Board and Board Committee Meetings in FY2014
Name of Director Board AC NC RC
Number of Meetings held:
4
Number of Meetings held:
4
Number of Meetings held:
2
Number of Meetings held:
2
Meetings attended
Meetings attended
Meetings attended
Meetings attended
Yaw Chee Siew 4 4* 2* 2*
Garrick James Stanley 4 4* 2* 2*
Michael See Kian Heng 4 4* 2* 2*
Heng Hock Cheng @ Heng Heyok Chiang 4 4 2 2
Ng Quek Peng 4 4 2 2
Chin Yoong Kheong 4 4 2 2
Craig Foster Pickett 3 3* 2 2
* By invitation.
PRINCIPLE 2: BOARD COMPOSITION AND GUIDANCE
As at 31 March 2015, the Board has seven Directors, comprising three Executive Directors, three Independent Directors
and one Non-Executive Director. The Directors are:
Name of Director PositionDate of fi rst appointment
Date of last re-appointment
Yaw Chee Siew Executive Chairman 15 August 2001 30 April 2014
Garrick James Stanley Executive Director and Group Chief
Executive Offi cer (“Group CEO”)
6 August 2013 30 April 2014
Michael See Kian Heng Group Executive Director 18 March 2013 31 May 2013
Heng Hock Cheng @
Heng Heyok Chiang
Lead Independent Director 1 January 2011 30 April 2014
Ng Quek Peng Independent Director 1 August 2012 31 May 2013
Chin Yoong Kheong Independent Director 1 January 2014 30 April 2014
Craig Foster Pickett Non-Executive Director 3 September 2008 31 May 2013
The Board from time to time examines its size and considers the appropriateness of the size and number of Board
committees. The Board considers that the current Board size of seven Directors, and the three Board committees,
the AC, NC and RC, are appropriate for effective decision-making, taking into account the scope and nature of the
operations of the Group.
The Management and the Company benefi t from the Board’s varied and objective perspectives on issues brought
before it. The NC and the Board consider that the Directors possess the necessary experience and knowledge to lead
the Group effectively. The profi le of each of the Directors is provided in the “Board of Directors” section on pages 14 to
17 of this Annual Report.
Board changes in FY2014
Mr Michael See Kian Heng, who is also an Executive Director of the Company, stepped down from his position as
Group Chief Financial Offi cer and was promoted to Group Executive Director with effect from 3 February 2014.
Mr Chin Yoong Kheong was appointed to the Board as an Independent Director with effect from 1 January 2014. Mr
Chin Yoong Kheong was also appointed as a member of the AC, NC and RC.
Ann
ual R
epor
t 201
4
|
O
tto
Mar
ine
Lim
ited
23
CorporateGovernance Report
Non-Executive and Independent Directors
Mr Heng Hock Cheng @ Heng Heyok Chiang, Mr Ng Quek Peng and Mr Chin Yoong Kheong who are our Independent
Directors, do not have any existing business or professional relationship with our Group, our Directors or Substantial
Shareholders. Mr Heng Hock Cheng @ Heng Heyok Chiang is the Lead Independent Director and is a member of the
AC. Mr Heng Hock Cheng @ Heng Heyok Chiang is also the chairman of the NC and RC. Mr Ng Quek Peng is the
chairman of the AC and is also member of the NC and RC.
Mr Craig Foster Pickett is a Non-Executive Director of our Company and is not considered independent, owing to
his ongoing business relationship with the Executive Chairman, Mr Yaw Chee Siew. Mr Craig Foster Pickett does not
provide the Group with any professional services other than being a Director of the Board. Mr Craig Foster Pickett is
also a member of the NC and RC.
The Non-Executive Directors and Independent Directors participate actively in the Board committees. They are free to
request further clarifi cation and also have separate and independent access to our Key Management. The profi le of
each of the Key Management is provided in the “Key Management” section on pages 18 to 19 of this Annual Report. If
necessary, the Non-Executive Directors may initiate meetings to address any specifi c matter involving any other member
of our Management. The Non-Executive Directors are also encouraged to meet regularly without the presence of
Management.
PRINCIPLE 3: CHAIRMAN AND CHIEF EXECUTIVE OFFICER
There is a clear separation of the roles and responsibilities of our Executive Chairman, our Group CEO and our Group
Executive Director.
Role of the Executive Chairman
Mr Yaw Chee Siew is the Executive Chairman of the Board and together with the other members of the Executive
Committee, is responsible for the charting of the Group’s strategic direction and devising strategies to facilitate the
growth of the Group. The Executive Committee comprises of the Executive Chairman, the Group CEO and the Group
Executive Director. The Executive Committee, in addition to planning the Group’s strategic direction, also meets regularly
to decide and execute said strategies. The Executive Chairman may decide to add or replace the members of the
Executive Committee from time to time as may be appropriate.
Mr Yaw Chee Siew also facilitates and ensures active and comprehensive Board discussions on Company matters and
monitors the translation of the Board’s decisions into executive actions. He exercises control over the quality, quantity
and timeliness of information fl ow between the Board, the Management and the shareholders. Discussions between
the Board and Key Management and between the Executive Directors and Non-Executive Directors are generally open,
frank and constructive.
Role of the Group CEO
Mr Garrick James Stanley is the Group CEO; he is supported by the Group Executive Director and the other
Key Management, including the heads of the various business units within the Group. Mr Garrick James Stanley is
responsible for driving the performance and profi tability of the Group. He also executes the Board’s decisions,
implements the Group’s strategies and policies, and oversees the conduct of the Group’s day to day operations.
Role of the Group Executive Director
Mr Michael See Kian Heng is the Group Executive Director. He reports to the Executive Chairman on matters relating
to the Board and corporate governance, and to the Group CEO on business activities. Mr Michael See Kian Heng also
supports the Group CEO in the conduct of the day to day operation of the Group’s business, in particular, in providing
corporate shared services, including fi nance and accounting, funding, investor relations, corporate secretarial services,
procurement, offi ce administration and information technology. He is supported by the CFO, the Head of Treasury and
other Key Management.
Ann
ual R
epor
t 201
4
|
O
tto
Mar
ine
Lim
ited
24
CorporateGovernance Report
Role of the Lead Independent Director
Mr Heng Hock Cheng @ Heng Heyok Chiang as the Lead Independent Director meets periodically with the Independent
Directors without the presence of the other Directors. After such meetings, he provides feedback to the Executive
Chairman. Mr Heng Hock Cheng @ Heng Heyok Chiang is also available to shareholders, in respect of matters where
they have concerns and for which, contact through the normal channels of the Executive Chairman, the Group CEO or
the Group Executive Director may not be appropriate or have failed to resolve.
With the establishment of various committees with the power and authority to perform key functions beyond the
authority of, or without undue infl uence from the Executive Chairman or the Group CEO, the appointment of the Lead
Independent Director, and the implementation of various internal controls to allow for effective Board oversight, the
Board is of the view that there are adequate accountability safeguards to enable the Board to exercise independent
decision making and to ensure an appropriate balance of power and authority within the letter and the spirit of good
corporate governance.
PRINCIPLE 4: BOARD MEMBERSHIP
Nominating Committee
The Board has set up the NC to ensure that there is a formal and transparent process for the appointment of new
Directors to the Board. The NC consists of three (3) Independent Directors and one (1) Non-Executive Director. Its
members are Mr Heng Hock Cheong @ Heng Heyok Chiang, Mr Ng Quek Peng, Mr Chin Yoong Kheong and Mr Craig
Foster Pickett. The chairman of the NC is Mr Heng Hock Cheng @ Heng Heyok Chiang who is the Lead Independent
Director of the Company. The NC is guided by written terms of reference which clearly set out its authority and duties.
The NC is responsible for, inter-alia:
reviewing and making recommendations to the Board on all candidates nominated for appointment to the Board
and on re-nomination of the Directors, taking into account the composition and progressive renewal of the Board
and each Director’s competencies, commitment, prior contribution and performance;
making recommendations to the Board on matters relating to the review of board succession plans for Directors
including the Executive Chairman and Group CEO, the development of a process for evaluating the performance
of the Board, its committees and Directors and on the review of training programmes for the Board;
determining annually and as and when circumstances require whether or not a Director is independent;
deciding whether or not a Director with multiple board representation is able to and has been adequately
carrying out his duties as a Director; and
evaluating the effectiveness of the Board, the Board committees and Directors.
The NC appraises the performance of the Board, Board committees and the contribution of each Director to the
effectiveness of the Board. The NC decides on a set of objective performance criteria on how the Board’s performance
is to be evaluated and the evaluation outcome is discussed at the NC meeting and deliberated and approved by
the Board. This set of performance criteria will address how the Board has enhanced long-term shareholders’ value.
Each member of the NC is required to abstain from voting on any resolution and making any recommendations and/
or participating in any deliberations of the NC in respect of the assessment of his performance or re-nomination as
Director.
The Company’s Articles of Association require one-third of our Directors to retire and subject themselves to re-election
by shareholders at every Annual General Meeting of the Company (the “AGM”) (the “one-third rotation rule”). Retiring
Directors are selected on the basis of their length of service since their last re-election. For Directors who are re-elected
on the same day, the Director(s) to retire shall be determined by agreement among themselves or failing which, by lot.
Under Article 89 of the Company’s Articles of Association, the one-third rotation rule does not apply to the person
holding the position of Managing Director or an equivalent position and he shall not be subject to retirement or rotation
or taken into account in determining the rotation or retirement of Directors. The appointment of the Managing Director
or an equivalent position is for a fi xed term not exceeding fi ve (5) years. The NC considers the provision adequate and
does not recommend any change to the Company’s Articles of Association. Pursuant to the one-third rotation rule, Mr
Michael See Kian Heng, Mr Ng Quek Peng and Mr Craig Foster Pickett will submit themselves for retirement and seek
re-election by shareholders at the forthcoming AGM.

Ann
ual R
epor
t 201
4
|
O
tto
Mar
ine
Lim
ited
25
CorporateGovernance Report
The directorships, both present and those held over the preceding three (3) years in other listed companies by the
Directors, as well as their other principal commitments1, are as follows:
NamePresent directorships / other principal commitments
Past directorships
Yaw Chee Siew Otto Marine Limited
Perdana Parkcity Sdn Bhd2
Nil
Garrick James Stanley Otto Marine Limited Nil
Michael See Kian Heng Otto Marine Limited
Nippecraft Limited
Nil
Heng Hock Cheng @Heng Heyok Chiang Otto Marine Limited
Malaysia Marine and Heavy Engineering
Holdings Berhad
AET Tankers Holding Sdn. Bhd.2
Dialog Group Berhad (as advisor) 1
Employee Provident
Fund (EPF) Malaysia
Ng Quek Peng Otto Marine Limited
Japfa Limited
Zico Holdings Inc.
Halcyon Capital Pte. Ltd.2
Asia Pacifi c Port Holdings Pte. Ltd.2
Mapletree Logistics
Trust Management
Ltd
Chin Yoong Kheong Otto Marine Limited
TAHPS Group Berhad
Taiko Clay Chemicals Sdn. Bhd.2
KPMG Malaysia
group of companies
Craig Foster Pickett Otto Marine Limited
Sunchase Investments LLC3
Nil
1 Principal commitments as defi ned in the Code include all commitments which involve signifi cant time commitment such as
full-time occupation, consultancy work, committee work, non-listed company board representations and directorships and
involvement in non-profi t organisations. Where a director sits on the boards of non-active related corporations, these are not
normally considered principal commitments.
2 Principal commitment as director of a private limited company.
3 Principal commitment as the president of a limited liability company.
The NC, from time to time, will also deliberate on whether a Director is able to and has been adequately carrying out
his duties as a Director of the Company, taking into consideration the Director’s number of listed company board
representations and other principal commitments. To ensure the Directors who hold multiple board representations are
able to and have been devoting suffi cient time to discharge their responsibilities adequately, the NC and the Board have
determined the maximum number of board representations on listed companies that their Directors may hold is six (6),
including a board representation on the Company.
PRINCIPLE 5: BOARD PERFORMANCE
All Directors assess the performance of the Board, Board committees and each Director and the feedback and
comments received from the Directors are considered and reviewed by the NC, which has the responsibility of assisting
the Board in the evaluation of the Board’s and Board committees’ effectiveness. Factors such as the (1) structure and
size of the Board and Board committees, (2) the manner in which the Board and Board committees meetings are
conducted, (3) the Board’s access to information, (4) access to Key Management (5) Board and Board committees
accountability, and (6) access to external experts outside the meetings are applied to evaluate the Board’s, Board
committees’ and each Director’s performance. The assessment of the Executive Chairman’s performance is also
undertaken by each Director. Each member of the NC abstains from making any recommendations and/or participating
in any deliberation of the NC and from voting on any resolution, in respect of the assessment of his own performance or
re-nomination as a Director. The NC held two (2) meetings during FY2014.
In reviewing the overall Board performance, the NC also took into consideration the Board’s ability to monitor
Management’s achievement of the strategic directions/objectives set and approved by the Board.

Ann
ual R
epor
t 201
4
|
O
tto
Mar
ine
Lim
ited
26
CorporateGovernance Report
Assessment parameters for Directors’ performance include their level of participation at Board and committee meetings
and the quality of their contribution to Board processes and the business strategies and performance of the Group.
The NC’s evaluation of the individual Directors for FY2014 was facilitated with feedback from individual Directors on
areas relating to the Board’s competencies and effectiveness. Based on the above assessment parameters, the NC
had evaluated the performance of the Board and the individual Directors for FY2014 to be satisfactory. The results of
the evaluation process were also used by the NC, in its consultation with the Executive Chairman to effect continuing
improvements on Board processes.
PRINCIPLE 6: ACCESS TO INFORMATION
The Board is entitled and free to request further clarifi cation and additional information as needed to make informed
decisions during the discharge of their duties and responsibilities as Directors. It also has separate and independent
access to Key Management, as well as to the Joint Company Secretaries. In the furtherance of their duties, Directors
may consult independent professional advice, if necessary, at the Group’s expense.
The Directors are provided with board papers and related materials (the “Board Papers”) before each meeting of the
Board to enable them to be properly informed of matters to be discussed and/or approved. Board Papers contain both
regular items such as quarterly fi nancial statements, management reports and year-end fi nancial statements, as well
as matters for the decision or information of the Board. From time to time, our Management will brief the Directors at
Board meetings when there are changes in regulations and/or accounting standards which may have an impact on the
disclosure obligations or the fi nancial position of the Company. Directors are also given analysts’ reports, media and
market reports so that they are apprised of the market’s views and relay to the Company’s performance. In addition, the
Directors are entitled to request from Management any additional information as may be needed to enable the Directors
to make informed decisions.
As a general rule, Board Papers are distributed to the Directors at least two (2) days before each meeting. When
necessary, additional information will be provided during the Board meetings. The Joint Company Secretary(ies)
attend(s) all Board and committee meetings and is responsible for, among other things, ensuring that Board procedures
are observed and that applicable rules and regulations are complied with.
Under the direction of the Executive Chairman, the Joint Company Secretaries’ responsibilities include ensuring good
information fl ows within the Board and its Board committees and between Key Management and Non-Executive
Directors, advising the Board on all governance matters, as well as facilitating orientation and assisting with professional
development as required.
PRINCIPLE 7: PROCEDURES FOR DEVELOPING REMUNERATION POLICIES
The RC consists of three (3) Independent Directors and one (1) Non-Executive Director. Its members are Mr Heng Hock
Cheng @ Heng Heyok Chiang (also Lead Independent Director), Mr Ng Quek Peng, Mr Chin Yoong Kheong and Mr
Craig Foster Pickett. The chairman of the RC is Mr Heng Hock Cheng @ Heng Heyok Chiang. The RC held two (2)
meetings during FY2014.
The RC is guided by written terms of reference which clearly set out its authority and duties.
The RC is responsible for (1) recommending to the Board a framework of remuneration for our Directors and Key
Management, including our Executive Chairman, Group CEO, Group Executive Director, CFO, President (Shipyard)
and other Key Management of equivalent function and responsibility, (2) reviewing and recommending to the Board,
remuneration packages for each of them, (3) ensuring the independence and objectivity of the remuneration consultant
appointed by the Company, if any, and (4) administering the Share Award Scheme. Recommendations of the RC
are submitted to the Board for approval. Each member of the RC will abstain from voting on any resolutions and
making recommendations and/or participating in any deliberations of the RC with respect to his fees or remuneration
package. If a member of the RC has an interest in a matter being deliberated by the committee, he must abstain from
participating in the review and the approval process of the RC in relation to that matter.
The RC also reviews the Company’s obligations arising in the appointment, revision and amendments and termination
of the Executive Directors’ and Key Management’s contracts of service, to ensure that such contracts of service contain
fair and reasonable terms, and termination clauses which are not overly generous.
The Company had previously engaged Carrot Consulting as consultant to assist in the remuneration-framework and the
specifi c remuneration packages. Carrot Consulting does not have any relationships with the Group.

Ann
ual R
epor
t 201
4
|
O
tto
Mar
ine
Lim
ited
27
CorporateGovernance Report
PRINCIPLE 8: LEVEL AND MIX OF REMUNERATION
In setting the remuneration framework, the RC takes into account the respective performance of the Group and of each individual. In its deliberation, the RC takes into consideration remuneration packages and employment conditions within the industry and benchmark against comparable companies. It also takes into consideration the interest of shareholders. No Director is involved in deciding his own fees, remuneration, compensation, options or any form of benefi ts to be granted to him, except for providing information and documents specifi cally requested by the RC to assist in its deliberations.
The RC reviews the service contracts between an Executive Director and the Company to ensure it is comparable to industry standards before giving its recommendations to the Board.
The RC recognises that the level and structure of remuneration should be aligned with the long-term interest and risk policies of the Company and should attract, retain and motivate the Directors to provide good stewardship of the Company and to ensure that Key Management successfully manages the Company. The Company links the remuneration paid to the Executive Directors and Key Management to the Company’s and each individual’s performances, based on an annual appraisal and using indicators such as core values, competencies, key result areas, performance rating, and potential of the employees. Due to the adverse economic condition following the collapse of the oil price, the directors’ fees for FY2014 and the salary of Executive Directors and Key Management effective March 2015 have been reduced as part of measures to contain overall costs.
Share Award Scheme
To better align the interests of Directors and employees with the interests of the Company, the Company has in place a share-based incentive plan (the “Share Award Scheme”) which allows its Directors and certain of its Key Management and other employees to participate in the Company’s growth. It was introduced in order for the Company to provide the
Directors (excluding Mr Yaw Chee Siew), Key Management and senior employees (the “Participants”), a stronger and more lasting sense of identifi cation with the Company.
Participants who show superior performance in driving the growth of the Company by achieving medium to long term corporate objectives, including market competitiveness, business growth, productivity growth, and quality of returns will be considered by the RC for an award under the Share Award Scheme.
Subject to the endorsement of the RC and approval from the Board, the Participants are conferred rights to be
issued or transferred Shares in the Company (the “Award Shares”) or their cash equivalent or a combination of both
(collectively, the “Award”). It also strengthens the Company’s competitiveness in attracting and retaining talented key executives and aligns the interests of key executives with that of shareholders in improving performance and achieving sustainable growth for the Company and fostering an ownership culture amongst key executives.
PRINCIPLE 9: DISCLOSURE OF REMUNERATION
The Executive Chairman is an executive position and he has a service contract that covers a period of three (3) years and includes performance bonuses, profi t sharing and other employment benefi ts. The Non-Executive Directors and Independent Directors receive directors’ fees for their responsibilities and contributions to the Board. The fees are recommended by the Board of Directors and subject to shareholders’ approval at the AGM on a lump-sum basis. The Executive Chairman, Group CEO and Group Executive Director do not receive any directors’ fees.
There is no employee of the Group who is an immediate family member of a Director whose remuneration exceeds S$50,000 for FY2014.
For FY2014, the fees for Non-Executive Directors comprised a basic retainer fee and additional fees for appointment to a committee. The framework for determining our Non-Executive Directors’ Fees is as follows:
Type Position Amount
Non-Executive Directors’ Fees Basic Retainer Fee for Director S$32,000 per annum
Fee for Appointment to AC Committee chairman S$28,800 per annum
Committee member S$16,000 per annum
Fee for Appointment to NC Committee chairman S$14,400 per annum
Committee member S$ 8,000 per annum
Fee for Appointment to RC Committee chairman S$14,400 per annum
Committee member S$ 8,000 per annum

Ann
ual R
epor
t 201
4
|
O
tto
Mar
ine
Lim
ited
28
CorporateGovernance Report
The proposed framework for Non-Executive Directors’ Fees for FY2014 is the same as that for FY2013 except for a reduction in the fees for FY2014.
The remuneration received by the Company’s Executive Directors and Key Management is made up of fi xed and variable components. The fi xed component is determined by the current market rate for equivalent executives of comparable experience and expertise, and the variable component is determined by their individual and the Company’s performances and whether their performance objectives are met. The fi nal remuneration amount is subject to the recommendation of the RC and approval of the Board.
Due to the highly competitive market for executive talent, the Board has on review decided that it is in the best interests of the Company and the shareholders not to disclose the remuneration of the Company’s Executive Directors or Key Management.
Remuneration of Non-Executive and Independent Directors
The remuneration of Non-Executive and Independent Directors will be paid 70% in cash and 30% in shares. The aggregate compensation paid to Non-Executive Directors for their services for FY2014 is set out in the table below.
Non-Executive Director Tenure Fees FY2014Heng Hock Cheng @ Heng Heyok Chiang Full FY2014 S$76,800
Ng Quek Peng Full FY2014 S$76,800
Chin Yoong Kheong Full FY2014 S$64,000
Craig Foster Pickett Full FY2014 S$48,000
TOTAL S$265,600
Details of remuneration of Directors in percentage
Details (in percentage terms) of the remuneration paid to the Directors for FY2014 are set out below:
Remuneration Bands Salary BonusProfi t
SharingShares
Awarded Allowance Benefi ts FeesStatutory
Contribution TotalCurrent Directors
S$2,500,000 to S$2,750,000
Garrick James Stanley 18% 4% – 70% 4% 4% – – 100%
S$500,000 to S$750,000
Michael See Kian Heng 54% 17% – 22% 5% 1% – 1% 100%
S$250,000 to S$500,000
Yaw Chee Siew 96% – – – – 2% – 2% 100%
Less than S$250,000
Heng Hock Cheng @Heng
Heyok Chiang – – – – – – 100% – 100%
Ng Quek Peng – – – – – – 100% – 100%
Chin Yoong Kheong – – – – – – 100% – 100%
Craig Foster Pickett – – – – – – 100% – 100%
Remuneration of Key Management
Details (in percentage terms) of the remuneration paid to Key Management for FY2014 are set out below:
Remuneration Bands Salary BonusProfi t
SharingShares
Awarded Allowance Benefi ts FeesStatutory
Contribution Total
S$500,000 to S$750,000
Mok Kim Whang 74% 18% – – 6% 1% – 1% 100%
Lum Kin Wah 68% 17% – – 12% 1% – 2% 100%
S$250,000 to S$500,000
Eric Ang Kim Choon 57% 9% – – 32% – – 2% 100%
Less than S$250,000
Michael Sean Kelly 100% – – – – – – – 100%
Chong Sieh Jiuan 75% 18% – – – 1% – 6% 100%
TOTAL 76% 11% – – 9% 1% – 3% 100%

Ann
ual R
epor
t 201
4
|
O
tto
Mar
ine
Lim
ited
29
CorporateGovernance Report
Summary of remuneration to Directors and Key Management for FY2014
Details of the aggregate remuneration paid to Directors and Key Management for FY2014 are set out below:
Short-term benefi ts (S$’000)
Post-employment
benefi ts (S$’000)
Director’s Fee
(S$’000)
Share awards (S$’000)
Profi tsharing (S$’000)
Total (S$’000)
Directors 1,860 20 266 2,041 – 4,187
Key Management 1,818 36 – – – 1,854
Total 3,678 56 266 2,041 – 6,041
Share Award Scheme
The details of the Share Award Scheme are set out in Principle 8 above.
PRINCIPLE 10: ACCOUNTABILITY
The Board provides shareholders with quarterly and annual fi nancial reports. Results for the fi rst three quarters are
released to shareholders within 45 days of the end of the quarter. Annual fi nancial results are released within 60 days
of the fi nancial year-end. In presenting the quarterly and annual fi nancial statements to shareholders, the Board aims to
provide shareholders with a balanced and clear assessment of the Group’s position and prospects with a commentary
at the date of the announcement of the signifi cant trends and competitive conditions of the industry in which the Group
operates.
The Management provides all Directors with a quarterly fi nancial summary of the Group’s performance.
The Directors recognise that they have overall responsibility to ensure accurate fi nancial reporting for the Group and
for the Group’s system of internal controls. The Board confi rms that, with the assistance of the AC, it reviews the
effectiveness of the Group’s fi nancial reporting and internal controls system, which are monitored through a programme
of internal and external audits, and is generally satisfi ed with the adequacy of such internal controls system. The Board
also takes adequate steps to ensure compliance with legislative and regulatory requirements by establishing written
policies where appropriate.
PRINCIPLE 11: RISK MANAGEMENT AND INTERNAL CONTROLS
As part of the ongoing risk management process, the Management will conduct a risk assessment and evaluation
periodically and provide for signifi cant risks to be managed through regular reviews by the Management, Board and
Board committees, and adoption of adequate and cost-effective system of internal controls. The AC reviews the
Group’s risk management process established by the Management to ensure that there are adequate internal controls in
place to manage the signifi cant risks identifi ed.
The Board is responsible for the governance of risk and overall internal control framework and is fully aware of the value
of a sound system of risk management and internal controls within the Group to safeguard shareholders’ interests and
the Group’s assets, and to manage risks.
As at the date of this Annual Report, the AC has met with the Key Management, internal and external auditors to review
the internal and external auditors’ audit plans and the adequacy of risk management mechanisms implemented within
the Company. As part of the annual statutory audit on fi nancial statements, the internal and external auditors also report
to the AC and the appropriate level of management on any material weaknesses in fi nancial internal controls over the
areas which are signifi cant to the audit.
Based on the AC’s discussion with the auditors and management and the AC’s subsequent report to the Board, both
the AC and the Board are satisfi ed and have formed the opinion that the risk management and internal controls of the
Group to address fi nancial, operational and compliance risks and information technology controls, throughout FY2014
up to the date of this Annual Report, are adequate and effective to safeguard its assets and ensure the integrity of its
fi nancial statements.

Ann
ual R
epor
t 201
4
|
O
tto
Mar
ine
Lim
ited
30
CorporateGovernance Report
In addition, the Board has received assurance from the Group CEO, the Group Executive Director and the CFO that the
fi nancial records have been properly maintained and the fi nancial statements give a true and fair view of the Company’s
operations and fi nances, and regarding the effectiveness of the Company’s risk management and internal control
systems.
The system of internal controls provides reasonable, but not absolute assurance that the Company will not be adversely
affected by any event that could be reasonably foreseen as it strives to achieve its business objectives.
However, the Board notes that all risk management and internal control systems contain inherent limitations and no
system of risk management and internal controls can provide absolute assurance against the occurrence of material
errors, poor judgment in decision-making, human error losses, fraud or other irregularities. The Management continues
to focus on improving the standard of risk management, internal controls and corporate governance.
PRINCIPLE 12: AUDIT COMMITTEE
The AC consists of three (3) Independent Directors. Its members are Mr Ng Quek Peng, Mr Heng Hock Cheng @ Heng
Heyok Chiang and Mr Chin Yoong Kheong. The chairman of the AC is Mr Ng Quek Peng. The AC has suffi cient recent
and relevant fi nancial management expertise and experience amongst its members to discharge its functions within its
written terms of reference. The AC is required to meet periodically to perform the following functions:
(i) assisting the Board in the discharge of its responsibilities on fi nancial and accounting matters;
(ii) reviewing the audit plans, scope of work and results of the Company’s audits compiled by the Company’s
internal and external auditors;
(iii) reviewing the effectiveness of the Company’s internal audit function;
(iv) reviewing the co-operation given by the Company’s offi cers to the external auditors;
(v) nominating external auditors for re-appointment;
(vi) reviewing the integrity of any fi nancial information presented to the shareholders;
(vii) reviewing interested person transactions, if any, and approving any repayments or prepayments, as the case
may be, to certain interested persons;
(viii) reviewing potential confl icts of interest, if any;
(ix) approving and reviewing all hedging policies and instruments to be implemented by the Company, if any;
(x) approving all derivatives and other fi nancial instruments that are not principal protected, if any; and
(xi) reviewing and evaluating, at least annually, the Company’s administrative and internal controls and procedures
including fi nancial, operational, risk management and compliance.
Apart from the duties listed above, the AC is required to commission and review the fi ndings of internal investigations
into matters of suspected fraud or irregularity, or failure of internal controls or infringement of any law, rule or regulation
which has or is likely to have a material impact on the Group’s operations and/or fi nancial position. Each member of the
AC is required to abstain from voting on any resolution in respect of matters in which he is interested.
The AC has full access to our Key Management and full discretion to invite any Director or member of the Key
Management to attend its meetings, and has been given reasonable resources to enable it to discharge this function.
The AC meets with the external auditors and internal auditors, and in the case of the external auditors, at least once a
year without the presence of our Executive Directors and Key Management.
The AC held four (4) meetings during FY2014.
The AC has reviewed the services provided by the external auditors during the current fi nancial year, including the
non-audit services, and is satisfi ed that the fi nancial, professional and business relationships between the Company and
the external auditors will not prejudice the independence and objectivity of the external auditors. It recommends the
re-appointment of the external auditors.
Ann
ual R
epor
t 201
4
|
O
tto
Mar
ine
Lim
ited
31
CorporateGovernance Report
The total amount of fees paid and payable to the external auditors (including overseas practices of Deloitte & Touche
Tohmatsu Limited) for FY2014 aggregates to approximately US$850,000; US$466,000 for audit services and
US$384,000 for non-audit services.
The AC is provided with regular updates on changes to accounting standards and regulations to ensure that they are
well-informed and competent in carrying out their expected roles and responsibilities.
There is no member of the AC who was a former partner or director of the Company’s existing auditing fi rm.
In appointing the audit fi rms for the Group, the AC and the Board are satisfi ed that the appointment of different auditing
fi rms for its subsidiaries or associated companies will not compromise the standard and effectiveness of the audit of the
Company. The Group has complied with Rules 712 and 716 of the Listing Manual in relation to its external auditors.
In the opinion of the Directors, the Group complies with the Code’s guidelines on audit committees.
Whistle-Blowing Policy
The Company has a Whistle-Blowing Policy to encourage the reporting in good faith of suspected reportable conduct
by establishing clearly defi ned processes through which such reports may be made, with the confi dence that
employees and other persons making such reports to the designated persons:- Group Executive Director at email
[email protected] and the Lead Independent Director at email [email protected], will be treated fairly
and, to the extent possible, protected from reprisal.
PRINCIPLE 13: INTERNAL AUDIT
The AC is responsible for (1) establishing an independent internal audit function, (2) reviewing the internal audit
programme and ensuring co-ordination between internal auditors, external auditors and the Management, (3) ensuring
that the internal auditors meet or exceed the standards set by nationally or internationally recognised professional
bodies, and (4) the hiring, removal, evaluation and compensation of the internal auditors.
The Company has appointed Crowe Horwath First Trust Risk Advisory Pte. Ltd. as its internal auditors to carry out the
internal audit covering the review of key internal controls in selected areas to mitigate key businesses and fi nancial risks
affecting the operations, as advised by the AC and the Management. They have unfettered access to all the Company’s
documents, records, properties and personnel, including access to the AC. The internal auditors report directly to the
AC on audit matters and to the Executive Chairman and Group CEO on administrative matters. Internal auditors assist
the AC and the Board by performing regular evaluations on the Group’s internal controls, fi nancial and accounting
matters, compliance, business and risk management policies and procedures and ensuring that internal controls are
adequate to meet the Group’s requirements. The AC is satisfi ed that the Company’s internal audit function is supported
by adequate resources and has the full co-operation of the Management.
The internal auditor plans its audit schedules annually in consultation with, but independent of the Management.
Its plans are submitted to the AC for approval. The AC reviews the adequacy and effectiveness of the internal audit
function at least annually.
The Standards for the Professional Practice of Internal Auditing set by the Institute of Internal Auditors are used as a
reference and guide by the Company’s internal auditors. The AC assesses the adequacy of the internal audit function
annually.
PRINCIPLE 14: SHAREHOLDER RIGHTS
The Company is committed to treating all shareholders fairly and equitably and should recognise, protect and facilitate
the exercise of shareholders’ rights, and continually review and update such governance arrangements.
The Company strives to facilitate the exercise of ownership rights by all shareholders and to keep them suffi ciently
informed of changes in the Company or its business which would be likely to materially affect the price or value of the
Company’s shares. The Company also ensures that its shareholders have the opportunity to participate effectively in
and vote at general meetings of shareholders by providing information on the rules, including voting procedures that
govern general meetings of shareholders.
Ann
ual R
epor
t 201
4
|
O
tto
Mar
ine
Lim
ited
32
CorporateGovernance Report
PRINCIPLE 15: COMMUNICATION WITH SHAREHOLDERS
The Company adopts the practice of regularly communicating major developments in its businesses and operations
through SGXNET and, where appropriate, directly to shareholders, other investors, analysts, the media, the public
and its employees. The Management and the Board are committed to regular and proactive communication with
shareholders in line with continuous disclosure obligations of the Group pursuant to the Listing Manual of the SGX-ST.
The Group’s dedicated Investor Relations (“IR”) team is tasked with and focuses on facilitating communications between
the Company and its shareholders with timely disclosures of material and pertinent information through regular news
release and announcements to the SGX-ST. During the year, the IR team and the Management have taken steps to
solicit and understand the views of the shareholders through analyst briefi ngs.
The Company makes available all its fi nancial information, its annual reports, briefi ng materials on a timely basis through:
SGXNET announcements and news releases;
Investor road shows;
Analyst briefi ngs; and
The Company’s website at www.ottomarine.com ([email protected]), where shareholders can access
information and the corporate profi le of the Group.
The Company does not have a fi xed dividend policy. Due to the Company’s results in FY2014, the Company will not be
recommending or declaring any dividends.
PRINCIPLE 16: CONDUCT OF SHAREHOLDER MEETINGS
Shareholders of the Company receive notices of general meetings which are also advertised in a major newspaper
and issued via SGXNET. The Board recognises that the AGM is an important forum at which shareholders have the
opportunity to communicate their views and raise any queries with the Board and the Management regarding the
Company and its operations.
The participation of shareholders is encouraged at the Company’s AGM. The Board, including the Executive Chairman,
the chairmen of the AC, NC and RC, the Lead Independent Director, and Key Management will be available at the AGM
to answer questions. The external auditors are also present to assist the Directors in addressing any relevant queries
from the shareholders relating to the conduct of the audit and the preparation and content of their auditors’ report.
A shareholder may appoint one (1) or two (2) proxies to attend the ensuing AGM and vote. Voting in absentia by mail,
facsimile or email is not currently permitted due to diffi culty in the proper authentication of the identity of shareholders
and their voting intentions.
At general meetings, separate resolutions are set out on distinct issues for approval by shareholders.
CODE ON DEALING IN SECURITIES AND INTERESTED PERSON TRANSACTIONS POLICY
Dealings in Securities
The Group has adopted a code in relation to dealings in the Company’s securities to provide guidance to all its offi cers
pursuant to the SGX-ST Listing Manual. The Company and its offi cers are not allowed to deal in the Company’s shares
during the period commencing two weeks before the announcement of the Group’s fi nancial results for each of the
fi rst three quarters of its fi nancial year, or one month before the announcement of our Group’s full year fi nancial results,
ending on the date of the announcements of the relevant results. Key offi cers are further reminded from time to time,
not to transact in the Company’s shares while in possession of price-sensitive information until they are no longer in
possession of any unpublished price-sensitive information of the Group. Our offi cers are also advised not to deal in our
Company’s securities on short-term consideration and be mindful of the law pertaining to insider trading.

Ann
ual R
epor
t 201
4
|
O
tto
Mar
ine
Lim
ited
33
CorporateGovernance Report
Interested Person Transactions
The Group has established procedures to ensure that all transactions with interested persons are reported in a timely manner to the AC and that transactions are conducted on an arm’s length basis on terms that are not prejudicial to the interests of the shareholders.
Particulars of interested person transactions for FY2014 as required under Rule 907 of the SGX Listing Manual:
Aggregate value of all transactions excluding transactions conducted
under shareholders’ mandate pursuant to Rule 920 (excluding
transactions less than S$100,000)FY2014US$’000
Rent expense to Samling Singapore Pte Ltd 657
Interest expense to Brizill International Limited 1,113
Interest expense to the controlling shareholder for loan extended to Otto
Marine Limited * 1,582
* Details of the loan is disclosed in Note 22 of the Financial Statements.
CORPORATE SOCIAL RESPONSIBILITY
Corporate sustainability is a key consideration in the Group’s strategic direction. The Group believes that by promoting the importance of sustainability both within its own organisation and to its partners, it is will make a substantive difference. The Group highlighted this commitment in December 2013 by initiating its corporate social responsibility (“CSR”) programme. A CSR committee, comprising of staff from various departments in the Group, was formed in January 2014 to assist the Board in integrating corporate sustainability with the Group’s day to day operations.
CSR Initiatives
In February 2014, the Company was awarded a certifi cate of appreciation as a friend of MOSES, a social enterprise belonging to the Singapore Anglican Community Services (“SACS”).
In March 2014, the Company collaborated with the Community Rehabilitation & Support Service-Pasir Ris branch (“CRSS-PR”), an initiative run by SACS, to start the Otto Marine Empowerment Centre (“OMEC”) project. The purpose of OMEC is to support the vocational rehabilitation of a group of individuals recovering from psychiatric conditions. The Company together with volunteers from CRSS-PR, collaborated to provide practical training for the fi rst batch of adults with psychiatric disabilities (“OMEC Participants”). The training is intended to equip the OMEC Participants with basic work skills to assist them in securing employment post rehabilitation.
In May 2014, the Company began its ‘Make Waves’ CSR initiative with the aim of instilling the importance of CSR throughout its organisation. The purpose of the ‘Make Waves’ initiative is to encourage all staff to develop an awareness of the importance of sustainability as well as a desire to positively impact the community. The Company had begun working together with CRSS-PR with an ongoing continual effort to highlight awareness of mental health well-being to all staff and to identify and facilitate different opportunities for its staff to be involved in.
In July 2014, the Company conducted a grooming course for a total of 11 participants at CRSS-PR. The purpose of the grooming course was to help the participants to achieve greater confi dence and to recognise the importance value of image, etiquette and personal branding so that they may portray a positive self-image and hence boost their confi dence level during a job interview.
In October 2014, the fi rst batch of OMEC Participants completed their programme successfully. Excited with the success of the OMEC project, a second batch of OMEC Participants soon began the OMEC training. The second batch of OMEC Participants are scheduled to complete their programme in May 2015. Half of the CSR Committee members were also invited to the CRSS-PR Open House to understand more about mental illness and to mingle with people with psychiatric conditions.
In December 2014, the Company had invited the current batch of OMEC Participants to its Christmas lunch so that they could experience socialising with staff and Key Management of the Company, as well as, experiencing the sense of belonging when working in an organisation.

Financial Statements
35 / Report of the Directors
38 / Statement of Directors
39 / Independent Auditors’ Report
41 / Balance Sheets
43 /Consolidated Profi t or Loss Statement
44 / Consolidated Statement of Comprehensive Income
45 / Statements of Changes in Equity
48 / Consolidated Statements of Cash Flows
50 / Notes to Financial Statements

Ann
ual R
epor
t 201
4
|
O
tto
Mar
ine
Lim
ited
35
Report ofThe Directors
The directors present their report together with the audited consolidated fi nancial statements of the Group and balance
sheet and statement of changes in equity of the Company for the fi nancial year ended 31 December 2014.
1 DIRECTORS
The directors in offi ce at the date of this report are:
Yaw Chee Siew
Garrick James Stanley
See Kian Heng
Heng Hock Cheng @ Heng Heyok Chiang
Ng Quek Peng
Craig Foster Pickett
Chin Yoong Kheong (Appointed on 1 January 2014)
2 ARRANGEMENTS TO ENABLE DIRECTORS TO ACQUIRE BENEFITS BY MEANS OF THE ACQUISITION OF SHARES AND DEBENTURES
Neither at the end of the fi nancial year nor at any time during the fi nancial year did there subsist any
arrangement whose object is to enable the directors to acquire benefi ts by means of the acquisition of shares or
debentures in the Company or any other body corporate.
3 DIRECTORS’ INTERESTS IN SHARES AND DEBENTURES
The directors holding offi ce at the end of the fi nancial year had no interests in the share capital of the Company
and related corporations as recorded in the Register of Directors’ Shareholdings kept by the Company under
Section 164 of the Singapore Companies Act except as follows:
Shareholdings registered in name of director
Shareholdings in which directors are deemed to
have an interest
Name of directors and companiesin which interests are held
At beginningof year or
date of appointment,
if laterAt endof year
At beginningof year or
date of appointment,
if laterAt endof year
The Company
Yaw Chee Siew 10,796,700 10,796,700 2,606,110,375 2,598,410,375
Garrick James Stanley 1,000,000 95,978,920 – –
See Kian Heng 3,629,350 24,257,170 2,000 2,000
Heng Hock Cheng @ Heng Heyok Chiang 341,200 727,700 – –
Ng Quek Peng 206,770 593,270 – –
Craig Foster Pickett 309,140 550,740 – –
By virtue of Section 7 of the Companies Act, Mr Yaw Chee Siew is deemed to have an interest in the Company
and all the related corporations of the Company.
During the year, a subsidiary, Otto Marine Services Pte. Ltd. issued Series 002 Medium Term Notes (“Notes”)
amounting to S$70,000,000, unsecured and bearing interest at 7% p.a. with the interest payable semi-
annually and the Notes repayable in August 2016. At the time of issue and at the end of the reporting period,
S$2,750,000 of the Notes was registered in name of Mr See Kian Heng. Out of the S$2,750,000, Mr See Kian
Heng was interested in S$500,000 of the Notes while S$2,000,000 was held on behalf of Mr Yaw Chee Siew
and the remaining S$250,000 was held on behalf of another personnel of the Company.
There were no changes in the interest held by directors in the Company and related corporations between the
end of the fi nancial year and 21 January 2015.

Ann
ual R
epor
t 201
4
|
O
tto
Mar
ine
Lim
ited
36
Report ofThe Directors
4 DIRECTORS’ RECEIPT AND ENTITLEMENT TO CONTRACTUAL BENEFITS
Since the beginning of the fi nancial year, no director has received or become entitled to receive a benefi t which
is required to be disclosed under Section 201(8) of the Singapore Companies Act, by reason of a contract made
by the Company or a related corporation with the director, or with a fi rm of which he is a member, or with a
Company in which he has a substantial fi nancial interest except for salaries, bonuses and other benefi ts as
disclosed in the fi nancial statements.
5 DIRECTORS’ INTEREST IN MATERIAL CONTRACTS
During the fi nancial year, there are no material contracts entered into by the Group or its subsidiaries involving
the interests of any Directors or Controlling Shareholders (as defi ned in the Singapore Exchange Securities
Trading Listing Manual) except as disclosed in Notes 6, 22, 23 and 24 to the fi nancial statements.
6 OPTIONS TO TAKE UP UNISSUED SHARES
During the fi nancial year, no options to take up unissued shares of the Company or any corporation in the Group
were granted.
7 OPTIONS EXERCISED
During the fi nancial year, there were no shares of the Company or any corporation in the Group issued by virtue
of the exercise of an option to take up unissued shares.
8 UNISSUED SHARES UNDER OPTION
At the end of the fi nancial year, there were no unissued shares of the Company or any corporation in the Group
under options.
9 AUDIT COMMITTEE
The Audit Committee carries out its functions in accordance with the principles of corporate governance as
prescribed in the Code of Corporate Governance 2012 issued by the Singapore Council on Corporate
Disclosure and Governance. The functions carried out are detailed in the Corporate Governance Report.
10 SHARE-BASED INCENTIVE SCHEME
Company
On 2 September 2008, the Company adopted an employee share-based incentive scheme known as the Otto
Marine Share Award Scheme (the “Share Award Scheme”). Directors, executives and full time employees
(except the Controlling Shareholders or associates of Controlling Shareholders) are eligible to participate in
the Share Award Scheme. The Share Award Scheme administered by the Share Award Committee provides
that no member of the Share Award Committee shall participate in any deliberation or decision in respect of
shares granted or to be granted to him. The Share Award Committee comprises directors, which at all times
shall include an independent director, duly authorised and appointed by the Board of Directors. At the end
of the reporting period, members of the Share Award Committee have yet to be appointed. Meanwhile, the
Remuneration Committee is tasked with the interim administration of the Share Award Scheme.
The Share Award Scheme awards to participants fully paid shares, their equivalent cash value or combinations
thereof free-of-charge, upon the participants achieving prescribed performance targets and upon expiry of the
prescribed vesting periods. The Share Award Scheme is intended to attract, retain and motivate participants to
achieve performance targets which will create and enhance economic value for the Company and to encourage
greater commitment, dedication and loyalty.

Ann
ual R
epor
t 201
4
|
O
tto
Mar
ine
Lim
ited
37
Report ofThe Directors
The total number of award shares which may be issued pursuant to the Share Award Scheme shall not exceed
15% of the issued share capital of the Company on the day preceding the relevant date of the award. The
Scheme shall continue in force at the discretion of the Share Award Committee, subject to a maximum period of
10 years commencing on the date the Share Award Scheme is adopted by the Company in the general meeting.
In 2014, 1,383,500 shares were issued pursuant to above share award scheme resulting in an increase in share
capital by US$82,000. These shares were issued to current and past non-executive directors in satisfaction of
30% of the directors’ fees for the year ended 31 December 2013 pursuant to a resolution passed at the Annual
General Meeting of the Company held on 30 April 2014. 2,000,000 shares were awarded to Mr See Kian Heng,
an executive director of the Company on 13 March 2014 resulting in an increase in share capital by US$126,160
and 26,685,106 shares were issued to Garrick James Stanley (Group Chief Executive Offi cer and Executive
Director) resulting in an increase in share capital by US$1,500,000 which was announced on 11 August 2014.
Subsidiary
Pursuant to the shareholders agreement of a subsidiary dated 10 October 2009, the subsidiary is to implement
an Employee Share Option Scheme (the “Scheme”) for the benefi t of its management team and employees. A
total of 2,000,000 ordinary shares of the subsidiary are to set aside for the Scheme. Such shares set aside were
revised to 1,610,000 in 2010. The subsidiary has been placed in liquidation since May 2013. As a result, the
Scheme is no longer in effect.
11 AUDITORS
The auditors, Deloitte & Touche LLP, have expressed their willingness to accept re-appointment.
ON BEHALF OF THE BOARD OF DIRECTORS
Garrick James Stanley
See Kian Heng
1 April 2015

Ann
ual R
epor
t 201
4
|
O
tto
Mar
ine
Lim
ited
38
Statement ofDirectors
In the opinion of the directors, the consolidated fi nancial statements of the Group and the balance sheet and statement
of changes in equity of the Company as set out on pages 41 to 112 are drawn up so as to give a true and fair view of
the state of affairs of the Group and of the Company as at 31 December 2014 and of the results, changes in equity and
cash fl ows of the Group and changes in equity of the Company for the year ended on that date and at the date of this
statement, there are reasonable grounds to believe that the Company will be able to pay its debts when they fall due.
ON BEHALF OF THE BOARD OF DIRECTORS
Garrick James Stanley
See Kian Heng
1 April 2015

Ann
ual R
epor
t 201
4
|
O
tto
Mar
ine
Lim
ited
39
IndependentAuditors’ ReportTo the Member of Otto Marine Limited
Report on the Financial Statements
We have audited the accompanying fi nancial statements of Otto Marine Limited (the “Company”) and its subsidiaries
(the “Group”) which comprise the balance sheets of the Group and the Company as at 31 December 2014, the
consolidated profi t and loss statement, consolidated statement of comprehensive income, statement of changes
in equity and statement of cash fl ows of the Group and the statement of changes in equity of the Company for the
fi nancial year then ended, and a summary of signifi cant accounting policies and other explanatory information, as set
out on pages 41 to 112.
Management’s Responsibility for the Financial Statements
Management is responsible for the preparation of fi nancial statements that give a true and fair view in accordance
with the provisions of the Singapore Companies Act (the “Act”) and Singapore Financial Reporting Standards and for
devising and maintaining a system of internal accounting controls suffi cient to provide a reasonable assurance that
assets are safeguarded against loss from unauthorised use or disposition; and transactions are properly authorised and
that they recorded as necessary to permit the preparation of true and fair profi t and loss accounts and balance sheets
and to maintain accountability of assets.
Auditors’ Responsibility
Our responsibility is to express an opinion on these fi nancial statements based on our audit. We conducted our audit in
accordance with Singapore Standards on Auditing. Those standards require that we comply with ethical requirements
and plan and perform the audit to obtain reasonable assurance about whether the fi nancial statements are free from
material misstatement.
An audit involves performing procedures to obtain audit evidence about the amounts and disclosures in the fi nancial
statements. The procedures selected depend on the auditor’s judgement, including the assessment of the risks of
material misstatement of the fi nancial statements, whether due to fraud or error. In making those risk assessments, the
auditor considers internal control relevant to the entity’s preparation of fi nancial statements that give a true and fair view
in order to design audit procedures that are appropriate in the circumstances, but not for the purpose of expressing
an opinion on the effectiveness of the entity’s internal control. An audit also includes evaluating the appropriateness of
accounting policies used and the reasonableness of accounting estimates made by management, as well as evaluating
the overall presentation of the fi nancial statements. We believe that the audit evidence we have obtained is suffi cient
and appropriate to provide a basis for our audit opinion.
Opinion
In our opinion, the consolidated fi nancial statements of the Group and the balance sheet and statement of changes
in equity of the Company are properly drawn up in accordance with the provisions of the Act and Singapore Financial
Reporting Standards so as to give a true and fair view of the state of affairs of the Group and of the Company as at
31 December 2014 and of the results, changes in equity and cash fl ows of the Group and changes in equity of the
Company for the fi nancial year ended on that date.
Ann
ual R
epor
t 201
4
|
O
tto
Mar
ine
Lim
ited
40
IndependentAuditors’ ReportTo the Member of Otto Marine Limited
Report on Other Legal and Regulatory Requirements
In our opinion, the accounting and other records required by the Act to be kept by the Company and by those
subsidiaries incorporated in Singapore of which we are the auditors have been properly kept in accordance with the
provisions of the Act.
Deloitte & Touche LLP
Public Accountants and
Chartered Accountants
Singapore
1 April 2015

Ann
ual R
epor
t 201
4
|
O
tto
Mar
ine
Lim
ited
41
BalanceSheets
31 December 2014
See accompanying notes to fi nancial statements.
Group Company
Note 2014 2013 2014 2013
US$’000 US$’000 US$’000 US$’000
ASSETS
Current assets
Cash and bank balances 7 16,470 25,671 1,566 3,039
Fixed deposits 7 13,147 70,524 7,502 22,282
Trade receivables 8 318,163 317,499 393,375 320,676
Gross amount due from customers for
contract work 9 5,772 85,015 – –
Current portion of fi nance lease receivables 10 1,268 – – –
Deposits, prepayments and other receivables 11 115,711 81,156 446,050 231,964
Current portion of loan receivables 12 1,550 200 78,840 77,440
Inventories 13 137,051 127,963 – –
Total current assets 609,132 708,028 927,333 655,401
Non-current assets
Trade receivables 8 – 623 – –
Finance lease receivables 10 9,013 – – –
Loan receivables 12 8,000 8,800 – –
Property, plant and equipment 14 547,703 521,425 882 926
Goodwill 15 38,314 38,314 – –
Investment in subsidiaries 16 – – 180,480 180,480
Investment in associates and joint ventures 17 467 3,453 – –
Available-for-sale investments 18 7 144 – –
Deferred tax assets 19 840 919 – –
Total non-current assets 604,344 573,678 181,362 181,406
Total assets 1,213,476 1,281,706 1,108,695 836,807
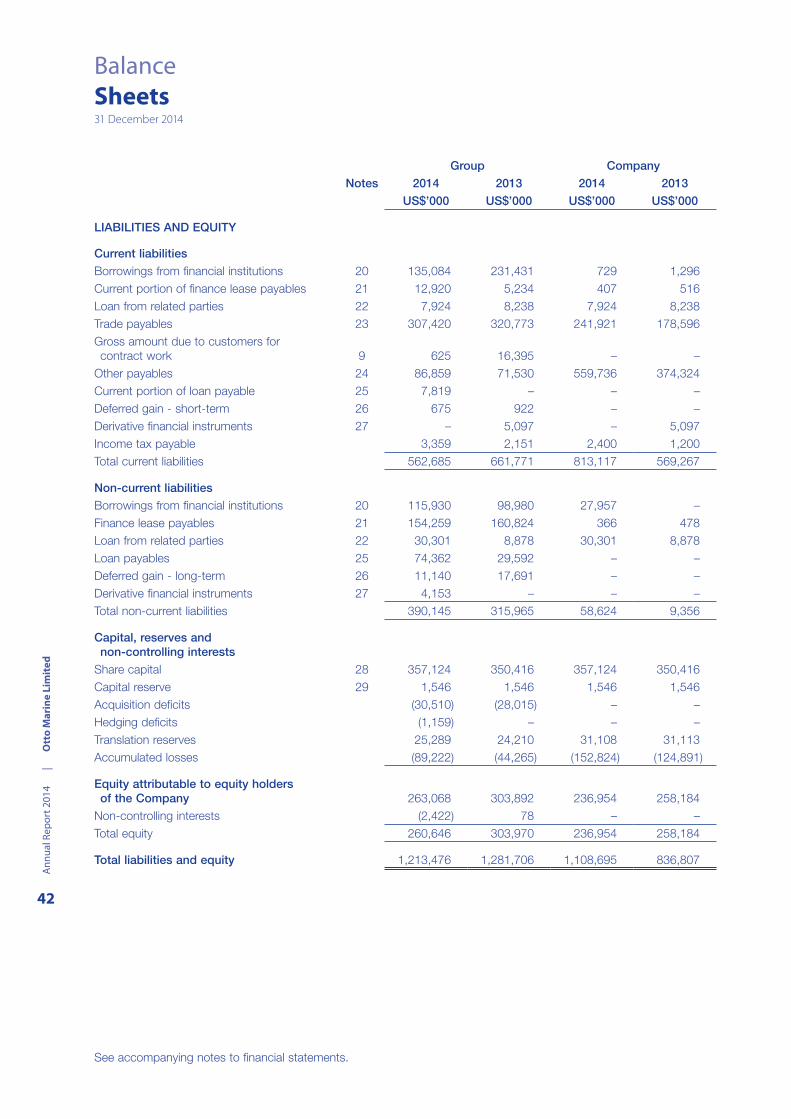
Ann
ual R
epor
t 201
4
|
O
tto
Mar
ine
Lim
ited
42
BalanceSheets31 December 2014
See accompanying notes to fi nancial statements.
Group Company
Notes 2014 2013 2014 2013
US$’000 US$’000 US$’000 US$’000
LIABILITIES AND EQUITY
Current liabilities
Borrowings from fi nancial institutions 20 135,084 231,431 729 1,296
Current portion of fi nance lease payables 21 12,920 5,234 407 516
Loan from related parties 22 7,924 8,238 7,924 8,238
Trade payables 23 307,420 320,773 241,921 178,596
Gross amount due to customers for
contract work 9 625 16,395 – –
Other payables 24 86,859 71,530 559,736 374,324
Current portion of loan payable 25 7,819 – – –
Deferred gain - short-term 26 675 922 – –
Derivative fi nancial instruments 27 – 5,097 – 5,097
Income tax payable 3,359 2,151 2,400 1,200
Total current liabilities 562,685 661,771 813,117 569,267
Non-current liabilities
Borrowings from fi nancial institutions 20 115,930 98,980 27,957 –
Finance lease payables 21 154,259 160,824 366 478
Loan from related parties 22 30,301 8,878 30,301 8,878
Loan payables 25 74,362 29,592 – –
Deferred gain - long-term 26 11,140 17,691 – –
Derivative fi nancial instruments 27 4,153 – – –
Total non-current liabilities 390,145 315,965 58,624 9,356
Capital, reserves and non-controlling interests
Share capital 28 357,124 350,416 357,124 350,416
Capital reserve 29 1,546 1,546 1,546 1,546
Acquisition defi cits (30,510) (28,015) – –
Hedging defi cits (1,159) – – –
Translation reserves 25,289 24,210 31,108 31,113
Accumulated losses (89,222) (44,265) (152,824) (124,891)
Equity attributable to equity holders of the Company 263,068 303,892 236,954 258,184
Non-controlling interests (2,422) 78 – –
Total equity 260,646 303,970 236,954 258,184
Total liabilities and equity 1,213,476 1,281,706 1,108,695 836,807
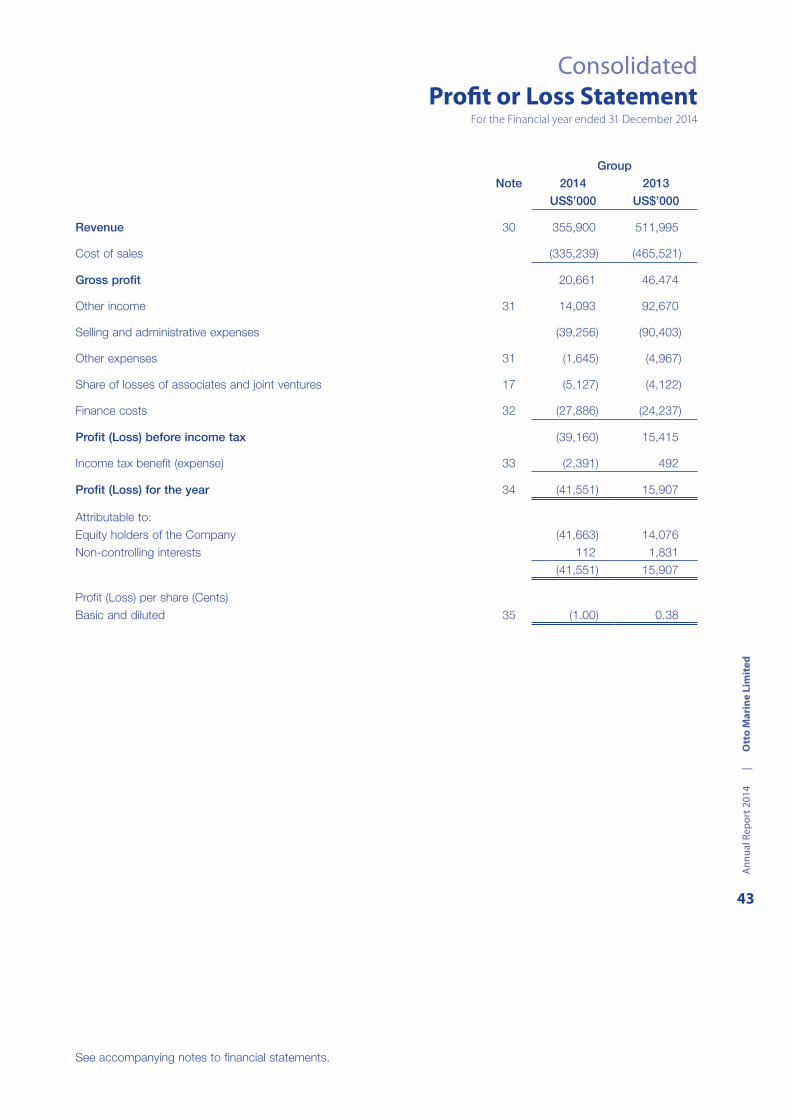
Ann
ual R
epor
t 201
4
|
O
tto
Mar
ine
Lim
ited
43
ConsolidatedProfi t or Loss Statement
For the Financial year ended 31 December 2014
See accompanying notes to fi nancial statements.
Group
Note 2014 2013
US$’000 US$’000
Revenue 30 355,900 511,995
Cost of sales (335,239) (465,521)
Gross profi t 20,661 46,474
Other income 31 14,093 92,670
Selling and administrative expenses (39,256) (90,403)
Other expenses 31 (1,645) (4,967)
Share of losses of associates and joint ventures 17 (5,127) (4,122)
Finance costs 32 (27,886) (24,237)
Profi t (Loss) before income tax (39,160) 15,415
Income tax benefi t (expense) 33 (2,391) 492
Profi t (Loss) for the year 34 (41,551) 15,907
Attributable to:
Equity holders of the Company (41,663) 14,076
Non-controlling interests 112 1,831
(41,551) 15,907
Profi t (Loss) per share (Cents)
Basic and diluted 35 (1.00) 0.38

Ann
ual R
epor
t 201
4
|
O
tto
Mar
ine
Lim
ited
44
Consolidated Statement ofComprehensive IncomeFor the Financial year ended 31 December 2014
See accompanying notes to fi nancial statements.
Group
2014 2013
US$’000 US$’000
Profi t (Loss) for the year (41,551) 15,907
Other comprehensive income (expense):
Items that may be reclassifi ed subsequently to profi t or loss
Exchange differences on translating foreign operations 972 (373)
Share of other comprehensive income of associates – 73
Fair value changes arising from cash fl ow hedge (1,159) (96)
Other comprehensive expense for the year, net of tax (187) (396)
Total comprehensive income (expense) for the year (41,738) 15,511
Total comprehensive income (expense) attributable to:
Equity holders of the Company (41,879) 13,503
Non-controlling interests 141 2,008
(41,738) 15,511

Ann
ual R
epor
t 201
4
|
O
tto
Mar
ine
Lim
ited
45
Statements ofChanges in Equity
For the Financial year ended 31 December 2014
See accompanying notes to fi nancial statements.
Sharecapital
Capitalreserve
(Note 29)
Acquisition reserves(defi cits)
Hedging reserves(defi cits)
Translationreserves(defi cits)
Accumulatedprofi ts
(losses)
Attributableto equityholdersof the
Company
Non-controllinginterests Total
US$’000 US$’000 US$’000 US$’000 US$’000 US$’000 US$’000 US$’000 US$’000
Group
Balance at 1 January 2013 300,087 1,546 (28,595) 96 24,687 (58,341) 239,480 (16,603) 222,877
Total comprehensive
income (expense) for the year
Profi t for the year – – – – – 14,076 14,076 1,831 15,907
Other comprehensive
income (expense) for the year – – – (96) (477) – (573) 177 (396)
Total – – – (96) (477) 14,076 13,503 2,008 15,511
Transaction with owners,
recognised directly in equity
Issuance of shares pursuant to
Share Award Scheme, net of
expense (Note 28) 718 – – – – – 718 – 718
Deconsolidation of a subsidiary
(Note 36) – – 580 – – – 580 14,673 15,253
Issuance of shares pursuant to
rights issue, net of expense
(Note 28) 49,611 – – – – – 49,611 – 49,611
Total 50,329 – 580 – – – 50,909 14,673 65,582
Balance at 31 December 2013 350,416 1,546 (28,015) – 24,210 (44,265) 303,892 78 303,970

Ann
ual R
epor
t 201
4
|
O
tto
Mar
ine
Lim
ited
46
Statements ofChanges in EquityFor the Financial year ended 31 December 2014
See accompanying notes to fi nancial statements.
Sharecapital
Capitalreserve
(Note 29) Acquisition
defi cits Hedgingdefi cits
Translationreserves
Accumulatedlosses
Attributableto equityholdersof the
Company
Non-controllinginterests Total
US$’000 US$’000 US$’000 US$’000 US$’000 US$’000 US$’000 US$’000 US$’000
Group
Balance at 1 January 2014 350,416 1,546 (28,015) – 24,210 (44,265) 303,892 78 303,970
Total comprehensive income
(expense) for the year
Profi t (Loss) for the year – – – – – (41,663) (41,663) 112 (41,551)
Other comprehensive income
(expense) for the year – – – (1,159) 943 – (216) 29 (187)
Total – – – (1,159) 943 (41,663) (41,879) 141 (41,738)
Transaction with owners,
recognised directly in equity
Issuance of shares pursuant to
Share Award Scheme,
net of expense (Note 28) 1,708 – – – – – 1,708 – 1,708
Issuance of shares, net of
expense (Note 28) 5,000 – – – – – 5,000 – 5,000
Acquisition of additional shares
from non-controlling interest
(Note 16) – – (2,495) – 136 – (2,359) (2,641) (5,000)
Dividend expense (Note 41) – – – – – (3,294) (3,294) – (3,294)
Total 6,708 – (2,495) – 136 (3,294) 1,055 (2,641) (1,586)
Balance at 31 December 2014 357,124 1,546 (30,510) (1,159) 25,289 (89,222) 263,068 (2,422) 260,646
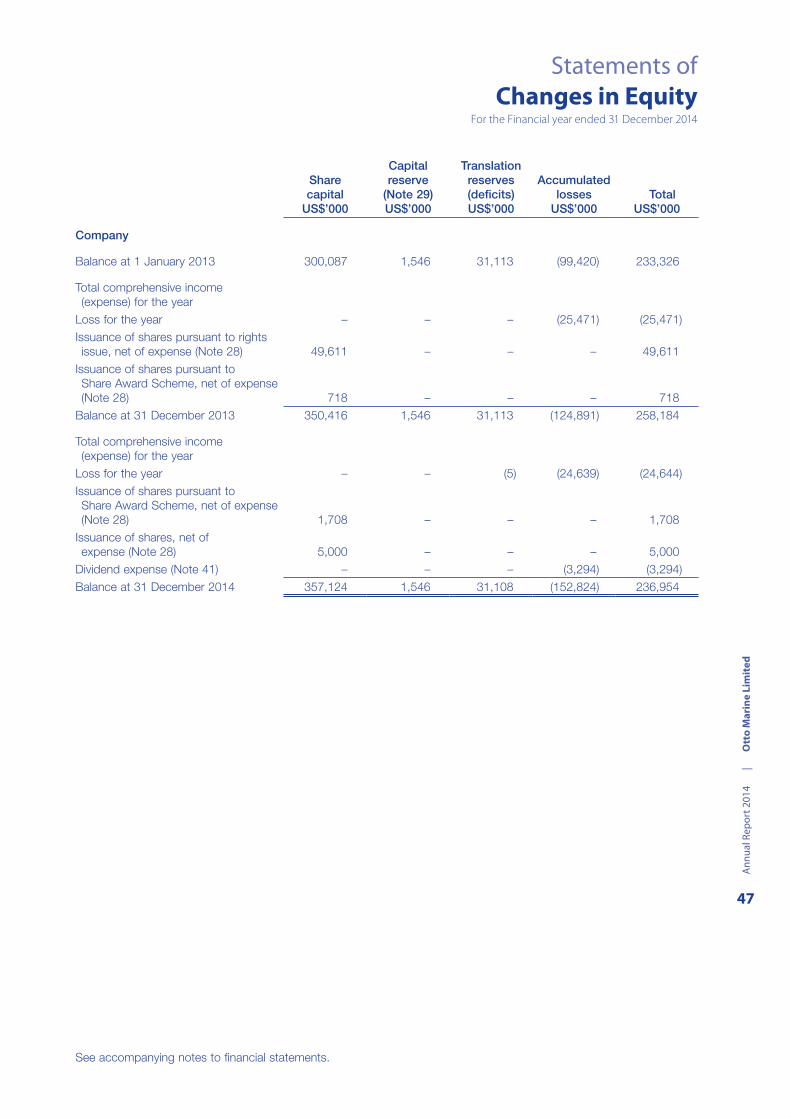
Ann
ual R
epor
t 201
4
|
O
tto
Mar
ine
Lim
ited
47
Statements ofChanges in Equity
For the Financial year ended 31 December 2014
See accompanying notes to fi nancial statements.
Sharecapital
US$’000
Capitalreserve
(Note 29) US$’000
Translationreserves(defi cits) US$’000
Accumulatedlosses
US$’000 Total
US$’000
Company
Balance at 1 January 2013 300,087 1,546 31,113 (99,420) 233,326
Total comprehensive income
(expense) for the year
Loss for the year – – – (25,471) (25,471)
Issuance of shares pursuant to rights
issue, net of expense (Note 28) 49,611 – – – 49,611
Issuance of shares pursuant to
Share Award Scheme, net of expense
(Note 28) 718 – – – 718
Balance at 31 December 2013 350,416 1,546 31,113 (124,891) 258,184
Total comprehensive income
(expense) for the year
Loss for the year – – (5) (24,639) (24,644)
Issuance of shares pursuant to
Share Award Scheme, net of expense
(Note 28) 1,708 – – – 1,708
Issuance of shares, net of
expense (Note 28) 5,000 – – – 5,000
Dividend expense (Note 41) – – – (3,294) (3,294)
Balance at 31 December 2014 357,124 1,546 31,108 (152,824) 236,954

Ann
ual R
epor
t 201
4
|
O
tto
Mar
ine
Lim
ited
48
Consolidated Statement ofCash FlowsFor the Financial year ended 31 December 2014
See accompanying notes to fi nancial statements.
Group
2014 2013
US$’000 US$’000
Operating activities
Profi t (Loss) before income tax (39,160) 15,415
Adjustments for:
Share of losses of associates and joint ventures 5,127 4,122
Depreciation of property, plant and equipment 31,569 22,934
Interest expense 27,886 24,237
Interest income (938) (751)
Gain arising from the changes in the fair value of
available-for-sale investment (146) –
Loss arising from the changes in the fair value of
interest rate swap contracts – 38
(Gain) Loss arising from the changes in the fair value of
foreign exchange forward contracts (5,097) 4,524
Gain on disposal of investment in associate and joint venture (4) (235)
Gain on deconsolidation of a subsidiary (Note 36) – (64,015)
Foreign exchange gain (2,080) (4,211)
Allowance for doubtful trade receivables 897 67
Allowance for doubtful non-trade receivables – 45,797
Gain on disposal of property, plant and equipment (325) (17,682)
Property, plant and equipment written off – 2
Reversal of unrealised profi t for sale of vessels to associate – 403
Realisation of previously deferred profi t on sale of vessels
to an associate which is disposed during the year (Note 26) (6,983) –
Share award expense 1,708 718
Operating cash fl ows before movements in working capital 12,454 31,363
Trade receivables 32,120 (155,089)
Construction work-in-progress 47,376 13,784
Finance lease receivables (10,281) 14,878
Other receivables (32,228) 6,082
Inventories (5,504) 155,069
Trade payables (9,868) 12,449
Other payables 2,362 36,010
Cash generated from operations 36,431 114,546
Income tax paid (1,112) (402)
Interest received 852 751
Net cash from operating activities 36,171 114,895
Investing activities
Proceeds on cash distribution from available-for-sale investment 283 –
Proceeds from disposal of investment in a joint venture – 797
Proceeds from disposal of investment in an associate (Note A) – –
Loan receivables (550) 441
Purchases of property, plant and equipment (Note B) (73,297) (78,600)
Proceeds from disposal of property, plant and equipment (Note C) 8,858 34,561
Net cash used in investing activities (64,706) (42,801)
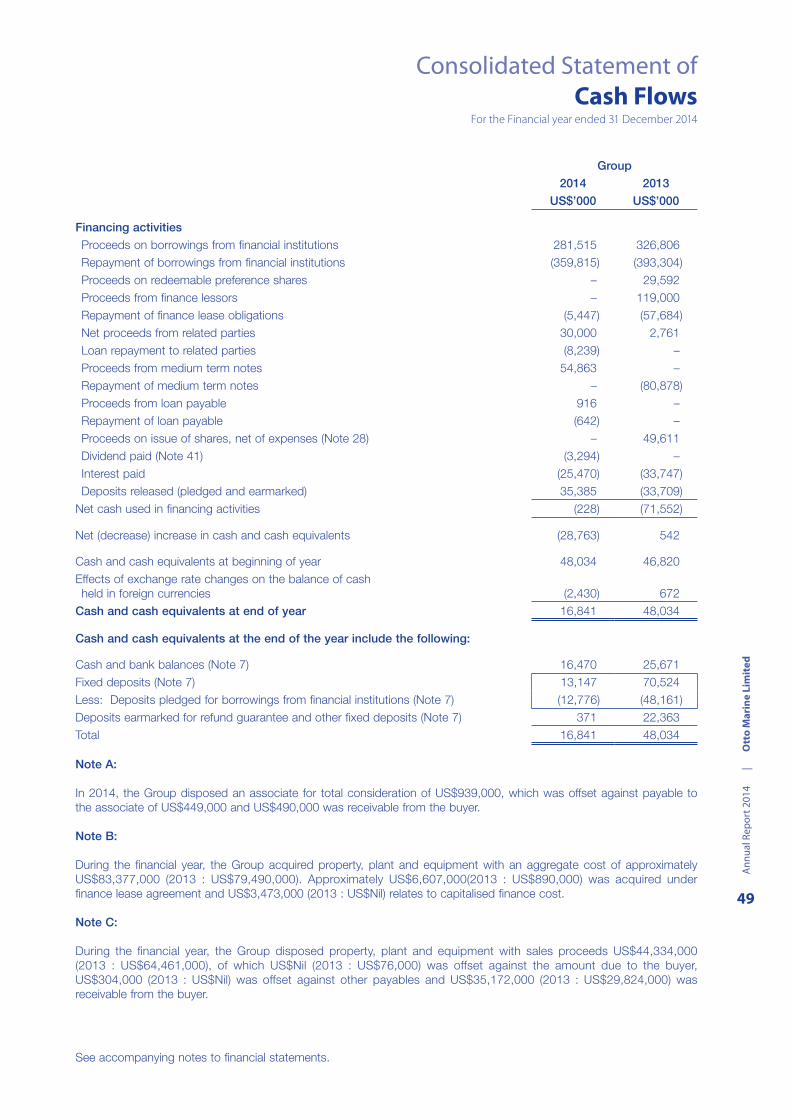
Ann
ual R
epor
t 201
4
|
O
tto
Mar
ine
Lim
ited
49
Consolidated Statement ofCash Flows
For the Financial year ended 31 December 2014
See accompanying notes to fi nancial statements.
Group
2014 2013
US$’000 US$’000
Financing activities
Proceeds on borrowings from fi nancial institutions 281,515 326,806
Repayment of borrowings from fi nancial institutions (359,815) (393,304)
Proceeds on redeemable preference shares – 29,592
Proceeds from fi nance lessors – 119,000
Repayment of fi nance lease obligations (5,447) (57,684)
Net proceeds from related parties 30,000 2,761
Loan repayment to related parties (8,239) –
Proceeds from medium term notes 54,863 –
Repayment of medium term notes – (80,878)
Proceeds from loan payable 916 –
Repayment of loan payable (642) –
Proceeds on issue of shares, net of expenses (Note 28) – 49,611
Dividend paid (Note 41) (3,294) –
Interest paid (25,470) (33,747)
Deposits released (pledged and earmarked) 35,385 (33,709)
Net cash used in fi nancing activities (228) (71,552)
Net (decrease) increase in cash and cash equivalents (28,763) 542
Cash and cash equivalents at beginning of year 48,034 46,820
Effects of exchange rate changes on the balance of cash
held in foreign currencies (2,430) 672
Cash and cash equivalents at end of year 16,841 48,034
Cash and cash equivalents at the end of the year include the following:
Cash and bank balances (Note 7) 16,470 25,671
Fixed deposits (Note 7) 13,147 70,524
Less: Deposits pledged for borrowings from fi nancial institutions (Note 7) (12,776) (48,161)
Deposits earmarked for refund guarantee and other fi xed deposits (Note 7) 371 22,363
Total 16,841 48,034
Note A:
In 2014, the Group disposed an associate for total consideration of US$939,000, which was offset against payable to
the associate of US$449,000 and US$490,000 was receivable from the buyer.
Note B:
During the fi nancial year, the Group acquired property, plant and equipment with an aggregate cost of approximately
US$83,377,000 (2013 : US$79,490,000). Approximately US$6,607,000(2013 : US$890,000) was acquired under
fi nance lease agreement and US$3,473,000 (2013 : US$Nil) relates to capitalised fi nance cost.
Note C:
During the fi nancial year, the Group disposed property, plant and equipment with sales proceeds US$44,334,000
(2013 : US$64,461,000), of which US$Nil (2013 : US$76,000) was offset against the amount due to the buyer,
US$304,000 (2013 : US$Nil) was offset against other payables and US$35,172,000 (2013 : US$29,824,000) was
receivable from the buyer.

Ann
ual R
epor
t 201
4
|
O
tto
Mar
ine
Lim
ited
50
Notes toFinancial StatementsFor the Financial year ended 31 December 2014
1 GENERAL
The Company (Registration No. 197902647M) was incorporated in Singapore, with its principal place of
business and registered offi ce at 9 Temasek Boulevard, #33-01 Suntec Tower Two, Singapore 038989. The
Company is listed on the mainboard of the Singapore Exchange Securities Trading Limited. The fi nancial
statements are expressed in United States Dollars.
The principal activities of the Company and the Group consist of construction, fabrication, repair and conversion,
chartering and provision of subsea services. The Company operates through a branch in United Arab Emirates.
The principal activities of the subsidiaries, associates and joint ventures are disclosed in Notes 16
and 17 to the fi nancial statements respectively.
The consolidated fi nancial statements of the Group and balance sheet and statement of changes in equity of the
Company for the fi nancial year ended 31 December 2014 were authorised for issue by the Board of Directors on
1 April 2015.
2 SUMMARY OF SIGNIFICANT ACCOUNTING POLICIES
BASIS OF ACCOUNTING - The fi nancial statements are prepared in accordance with the historical cost basis,
except as disclosed in the accounting policies below and are drawn up in accordance with the provisions of the
Singapore Companies Act and Singapore Financial Reporting Standards (“FRS”).
Historical cost is generally based on the fair value of the consideration given in exchange for goods and services.
Fair value is the price that would be received to sell an asset or paid to transfer a liability in an orderly transaction
between market participants at the measurement date, regardless of whether that price is directly observable or
estimated using another valuation technique. In estimating the fair value of an asset or a liability, the Group takes
into account the characteristics of the asset or liability which market participants would take into account when
pricing the asset or liability at the measurement date. Fair value for measurement and/or disclosure purposes
in these consolidated fi nancial statements is determined on such a basis, except for share-based payment
transactions that are within the scope of FRS 102 Share-based Payments, leasing transactions that are within
the scope of FRS 17 Leases, and measurements that have some similarities to fair value but are not fair value,
such as net realisable value in FRS 2 Inventories or value in use in FRS 36 Impairment of Assets.
In addition, for fi nancial reporting purposes, fair value measurements are categorised into Level 1, 2 or 3 based
on the degree to which the inputs to the fair value measurements are observable and the signifi cance of the
inputs to the fair value measurement in its entirety, which are described as follows:
Level 1 inputs are quoted prices (unadjusted) in active markets for identical assets or liabilities that the
entity can access at the measurement date;
Level 2 inputs are inputs, other than quoted prices included within Level 1, that are observable for the
asset or liability, either directly or indirectly; and
Level 3 inputs are unobservable inputs for the asset or liability.
ADOPTION OF NEW AND REVISED STANDARDS – On 1 January 2014, the Group has adopted all the new and
revised FRSs and Interpretations of FRS (“INT FRS”) that are relevant to its operations. The adoption of these
new/revised FRSs and INT FRSs does not result in changes to the Group’s and Company’s accounting policies
and has no material effect on the amounts reported for the current or prior years except as disclosed below:
New and revised standards on consolidation, joint arrangements, associates and disclosures
In September 2011, a package of fi ve standards on consolidation, joint arrangements, associates and
disclosures was issued comprising FRS 110 Consolidated Financial Statements, FRS 111 Joint Arrangements,
FRS 112 Disclosure of Interests in Other Entities, FRS 27 (as revised in 2011) Separate Financial Statements and FRS 28 (as revised in 2011) Investments in Associates and Joint Ventures. Subsequent to the issue of these
standards, amendments to FRS 110, FRS 111 and FRS 112 were issued to clarify certain transitional guidance
on the fi rst-time application of these standards.

Ann
ual R
epor
t 201
4
|
O
tto
Mar
ine
Lim
ited
51
Notes toFinancial Statements
For the Financial year ended 31 December 2014
2 SUMMARY OF SIGNIFICANT ACCOUNTING POLICIES (cont’d)
In the current year, the Group has applied for the fi rst time FRS 110, FRS 111, FRS 112, FRS 27 (as revised
in 2011) and FRS 28 (as revised in 2011) together with the amendments to FRS 110, FRS 111 and FRS 112
regarding the transitional guidance.
The impact of the application of these standards is set out below.
Impact of the application of FRS 110
Management made an assessment as at the date of initial application of FRS 110 (i.e January 1, 2014) and
concluded that there has been no other investee for which the Group has control over, other than those already
accounted for as subsidiary as at 1 January 2014.
Impact of the application of FRS 112
FRS 112 is a new disclosure standard and is applicable to entities that have interests in subsidiaries, joint
arrangements, associates and/or unconsolidated structured entities. In general, the application of FRS 112 has
resulted in more extensive disclosures in the consolidated fi nancial statements.
Management made an assessment and concluded there is no material disclosures arising from FRS 112 as the
Group’s non-controlling interests, joint ventures and associates are not material to the Group.
At the date of authorisation of these fi nancial statements, the following FRSs and amendments to FRS that are
relevant to the Group and the Company were issued but not effective:
FRS 115 Revenue from Contracts with Customers3
Amendments to FRS 1 Presentation of Financial Statements: Disclosure Initiative2
FRS 109 Financial Instruments4
Amendments to FRS 110 Consolidated Financial Statements and FRS 28 Investments in Associates and
Joint Ventures: Sale or Contribution of Assets between an Investor and its Associate or Joint Venture.2
Amendments to FRS 16 Property, Plant and Equipments2
Amendments to FRS 111 Joint Arrangements: Accounting for Acquisitions of Interests in Joint
Operations2
Improvements to Financial Reporting Standards (January 2014)1
Improvements to Financial Reporting Standards (February 2014)1
Improvements to Financial Reporting Standards (November 2014)2
1 Applies to annual periods beginning on or after 1 July 2014, with early application permitted.
2 Applies to annual periods beginning on or after 1 January 2016, with early application permitted.
3 Applies to annual periods beginning on or after 1 January 2017, with early application permitted.
4 Applies to annual periods beginning on or after 1 January 2018, with early application permitted.
Consequential amendments were also made to various standards as a result of these new/revised standards.
Ann
ual R
epor
t 201
4
|
O
tto
Mar
ine
Lim
ited
52
Notes toFinancial StatementsFor the Financial year ended 31 December 2014
2 SUMMARY OF SIGNIFICANT ACCOUNTING POLICIES (cont’d)
The management anticipates that the adoption of the above FRSs, INT FRSs and amendments to FRS in future
periods will not have a material impact on the fi nancial statements of the Group and of the Company in the
period of their initial adoption except for the following:
FRS 115 Revenue from Contracts with Customers
In November 2014, FRS 115 was issued which establishes a single comprehensive model for entities to use
in accounting for revenue arising from contracts with customers. FRS 115 will supersede the current revenue
recognition guidance including FRS 18 Revenue, FRS 11 Construction Contracts and the related interpretations
when it becomes effective.
The core principle of FRS 115 is that an entity should recognise revenue to depict the transfer of promised
goods or services to customers in an amount that refl ects the consideration to which the entity expects to be
entitled in exchange for those goods or services. Specifi cally, the standard introduces a 5-step approach to
revenue recognition:
Step 1: Identify the contract(s) with a customer
Step 2: Identify the performance obligations in the contract
Step 3: Determine the transaction price
Step 4: Allocate the transaction price to the performance obligations in the contract
Step 5: Recognise revenue when (or as) the entity satisifi es a performance obligation
Under FRS 115, an entity recognises revenue when a performance obligation is satisfi ed, i.e. when “control” of
the goods or services underlying the particular performance obligation is transferred to the customer. In addition,
extensive disclosures are required by FRS 115.
Management is currently evaluating the potential impact of the application of these amendments to FRS 115 on
the fi nancial statements of the Group and of the Company in the period of initial application.
Amendments to FRS 1 Presentation of Financial Statements: Disclosure Initiative
Amendments have been made to the following:
Materiality and aggregation - An entity shall not obscure useful information by aggregating or disaggregating
information and materiality considerations apply to the primary statements, notes and any specifi c disclosure
requirements in FRSs.
Balance sheet and statement of profi t or loss and other comprehensive income - The list of line items to be
presented in these statements can be aggregated or disaggregated as relevant. Guidance on subtotals in these
statements has also been included.
Presentation of items of other comprehensive income (“OCI”) arising from equity-accounted investments - An
entity’s share of OCI of equity-accounted associates and joint ventures should be presented in aggregate as
single items based on whether or not it will subsequently be reclassifi ed to profi t or loss.
Entities have fl exibility when designing the structure of the notes and guidance is introduced on how to
determine a systematic order of the notes.
Management is currently evaluating the potential impact of the application of these amendments to FRS 1 on the
fi nancial statements of the Group and of the Company in the period of initial application.
Ann
ual R
epor
t 201
4
|
O
tto
Mar
ine
Lim
ited
53
Notes toFinancial Statements
For the Financial year ended 31 December 2014
2 SUMMARY OF SIGNIFICANT ACCOUNTING POLICIES (cont’d)
BASIS OF CONSOLIDATION - The consolidated fi nancial statements incorporate the fi nancial statements of the
Company and entities (including structured entities) controlled by the Company and its subsidiaries. Control is
achieved when the Company:
Has power over the investee;
Is exposed, or has rights, to variable returns from its involvement with the investee; and
Has the ability to use its power to affect its returns.
The Company reassesses whether or not it controls an investee if facts and circumstances indicate that there
are changes to one or more of the three elements of control listed above.
When the Company has less than a majority of the voting rights of an investee, it has power over the investee
when the voting rights are suffi cient to give it the practical ability to direct the relevant activities of the investee
unilaterally. The Company considers all relevant facts and circumstances in assessing whether or not the
Company’s voting rights in an investee are suffi cient to give it power, including:
The size of the Company’s holding of voting rights relative to the size and dispersion of holdings of the
other vote holders;
Potential voting rights held by the Company, other vote holders or other parties;
Rights arising from other contractual arrangements; and
Any additional facts and circumstances that indicate that the Company has, or does not have, the current
ability to direct the relevant activities at the time that decisions need to be made, including voting patterns
at previous shareholders’ meetings.
Consolidation of a subsidiary begins when the Company obtains control over the subsidiary and ceases when
the Company loses control of the subsidiary. Specifi cally, income and expenses of a subsidiary acquired or
disposed of during the year are included in statement of profi t or loss and other comprehensive income from the
date the Company gains control until the date when the Company ceases to control the subsidiary.
Profi t or loss and each component of other comprehensive income are attributed to the owners of the Company
and to the non-controlling interests. Total comprehensive income of subsidiaries is attributed to the owners of
the Company and to the non-controlling interests even if this results in the non-controlling interests having a
defi cit balance.
When necessary, adjustments are made to the fi nancial statements of subsidiaries to bring their accounting
policies in line with the Group’s accounting policies.
Changes in the Group’s ownership interests in subsidiaries that do not result in the Group losing control over
the subsidiaries are accounted for as equity transactions. The carrying amounts of the Group’s interests and
the non-controlling interests are adjusted to refl ect the changes in their relative interests in the subsidiaries. Any
difference between the amount by which the non-controlling interests are adjusted and the fair value of the
consideration paid or received is recognised directly in equity and attributed to owners of the Company.
When the Group loses control of a subsidiary, a gain or loss is recognised in profi t or loss and is calculated
as the difference between (i) the aggregate of the fair value of the consideration received and the fair value
of any retained interest and (ii) the previous carrying amount of the assets (including goodwill), and liabilities
of the subsidiary and any non-controlling interests. All amounts previously recognised in other comprehensive
income in relation to that subsidiary are accounted for as if the Group had directly disposed of the related assets
or liabilities of the subsidiary (i.e. reclassifi ed to profi t or loss or transferred to another category of equity as
specifi ed/permitted by applicable FRSs). The fair value of any investment retained in the former subsidiary at the
date when control is lost is regarded as the fair value on initial recognition for subsequent accounting under FRS
39, when applicable, the cost on initial recognition of an investment in an associate or a joint venture.
In the Company’s fi nancial statements, investments in subsidiaries, associates and joint ventures are carried at
cost less any impairment in net recoverable value that has been recognised in profi t or loss.

Ann
ual R
epor
t 201
4
|
O
tto
Mar
ine
Lim
ited
54
Notes toFinancial StatementsFor the Financial year ended 31 December 2014
2 SUMMARY OF SIGNIFICANT ACCOUNTING POLICIES (cont’d)
BUSINESS COMBINATIONS - Acquisitions of subsidiaries and businesses are accounted for using the
acquisition method. The consideration for each acquisition is measured at the aggregate of the acquisition date
fair values of assets given, liabilities incurred by the Group to the former owners of the acquiree, and equity
interests issued by the Group in exchange for control of the acquiree. Acquisition-related costs are recognised in
profi t or loss as incurred.
Where applicable, the consideration for the acquisition includes any asset or liability resulting from a contingent
consideration arrangement, measured at its acquisition-date fair value. Subsequent changes in such fair values
are adjusted against the cost of acquisition where they qualify as measurement period adjustments (see below).
The subsequent accounting for changes in the fair value of the contingent consideration that do not qualify
as measurement period adjustments depends on how the contingent consideration is classifi ed. Contingent
consideration that is classifi ed as equity is not remeasured at subsequent reporting dates and its subsequent
settlement is accounted for within equity. Contingent consideration that is classifi ed as an asset or a liability
is remeasured at subsequent reporting dates in accordance with FRS 39 Financial Instruments: Recognition and Measurement, or FRS 37 Provisions, Contingent Liabilities and Contingent Assets, as appropriate, with the
corresponding gain or loss being recognised in profi t or loss.
Where a business combination is achieved in stages, the Group’s previously held interests in the acquired entity
are remeasured to fair value at the acquisition date (i.e. the date the Group attains control) and the resulting
gain or loss, if any, is recognised in profi t or loss. Amounts arising from interests in the acquiree prior to the
acquisition date that have previously been recognised in other comprehensive income are reclassifi ed to profi t or
loss, where such treatment would be appropriate if that interest were disposed of.
The acquiree’s identifi able assets, liabilities and contingent liabilities that meet the conditions for recognition
under the FRS are recognised at their fair value at the acquisition date, except that:
deferred tax assets or liabilities and liabilities or assets related to employee benefi t arrangements are
recognised and measured in accordance with FRS 12 Income Taxes and FRS 19 Employee Benefi ts
respectively;
liabilities or equity instruments related to share-based payment transactions of the acquiree or the
replacement of an acquiree’s share-based payment awards transactions with share-based payment
awards transactions of the acquirer in accordance with the method in FRS 102 Share-based Payment at
the acquisition date; and
assets (or disposal groups) that are classifi ed as held for sale in accordance with FRS 105 Non-current
Assets Held for Sale and Discontinued Operations are measured in accordance with that Standard.
Non-controlling interests that are present ownership interests and entitle their holders to a proportionate share
of the entity’s net assets in the event of liquidation may be initially measured either at fair value or at the non-
controlling interests’ proportionate share of the recognised amounts of the acquiree’s identifi able net assets.
The choice of measurement basis is made on a transaction-by-transaction basis. Other types of non-controlling
interests are measured at fair value or, when applicable, on the basis specifi ed in another FRS.
If the initial accounting for a business combination is incomplete by the end of the reporting period in which the
combination occurs, the Group reports provisional amounts for the items for which the accounting is incomplete.
Those provisional amounts are adjusted during the measurement period (see below), or additional assets or
liabilities are recognised, to refl ect new information obtained about facts and circumstances that existed as of
the acquisition date that, if known, would have affected the amounts recognised as of that date.
The measurement period is the period from the date of acquisition to the date the Group obtains complete
information about facts and circumstances that existed as of the acquisition date – and is subject to a maximum
of one year from acquisition date.
The accounting policy for initial measurement of non-controlling interests is described above.
The policy described above is applied to all business combinations that take place on or after January 1, 2010.
FINANCIAL INSTRUMENTS - Financial assets and fi nancial liabilities are recognised on the Group’s balance
sheet when the Group becomes a party to the contractual provisions of the instrument.

Ann
ual R
epor
t 201
4
|
O
tto
Mar
ine
Lim
ited
55
Notes toFinancial Statements
For the Financial year ended 31 December 2014
2 SUMMARY OF SIGNIFICANT ACCOUNTING POLICIES (cont’d)
Effective interest method
The effective interest method is a method of calculating the amortised cost of a fi nancial instrument and of
allocating interest income or expense over the relevant period. The effective interest rate is the rate that exactly
discounts estimated future cash receipts or payments (including all fees on points paid or received that form
an integral part of the effective interest rate, transaction costs and other premiums or discounts) through
the expected life of the fi nancial instrument, or where appropriate, a shorter period. Income and expense is
recognised on an effective interest basis for debt instruments other than those fi nancial instruments “at fair value
through profi t or loss”.
Financial assets
All fi nancial assets are recognised and de-recognised on a trade date basis where the purchase or sale of an
investment is under a contract whose terms require delivery of the investment within the timeframe established
by the market concerned, and are initially measured at fair value plus transaction costs, except for those fi nancial
assets classifi ed as at fair value through profi t or loss which are initially measured at fair value.
Financial assets are classifi ed into the following specifi ed categories: “available-for-sale” fi nancial assets and
“loans and receivables”. The classifi cation depends on the nature and purpose of fi nancial assets and is
determined at the time of initial recognition.
Available-for-sale fi nancial assets
Available-for-sale fi nancial assets are those non-derivative fi nancial assets that are not classifi ed into any of the
other categories. Investments in equity instruments that do not have a quoted market price in an active market
and whose fair value cannot be reliably measured are measured at cost less impairment loss.
Certain equity shares held by the Group are classifi ed as being available for sale and are stated at fair value. Fair
value is determined in the manner described in Note 4(b)(v). Gains and losses arising from changes in fair value
are recognised in other comprehensive income with the exception of impairment losses, interest calculated using
the effective interest method and foreign exchange gains and losses on monetary assets which are recognised
directly in profi t or loss. Where the investment is disposed of or is determined to be impaired, the cumulative
gain or loss previously recognised in other comprehensive income and accumulated in revaluation reserve is
reclassifi ed to profi t or loss. Dividends on available-for-sale equity instruments are recognised in profi t or loss
when the Group’s right to receive payments is established. The fair value of available-for-sale monetary assets
denominated in a foreign currency is determined in that foreign currency and translated at the spot rate at
the end of the reporting period. The change in fair value attributable to translation differences that result from
a change in amortised cost of the available-for-sale monetary asset is recognised in profi t or loss, and other
changes are recognised in other comprehensive income.
Loans and receivables
Trade, other, loan and fi nance lease receivables that have fi xed or determinable payments that are not
quoted in an active market are classifi ed as “loans and receivables”. Loans and receivables (including trade
and other receivables, fi nance lease receivables, loan receivables, cash and bank balances) are measured at
initial recognition at fair value, and are subsequently measured at amortised cost using the effective interest
method less impairment. Interest is recognised by applying the effective interest method, except for short-term
receivables when the effect of discounting is immaterial.
Impairment of fi nancial assets
Financial assets are assessed for indicators of impairment at the end of each reporting period. Financial
assets are impaired when there is objective evidence that, as a result of one or more events that occurred after
the initial recognition of the fi nancial asset, the estimated future cash fl ows of the fi nancial assets have been
impacted.
For available-for-sale equity instruments, a signifi cant or prolonged decline in the fair value of the investment
below its cost is considered to be objective evidence of impairment.
Ann
ual R
epor
t 201
4
|
O
tto
Mar
ine
Lim
ited
56
Notes toFinancial StatementsFor the Financial year ended 31 December 2014
2 SUMMARY OF SIGNIFICANT ACCOUNTING POLICIES (cont’d)
Impairment of fi nancial assets (cont’d)
For all other fi nancial assets, objective evidence of impairment could include:
signifi cant fi nancial diffi culty of the issuer or counterparty; or
default or delinquency in interest or principal payments; or
it becoming probable that the borrower will enter bankruptcy or fi nancial re-organisation.
For certain categories of fi nancial asset, such as trade receivables, assets that are assessed not to be impaired
individually are, in addition, assessed for impairment on a collective basis. Objective evidence of impairment for
a portfolio of receivables could include the Group’s past experience of collecting payments, an increase in the
number of delayed payments in the portfolio past the average credit period, as well as observable changes in
national or local economic conditions that correlate with default on receivables.
For fi nancial assets carried at amortised cost, the amount of the impairment is the difference between the asset’s
carrying amount and the present value of estimated future cash fl ows, discounted at the original effective interest
rate.
For fi nancial assets that are carried at cost, the amount of the impairment loss is measured as the difference
between the asset’s carrying amount and the present value of the estimated future cash fl ows discounted
at the current market rate of return for a similar fi nancial asset. Such impairment loss will not be reversed in
subsequent periods.
The carrying amount of the fi nancial asset is reduced by the impairment loss directly for all fi nancial assets
with the exception of trade receivables where the carrying amount is reduced through the use of an allowance
account. When a trade receivable is uncollectible, it is written off against the allowance account. Subsequent
recoveries of amounts previously written off are credited against the allowance account. Changes in the carrying
amount of the allowance account are recognised in the profi t or loss.
For fi nancial assets measured at amortised cost, if, in a subsequent period, the amount of the impairment
loss decreases and the decrease can be related objectively to an event occurring after the impairment was
recognised, the previously recognised impairment loss is reversed through profi t or loss to the extent that
the carrying amount of the fi nancial asset at the date the impairment is reversed does not exceed what the
amortised cost would have been had the impairment not been recognised.
When an available-for-sale fi nancial asset is considered to be impaired, cumulative gains or losses previously
recognised in other comprehensive income are reclassifi ed to profi t or loss.
In respect of available-for-sale equity instruments, impairment losses previously recognised in the profi t or
loss are not reversed through profi t or loss. Any subsequent increase in fair value after an impairment loss is
recognised in other comprehensive income and accumulated under the heading of investments revaluation
reserves.
Derecognition of fi nancial assets
The Group derecognises a fi nancial asset only when the contractual rights to the cash fl ows from the asset
expire, or it transfers the fi nancial asset and substantially all the risks and rewards of ownership of the asset
to another entity. If the Group neither transfers nor retains substantially all the risks and rewards of ownership
and continues to control the transferred asset, the Group recognises its retained interest in the asset and an
associated liability for amounts it may have to pay. If the Group retains substantially all the risks and rewards
of ownership of a transferred fi nancial asset, the Group continues to recognise the fi nancial asset and also
recognises a collateralised borrowing for the proceeds received.

Ann
ual R
epor
t 201
4
|
O
tto
Mar
ine
Lim
ited
57
Notes toFinancial Statements
For the Financial year ended 31 December 2014
2 SUMMARY OF SIGNIFICANT ACCOUNTING POLICIES (cont’d)
Financial liabilities and equity instruments
Classifi cation as debt or equity
Financial liabilities and equity instruments issued by the Group are classifi ed according to the substance of the
contractual arrangements entered into and the defi nitions of a fi nancial liability and an equity instrument.
Equity instruments
An equity instrument is any contract that evidences a residual interest in the assets of the Group after deducting
all of its liabilities. Equity instruments are recorded at the proceeds received, net of direct issue costs.
Financial liabilities
Trade and other payables are initially measured at fair value, net of transaction costs, and are subsequently
measured at amortised cost, using the effective interest method, with interest expense recognised on an
effective yield basis.
Interest-bearing borrowings and overdrafts are initially measured at fair value, and are subsequently measured
at amortised cost, using the effective interest method. Any difference between the proceeds (net of transaction
costs) and the settlement or redemption of borrowings is recognised over the term of the borrowings in
accordance with the Group’s accounting policy for borrowing costs (see below).
Financial guarantee contract liabilities are measured initially at their fair values and subsequently at the higher of
the amount of obligation under the contract recognised as a provision in accordance with FRS 37 Provisions, Contingent Liabilities and Contingent Assets and the amount initially recognised less cumulative amortisation in
accordance with FRS 18 Revenue.
Derecognition of fi nancial liabilities
The Group derecognises fi nancial liabilities when, and only when, the Group’s obligations are discharged,
cancelled or they expire.
Derivative fi nancial instruments and hedge accounting
The Group enters into derivative fi nancial instruments to manage its exposure to interest rate risk and foreign
exchange rate risk including foreign exchange forward contracts and interest rate swaps. Details of derivative
fi nancial instruments are disclosed in Note 27 to the fi nancial statements.
Derivatives are initially recognised at fair value at the date a derivative contract is entered into and are
subsequently remeasured to their fair value at the end of each reporting period. The resulting gain or loss is
recognised in profi t or loss immediately unless the derivative is designated and effective as a hedging instrument,
in which event the timing of the recognition in profi t or loss depends on the nature of the hedge relationship.
The Group designates certain derivatives as either hedges of the fair value of recognised liabilities or fi rm
commitments (fair value hedges) or hedges of foreign currency risk of fi rm commitments (cash fl ow hedges).
A derivative is presented as a non-current asset or a non-current liability if the remaining maturity of the
instrument is more than 12 months from the end of the reporting period and it is not expected to be realised or
settled within 12 months. Other derivatives are presented as current assets or current liabilities.
Hedge accounting
The Group designates certain hedging instruments, which include derivatives, embedded derivatives and non-
derivatives in respect of foreign currency risk, as either fair value hedges or cash fl ow hedges. Hedges of foreign
exchange risk on fi rm commitments are accounted for as cash fl ow hedges.
At the inception of the hedge relationship, the entity documents the relationship between the hedging instrument
and hedged item, along with its risk management objectives and its strategy for undertaking various hedge
transactions. Furthermore, at the inception of the hedge and on an ongoing basis, the Group documents
whether the hedging instrument that is used in a hedging relationship is highly effective in offsetting changes in
fair values or cash fl ows of the hedged item.
Ann
ual R
epor
t 201
4
|
O
tto
Mar
ine
Lim
ited
58
Notes toFinancial StatementsFor the Financial year ended 31 December 2014
2 SUMMARY OF SIGNIFICANT ACCOUNTING POLICIES (cont’d)
Hedge accounting (cont’d)
Note 27 contains details of the fair values of the derivative instruments used for hedging purposes.
Fair value hedge
Changes in the fair value of derivatives that are designated and qualify as fair value hedges are recorded in
profi t or loss immediately, together with any changes in the fair value of the hedged item that is attributable to
the hedged risk. The change in the fair value of the hedging instrument and the change in the hedged item
attributable to the hedged risk are recognised in the line of the profi t or loss statement relating to the hedged
item.
Hedge accounting is discontinued when the Group revokes the hedging relationship, the hedging instrument
expires or is sold, terminated, or exercised, or no longer qualifi es for hedge accounting. The adjustment to the
carrying amount of the hedged item arising from the hedged risk is amortised to the profi t or loss from that date.
Cash fl ow hedge
The effective portion of changes in the fair value of derivatives that are designated and qualify as cash fl ow
hedges are recognised in other comprehensive income. The gain or loss relating to the ineffective portion is
recognised immediately in profi t or loss as part of other gains and losses.
Amounts recognised in other comprehensive income and accumulated in equity are reclassifi ed to profi t or
loss in the periods when the hedged item is recognised in profi t or loss in the same line of the profi t and loss
statement as the recognised hedged item. However, when the forecast transaction that is hedged results in the
recognition of a non-fi nancial asset or a non-fi nancial liability, the gains and losses previously accumulated in
equity are transferred from equity and included in the initial measurement of the cost of the asset or liability.
Hedge accounting is discontinued when the Group revokes the hedging relationship, the hedging instrument
expires or is sold, terminated, or exercised, or no longer qualifi es for hedge accounting. At that time, for forecast
transactions, any cumulative gain or loss on the hedging instrument recognised in equity is retained in equity
until the forecast occurs. If a hedged transaction is no longer expected to occur, the net cumulative gain or loss
that was accumulated in equity is recognised immediately in profi t or loss.
CONSTRUCTION CONTRACTS - Where the outcome of a long-term construction contract can be estimated
reliably, revenue and costs are recognised by reference to the stage of completion of the contract activity at the
end of the reporting period, as measured by the completion of a physical proportion of the contract work. For
fi xed price contract, the outcome of a construction contract can be estimated reliably when all the following
conditions are satisfi ed:
a) total contract revenue can be measured reliably;
b) it is probable that the economic benefi ts associated with the contract will fl ow to the Group;
c) both the contract costs to complete the contract and the stage of contract completion at the end of the
reporting period can be measured reliably; and
d) the contract costs attributable to the contract can be clearly identifi ed and measured reliably so that
actual contract costs incurred can be compared with prior estimates.
Variations in contract work, claims and incentive payments are included to the extent that they have been agreed
with the customer.
Where the outcome of a construction contract cannot be estimated reliably, contract revenue is recognised to
the extent of contract costs incurred that it is probable will be recoverable. Contract costs are recognised as
expenses in the period in which they are incurred.
When it is probable that total contract costs will exceed total contract revenue, the expected loss is recognised
as an expense immediately.

Ann
ual R
epor
t 201
4
|
O
tto
Mar
ine
Lim
ited
59
Notes toFinancial Statements
For the Financial year ended 31 December 2014
2 SUMMARY OF SIGNIFICANT ACCOUNTING POLICIES (cont’d)
When contract costs incurred to date plus recognised profi ts less recognised losses exceed progress billings,
the surplus is shown as amounts due from customers for contract work. For contracts where progress billings
exceed contract costs incurred to date plus recognised profi ts less recognised losses, the surplus is shown
as amounts due to customers for contract work. Amounts received before the related work is performed are
included in the consolidated balance sheet, as a liability, as amounts due to construction contracts customers.
Amounts billed for work performed but not yet paid by the customer are included in the consolidated balance
sheet under trade and other receivables.
LEASES - Leases are classifi ed as fi nance leases whenever the terms of the lease transfer substantially all the
risks and rewards of ownership to the lessee. All other leases are classifi ed as operating leases.
The Group as lessor
Amounts due from lessees under fi nance leases are recorded as receivables at the amount of the Group’s
net investment in the leases. At the inception of the lease, revenue under the fi nance lease arrangement is
recognised based on lower of fair value of the asset or the present value of the minimum lease payments
computed at a market rate of interest. Subsequently, fi nance lease income is allocated to accounting periods
so as to refl ect a constant periodic rate of return on the Group’s net investment outstanding in respect of the
leases.
Charter hire income from operating leases is recognised on a straight-line basis over the term of the relevant
lease unless another systematic basis is more representative of the time pattern in which use benefi t derived
from the leased asset is diminished.
The Group as lessee
Assets held under fi nance leases are recognised as assets of the Group at their fair value at the inception of the
lease or, if lower, at the present value of the minimum lease payments. The corresponding liability to the lessor
is included in the balance sheet as a fi nance lease obligation. Lease payments are apportioned between fi nance
charges and reduction of the lease obligation so as to achieve a constant rate of interest on the remaining
balance of the liability. Finance charges are charged directly to profi t or loss, unless they are directly attributable
to qualifying assets, in which case they are capitalised in accordance with the Group’s general policy on
borrowing costs (see below).
Rentals payable under operating leases are charged to the profi t or loss on a straight-line basis over the term of
the relevant lease unless another systematic basis is more representative of the time pattern in which economic
benefi ts from the leased asset are consumed. Contingent rentals arising under operating leases are recognised
in profi t or loss in the period in which they are incurred.
INVENTORIES - Inventories are stated at the lower of cost and net realisable value. Cost comprises direct
materials and, where applicable, direct labour costs and those overheads that have been incurred in bringing the
inventories to their present location and condition. Cost is calculated using the weighted average method.
Work-in-progress-vessels comprise vessels under construction for future sale. Cost is made up of direct
materials, direct labour cost, subcontractors cost, capitalised borrowing costs, appropriate allocation of fi xed
and variable production overheads.
Net realisable value represents the estimated selling price less all estimated costs to completion and costs to be
incurred in marketing, selling and distribution.
PROPERTY, PLANT AND EQUIPMENT - Property, plant and equipment are stated at cost less accumulated
depreciation and any accumulated impairment losses.
Property, plant and equipment relating to construction-in-progress includes borrowings costs capitalised.

Ann
ual R
epor
t 201
4
|
O
tto
Mar
ine
Lim
ited
60
Notes toFinancial StatementsFor the Financial year ended 31 December 2014
2 SUMMARY OF SIGNIFICANT ACCOUNTING POLICIES (cont’d)
Depreciation is charged so as to write off the cost of assets, other than construction-in-progress, over their
estimated useful lives, using the straight-line method, on the following bases:
Vessels - 12.5 to 25 years, net of the residual value
Leasehold land and building - Over the remaining term of lease which is between 20 to 30
years
Offi ce equipment, furniture and fi ttings - 2 to 20 years
Motor vehicles - 4 to 5 years
Machinery and equipment - 2 to 8 years
Depreciation on property, plant and equipment under construction-in-progress, which includes yard development
costs and costs for vessels under construction, commences when these assets are ready for its intended use.
The estimated useful lives, residual values and depreciation method are reviewed at each year end, with the
effect of any changes in estimate accounted for on a prospective basis.
Assets held under fi nance leases are depreciated over their expected useful lives on the same basis as owned
assets or, if there is no certainty that the lessee will obtain ownership by the end of the lease term, the asset
shall be fully depreciated over the shorter of the lease term and its useful life.
The gain or loss arising on disposal or retirement of an item of property, plant and equipment is determined as
the difference between the sales proceeds and the carrying amounts of the asset and is recognised in profi t or
loss.
GOODWILL - Goodwill arising in a business combination is recognised as an asset at the date that control is
acquired (the acquisition date). Goodwill is measured as the excess of the sum of the consideration transferred,
the amount of any non-controlling interest in the acquiree and the fair value of the acquirer’s previously held
equity interest (if any) in the entity over net of the acquisition-date amounts of the identifi able assets acquired
and the liabilities assumed.
If, after reassessment, the Group’s interest in the fair value of the acquiree’s identifi able net assets exceeds the
sum of the consideration transferred, the amount of any non-controlling interest in the acquiree and the fair value
of the acquirer’s previously held equity interest in the acquiree (if any), the excess is recognised immediately in
profi t or loss as a bargain purchase gain.
Goodwill is not amortised but is reviewed for impairment at least annually. For the purpose of impairment testing,
goodwill is allocated to each of the Group’s cash-generating units expected to benefi t from the synergies of the
combination. Cash-generating units to which goodwill has been allocated are tested for impairment annually,
or more frequently when there is an indication that the unit may be impaired. If the recoverable amount of the
cash-generating unit is less than its carrying amount, the impairment loss is allocated fi rst to reduce the carrying
amount of any goodwill allocated to the unit and then to the other assets of the unit pro-rata on the basis of
the carrying amount of each asset in the unit. An impairment loss recognised for goodwill is not reversed in a
subsequent period.
On disposal of a subsidiary, the attributable amount of goodwill is included in the determination of the profi t or
loss on disposal.
IMPAIRMENT OF ASSETS EXCLUDING GOODWILL - At the end of each reporting period, the Group reviews
the carrying amounts of its assets to determine whether there is any indication that those assets have suffered
an impairment loss. If any such indication exists, the recoverable amount of the asset is estimated in order to
determine the extent of the impairment loss (if any). Where it is not possible to estimate the recoverable amount
of an individual asset, the Group estimates the recoverable amount of the cash-generating unit to which the
asset belongs. Where a reasonable and consistent basis of allocation can be identifi ed, corporate assets are
also allocated to individual cash-generating units, or otherwise they are allocated to the smallest group of cash-
generating units for which a reasonable and consistent allocation basis can be identifi ed.

Ann
ual R
epor
t 201
4
|
O
tto
Mar
ine
Lim
ited
61
Notes toFinancial Statements
For the Financial year ended 31 December 2014
2 SUMMARY OF SIGNIFICANT ACCOUNTING POLICIES (cont’d)
Recoverable amount is the higher of fair value less costs to sell and value in use. In assessing value in use,
the estimated future cash fl ows are discounted to their present value using a pre-tax discount rate that refl ects
current market assessments of the time value of money and the risks specifi c to the asset for which the
estimates of future cash fl ows have not been adjusted.
If the recoverable amount of an asset (or cash-generating unit) is estimated to be less than its carrying amount,
the carrying amount of the asset (cash-generating unit) is reduced to its recoverable amount. An impairment
loss is recognised immediately in the profi t or loss.
Where an impairment loss subsequently reverses, the carrying amount of the asset (cash-generating unit) is
increased to the revised estimate of its recoverable amount, but so that the increased carrying amount does
not exceed the carrying amount that would have been determined had no impairment loss been recognised for
the asset (cash-generating unit) in prior years. A reversal of an impairment loss is recognised immediately in the
profi t or loss.
ASSOCIATES AND JOINT VENTURES - An associate is an entity over which the Group has signifi cant infl uence.
Signifi cant infl uence is the power to participate in the fi nancial and operating policy decisions of the investee but
is not control or joint control over those policies.
A joint venture is a joint arrangement whereby the parties that have joint control of the arrangement have rights
to the net assets of the joint arrangement. Joint control is the contractually agreed sharing of control of an
arrangement, which exists only when decisions about the relevant activities require unanimous consent of the
parties sharing control.
The results and assets and liabilities of associates or joint ventures are incorporated in these consolidated
fi nancial statements using the equity method of accounting. Under the equity method, an investment in
an associate or a joint venture is initially recognised in the consolidated balance sheet at cost and adjusted
thereafter to recognise the Group’s share of the profi t or loss and other comprehensive income of the associate
or joint venture. When the Group’s share of losses of an associate or a joint venture exceeds the Group’s interest
in that associate or joint venture (which includes any long-term interests that, in substance, form part of the
Group’s net investment in the associate or joint venture), the Group discontinues recognising its share of further
losses. Additional losses are recognised only to the extent that the Group has incurred legal or constructive
obligations or made payments on behalf of the associate or joint venture.
An investment in an associate or a joint venture is accounted for using the equity method from the date on
which the investee becomes an associate or a joint venture. On acquisition of the investment in an associate
or a joint venture, any excess of the cost of the investment over the Group’s share of the net fair value of the
identifi able assets and liabilities of the investee is recognised as goodwill, which is included within the carrying
amount of the investment. Any excess of the Group’s share of the net fair value of the identifi able assets and
liabilities over the cost of the investment, after reassessment, is recognised immediately in profi t or loss in the
period in which the investment is acquired.
The requirements of FRS 39 are applied to determine whether it is necessary to recognise any impairment loss
with respect to the Group’s investment in an associate or a joint venture. When necessary, the entire carrying
amount of the investment (including goodwill) is tested for impairment in accordance with FRS 36 Impairment of Assets as a single asset by comparing its recoverable amount (higher of value in use and fair value less
costs to sell) with its carrying amount, any impairment loss recognised forms part of the carrying amount of the
investment. Any reversal of that impairment loss is recognised in accordance with FRS 36 to the extent that the
recoverable amount of the investment subsequently increases.

Ann
ual R
epor
t 201
4
|
O
tto
Mar
ine
Lim
ited
62
Notes toFinancial StatementsFor the Financial year ended 31 December 2014
2 SUMMARY OF SIGNIFICANT ACCOUNTING POLICIES (cont’d)
The Group discontinues the use of the equity method from the date when the investment ceases to be an
associate or a joint venture, or when the investment is classifi ed as held for sale. When the Group retains an
interest in the former associate or joint venture and the retained interest is a fi nancial asset, the Group measures
the retained interest at fair value at that date and the fair value is regarded as its fair value on initial recognition
in accordance with FRS 39. The difference between the carrying amount of the associate or joint venture at the
date the equity method was discontinued, and the fair value of any retained interest and any proceeds from
disposing of a part interest in the associate or joint venture is included in the determination of the gain or loss on
disposal of the associate or joint venture. In addition, the Group accounts for all amounts previously recognised
in other comprehensive income in relation to that associate or joint venture on the same basis as would be
required if that associate or joint venture had directly disposed of the related assets or liabilities. Therefore, if a
gain or loss previously recognised in other comprehensive income by that associate or joint venture would be
reclassifi ed to profi t or loss on the disposal of the related assets or liabilities, the Group reclassifi es the gain or
loss from equity to profi t or loss (as a reclassifi cation adjustment) when the equity method is discontinued.
The Group continues to use the equity method when an investment in an associate becomes an investment
in a joint venture or an investment in a joint venture becomes an investment in an associate. There is no
remeasurement to fair value upon such changes in ownership interests.
When the Group reduces its ownership interest in an associate or a joint venture but the Group continues to use
the equity method, the Group reclassifi es to profi t or loss the proportion of the gain or loss that had previously
been recognised in other comprehensive income relating to that reduction in ownership interest if that gain or
loss would be reclassifi ed to profi t or loss on the disposal of the related assets or liabilities.
When a Group entity transacts with an associate or a joint venture of the Group, profi ts and losses resulting
from the transactions with the associate or joint venture are recognised in the Group’s consolidated fi nancial
statements only to the extent of interests in the associate or joint venture that are not related to the Group.
PROVISIONS - Provisions are recognised when the Group has a present obligation (legal or constructive) as a
result of a past event, it is probable that the Group will be required to settle the obligation, and a reliable estimate
can be made of the amount of the obligation.
The amount recognised as a provision is the best estimate of the consideration required to settle the present
obligation at the end of the reporting period, taking into account the risks and uncertainties surrounding the
obligation. Where a provision is measured using the cash fl ows estimated to settle the present obligation, its
carrying amount is the present value of those cash fl ows.
When some or all of the economic benefi ts required to settle a provision are expected to be recovered from a
third party, the receivable is recognised as an asset if it is virtually certain that reimbursement will be received and
the amount of the receivable can be measured reliably.
Provisions for warranty costs are recognised at the date of sale of the vessel, at management’s best estimate of
the expenditure required to settle the Group’s obligation.
SHARE-BASED PAYMENTS - The Group issues equity-settled share-based payments to certain employees.
Equity-settled share-based payments are measured at fair value of the equity instruments at the date of grant.
The fair value determined at the grant date of the equity-settled share-based payments is expensed on a
straight-line basis over the vesting period, based on the Group’s estimate of the number of equity instruments
that will eventually vest. At the end of each reporting period, the Group revises its estimate of the number of
equity instruments expected to vest. The impact of the revision of the original estimates, if any, is recognised in
profi t or loss such that the cumulative expense refl ects the revised estimate, with a corresponding adjustment to
the equity-settled employee benefi ts reserve.
REVENUE RECOGNITION - Revenue is measured at fair value of the consideration received or receivable.
Revenue is reduced for estimated customer returns, rebates and other similar allowances.

Ann
ual R
epor
t 201
4
|
O
tto
Mar
ine
Lim
ited
63
Notes toFinancial Statements
For the Financial year ended 31 December 2014
2 SUMMARY OF SIGNIFICANT ACCOUNTING POLICIES (cont’d)
Revenue from long-term construction contracts
Revenue from long-term construction contracts is recognised in accordance with the Group’s accounting policy
on construction contracts (see above).
Revenue from ship repairs, conversion and fabrication, and subsea services
Revenue from rendering of ship repairs, conversion and fabrication, and subsea services is recognised when the
services have been rendered.
Charter hire income
Charter hire income is recognised based on a time proportion basis in accordance with the daily charter rate
stated in the charter hire agreement for the number of days under charter.
Finance lease income
Revenue from fi nance lease is recognised in accordance with the Group’s accounting policy on leases when the
Group is a lessor (see above).
Interest income
Interest income is accrued on a time basis, by reference to the principal outstanding and at the effective interest
rate applicable.
BORROWING COSTS - Borrowing costs directly attributable to the acquisition, construction or production
of qualifying assets, which are assets that necessarily take a substantial period of time to get ready for their
intended use or sale, are added to the cost of those assets, until such time as the assets are substantially ready
for their intended use or sale. All other borrowing costs are recognised in profi t or loss in the period in which
they are incurred.
RETIREMENT BENEFIT COSTS - Payments to defi ned contribution retirement benefi t plans are charged as an
expense when employees have rendered the services entitling them to the contributions. Payments made to
state-managed retirement benefi t schemes, such as the Singapore Central Provident Fund, are dealt with as
payments to defi ned contribution plans where the Group’s obligations under the plans are equivalent to those
arising in a defi ned contribution retirement benefi t plan.
EMPLOYEE LEAVE ENTITLEMENT - Employees’ entitlements to annual leave are recognised when they accrue
to employees. A provision is made for the estimated liability for annual leave as a result of services rendered by
employees up to the end of the reporting period.
INCOME TAX - Income tax expense represents the sum of the tax currently payable and deferred tax.
The tax currently payable is based on taxable profi t for the year. Taxable profi t differs from profi t as reported in
the profi t or loss statement because it excludes items of income or expense that are taxable or deductible in
other years and it further excludes items that are not taxable or tax deductible. The Group’s liability for current
tax is calculated using tax rates (and tax laws) that have been enacted or substantively enacted in countries
where the Company and its subsidiaries operate by the end of the reporting period.
Deferred tax is recognised on differences between the carrying amounts of assets and liabilities in the fi nancial
statements and the corresponding tax bases used in the computation of taxable profi t. Deferred tax liabilities are
generally recognised for all taxable temporary differences and deferred tax assets are recognised to the extent
that it is probable that taxable profi ts will be available against which deductible temporary differences can be
utilised. Such assets and liabilities are not recognised if the temporary difference arises from goodwill or from
the initial recognition (other than in a business combination) of other assets and liabilities in a transaction that
affects neither the taxable profi t nor the accounting profi t.
Ann
ual R
epor
t 201
4
|
O
tto
Mar
ine
Lim
ited
64
Notes toFinancial StatementsFor the Financial year ended 31 December 2014
2 SUMMARY OF SIGNIFICANT ACCOUNTING POLICIES (cont’d)
Deferred tax liabilities are recognised on taxable temporary differences arising on investments in subsidiaries,
associates and joint ventures, except where the Group is able to control the reversal of the temporary difference
and it is probable that the temporary difference will not reverse in the foreseeable future. Deferred tax assets
arising from deductible temporary differences associated with such investments and interests are only
recognised to the extent that it is probable that there will be suffi cient taxable profi ts against which to utilise the
benefi ts of the temporary differences and they are expected to reverse in the foreseeable future.
The carrying amount of deferred tax assets is reviewed at the end of each reporting period and reduced to the
extent that it is no longer probable that suffi cient taxable profi ts will be available to allow all or part of the asset to
be recovered.
Deferred tax is calculated at the tax rates that are expected to apply in the period when the liability is settled or
the asset realised based on the tax rates (and tax laws) that have been enacted or substantively enacted by the
end of the reporting period. The measurement of deferred tax liabilities and assets refl ects the tax consequences
that would follow from the manner in which the Group expects, at the end of the reporting period, to recover or
settle the carrying amount of its assets and liabilities.
Deferred tax assets and liabilities are offset when there is a legally enforceable right to set off current tax assets
against current tax liabilities and when they relate to income taxes levied by the same taxation authority and the
Group intends to settle its current tax assets and liabilities on a net basis.
Current and deferred tax are recognised as an expense or income in profi t or loss.
FOREIGN CURRENCY TRANSACTIONS AND TRANSLATION - The individual fi nancial statements of each
Group entity are measured and presented in the currency of the primary economic environment in which the
entity operates (its functional currency). The consolidated fi nancial statements of the Group and the balance
sheet and statement of changes in equity of the Company are presented in United States dollars, which is the
functional currency of the Company.
In preparing the fi nancial statements of the individual entities, transactions in currencies other than the entity’s
functional currency are recorded at the rates of exchange prevailing on the date of the transaction. At the end of
each reporting period, monetary items denominated in foreign currencies are retranslated at the rates prevailing
on the reporting date. Non-monetary items carried at fair value that are denominated in foreign currencies are
retranslated at the rates prevailing on the date when the fair value was determined. Non-monetary items that are
measured in terms of historical cost in a foreign currency are not retranslated.
Exchange differences arising on the settlement of monetary items, and on retranslation of monetary items are
included in profi t or loss for the year. Exchange differences arising on the retranslation of non-monetary items
carried at fair value are included in profi t or loss for the period except for differences arising on the retranslation
of non-monetary items in respect of which gains or losses are recognised in other comprehensive income.
For such non-monetary items, any exchange component of that gain or loss is also recognised in other
comprehensive income.
For the purpose of presenting consolidated fi nancial statements, the assets and liabilities of the Group’s foreign
operations (including comparatives) are expressed in United States dollars using exchange rates prevailing at the
end of the reporting period. Income and expense items (including comparatives) are translated at the average
exchange rates for the year. Exchange differences arising, if any, are recognised in other comprehensive income
and accumulated in a separate component of equity under the header of translation reserves.
On the disposal of a foreign operation (i.e. a disposal of the Group’s entire interest in a foreign operation, or
a disposal involving loss of control over a subsidiary that includes a foreign operation, or loss of joint control
over a jointly controlled entity that includes a foreign operation or loss of signifi cant infl uence over an associate
that includes a foreign operation), all of the accumulated exchange differences in respect of that operation
attributable to the Group are reclassifi ed to profi t or loss. Any exchange differences that have previously been
attributed to non-controlling interests are derecognised, but they are not reclassifi ed to profi t or loss.
In the case of a partial disposal (i.e. no loss of control) of a subsidiary that includes a foreign operation, the
proportionate share of accumulated exchange differences are re-attributed to non-controlling interests and are
not recognised in profi t or loss. For all other partial disposals (i.e. of associates or jointly controlled entities that
do not result in the Group losing signifi cant infl uence or joint control), the proportionate share of the accumulated
exchange differences is reclassifi ed to profi t or loss.
Ann
ual R
epor
t 201
4
|
O
tto
Mar
ine
Lim
ited
65
Notes toFinancial Statements
For the Financial year ended 31 December 2014
2 SUMMARY OF SIGNIFICANT ACCOUNTING POLICIES (cont’d)
On consolidation, exchange differences arising from the translation of the net investment in foreign entities
(including monetary items that, in substance, form part of the net investment in foreign entities) are recognised
in other comprehensive income and accumulated in a separate component of equity under the header of
translation reserves.
Goodwill and fair value adjustments arising from the acquisition of a foreign operation are treated as assets and
liabilities of the foreign operation and translated at the closing rate.
CASH AND CASH EQUIVALENTS IN THE STATEMENT OF CASH FLOWS - Cash and cash equivalents
comprise cash on hand and demand deposits that are readily convertible to a known amount of cash and are
subject to an insignifi cant risk of changes in value.
3 CRITICAL ACCOUNTING JUDGEMENT ANDKEY SOURCES OF ESTIMATION UNCERTAINTY
In the application of the Group’s accounting policies, which are described in Note 2, management is required
to make judgement, estimates and assumptions about the carrying amounts of assets and liabilities that are
not readily apparent from other sources. The estimates and associated assumptions are based on historical
experience and other factors that are considered to be relevant. Actual results may differ from these estimates.
The estimates and underlying assumptions are reviewed on an ongoing basis. Revisions to accounting
estimates are recognised in the period in which the estimate is revised if the revision affects only that period, or
in the period of the revision and future periods if the revision affects both current and future periods.
(i) Critical judgement in applying the Group’s accounting policies
The critical judgements, apart from those involving estimations, that management has made in the
process of applying the Group’s accounting policies, and that have the most signifi cant effect on the
amounts recognised in the fi nancial statements are as follows:
(a) Estimation of percentage of completion for construction contracts (Notes 30 and 9)
The Group recognised revenue and costs of construction contracts by reference to the stage of
completion of the contract activity at the end of the reporting period. The stage of completion
is measured by the completion of a physical proportion of the contract work. Management
exercises judgement in determining the percentage of completion assigned to each physical
milestone achieved. The physical milestone is supported by either internally generated engineering
reports or surveys performed by independent surveyors. Management reviews the internally
generated engineer reports and are satisfi ed that the percentage of completion used for revenue
recognition on construction contracts is reasonable.
(b) Classifi cation of charter hire arrangements as fi nance lease
The Group has entered into charter hire agreements for its vessels. At the inception of these
agreements, the management has assessed whether substantially all risks and rewards have been
transferred to the lessees in accordance with FRS 17 (revised) Leases and concluded that certain
of the charter hire arrangements should be accounted for as fi nance leases (Notes 10 and 21)
and the rest as operating leases (Note 38).
(c) Classifi cation of sales and lease back transaction under operating lease
In 2013, the Group has entered into certain sales and lease back transaction for 11 vessels with
sales contract value of US$170,800,000. At the inception of these agreements, management
has assessed and concluded that these sales and lease back transactions are accounted for
as operating leases on the basis that the selling price, daily charter rate and purchase option
prices as stipulated in these agreements approximate to the fair values at the inception of these
agreements. Accordingly, the gain on sales of vessels was credited to profi t or loss.

Ann
ual R
epor
t 201
4
|
O
tto
Mar
ine
Lim
ited
66
Notes toFinancial StatementsFor the Financial year ended 31 December 2014
3 CRITICAL ACCOUNTING JUDGEMENT ANDKEY SOURCES OF ESTIMATION UNCERTAINTY (cont’d)
(i) Critical judgement in applying the Group’s accounting policies (cont’d)
(d) Classifi cation of equity investment in a third party (Note 18)
The Group recorded a 19.9% equity investment in a third party amounting to US$3,376,000
(2013 : US$3,376,000). Determining whether the Group exercise signifi cant infl uence over the
third party is a matter of judgement. Management is of the view that they do not participate in the
fi nancial and operating policy decision of the third party. Accordingly, the Group accounts for the
equity investment as available-for-sale investment (Note 18).
(ii) Key sources of estimation uncertainty
The key assumptions concerning the future and other key sources of estimation uncertainty at the end of
the reporting period, that have a signifi cant risk of causing a material adjustment to the carrying amounts
of assets and liabilities within the next fi nancial year, are discussed below.
(a) Impairment of amount receivable for construction contract and provision for losses on vessels
held for sales or for charter
As at 31 December 2014, the Group’s net amount due from (to) customers for contract work,
inventories, and plant and equipment amounted to US$5,147,000, US$128,888,000, and
US$498,390,000 (31 December 2013 : US$68,620,000, US$115,868,000, and US$466,677,000)
respectively are in respect of vessels under construction and completed vessels.
Determining the recoverable amount or net realisable value of the vessels in construction included
in the above-mentioned amounts is a matter of management’s estimate. In arriving at the
estimates, management has evaluated the customers’ ability to meet their contractual payment
obligations in a timely manner and the possibility of customers amending or cancelling the existing
contracts. In addition, management has also considered the recent valuations performed by the
valuers on certain vessels and value of the chartering contracts secured. Management is of the
view that no provision for losses on vessels with sales contracts and vessels held for sale or
charter is required as at year end.
(b) Impairment of available-for-sale investments (Note 18), loan receivables (Note 12), trade
receivables (Note 8) and net other receivables (Note 11) from third party
As at 31 December 2014, the Group recorded available-for-sale investment and receivables
from third party totalling US$30,615,000 (2013 : US$30,615,000) which comprise the Group’s
available-for-sale investment, loan, trade and other receivables from third party amounting to
US$3,376,000 (2013 : US$3,376,000), US$16,228,000 (2013 : US$16,228,000), US$8,811,000
(2013 : US$8,811,000), US$2,200,000 (2013 : US$2,200,000) respectively. Determining the
impairment loss for investments in and amounts receivables from the third party requires
estimates to be made by management.
Taking into consideration of the deteriorated fi nancial condition of the third party, management
had made a full impairment loss on available-for-sale investments amounting to US$3,376,000
and allowance for loan, trade and net other receivables amounting to US$22,855,000 in 2012.
Management is of the view that allowance made at the end of the reporting period is adequate.
(c) Impairment of investment in associates and joint ventures (Note 17), and trade and other
receivables from associates and joint ventures (Notes 8 and 11)
As at 31 December 2014, the Group’s investment in associates and joint ventures, trade and
other receivables from associates are US$467,000 (2013 : US$3,453,000), US$73,737,000
(2013 : US$140,178,000) and US$38,809,000 (2013 : US$20,501,000) respectively.
Determining the impairment loss for investments in and amounts receivable from the associates
and/or joint venture requires estimates to be made by management.
Ann
ual R
epor
t 201
4
|
O
tto
Mar
ine
Lim
ited
67
Notes toFinancial Statements
For the Financial year ended 31 December 2014
3 CRITICAL ACCOUNTING JUDGEMENT ANDKEY SOURCES OF ESTIMATION UNCERTAINTY (cont’d)
(ii) Key sources of estimation uncertainty (cont’d)
(c) Impairment of investment in associates and joint ventures (Note 17), and trade and other
receivables from associates and joint ventures (Notes 8 and 11) (cont’d)
In estimating the recoverable amount of these associates and joint venture which have been
incorporated to own the vessels constructed by the Group, management has considered the
recent valuation on certain vessels and the value of the chartering contracts secured.
Management is of the view that no impairment in investment, trade and other receivables from the
associates and joint venture is required as at year end.
(d) Impairment of goodwill
The Group tests goodwill annually for impairment or more frequently if there are indications that
the goodwill might be impaired. The goodwill relates primarily to three cash generating units
(“CGU”) (Note 15).
Determining whether goodwill is impaired requires an estimation of the fair values less costs to
sell or the value in use of the cash generating units to which goodwill has been allocated. The
fair values less costs to sell require the Group to estimate based on the best information available
the amount that an entity could obtain, at the reporting date, from the disposal of the asset in
an arm’s length transaction between knowledgeable, willing parties, after deducting the costs
of disposal. Where there are no active markets, management has to exercise judgement in
estimating the fair values of these assets.
Management uses the fair value less cost to sell of the two CGUs and the future performance of
another one CGU to assess the impairment of goodwill with carrying amount of US$32,871,000
(2013 : US$32,871,000) and US$5,443,000 (2013 : US$5,443,000) respectively. Having
considered the above, management is of view that there is no impairment of goodwill is required
during the current year.
(e) Allowance for doubtful trade receivables (Note 8)
The Group makes allowances for doubtful debts based on an assessment of the recoverability of
trade receivables where events or changes in circumstances indicate that the balances may not
be collectible. The identifi cation of doubtful debts requires the use of judgement and estimates.
Where the expectation is different from the original estimate, such differences will impact the
carrying value of trade receivables and doubtful debts expenses in the period in which such
estimate has been changed. Including the allowance made in respect of a third party (Note b
above), management has assessed the allowance for doubtful receivables in respect of third
parties as at 31 December 2014 to be US$7,580,000 (2013 : US$6,819,000). The carrying
amount of trade receivables is disclosed in Note 8 to the fi nancial statements.
(f) Useful lives and residual values of property, plant and equipment
The management exercises their judgement in estimating the useful lives and residual values of
the depreciable assets. The estimated useful lives refl ects management’s estimate of the period
that the Group intends to derive future economic benefi ts from the use of the depreciable asset.
Depreciation is provided to write off the cost of property, plant and equipment,
adjusted for residual value, over their estimated useful lives, using the straight-line
method. The carrying amounts of property, plant and equipment are US$547,703,000
(2013 : US$521,425,000) as disclosed in Note 14 to the fi nancial statements.

Ann
ual R
epor
t 201
4
|
O
tto
Mar
ine
Lim
ited
68
Notes toFinancial StatementsFor the Financial year ended 31 December 2014
4 FINANCIAL INSTRUMENTS, FINANCIAL RISKS AND CAPITAL RISKS MANAGEMENT
(a) Categories of fi nancial instruments
The following table sets out the fi nancial instruments as at the end of the reporting period:
Group Company
2014 2013 2014 2013
US$’000 US$’000 US$’000 US$’000
Financial assets
Loans and receivables (including cash
and cash equivalents) 456,279 481,800 927,024 655,261
Available-for-sale fi nancial assets 7 144 - -
Financial liabilities
Derivative fi nancial instruments 4,153 5,097 - 5,097
Amortised costs 922,243 919,788 869,341 572,326
(b) Financial risk management policies and objectives
The Group operates internationally and is exposed to a variety of fi nancial risks, comprising market risk
(including foreign currency risk and interest rate risk), credit risk and liquidity risk.
There has been no change to the Group’s exposure to these fi nancial risks or the manner in which it
manages and measures the risk. Market risk exposures are measured using sensitivity analysis indicated
below.
i) Foreign currency risk
The Group’s foreign currency exposures arise primarily from the exchange rate movement of
foreign currencies, namely United States dollars, Singapore dollars, Australian dollars, Indonesian
rupiah and other currencies, vis-a-vis the Singapore dollars, United States dollars, Australian
dollars and Indonesian rupiah, which are the functional currencies of respective entities within the
Group.
The Group assesses and monitors its current and projected foreign currency cash fl ows and
insofar as possible, reduces the exposure of the net position in each currency by borrowing in
those foreign currencies and utilises foreign currency forward contracts and a cross currency
swap contract to manage the volatility of future cash fl ows caused by fl uctuation in foreign
currency exchange rates. The Group does not hold or issue derivative fi nancial instruments for
speculative purpose.
The Company has a number of investments in subsidiaries whose functional currencies are
different from the presentation currency of the Group. The net assets of these subsidiaries are
exposed to currency translation risk. The Group does not currently designate its foreign currency
denominated debt as a hedging instrument for the purpose of hedging the translation of its foreign
operations.
Further details of the foreign currency forward contracts and the cross currency swap contract are
found in Note 27 to the fi nancial statements.

Ann
ual R
epor
t 201
4
|
O
tto
Mar
ine
Lim
ited
69
Notes toFinancial Statements
For the Financial year ended 31 December 2014
4 FINANCIAL INSTRUMENTS, FINANCIAL RISKS AND CAPITAL RISKS MANAGEMENT (cont’d)
(b) Financial risk management policies and objectives (cont’d)
i) Foreign currency risk (cont’d)
At the reporting date, the carrying amounts of monetary assets (including intercompany
receivables) and monetary liabilities (including intercompany payables) denominated in currencies
other than the respective entities’ functional currencies, excluding loan payables (Note 25) which
are hedged with cross currency swap contract (Note 27) are as follows:
2014 2013 US$-equivalent of amounts denominated in the following foreign currencies
$’000 $’000 $’000 $’000 $’000 $’000 $’000 $’000 $’000 $’000US$ S$ AU$ IDR Others US$ S$ AU$ IDR Others
Group
Total assets 93,297 31,508 6,788 2,321 5,806 73,641 24,875 5,261 806 27,673
Total liabilities 137,927 114,540 4,424 3,770 21,930 72,013 107,729 3,115 3,449 24,734
2014 2013 US$-equivalent of amounts denominated
in the following foreign currencies$’000 $’000 $’000 $’000 $’000 $’000US$ S$ Others US$ S$ Others
Company
Total assets 102 2,261 414 56 9,099 22,508
Total liabilities – 69,773 11,404 573 61,712 19,443
Sensitivity analysis for currency risk
If the relevant foreign currency rates vis-a-vis the functional currencies of the respective entities
within the Group fl uctuate by 5% with all other variables held constant, the effects will be as
follows:
(1) Group
If foreign currency of the United States dollars are to strengthen/weaken by 5% against
the functional currency of Singapore dollars, loss before income tax will increase/decrease
by approximately US$363,000 (2013 : profi t before income tax will decrease/increase by
approximately US$298,000).
If foreign currency of the Singapore dollars are to strengthen/weaken by 5% against the
functional currency of United States dollars, loss before income tax will increase/decrease
by approximately US$4,304,000 (2013 : profi t before income tax will decrease/increase by
approximately US$4,184,000).
Considering the net effect, the loss before income tax of the Group will decrease/
increase by approximately US$3,941,000 (2013 : profi t before income tax of the Group
will increase/decrease by approximately US$3,886,000) if the United States dollars are to
strengthen/weaken by 5% against the Singapore dollars.
If foreign currency of the United States dollars are to strengthen/weaken by 5% against
the functional currency of Australian dollars, loss before income tax will increase/decrease
by approximately US$1,951,000 (2013 : profi t before income tax will increase/decrease by
approximately US$381,000).
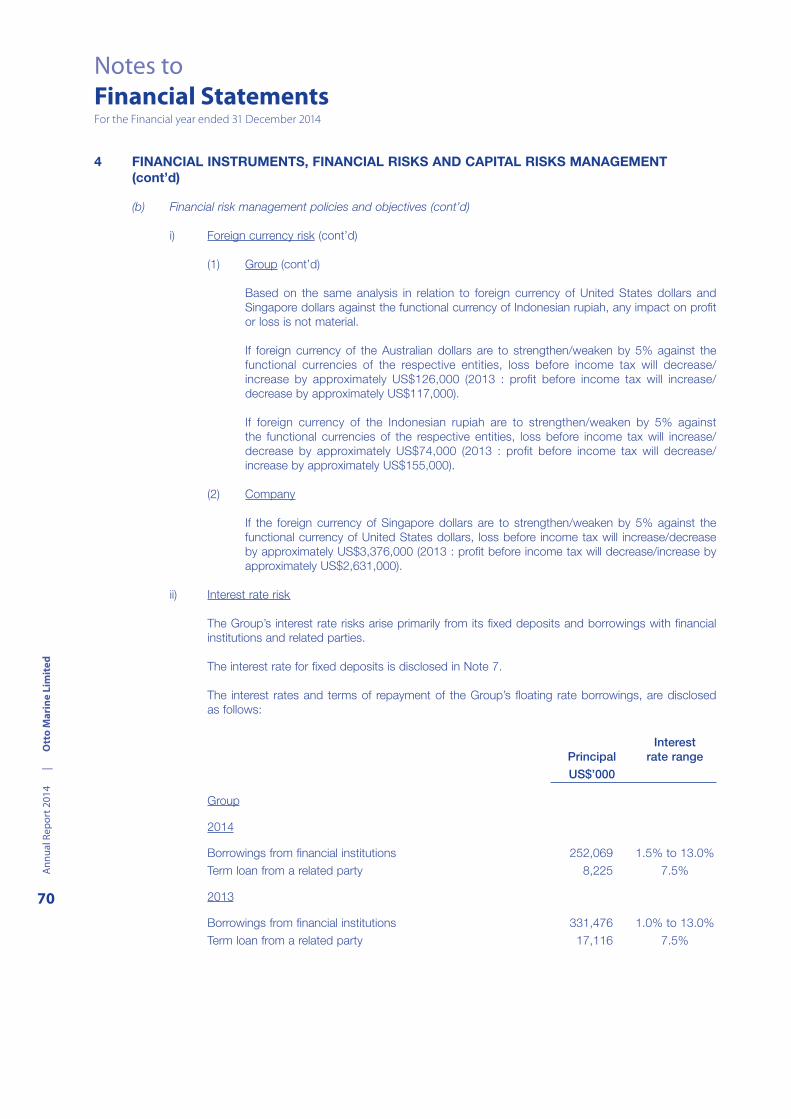
Ann
ual R
epor
t 201
4
|
O
tto
Mar
ine
Lim
ited
70
Notes toFinancial StatementsFor the Financial year ended 31 December 2014
4 FINANCIAL INSTRUMENTS, FINANCIAL RISKS AND CAPITAL RISKS MANAGEMENT (cont’d)
(b) Financial risk management policies and objectives (cont’d)
i) Foreign currency risk (cont’d)
(1) Group (cont’d)
Based on the same analysis in relation to foreign currency of United States dollars and
Singapore dollars against the functional currency of Indonesian rupiah, any impact on profi t
or loss is not material.
If foreign currency of the Australian dollars are to strengthen/weaken by 5% against the
functional currencies of the respective entities, loss before income tax will decrease/
increase by approximately US$126,000 (2013 : profi t before income tax will increase/
decrease by approximately US$117,000).
If foreign currency of the Indonesian rupiah are to strengthen/weaken by 5% against
the functional currencies of the respective entities, loss before income tax will increase/
decrease by approximately US$74,000 (2013 : profi t before income tax will decrease/
increase by approximately US$155,000).
(2) Company
If the foreign currency of Singapore dollars are to strengthen/weaken by 5% against the
functional currency of United States dollars, loss before income tax will increase/decrease
by approximately US$3,376,000 (2013 : profi t before income tax will decrease/increase by
approximately US$2,631,000).
ii) Interest rate risk
The Group’s interest rate risks arise primarily from its fi xed deposits and borrowings with fi nancial
institutions and related parties.
The interest rate for fi xed deposits is disclosed in Note 7.
The interest rates and terms of repayment of the Group’s fl oating rate borrowings, are disclosed
as follows:
PrincipalInterest
rate range
US$’000
Group
2014
Borrowings from fi nancial institutions 252,069 1.5% to 13.0%
Term loan from a related party 8,225 7.5%
2013
Borrowings from fi nancial institutions 331,476 1.0% to 13.0%
Term loan from a related party 17,116 7.5%
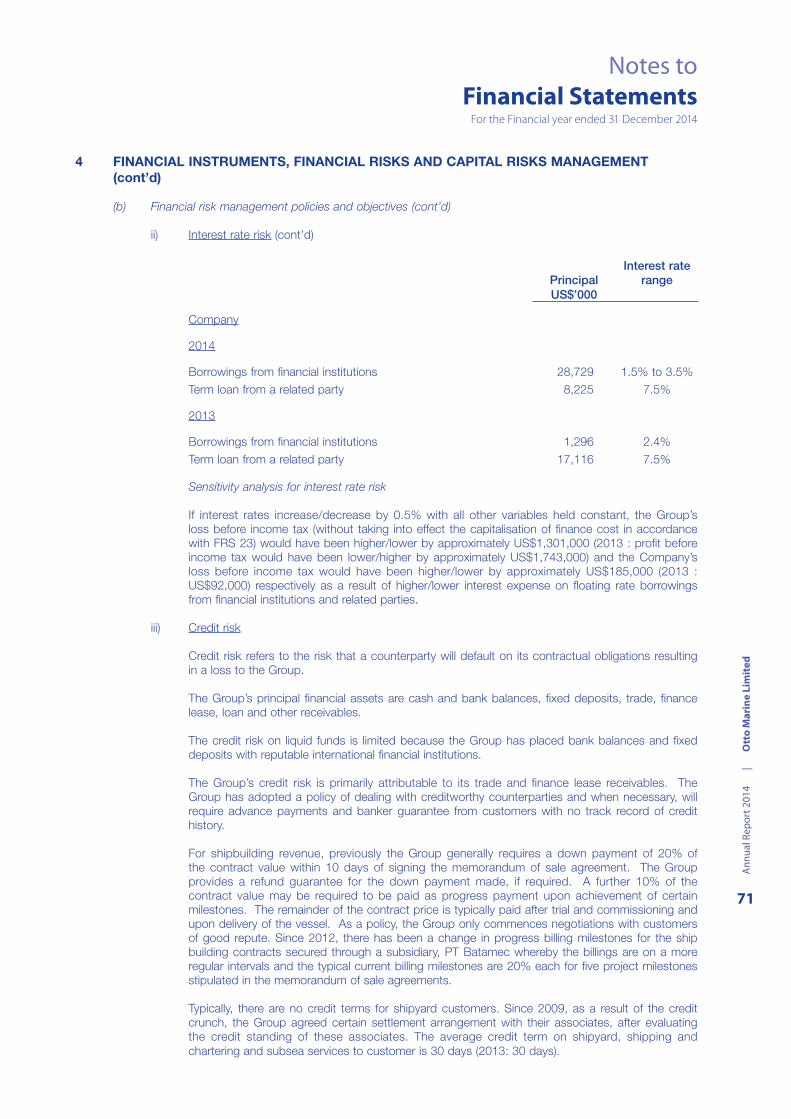
Ann
ual R
epor
t 201
4
|
O
tto
Mar
ine
Lim
ited
71
Notes toFinancial Statements
For the Financial year ended 31 December 2014
4 FINANCIAL INSTRUMENTS, FINANCIAL RISKS AND CAPITAL RISKS MANAGEMENT (cont’d)
(b) Financial risk management policies and objectives (cont’d)
ii) Interest rate risk (cont’d)
PrincipalInterest rate
rangeUS$’000
Company
2014
Borrowings from fi nancial institutions 28,729 1.5% to 3.5%
Term loan from a related party 8,225 7.5%
2013
Borrowings from fi nancial institutions 1,296 2.4%
Term loan from a related party 17,116 7.5%
Sensitivity analysis for interest rate risk
If interest rates increase/decrease by 0.5% with all other variables held constant, the Group’s
loss before income tax (without taking into effect the capitalisation of fi nance cost in accordance
with FRS 23) would have been higher/lower by approximately US$1,301,000 (2013 : profi t before
income tax would have been lower/higher by approximately US$1,743,000) and the Company’s
loss before income tax would have been higher/lower by approximately US$185,000 (2013 :
US$92,000) respectively as a result of higher/lower interest expense on fl oating rate borrowings
from fi nancial institutions and related parties.
iii) Credit risk
Credit risk refers to the risk that a counterparty will default on its contractual obligations resulting
in a loss to the Group.
The Group’s principal fi nancial assets are cash and bank balances, fi xed deposits, trade, fi nance
lease, loan and other receivables.
The credit risk on liquid funds is limited because the Group has placed bank balances and fi xed
deposits with reputable international fi nancial institutions.
The Group’s credit risk is primarily attributable to its trade and fi nance lease receivables. The
Group has adopted a policy of dealing with creditworthy counterparties and when necessary, will
require advance payments and banker guarantee from customers with no track record of credit
history.
For shipbuilding revenue, previously the Group generally requires a down payment of 20% of
the contract value within 10 days of signing the memorandum of sale agreement. The Group
provides a refund guarantee for the down payment made, if required. A further 10% of the
contract value may be required to be paid as progress payment upon achievement of certain
milestones. The remainder of the contract price is typically paid after trial and commissioning and
upon delivery of the vessel. As a policy, the Group only commences negotiations with customers
of good repute. Since 2012, there has been a change in progress billing milestones for the ship
building contracts secured through a subsidiary, PT Batamec whereby the billings are on a more
regular intervals and the typical current billing milestones are 20% each for fi ve project milestones
stipulated in the memorandum of sale agreements.
Typically, there are no credit terms for shipyard customers. Since 2009, as a result of the credit
crunch, the Group agreed certain settlement arrangement with their associates, after evaluating
the credit standing of these associates. The average credit term on shipyard, shipping and
chartering and subsea services to customer is 30 days (2013: 30 days).

Ann
ual R
epor
t 201
4
|
O
tto
Mar
ine
Lim
ited
72
Notes toFinancial StatementsFor the Financial year ended 31 December 2014
4 FINANCIAL INSTRUMENTS, FINANCIAL RISKS AND CAPITAL RISKS MANAGEMENT (cont’d)
(b) Financial risk management policies and objectives (cont’d)
iii) Credit risk (cont’d)
Concentrations of credit risk exist when changes in economic, industry or geographic factors
similarly affect groups of counterparties where aggregate credit exposure is signifi cant in relation
to the Group’s total credit exposure.
At the end of the reporting period, the Group’s top 3 customers for which invoices have been
raised account for 36.3% (2013 : 17.6%) of the Group’s outstanding trade receivables. In addition,
100% (2013 : 100%) of the Group’s future revenue for which sales contracts for shipyard have
been entered will be contributed by 1 (2013 : 3) of its customers and their affi liates.
At the end of the reporting period, the Group’s loan receivables are contributed by two third
parties and a related party (2013 : a third party and a related party).
The Company’s trade, other and loan receivables are mainly due from subsidiaries. Management
has assessed the recoverability of these receivables and is of the view that there is no allowance
for doubtful debts due from subsidiaries required as at year end.
The Group’s maximum exposure to credit risk comprise (i) the sum of the carrying amounts of
fi nancial assets recorded in the fi nancial statements, grossed up of any allowance for losses; (ii)
credit risk relating to fi nancial guarantee contracts as disclosed in Note 39. The credit risk profi le
of the Group’s trade receivables at the end of the reporting period as follows:
Group
2014 2013
US$’000 US$’000
Past due but not impaired:
Less than 3 months overdue 36,608 31,200
3 to 6 months overdue 13,563 20,217
6 to 12 months overdue 58,736 17,955
More than 12 months overdue 66,843 20,048
175,750 89,420
The above amount has not been impaired as management believes there has not been a
signifi cant change in credit quality and the amounts are still considered recoverable.
iv) Liquidity risk
Liquidity risk refl ects the risk that the Group will have insuffi cient resources to meet its fi nancial
liabilities as they fall due. The Group’s strategy to managing liquidity risk is to ensure that the
Group has suffi cient funds to meet all its potential liabilities as they fall due, including shareholder
distributions. This strategy has not changed from prior periods and the Group’s liquidity risk
management approach is outlined below:
Cash fl ow forecasts are prepared and monitored on a weekly basis, to ensure the
utilisation of current facilities is optimised and on a monthly basis to ensure that medium-
term liquidity is maintained. Cash fl ow forecasts on an annual projection basis are also
prepared quarterly, for the purpose of identifying strategic funding requirements.

Ann
ual R
epor
t 201
4
|
O
tto
Mar
ine
Lim
ited
73
Notes toFinancial Statements
For the Financial year ended 31 December 2014
4 FINANCIAL INSTRUMENTS, FINANCIAL RISKS AND CAPITAL RISKS MANAGEMENT (cont’d)
(b) Financial risk management policies and objectives (cont’d)
iv) Liquidity risk (cont’d)
Management has prepared the one-year business plans and cash fl ow forecasts of the
Group for the year ending 31 December 2015 based on (i) the latest available fi nancial
statements of the Group and (ii) the on-going meetings and discussions between
management and major customers on their expected orders to the Group in 2015. Such
indication by major customers of any expected orders do not represent fi rm or committed
orders. After reviewing the business plans and cash fl ow forecasts of the Group for the
fi nancial year ending 31 December 2015 prepared on the above basis, and taking account
of reasonably possible changes in business performance, management is of the view that
the Group should be able to operate within the level of its currently available bank facilities,
on the assumption that the banks will (i) not demand the immediate repayment of the
entire long-term bank loans, (ii) approve the waiver of the fi nancial covenants for the long-
term bank loans (where relevant), and (iii) renew the facility for the short-term bank loans
upon expiry.
Management also continually assesses the proportion of capital and debt funding of the
Group.
The following tables detail the remaining contractual maturity for non-derivative fi nancial liabilities.
The tables have been drawn up based on the undiscounted cash fl ows of fi nancial liabilities based
on the earliest date on which the Group and Company can be required to pay. The table includes
both interest and principal cash fl ows. The adjustment column represents the possible future cash
fl ows attributable to the instrument included in the maturity analysis which is not included in the
carrying amount of the fi nancial liability on the statement of fi nancial position.
Non-derivative fi nancial liabilities
On demandor within
1 year
Within2 to
5 yearsAfter
5 years Adjustments Total
US$’000 US$’000 US$’000 US$’000 US$’000
Group
As at 31 December 2014
Floating rate - borrowings from
fi nancial institutions 148,438 121,786 – (19,210) 251,014
Floating rate - loan from a
related party 8,541 301 – (617) 8,225
Fixed rate - loan from a
related party 2,100 30,525 – (2,625) 30,000
Fixed rate - fi nance lease
payables 24,001 62,666 140,965 (60,453) 167,179
Fixed rate - loan payables 11,561 89,649 – (19,029) 82,181
Trade payables 307,420 – – – 307,420
Accruals, other payables and
other current liabilities 76,224 – – – 76,224
Financial guarantee contracts
(Note 39) 15,650 64,602 28,200 (108,452) –
Total 593,935 369,529 169,165 (210,386) 922,243

Ann
ual R
epor
t 201
4
|
O
tto
Mar
ine
Lim
ited
74
Notes toFinancial StatementsFor the Financial year ended 31 December 2014
4 FINANCIAL INSTRUMENTS, FINANCIAL RISKS AND CAPITAL RISKS MANAGEMENT (cont’d)
(b) Financial risk management policies and objectives (cont’d)
iv) Liquidity risk (cont’d)
Non-derivative fi nancial liabilities (cont’d)
On demandor within
1 year
Within2 to
5 yearsAfter
5 years Adjustments Total
US$’000 US$’000 US$’000 US$’000 US$’000
Group
As at 31 December 2013
Floating rate - borrowings from
fi nancial institutions 240,682 105,236 – (15,507) 330,411
Floating rate - loan from a
related party 10,625 9,323 – (2,832) 17,116
Fixed rate - fi nance lease
payables 16,726 64,854 155,751 (71,273) 166,058
Fixed rate - loan payables – 38,675 – (9,083) 29,592
Trade payables 320,773 – – – 320,773
Accruals, other payables and
other current liabilities 55,838 – – – 55,838
Financial guarantee
contracts (Note 39) 11,420 – – (11,420) –
Total 656,064 218,088 155,751 (110,115) 919,788
Company
As at 31 December 2014
Floating rate - borrowings from
fi nancial institutions 1,159 28,517 – (990) 28,686
Floating rate - loan from a
related party 8,541 301 – (617) 8,225
Fixed rate - loan from a
related party 2,100 30,525 – (2,625) 30,000
Fixed rate - fi nance lease payable 449 387 – (63) 773
Trade payables 241,921 – – – 241,921
Accruals, other payables and
other current liabilities 559,736 – – – 559,736
Financial guarantee
contracts (Note 39) 150,470 153,122 28,200 (331,792) –
Total 964,376 212,852 28,200 (336,087) 869,341

Ann
ual R
epor
t 201
4
|
O
tto
Mar
ine
Lim
ited
75
Notes toFinancial Statements
For the Financial year ended 31 December 2014
4 FINANCIAL INSTRUMENTS, FINANCIAL RISKS AND CAPITAL RISKS MANAGEMENT (cont’d)
(b) Financial risk management policies and objectives (cont’d)
iv) Liquidity risk (cont’d)
Non-derivative fi nancial liabilities (cont’d)
On demandor within
1 year
Within2 to
5 yearsAfter
5 years Adjustments Total
US$’000 US$’000 US$’000 US$’000 US$’000
Company
As at 31 December 2013
Floating rate - borrowings from
fi nancial institutions 1,288 20 – (12) 1,296
Floating rate - loan from a
related party 10,625 9,323 – (2,832) 17,116
Fixed rate - fi nance lease payable 569 516 – (91) 994
Trade payables 178,596 – – – 178,596
Accruals, other payables and
other current liabilities 374,324 – – – 374,324
Financial guarantee
contracts (Note 39) 341,600 – – (341,600) –
Total 907,002 9,859 – (344,535) 572,326
Non-derivative fi nancial assets
Except for trade receivables and fi nance lease receivables as disclosed in Notes 8 and 10
respectively and the loan receivables as disclosed below, substantially all fi nancial assets of the
Group and the Company are on demand or due within one year.
Group Company
2014 2013 2014 2013
US$’000 US$’000 US$’000 US$’000
On demand or within 1 year 1,550 200 78,840 77,440
Within 2 to 5 years 8,000 8,800 – –
Total 9,550 9,000 78,840 77,440
Management is of the view that the actual realisation of gross amount due from customers for
contract work within 1 year is largely dependent on the actual completion of the construction of
vessels.

Ann
ual R
epor
t 201
4
|
O
tto
Mar
ine
Lim
ited
76
Notes toFinancial StatementsFor the Financial year ended 31 December 2014
4 FINANCIAL INSTRUMENTS, FINANCIAL RISKS AND CAPITAL RISKS MANAGEMENT (cont’d)
(b) Financial risk management policies and objectives (cont’d)
iv) Liquidity risk (cont’d)
Derivative fi nancial instruments
On demandor within
1 year Within 2
to 5 years Total
US$’000 US$’000 US$’000
Group
As at 31 December 2014
Gross settled:
Cross currency swap contract
Gross infl ow – 51,975 51,975
Gross outfl ow (Note 27) – (56,128) (56,128)
– (4,153) (4,153)
As at 31 December 2013
Gross settled:
Foreign exchange forward contracts
Gross infl ow (Note 27) 99,596 – 99,596
Gross outfl ow (104,693) – (104,693)
Foreign exchange forward contracts (5,097) – (5,097)
Company
As at 31 December 2014
Cross currency swap contract
Gross infl ow – – –
Gross outfl ow – – –
– – –
As at 31 December 2013
Foreign exchange forward contracts
Gross infl ow (Note 27) 99,596 – 99,596
Gross outfl ow (104,693) – (104,693)
Foreign exchange forward contracts (5,097) – (5,097)
v) Fair value of fi nancial assets and fi nancial liabilities
The Group determines fair values of various fi nancial assets and fi nancial liabilities in the following
manner:
Fair value of the Group’s fi nancial assets and fi nancial liabilities that are measured at fair value on a recurring basis.
Some of the Group’s fi nancial assets and fi nancial liabilities are measured at fair value at the end
of each reporting period. The following table gives information about how the fair values of these
fi nancial assets and fi nancial liabilities are determined.

Ann
ual R
epor
t 201
4
|
O
tto
Mar
ine
Lim
ited
77
Notes toFinancial Statements
For the Financial year ended 31 December 2014
4 FI
NA
NC
IAL
INS
TR
UM
EN
TS
, FIN
AN
CIA
L R
ISK
S A
ND
CA
PIT
AL
RIS
KS
MA
NA
GE
ME
NT
(c
ont
’d)
(b
) Fi
nanc
ial r
isk
man
agem
ent
polic
ies
and
obje
ctiv
es (c
ont’d
)
v)
Fair v
alu
e o
f fi n
ancia
l assets
and
fi n
ancia
l lia
bilities (cont’
d)
Gro
up
Fin
anci
al a
sset
s/
fi nan
cial
liab
ilitie
s
Fai
r va
lue
as a
t (U
S$’
000)
Fai
r va
lue
hier
arch
yVa
luat
ion
tech
niq
ue(s
)an
d k
ey in
put
(s)
Sig
nifi c
ant
uno
bse
rvab
lein
put
(s)
Rel
atio
nshi
p o
fun
ob
serv
able
inp
uts
to f
air
valu
e
2014
2013
Ass
ets
Liab
ilitie
sA
sset
sLi
abili
ties
Der
ivat
ive
fi nan
cial
inst
rum
ents
(see
No
te 2
7)
1)
Fore
ign c
urr
ency
fo
rward
contr
acts
––
–5,0
97
Leve
l 2
Dis
co
un
ted
c
ash
fl
ow
. F
utu
re
cash
flo
ws
are
estim
ate
d
based
on
fo
rward
exch
an
ge
rate
s
(fro
m
ob
se
rva
ble
fo
rwa
rd
exc
ha
ng
e
rate
s
at
the
en
d
of
the
rep
ort
ing
perio
d)
and
co
ntr
act
forw
ard
rate
s,
dis
counte
d a
t a r
ate
that
refl e
cts
the
cre
dit r
isk o
f va
rio
us c
ounte
rpart
ies.
NA
NA
2) C
ross c
urr
ency
sw
ap
–4,1
53
––
Leve
l 2
Dis
co
un
ted
c
ash
fl
ow
. F
utu
re
cash
flo
ws
are
estim
ate
d
based
on
fo
rward
exch
an
ge
rate
s
(fro
m
ob
se
rva
ble
fo
rwa
rd
exc
ha
ng
e
rate
s
at
the
en
d
of
the
rep
ort
ing
perio
d)
and
co
ntr
act
forw
ard
rate
s,
dis
counte
d a
t a r
ate
that
refl e
cts
the
cre
dit r
isk o
f va
rio
us c
ounte
rpart
ies.
NA
NA
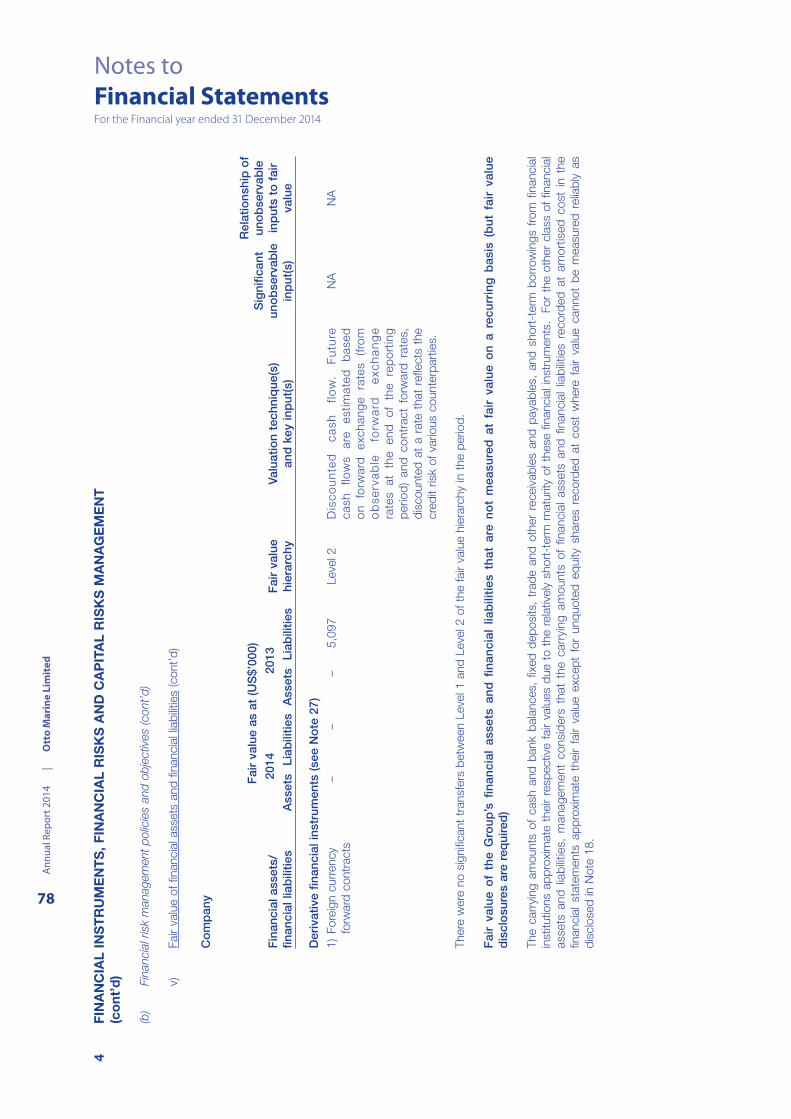
Ann
ual R
epor
t 201
4
|
O
tto
Mar
ine
Lim
ited
78
Notes toFinancial StatementsFor the Financial year ended 31 December 2014
4 FI
NA
NC
IAL
INS
TR
UM
EN
TS
, FIN
AN
CIA
L R
ISK
S A
ND
CA
PIT
AL
RIS
KS
MA
NA
GE
ME
NT
(c
ont
’d)
(b
) Fi
nanc
ial r
isk
man
agem
ent
polic
ies
and
obje
ctiv
es (c
ont’d
)
v)
Fair v
alu
e o
f fi n
ancia
l assets
and
fi n
ancia
l lia
bilities (cont’
d)
Co
mp
any
Fin
anci
al a
sset
s/
fi nan
cial
liab
ilitie
s
Fai
r va
lue
as a
t (U
S$’
000)
Fai
r va
lue
hier
arch
yVa
luat
ion
tech
niq
ue(s
)an
d k
ey in
put
(s)
Sig
nifi c
ant
uno
bse
rvab
lein
put
(s)
Rel
atio
nshi
p o
fun
ob
serv
able
inp
uts
to f
air
valu
e
2014
2013
Ass
ets
Liab
ilitie
sA
sset
sLi
abili
ties
Der
ivat
ive
fi nan
cial
inst
rum
ents
(see
No
te 2
7)
1)
Fore
ign c
urr
ency
fo
rward
contr
acts
––
–5,0
97
Leve
l 2
Dis
co
un
ted
c
ash
fl
ow
. F
utu
re
cash
flo
ws
are
estim
ate
d
based
on
fo
rward
exch
an
ge
rate
s
(fro
m
ob
se
rva
ble
fo
rwa
rd
exc
ha
ng
e
rate
s
at
the
en
d
of
the
rep
ort
ing
perio
d)
and
co
ntr
act
forw
ard
rate
s,
dis
counte
d a
t a r
ate
that
refl e
cts
the
cre
dit r
isk o
f va
rio
us c
ounte
rpart
ies.
NA
NA
There
were
no s
ignifi
cant
transfe
rs b
etw
een L
eve
l 1 a
nd
Leve
l 2 o
f th
e f
air v
alu
e h
iera
rchy
in t
he p
erio
d.
F
air
valu
e o
f th
e G
roup
’s fi
nan
cial
ass
ets
and
fi n
anci
al l
iab
iliti
es t
hat
are
not
mea
sure
d a
t fa
ir v
alue
on
a re
curr
ing
bas
is (
but
fai
r va
lue
dis
clo
sure
s ar
e re
qui
red
)
The c
arr
ying a
mounts
of
cash a
nd
bank b
ala
nces,
fi xed
dep
osits,
trad
e a
nd
oth
er
receiv
ab
les a
nd
paya
ble
s,
and
sho
rt-t
erm
bo
rro
win
gs f
rom
fi n
ancia
l
institu
tions a
pp
roxim
ate
their r
esp
ective
fair v
alu
es d
ue t
o t
he r
ela
tive
ly s
hort
-term
matu
rity
of
these fi n
ancia
l in
str
um
ents
. F
or
the o
ther
cla
ss o
f fi n
ancia
l
assets
and
lia
bili
ties,
manag
em
ent
co
nsid
ers
that
the c
arr
yin
g a
mo
unts
of
fi nancia
l assets
and
fi n
ancia
l lia
bili
ties r
eco
rded
at
am
ort
ised
co
st
in t
he
fi nancia
l sta
tem
ents
ap
pro
xim
ate
their f
air v
alu
e e
xcep
t fo
r unq
uote
d e
quity
share
s r
ecord
ed
at
co
st
where
fair v
alu
e c
anno
t b
e m
easure
d r
elia
bly
as
dis
clo
sed
in N
ote
18.

Ann
ual R
epor
t 201
4
|
O
tto
Mar
ine
Lim
ited
79
Notes toFinancial Statements
For the Financial year ended 31 December 2014
4 FINANCIAL INSTRUMENTS, FINANCIAL RISKS AND CAPITAL RISKS MANAGEMENT (cont’d)
(c) Capital risk management policies and objectives
The Group’s capital risk management objectives are to safeguard the Group’s ability to continue as a
going concern and to maintain an optimal capital structure so as to maximise shareholder value. To
achieve its capital risk management’s objectives, the Group may adjust the amount of dividend payment,
return capital to shareholders, issue new shares, obtain new borrowings or sell assets to reduce
borrowings. The Group’s overall strategy remains unchanged from 2013.
The Group monitors capital via the debt–to-equity ratio and the net debt-to-equity ratio which are
calculated as total debt divided by equity and total debt net of cash and bank balances and fi xed
deposits (“Net debt”) divided by equity. Total debt comprises “Borrowings from fi nancial institutions”,
“Finance leases payables”, “Loan from related parties” and “Loan payable” as shown in the consolidated
balance sheet. Equity is the total equity as shown in the consolidated balance sheet.
In addition, the Group also specifi cally monitors the fi nancial ratios of its debt covenants stated in the
agreement with the fi nancial institutions providing the facilities to the Group. For the fi nancial year ended
31 December 2014, the Group had obtained waiver from a lender of long-term bank loans amounting to
US$25,690,000 in respect of certain fi nancial covenants which are not met.
For the fi nancial year ended 31 December 2013, the Group was in compliance with externally imposed
capital requirements.
The debt-equity ratio as at 31 December 2014 and 2013 is as follows:
Group
2014 2013
US$’000 US$’000
Total debt 538,599 543,177
Cash and bank balances and fi xed deposits (29,617) (96,195)
Net debt 508,982 446,982
Total Equity 260,646 303,970
Debt-to-equity ratio 2.07 1.79
Net debt-to-equity ratio 1.95 1.47
5 HOLDING COMPANY AND RELATED COMPANY TRANSACTIONS
The Company is a subsidiary of Business Companion Investments Limited, incorporated in British Virgin Island,
which is also the Company’s ultimate holding company. Related companies in these fi nancial statements refer to
members of the holding company’s group of companies.
Some of the Company’s transactions and arrangements are between members of the Group and the effect of
these on the basis determined between the parties is refl ected in these fi nancial statements. The inter-company
balances are unsecured, interest-free and repayable on demand unless otherwise stated.
Transactions between the Company and its subsidiaries, which are related companies of the Company, have
been eliminated on consolidation and are not disclosed in this note.
6 OTHER RELATED PARTY TRANSACTIONS
Some of the transactions and arrangement of the Group are with related parties and the effects of these
transactions on the basis determined between the parties are refl ected in these fi nancial statements. The
balances are unsecured, interest-free and repayable on demand unless otherwise stated.

Ann
ual R
epor
t 201
4
|
O
tto
Mar
ine
Lim
ited
80
Notes toFinancial StatementsFor the Financial year ended 31 December 2014
6 OTHER RELATED PARTY TRANSACTIONS (cont’d)
(a) Related party transactions
Group
2014 2013
US$’000 US$’000
Associates and joint ventures
Interest expense paid and payable – an associate (Note 32) (28) (41)
Sale of vessels – associates 37,500 152,000
Charter income – associates – 2,783
Charter expense – associates (16,448) (13,513)
Management fee income – associates 350 565
Sales of material and equipment – associates 26,672 24
Other related parties - common shareholders/directors
Advance from a controlling shareholder to a subsidiary – 4,800
Advance from a related party 1,875 –
Loan payables to a director 30,000 –
Charter expense (20,450) (7,620)
Sale of vessel – 170,800
Interest expense paid and payable (Note 32) (2,695) (1,340)
Interest income 111 –
Rental expense (657) (617)
Certain bank loans are secured by personal guarantee granted from a director as disclosed in
Note 20 to the fi nancial statements.
(b) Compensation of directors and key management personnel
The remuneration of directors and other members of key management during the fi nancial year was as
follows:
Group
2014 2013
US$’000 US$’000
Directors’ fee 210 275
Short-term benefi ts 2,904 2,922
Post-employment benefi ts 45 82
Share-based payment 1,611 199
Total 4,770 3,478
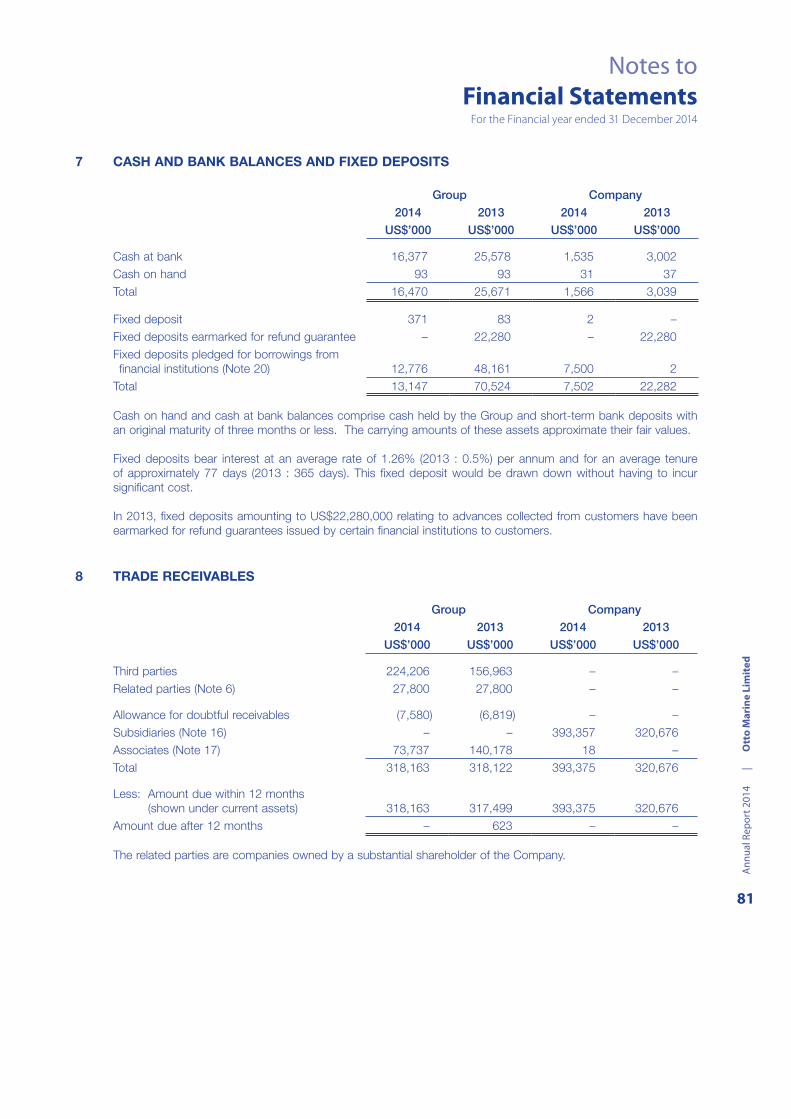
Ann
ual R
epor
t 201
4
|
O
tto
Mar
ine
Lim
ited
81
Notes toFinancial Statements
For the Financial year ended 31 December 2014
7 CASH AND BANK BALANCES AND FIXED DEPOSITS
Group Company
2014 2013 2014 2013
US$’000 US$’000 US$’000 US$’000
Cash at bank 16,377 25,578 1,535 3,002
Cash on hand 93 93 31 37
Total 16,470 25,671 1,566 3,039
Fixed deposit 371 83 2 –
Fixed deposits earmarked for refund guarantee – 22,280 – 22,280
Fixed deposits pledged for borrowings from
fi nancial institutions (Note 20) 12,776 48,161 7,500 2
Total 13,147 70,524 7,502 22,282
Cash on hand and cash at bank balances comprise cash held by the Group and short-term bank deposits with
an original maturity of three months or less. The carrying amounts of these assets approximate their fair values.
Fixed deposits bear interest at an average rate of 1.26% (2013 : 0.5%) per annum and for an average tenure
of approximately 77 days (2013 : 365 days). This fi xed deposit would be drawn down without having to incur
signifi cant cost.
In 2013, fi xed deposits amounting to US$22,280,000 relating to advances collected from customers have been
earmarked for refund guarantees issued by certain fi nancial institutions to customers.
8 TRADE RECEIVABLES
Group Company
2014 2013 2014 2013
US$’000 US$’000 US$’000 US$’000
Third parties 224,206 156,963 – –
Related parties (Note 6) 27,800 27,800 – –
Allowance for doubtful receivables (7,580) (6,819) – –
Subsidiaries (Note 16) – – 393,357 320,676
Associates (Note 17) 73,737 140,178 18 –
Total 318,163 318,122 393,375 320,676
Less: Amount due within 12 months
(shown under current assets) 318,163 317,499 393,375 320,676
Amount due after 12 months – 623 – –
The related parties are companies owned by a substantial shareholder of the Company.
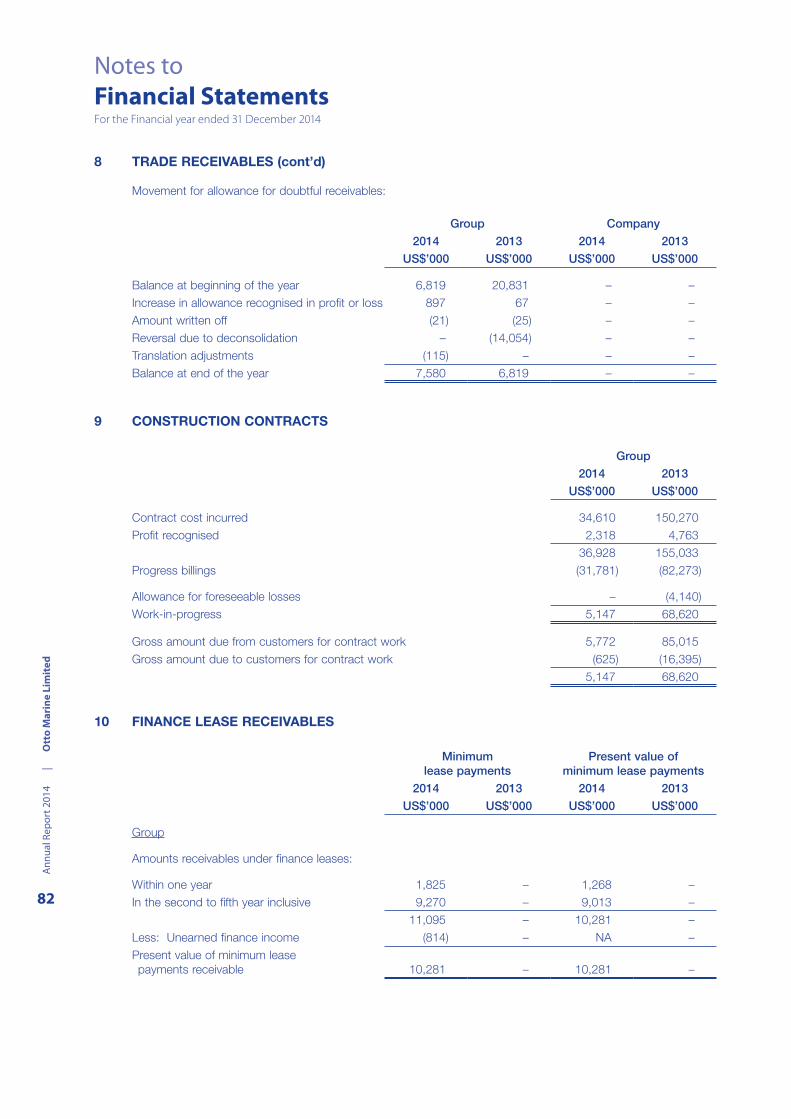
Ann
ual R
epor
t 201
4
|
O
tto
Mar
ine
Lim
ited
82
Notes toFinancial StatementsFor the Financial year ended 31 December 2014
8 TRADE RECEIVABLES (cont’d)
Movement for allowance for doubtful receivables:
Group Company
2014 2013 2014 2013
US$’000 US$’000 US$’000 US$’000
Balance at beginning of the year 6,819 20,831 – –
Increase in allowance recognised in profi t or loss 897 67 – –
Amount written off (21) (25) – –
Reversal due to deconsolidation – (14,054) – –
Translation adjustments (115) – – –
Balance at end of the year 7,580 6,819 – –
9 CONSTRUCTION CONTRACTS
Group
2014 2013
US$’000 US$’000
Contract cost incurred 34,610 150,270
Profi t recognised 2,318 4,763
36,928 155,033
Progress billings (31,781) (82,273)
Allowance for foreseeable losses – (4,140)
Work-in-progress 5,147 68,620
Gross amount due from customers for contract work 5,772 85,015
Gross amount due to customers for contract work (625) (16,395)
5,147 68,620
10 FINANCE LEASE RECEIVABLES
Minimumlease payments
Present value ofminimum lease payments
2014 2013 2014 2013
US$’000 US$’000 US$’000 US$’000
Group
Amounts receivables under fi nance leases:
Within one year 1,825 – 1,268 –
In the second to fi fth year inclusive 9,270 – 9,013 –
11,095 – 10,281 –
Less: Unearned fi nance income (814) – NA –
Present value of minimum lease
payments receivable 10,281 – 10,281 –
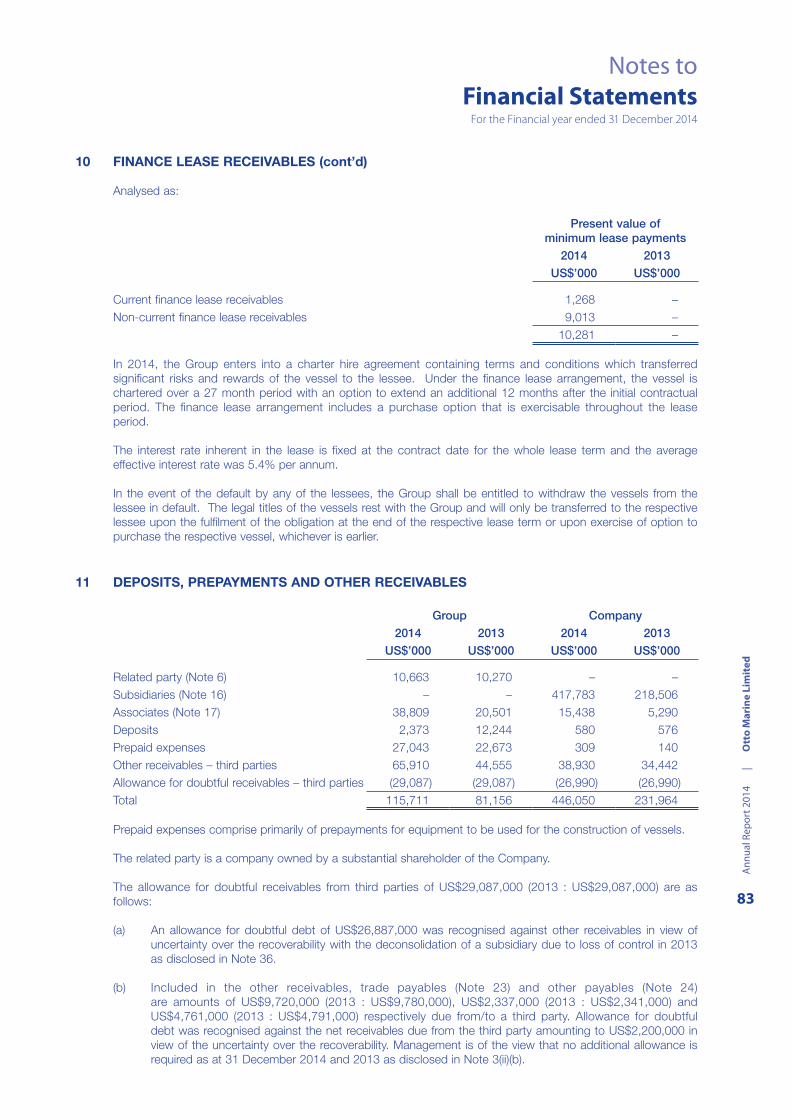
Ann
ual R
epor
t 201
4
|
O
tto
Mar
ine
Lim
ited
83
Notes toFinancial Statements
For the Financial year ended 31 December 2014
10 FINANCE LEASE RECEIVABLES (cont’d)
Analysed as:
Present value ofminimum lease payments
2014 2013
US$’000 US$’000
Current fi nance lease receivables 1,268 –
Non-current fi nance lease receivables 9,013 –
10,281 –
In 2014, the Group enters into a charter hire agreement containing terms and conditions which transferred
signifi cant risks and rewards of the vessel to the lessee. Under the fi nance lease arrangement, the vessel is
chartered over a 27 month period with an option to extend an additional 12 months after the initial contractual
period. The fi nance lease arrangement includes a purchase option that is exercisable throughout the lease
period.
The interest rate inherent in the lease is fi xed at the contract date for the whole lease term and the average
effective interest rate was 5.4% per annum.
In the event of the default by any of the lessees, the Group shall be entitled to withdraw the vessels from the
lessee in default. The legal titles of the vessels rest with the Group and will only be transferred to the respective
lessee upon the fulfi lment of the obligation at the end of the respective lease term or upon exercise of option to
purchase the respective vessel, whichever is earlier.
11 DEPOSITS, PREPAYMENTS AND OTHER RECEIVABLES
Group Company
2014 2013 2014 2013
US$’000 US$’000 US$’000 US$’000
Related party (Note 6) 10,663 10,270 – –
Subsidiaries (Note 16) – – 417,783 218,506
Associates (Note 17) 38,809 20,501 15,438 5,290
Deposits 2,373 12,244 580 576
Prepaid expenses 27,043 22,673 309 140
Other receivables – third parties 65,910 44,555 38,930 34,442
Allowance for doubtful receivables – third parties (29,087) (29,087) (26,990) (26,990)
Total 115,711 81,156 446,050 231,964
Prepaid expenses comprise primarily of prepayments for equipment to be used for the construction of vessels.
The related party is a company owned by a substantial shareholder of the Company.
The allowance for doubtful receivables from third parties of US$29,087,000 (2013 : US$29,087,000) are as
follows:
(a) An allowance for doubtful debt of US$26,887,000 was recognised against other receivables in view of
uncertainty over the recoverability with the deconsolidation of a subsidiary due to loss of control in 2013
as disclosed in Note 36.
(b) Included in the other receivables, trade payables (Note 23) and other payables (Note 24)
are amounts of US$9,720,000 (2013 : US$9,780,000), US$2,337,000 (2013 : US$2,341,000) and
US$4,761,000 (2013 : US$4,791,000) respectively due from/to a third party. Allowance for doubtful
debt was recognised against the net receivables due from the third party amounting to US$2,200,000 in
view of the uncertainty over the recoverability. Management is of the view that no additional allowance is
required as at 31 December 2014 and 2013 as disclosed in Note 3(ii)(b).
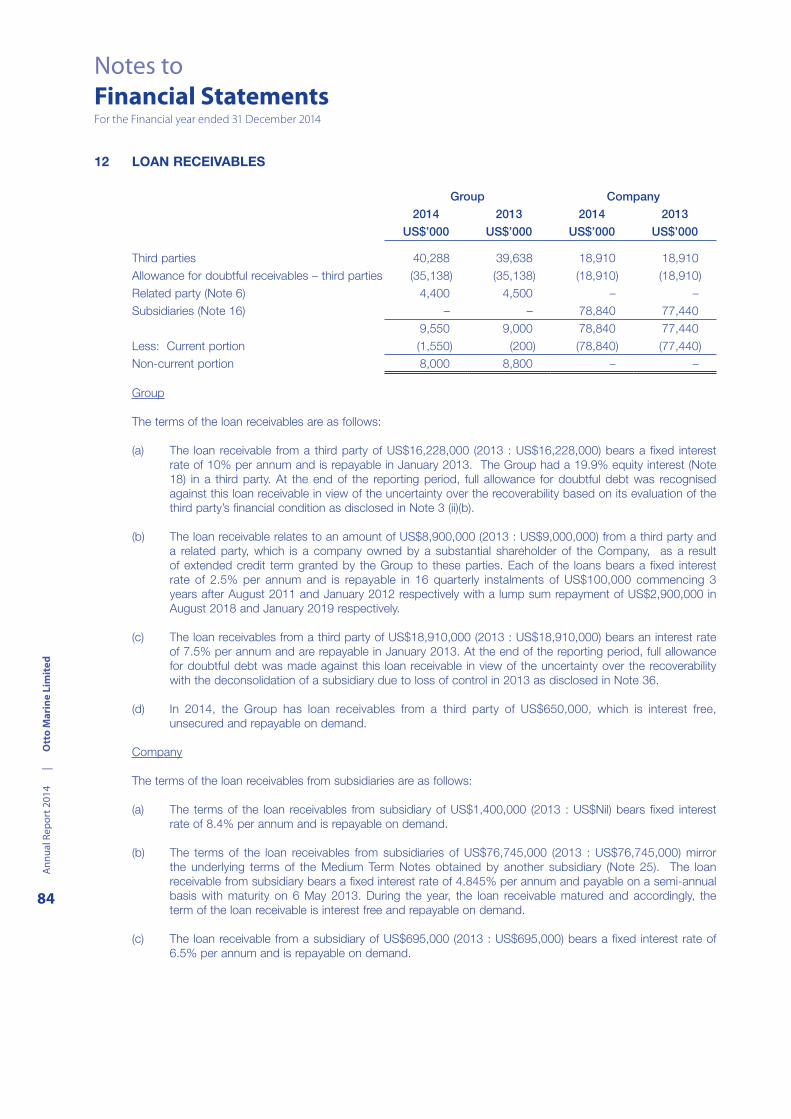
Ann
ual R
epor
t 201
4
|
O
tto
Mar
ine
Lim
ited
84
Notes toFinancial StatementsFor the Financial year ended 31 December 2014
12 LOAN RECEIVABLES
Group Company
2014 2013 2014 2013
US$’000 US$’000 US$’000 US$’000
Third parties 40,288 39,638 18,910 18,910
Allowance for doubtful receivables – third parties (35,138) (35,138) (18,910) (18,910)
Related party (Note 6) 4,400 4,500 – –
Subsidiaries (Note 16) – – 78,840 77,440
9,550 9,000 78,840 77,440
Less: Current portion (1,550) (200) (78,840) (77,440)
Non-current portion 8,000 8,800 – –
Group
The terms of the loan receivables are as follows:
(a) The loan receivable from a third party of US$16,228,000 (2013 : US$16,228,000) bears a fi xed interest
rate of 10% per annum and is repayable in January 2013. The Group had a 19.9% equity interest (Note
18) in a third party. At the end of the reporting period, full allowance for doubtful debt was recognised
against this loan receivable in view of the uncertainty over the recoverability based on its evaluation of the
third party’s fi nancial condition as disclosed in Note 3 (ii)(b).
(b) The loan receivable relates to an amount of US$8,900,000 (2013 : US$9,000,000) from a third party and
a related party, which is a company owned by a substantial shareholder of the Company, as a result
of extended credit term granted by the Group to these parties. Each of the loans bears a fi xed interest
rate of 2.5% per annum and is repayable in 16 quarterly instalments of US$100,000 commencing 3
years after August 2011 and January 2012 respectively with a lump sum repayment of US$2,900,000 in
August 2018 and January 2019 respectively.
(c) The loan receivables from a third party of US$18,910,000 (2013 : US$18,910,000) bears an interest rate
of 7.5% per annum and are repayable in January 2013. At the end of the reporting period, full allowance
for doubtful debt was made against this loan receivable in view of the uncertainty over the recoverability
with the deconsolidation of a subsidiary due to loss of control in 2013 as disclosed in Note 36.
(d) In 2014, the Group has loan receivables from a third party of US$650,000, which is interest free,
unsecured and repayable on demand.
Company
The terms of the loan receivables from subsidiaries are as follows:
(a) The terms of the loan receivables from subsidiary of US$1,400,000 (2013 : US$Nil) bears fi xed interest
rate of 8.4% per annum and is repayable on demand.
(b) The terms of the loan receivables from subsidiaries of US$76,745,000 (2013 : US$76,745,000) mirror
the underlying terms of the Medium Term Notes obtained by another subsidiary (Note 25). The loan
receivable from subsidiary bears a fi xed interest rate of 4.845% per annum and payable on a semi-annual
basis with maturity on 6 May 2013. During the year, the loan receivable matured and accordingly, the
term of the loan receivable is interest free and repayable on demand.
(c) The loan receivable from a subsidiary of US$695,000 (2013 : US$695,000) bears a fi xed interest rate of
6.5% per annum and is repayable on demand.

Ann
ual R
epor
t 201
4
|
O
tto
Mar
ine
Lim
ited
85
Notes toFinancial Statements
For the Financial year ended 31 December 2014
13 INVENTORIES
Group
2014 2013
US$’000 US$’000
Raw materials and equipment 8,163 12,095
Work-in-progress - vessels 128,888 115,868
Total 137,051 127,963
As at 31 December 2014, the carrying amounts of the Group’s inventories amounting to US$96,104,000 (2013 :
US$72,100,000) are mortgaged as security for borrowings from fi nancial institutions (Note 20).
14 PROPERTY, PLANT AND EQUIPMENT
Vessels
Leaseholdland andbuilding
Offi ceequipment,
furnitureand fi ttings
Motorvehicles
Machineryand
equipment Construction-in-progress Total
US$’000 US$’000 US$’000 US$’000 US$’000 US$’000 US$’000
Group
Cost:
At 1 January 2013 375,145 45,102 3,132 511 45,868 9,837 479,595
Additions 61,345 95 1,280 346 5,593 10,831 79,490
Disposal/Write off (53,951) – (115) (66) (137) – (54,269)
Deconsolidation of subsidiary (Note 36) (354) – (297) – (24,210) (10,895) (35,756)
Transfer from inventories 183,876 – – – – – 183,876
Transfer to inventories (62,000) – – – – – (62,000)
Translation adjustments (1,421) (815) (123) (53) (470) (132) (3,014)
At 31 December 2013 502,640 44,382 3,877 738 26,644 9,641 587,922
Additions 81,554 1,199 519 49 56 – 83,377
Disposal/Write off (50,946) (3) (9) (28) – – (50,986)
Transfer from work-in-progress 22,115 – – – – – 22,115
Reclassifi cation 964 – – – (964) – –
Translation adjustments (263) (112) (76) (29) (75) (58) (613)
At 31 December 2014 556,064 45,466 4,311 730 25,661 9,583 641,815
Accumulated depreciation:
At 1 January 2013 29,800 9,125 2,130 294 25,617 – 66,966
Depreciation 18,578 2,240 549 88 3,905 – 25,360
Disposal/Write off (7,244) – (115) (66) (63) – (7,488)
Deconsolidation of subsidiary (Note 36) (59) – (150) – (12,206) – (12,415)
Transfer to inventories (4,471) – – – – – (4,471)
Translation adjustments (641) (329) (65) (33) (387) – (1,455)
At 31 December 2013 35,963 11,036 2,349 283 16,866 – 66,497
Depreciation 29,405 2,262 660 187 3,101 – 35,615
Disposal/Write off (6,950) (3) (9) (15) – – (6,977)
Reclassifi cation 61 – – – (61) – –
Translation adjustments (805) (60) (52) (29) (77) – (1,023)
At 31 December 2014 57,674 13,235 2,948 426 19,829 – 94,112
Impairment:
At 1 January 2013 314 – 153 – 9,941 7,435 17,843
Deconsolidation of subsidiary (Note 36) (314) – (153) – (9,941) (7,435) (17,843)
At 31 December 2013 and 2014 – – – – – – –
Carrying amount:
At 31 December 2014 498,390 32,231 1,363 304 5,832 9,583 547,703
At 31 December 2013 466,677 33,346 1,528 455 9,778 9,641 521,425

Ann
ual R
epor
t 201
4
|
O
tto
Mar
ine
Lim
ited
86
Notes toFinancial StatementsFor the Financial year ended 31 December 2014
14 PROPERTY, PLANT AND EQUIPMENT (cont’d)
Vessels
Leaseholdland andbuilding
Offi ceequipment,
furnitureand fi ttings
Motorvehicles
Machineryand
equipment Construction-in-progress Total
US$’000 US$’000 US$’000 US$’000 US$’000 US$’000 US$’000
Company
Cost:
At 1 January 2013 – – 1,123 40 – – 1,163
Additions – – 674 275 – – 949
At 31 December 2013 – – 1,797 315 – – 2,112
Additions – – 312 50 – – 362
Disposal – – (2) (28) – – (30)
At 31 December 2014 – – 2,107 337 – – 2,444
Accumulated depreciation:
At 1 January 2013 – – 816 13 – – 829
Depreciation – – 326 31 – – 357
At 31 December 2013 – – 1,142 44 – – 1,186
Depreciation – – 320 72 – – 392
Disposal – – (1) (15) – – (16)
At 31 December 2014 – – 1,461 101 – – 1,562
Carrying amount:
At 31 December 2014 – – 646 236 – – 882
At 31 December 2013 – – 655 271 – – 926
The carrying amounts of the Group’s property, plant and equipment mortgaged as security for borrowings from
fi nancial institutions (Note 20) are as follows:
VesselsUS$’000
Leaseholdland andbuilding US$’000
Machineryand
equipment US$’000
TotalUS$’000
At 31 December 2014 229,262 6,821 445 236,528
At 31 December 2013 221,504 6,445 952 228,901
The carrying amounts of property, plant and equipment held by the Group and the Company under fi nance lease
arrangements (Note 21) are as follows:
Group Company
2014 2013 2014 2013
US$’000 US$’000 US$’000 US$’000
Vessels 203,078 188,980 – –
Offi ce equipment, furniture and fi ttings 544 551 544 551
Motor vehicles 177 227 177 227
Machinery and equipment – 1,049 – –
Total 203,799 190,807 721 778

Ann
ual R
epor
t 201
4
|
O
tto
Mar
ine
Lim
ited
87
Notes toFinancial Statements
For the Financial year ended 31 December 2014
15 GOODWILL
Group
US$’000
Cost:
At 1 January 2013, 31 December 2013 and 2014 41,750
Impairment:
At 1 January 2013, 31 December 2013 and 2014 (3,436)
Carrying amount:
At 31 December 2013 and 2014 38,314
Goodwill acquired in a business combination is allocated, at acquisition, to the cash generating units (“CGU”)
that are expected to benefi t from that business combination. After recognition of impairment losses, the carrying
amount of goodwill had been allocated as follows:
Group
2014 2013
US$’000 US$’000
Shipyard segment
- CGU 1 31,642 31,642
- CGU 2 1,229 1,229
32,871 32,871
Shipping and chartering segment (CGU 3) 5,443 5,443
Total 38,314 38,314
16 INVESTMENT IN SUBSIDIARIES
Company
2014 2013
US$’000 US$’000
Unquoted equity shares at cost 184,891 184,891
Less: Impairment loss (4,411) (4,411)
Net 180,480 180,480
The amounts due from/to subsidiaries are unsecured, interest-free and repayable on demand unless stated
otherwise.
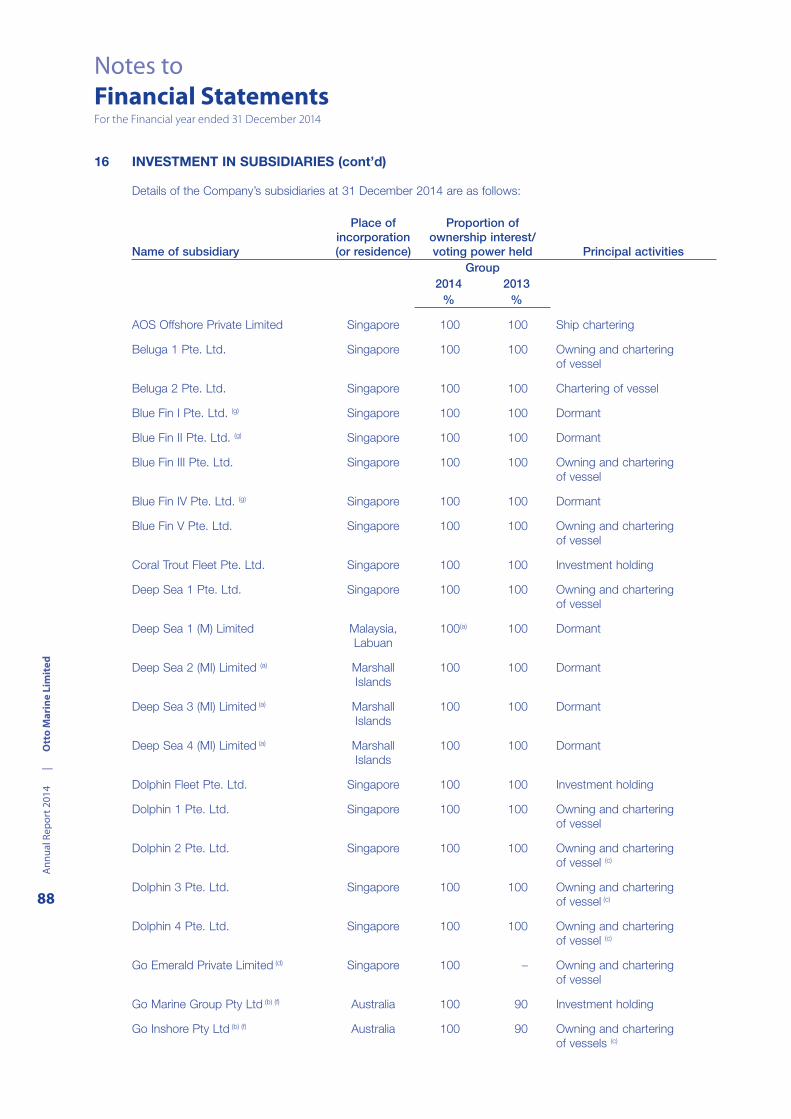
Ann
ual R
epor
t 201
4
|
O
tto
Mar
ine
Lim
ited
88
Notes toFinancial StatementsFor the Financial year ended 31 December 2014
16 INVESTMENT IN SUBSIDIARIES (cont’d)
Details of the Company’s subsidiaries at 31 December 2014 are as follows:
Name of subsidiary
Place ofincorporation(or residence)
Proportion of ownership interest/voting power held Principal activities
Group2014 2013
% %
AOS Offshore Private Limited Singapore 100 100 Ship chartering
Beluga 1 Pte. Ltd. Singapore 100 100 Owning and chartering
of vessel
Beluga 2 Pte. Ltd. Singapore 100 100 Chartering of vessel
Blue Fin I Pte. Ltd. (g) Singapore 100 100 Dormant
Blue Fin II Pte. Ltd. (g) Singapore 100 100 Dormant
Blue Fin III Pte. Ltd. Singapore 100 100 Owning and chartering
of vessel
Blue Fin IV Pte. Ltd. (g) Singapore 100 100 Dormant
Blue Fin V Pte. Ltd. Singapore 100 100 Owning and chartering
of vessel
Coral Trout Fleet Pte. Ltd. Singapore 100 100 Investment holding
Deep Sea 1 Pte. Ltd. Singapore 100 100 Owning and chartering
of vessel
Deep Sea 1 (M) Limited Malaysia,
Labuan
100(a) 100 Dormant
Deep Sea 2 (MI) Limited (a) Marshall
Islands
100 100 Dormant
Deep Sea 3 (MI) Limited (a) Marshall
Islands
100 100 Dormant
Deep Sea 4 (MI) Limited (a) Marshall
Islands
100 100 Dormant
Dolphin Fleet Pte. Ltd. Singapore 100 100 Investment holding
Dolphin 1 Pte. Ltd. Singapore 100 100 Owning and chartering
of vessel
Dolphin 2 Pte. Ltd. Singapore 100 100 Owning and chartering
of vessel (c)
Dolphin 3 Pte. Ltd. Singapore 100 100 Owning and chartering
of vessel (c)
Dolphin 4 Pte. Ltd. Singapore 100 100 Owning and chartering
of vessel (c)
Go Emerald Private Limited (d) Singapore 100 – Owning and chartering
of vessel
Go Marine Group Pty Ltd (b) (f) Australia 100 90 Investment holding
Go Inshore Pty Ltd (b) (f) Australia 100 90 Owning and chartering
of vessels (c)

Ann
ual R
epor
t 201
4
|
O
tto
Mar
ine
Lim
ited
89
Notes toFinancial Statements
For the Financial year ended 31 December 2014
16 INVESTMENT IN SUBSIDIARIES (cont’d)
Name of subsidiary
Place ofincorporation(or residence)
Proportion of ownership interest/voting power held Principal activities
Group
2014 2013
% %
Go Offshore Pty Ltd (b) (f) Australia 100 90 Manning and chartering
of vessels
Go Oranda Limited (b) (f) British Virgin
Island
100 90 Owning and chartering
of vessel
Go Rigel Private Limited (b) (f) Singapore 100 90 Owning and chartering
of vessel
Go Swordfi sh Private Limited Singapore 100 100 Owning and chartering
of vessel
Go Offshore (Asia) Pte. Ltd. (b) (f) Singapore 100 90 Ship management
services, owning and
chartering of vessels (c)
Go Offshore International
Private Limited (b) (d) (f)
Singapore 100 – Ship chartering
Go Offshore (L)
Private Limited (b) (d) (f)
Singapore 100 – Ship chartering
Go Offshore (UK) Limited (b) (d) (f) United
Kingdom
100 – Ship chartering
Go Marine Investments
Private Limited (b) (f)
Singapore 100 90 Investment holding
Go Marine Services Pty Ltd (b) (f) Australia 100 90 Dormant
Go Marine Ship
Management (M) Sdn. Bhd. (b) (f)
Malaysia,
Labuan
100 90 Ship management and
crewing services
Go Marine Ship Management (S)
Private Limited (b) (f)
Singapore 100 90 Ship management services
Go Sirius Private Limited (b) (f) Singapore 100 90 Owning and chartering
of vessels
Go Spica Pte. Ltd. (b) (f) Malaysia,
Labuan
100 90 Owning and chartering
of vessels
Go Spica Sdn. Bhd. (b) (f) Malaysia 100 90 Dormant
Go To Marine Pty Ltd (b) (f) Australia 100 95 Chartering of vessel
Go Marine Director and
Employee Trust (b) (f)
Australia 100 90 Dormant
Global Karp Pte. Ltd. Singapore 100 100 Investment holding
Global Workboats Pte. Ltd. Singapore 100 100 Ship management
Koi Marine Limited Marshall
Islands
100(a) 100 Owning and chartering
of vessels
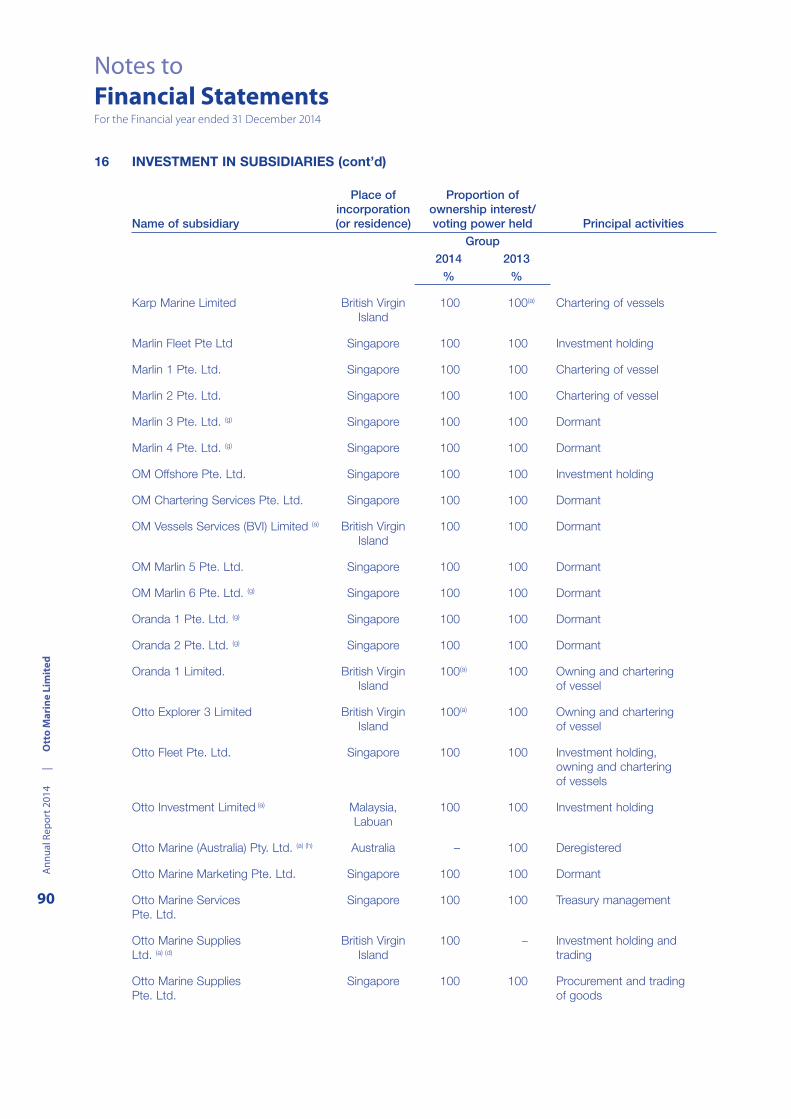
Ann
ual R
epor
t 201
4
|
O
tto
Mar
ine
Lim
ited
90
Notes toFinancial StatementsFor the Financial year ended 31 December 2014
16 INVESTMENT IN SUBSIDIARIES (cont’d)
Name of subsidiary
Place ofincorporation(or residence)
Proportion of ownership interest/voting power held Principal activities
Group
2014 2013
% %
Karp Marine Limited British Virgin
Island
100 100(a) Chartering of vessels
Marlin Fleet Pte Ltd Singapore 100 100 Investment holding
Marlin 1 Pte. Ltd. Singapore 100 100 Chartering of vessel
Marlin 2 Pte. Ltd. Singapore 100 100 Chartering of vessel
Marlin 3 Pte. Ltd. (g) Singapore 100 100 Dormant
Marlin 4 Pte. Ltd. (g) Singapore 100 100 Dormant
OM Offshore Pte. Ltd. Singapore 100 100 Investment holding
OM Chartering Services Pte. Ltd. Singapore 100 100 Dormant
OM Vessels Services (BVI) Limited (a) British Virgin
Island
100 100 Dormant
OM Marlin 5 Pte. Ltd. Singapore 100 100 Dormant
OM Marlin 6 Pte. Ltd. (g) Singapore 100 100 Dormant
Oranda 1 Pte. Ltd. (g) Singapore 100 100 Dormant
Oranda 2 Pte. Ltd. (g) Singapore 100 100 Dormant
Oranda 1 Limited. British Virgin
Island
100(a) 100 Owning and chartering
of vessel
Otto Explorer 3 Limited British Virgin
Island
100(a) 100 Owning and chartering
of vessel
Otto Fleet Pte. Ltd. Singapore 100 100 Investment holding,
owning and chartering
of vessels
Otto Investment Limited (a) Malaysia,
Labuan
100 100 Investment holding
Otto Marine (Australia) Pty. Ltd. (a) (h) Australia – 100 Deregistered
Otto Marine Marketing Pte. Ltd. Singapore 100 100 Dormant
Otto Marine Services
Pte. Ltd.
Singapore 100 100 Treasury management
Otto Marine Supplies
Ltd. (a) (d)
British Virgin
Island
100 – Investment holding and
trading
Otto Marine Supplies
Pte. Ltd.
Singapore 100 100 Procurement and trading
of goods

Ann
ual R
epor
t 201
4
|
O
tto
Mar
ine
Lim
ited
91
Notes toFinancial Statements
For the Financial year ended 31 December 2014
16 INVESTMENT IN SUBSIDIARIES (cont’d)
Name of subsidiary
Place ofincorporation(or residence)
Proportion of ownership interest/voting power held Principal activities
Group
2014 2013
% %
Otto Offshore Limited Malaysia,
Labuan
100 100 Procurement and sale
of vessels
Otto Ship Management
Pte. Ltd.
Singapore 100 100 Ship management services
Otto Strategic Pte. Ltd. Singapore 100 100 Investment holding
Otto Ventures Pte. Ltd. Singapore 100 100 Investment holding
PT Batamec Indonesia,
Batam
95 95 Shipbuilding, ship repair,
conversion and fabrication
PT Lestari Utama
Nusantara
Indonesia,
Jakarta
(Operations:
Batam)
95 95 Land and equipment
rental
Redfi sh 1 Pte. Ltd. Singapore 100 100 Dormant
Redfi sh 2 Pte. Ltd. (g) Singapore 100 100 Dormant
Redfi sh 3 Pte. Ltd. Singapore 100 100 Owning and chartering
of vessel
Redfi sh 4 Pte. Ltd. Singapore 100 100 Dormant
Refl ect Geophysical Pte. Ltd.(e) Singapore – – Dormant
Refl ect Offshore Pte. Ltd. (e) Singapore – – Dormant
Sailfi sh 1 Pte. Ltd. Singapore 100 100 Dormant
Sailfi sh 2 Pte. Ltd. (g) Singapore 100 100 Dormant
Sailfi sh 3 Limited (a) British Virgin
Island
100 100 Owning and chartering
of vessel
Sailfi sh Supply Limited British Virgin
Island
100(a) 100 Chartering of vessels
Supply Fleet Pte Ltd Singapore 100 100 Investment holding
Swordfi sh 1 Pte. Ltd. Singapore 100 100 Owning and
chartering of vessel
Swordfi sh 2 Pte. Ltd. Singapore 100 100 Owning and chartering
of vessel
Swordfi sh 3 Pte Ltd Singapore 100 100 Dormant
Swordfi sh 4 Pte Ltd Singapore 100 100 Owning and chartering
of vessel

Ann
ual R
epor
t 201
4
|
O
tto
Mar
ine
Lim
ited
92
Notes toFinancial StatementsFor the Financial year ended 31 December 2014
16 INVESTMENT IN SUBSIDIARIES (cont’d)
Name of subsidiary
Place ofincorporation(or residence)
Proportion of ownership interest/voting power held Principal activities
Group
2014 2013
% %
Swordfi sh 5 Pte Ltd Singapore 100 100 Owning and chartering
of vessel
Surf Ranger Ltd (a) (d) Marshall
Islands
100 – Owning and chartering
of vessel
Surf Subsea Pte. Ltd. Singapore 100 100 Investment holding
Surf Supporter Pte. Ltd. (d) Singapore 100 – Owning and chartering
of vessel
Surf Ventures Pte. Ltd. (d) Singapore 100 – Investment holding
Tarpon 4 Pte. Ltd. Singapore 100 100 Investment holding
Tetra I Pte. Ltd. Singapore 100 100 Owning and chartering
of vessel (c)
Tetra II Pte. Ltd. Singapore 100 100 Owning and chartering
of vessel (c)
Tetra III Pte. Ltd. Singapore 100 100 Owning and chartering
of vessel
Tetra IV Pte. Ltd. (g) Singapore 100 100 Dormant
Tetra V Pte. Ltd. Singapore 100 100 Owning and chartering
of vessel
Notes on auditor
The subsidiaries are audited by Deloitte & Touche LLP, Singapore except as described below:
(a) Not audited for consolidation purposes as management is of the opinion that the results of the subsidiaries for the year
are insignifi cant.
(b) Audited by other member fi rms of Deloitte Touche Tohmatsu Limited for consolidation purpose only.
Notes on shareholding
(c) Vessels disposed during the year.
(d) Incorporated during the fi nancial year.
(e) In 2013, when liquidators were appointed for the entity, the Group had deconsolidated the results of the subsidiary due
to the loss of control (Note 36).
(f) In 2014, the Group has issued and allotted 87,880,281 new shares at the issue price of US$0.057 (S$0.071) per share
to Garrick James Stanley (Group Chief Executive Offi cer and Executive Director) in consideration of the acquisition of
10% of Go Marine Group Pty Ltd, amounting to US$5,000,000. This resulted in an increase in shareholding.
(g) The entities are in the process of striking off.
(h) The entity was deregistered in 2014.
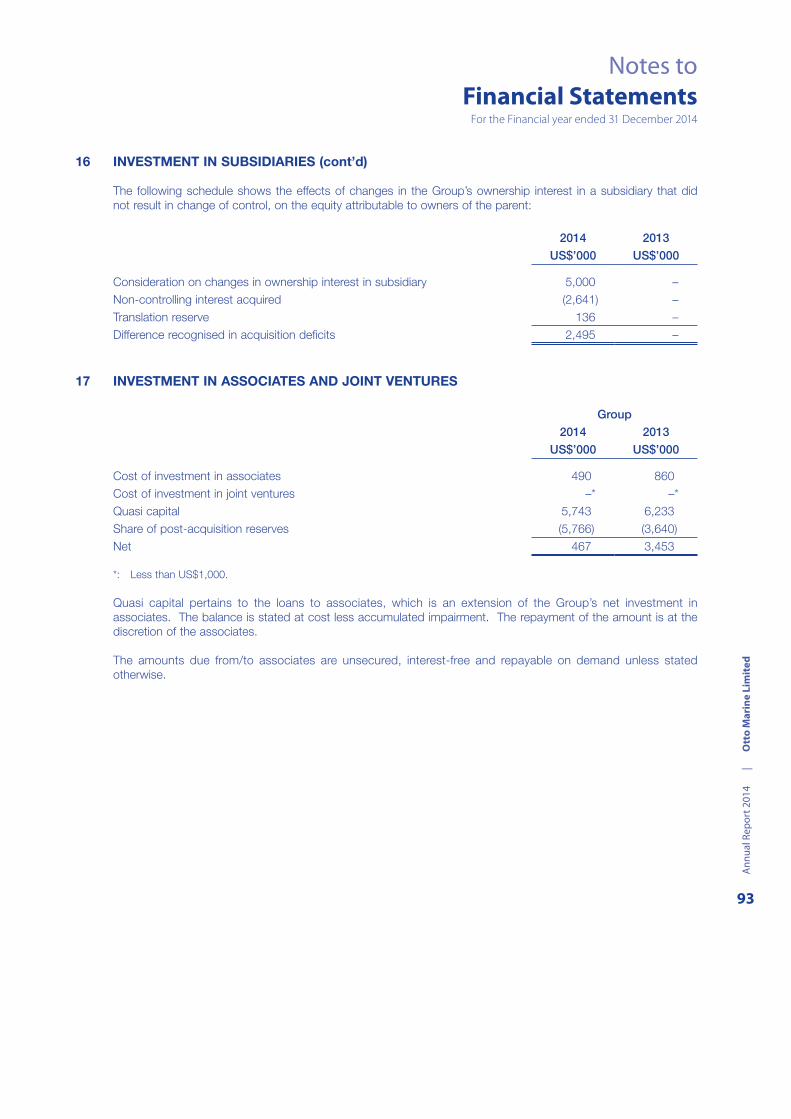
Ann
ual R
epor
t 201
4
|
O
tto
Mar
ine
Lim
ited
93
Notes toFinancial Statements
For the Financial year ended 31 December 2014
16 INVESTMENT IN SUBSIDIARIES (cont’d)
The following schedule shows the effects of changes in the Group’s ownership interest in a subsidiary that did
not result in change of control, on the equity attributable to owners of the parent:
2014 2013
US$’000 US$’000
Consideration on changes in ownership interest in subsidiary 5,000 –
Non-controlling interest acquired (2,641) –
Translation reserve 136 –
Difference recognised in acquisition defi cits 2,495 –
17 INVESTMENT IN ASSOCIATES AND JOINT VENTURES
Group
2014 2013
US$’000 US$’000
Cost of investment in associates 490 860
Cost of investment in joint ventures –* –*
Quasi capital 5,743 6,233
Share of post-acquisition reserves (5,766) (3,640)
Net 467 3,453
*: Less than US$1,000.
Quasi capital pertains to the loans to associates, which is an extension of the Group’s net investment in
associates. The balance is stated at cost less accumulated impairment. The repayment of the amount is at the
discretion of the associates.
The amounts due from/to associates are unsecured, interest-free and repayable on demand unless stated
otherwise.
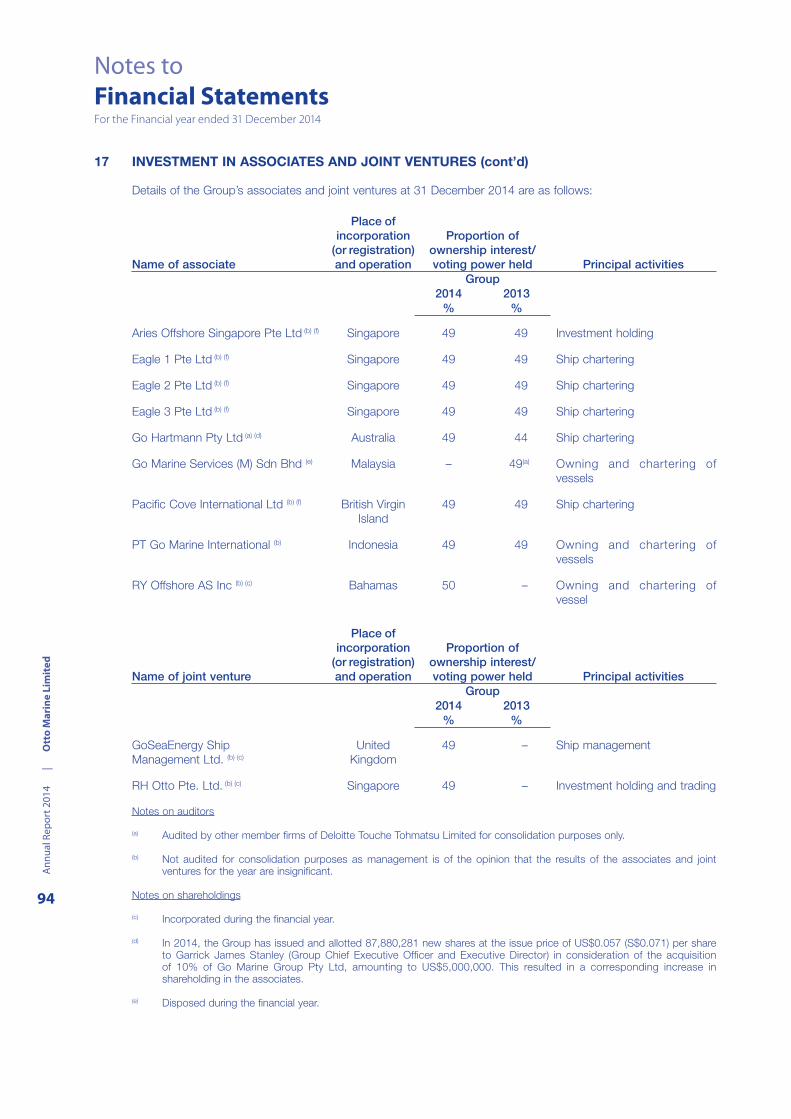
Ann
ual R
epor
t 201
4
|
O
tto
Mar
ine
Lim
ited
94
Notes toFinancial StatementsFor the Financial year ended 31 December 2014
17 INVESTMENT IN ASSOCIATES AND JOINT VENTURES (cont’d)
Details of the Group’s associates and joint ventures at 31 December 2014 are as follows:
Name of associate
Place of incorporation
(or registration) and operation
Proportion of ownership interest/voting power held Principal activities
Group2014 2013
% %
Aries Offshore Singapore Pte Ltd (b) (f) Singapore 49 49 Investment holding
Eagle 1 Pte Ltd (b) (f) Singapore 49 49 Ship chartering
Eagle 2 Pte Ltd (b) (f) Singapore 49 49 Ship chartering
Eagle 3 Pte Ltd (b) (f) Singapore 49 49 Ship chartering
Go Hartmann Pty Ltd (a) (d) Australia 49 44 Ship chartering
Go Marine Services (M) Sdn Bhd (e) Malaysia – 49(a) Owning and chartering of
vessels
Pacifi c Cove International Ltd (b) (f) British Virgin
Island
49 49 Ship chartering
PT Go Marine International (b) Indonesia 49 49 Owning and chartering of
vessels
RY Offshore AS Inc (b) (c) Bahamas 50 – Owning and chartering of
vessel
Name of joint venture
Place of incorporation
(or registration) and operation
Proportion of ownership interest/voting power held Principal activities
Group2014 2013
% %
GoSeaEnergy Ship
Management Ltd. (b) (c)
United
Kingdom
49 – Ship management
RH Otto Pte. Ltd. (b) (c) Singapore 49 – Investment holding and trading
Notes on auditors
(a) Audited by other member fi rms of Deloitte Touche Tohmatsu Limited for consolidation purposes only.
(b) Not audited for consolidation purposes as management is of the opinion that the results of the associates and joint ventures for the year are insignifi cant.
Notes on shareholdings
(c) Incorporated during the fi nancial year.
(d) In 2014, the Group has issued and allotted 87,880,281 new shares at the issue price of US$0.057 (S$0.071) per share to Garrick James Stanley (Group Chief Executive Offi cer and Executive Director) in consideration of the acquisition of 10% of Go Marine Group Pty Ltd, amounting to US$5,000,000. This resulted in a corresponding increase in shareholding in the associates.
(e) Disposed during the fi nancial year.

Ann
ual R
epor
t 201
4
|
O
tto
Mar
ine
Lim
ited
95
Notes toFinancial Statements
For the Financial year ended 31 December 2014
17 INVESTMENT IN ASSOCIATES AND JOINT VENTURES (cont’d)
Notes on shareholdings (cont’d)
(f) In 2014, the Group, Hoe Leong Corporation Ltd. (“HLC”), Aries Offshore Singapore Pte Ltd (“Aries”) and its 4 wholly owned subsidiaries (collectively, the “Aries Group”) have entered into a deed of settlement in connection with the
termination of their joint venture investment (the “Joint Venture”) in the Aries Group (the “Deed”).
Pursuant to the Deed, Otto Ventures Pte Ltd will inter alia, acquire HLC’s 51% of the shares in Aries for a consideration
of US$1 and the mutual release and discharge of any and all claims which the Group and HLC may have against each
other (the “Acquisition”). Such consideration was derived from arm’s length negotiations between the Group and HLC,
taking into account:
a) Mutual desire to terminate the Joint Venture and divide the assets of Aries Group on an amicable basis; and
b) The net asset value of Aries Group.
Upon the completion of the Acquisition, Aries shall become a wholly-owned subsidiary of the Group. As at 31
December 2014, the acquisition conditions have not been met by HLC. The acquisition is expected to be completed in
2015.
Summarised fi nancial information in respect of the Group’s associates and joint ventures is set out below:
2014 2013
US$’000 US$’000
Total assets 266,701 192,267
Total liabilities (279,918) (185,221)
Net assets (13,217) 7,046
Group’s share of associates and joint ventures net assets 467 3,453
Revenue 23,849 42,842
Losses for the year (18,423) (9,552)
Group’s share of associates and joint ventures’ losses for the year (5,925) (4,680)
Add: Realisation of deferred gain (Note 26) 798 558
Total Group’s share of associates and joint ventures’ losses for the year (5,127) (4,122)
The Group has not recognised losses amounting to US$3,079,000 (2013 : US$Nil), representing the
accumulated losses not recognised.
18 AVAILABLE-FOR-SALE INVESTMENTS
Group
2014 2013
US$’000 US$’000
Quoted equity shares, at fair value 7 144
Unquoted equity shares, at cost 3,376 3,376
Allowance for impairment loss – Unquoted equity shares (3,376) (3,376)
Total 7 144
Quoted equity shares offer the Group opportunity for return through dividend income and fair value gains. They
have no fi xed maturity or coupon rate. The fair values of these shares are based on the quoted closing market
prices of the latest trade in the shares on the Norwegian Over The Counter system.

Ann
ual R
epor
t 201
4
|
O
tto
Mar
ine
Lim
ited
96
Notes toFinancial StatementsFor the Financial year ended 31 December 2014
18 AVAILABLE-FOR-SALE INVESTMENTS (cont’d)
The investment in unquoted equity shares, representing a 19.9% equity interest in a company, present the Group
with opportunity for return through dividend income and capital appreciation. Management is of the view that the
fair value of unquoted equity shares cannot be measured reliably as the range of reasonable fair value estimates
is signifi cant and the probabilities of the various estimates cannot be reasonably assessed. Accordingly, this
investment is stated at cost.
As at year end, full allowance for impairment loss was recognised against the cost of investment in unquoted
equity shares in view of the uncertainty over the recoverability based on its evaluation of the third party’s fi nancial
condition.
19 DEFERRED TAX ASSETS
The following are the deferred tax assets recognised by the Group, and the movements thereon, during the
current and prior reporting periods:
Tax losses
US$’000
At 1 January 2013 –
Credit to profi t or loss for the year (Note 33) 1,001
Translation difference (82)
At 31 December 2013 919
Translation difference (79)
At 31 December 2014 840
Subject to the agreement by the tax authorities, at the end of the reporting period, the Group has unutilised tax
losses of US$72,139,000 (2013 : US$42,916,000) available for offset against future profi ts. A deferred tax asset
has been recognised in respect of US$2,800,000 (2013 : US$3,065,000) of such losses. No deferred tax asset
has been recognised in respect of the remaining US$69,339,000 (2013 : US$39,851,000) tax losses due to the
unpredictability of future profi t streams.
20 BORROWINGS FROM FINANCIAL INSTITUTIONS
Effective interestrates (per annum) Group Company
2014 2013 2014 2013 2014 2013
% % US$’000 US$’000 US$’000 US$’000
(i) Current:
Floating rate 1.5% – 13.0% 1.0% – 13.0% 135,084 231,431 729 1,296
(ii) Non–current:
Floating rate 1.5% – 13.0% 1.0% – 13.0% 115,930 98,980 27,957 –
Total 251,014 330,411 28,686 1,296
The Group’s borrowings are primarily secured by a personal guarantee from a director, fi xed deposits, a charge
over substantial shareholder’s interest in shares, the mortgage of the relevant vessels and certain property,
plant and equipment and inventory, shipyard contracts, insurance taken over the mortgaged vessels, charter
agreements and income.
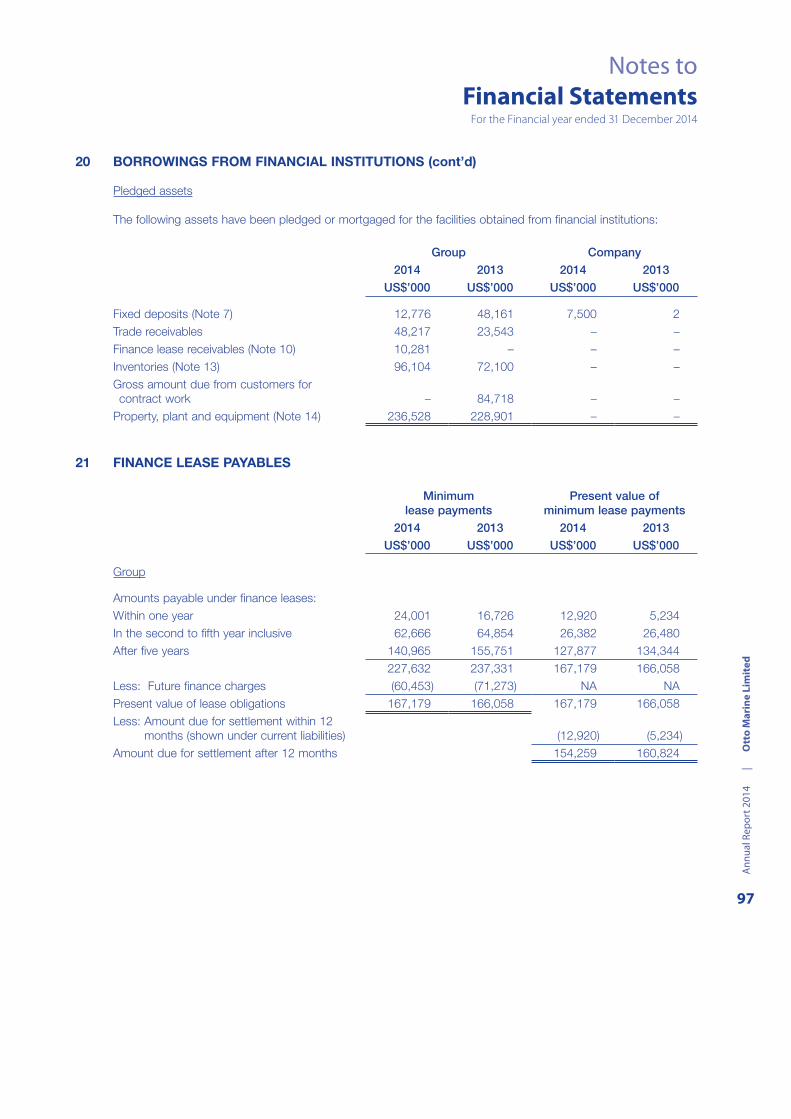
Ann
ual R
epor
t 201
4
|
O
tto
Mar
ine
Lim
ited
97
Notes toFinancial Statements
For the Financial year ended 31 December 2014
20 BORROWINGS FROM FINANCIAL INSTITUTIONS (cont’d)
Pledged assets
The following assets have been pledged or mortgaged for the facilities obtained from fi nancial institutions:
Group Company
2014 2013 2014 2013
US$’000 US$’000 US$’000 US$’000
Fixed deposits (Note 7) 12,776 48,161 7,500 2
Trade receivables 48,217 23,543 – –
Finance lease receivables (Note 10) 10,281 – – –
Inventories (Note 13) 96,104 72,100 – –
Gross amount due from customers for
contract work – 84,718 – –
Property, plant and equipment (Note 14) 236,528 228,901 – –
21 FINANCE LEASE PAYABLES
Minimumlease payments
Present value ofminimum lease payments
2014 2013 2014 2013
US$’000 US$’000 US$’000 US$’000
Group
Amounts payable under fi nance leases:
Within one year 24,001 16,726 12,920 5,234
In the second to fi fth year inclusive 62,666 64,854 26,382 26,480
After fi ve years 140,965 155,751 127,877 134,344
227,632 237,331 167,179 166,058
Less: Future fi nance charges (60,453) (71,273) NA NA
Present value of lease obligations 167,179 166,058 167,179 166,058
Less: Amount due for settlement within 12
months (shown under current liabilities) (12,920) (5,234)
Amount due for settlement after 12 months 154,259 160,824

Ann
ual R
epor
t 201
4
|
O
tto
Mar
ine
Lim
ited
98
Notes toFinancial StatementsFor the Financial year ended 31 December 2014
21 FINANCE LEASE PAYABLES (cont’d)
The average effective interest rate ranges from 2.6% to 24.1% (2013 : 2.7% to 24.1%) per annum. Interest rates
are fi xed at the contract date and thus expose the Group to fair value interest rate risk.
Minimumlease payments
Present value ofminimum lease payments
2014 2013 2014 2013
US$’000 US$’000 US$’000 US$’000
Company
Amounts payable under fi nance leases:
Within one year 449 569 407 516
In the second to fi fth year inclusive 387 516 366 478
836 1,085 773 994
Less: Future fi nance charges (63) (91) NA NA
Present value of lease obligations 773 994 773 994
Less: Amount due for settlement within
12 months (shown under current liabilities) (407) (516)
Amount due for settlement after 12 months 366 478
The average effective interest rate ranges from 2.6% to 8.9% (2013 : 2.7% to 8.9%) per annum. Interest rates
are fi xed at the contract date and thus expose the Company to fair value interest rate risk.
The Group’s and the Company’s obligation under fi nance leases are secured by the lessors’ title to the leased
assets (Note 14).
22 LOAN FROM RELATED PARTIES
Group and Company
2014 2013
US$’000 US$’000
Related party (a) (Note 6) 8,225 17,116
Director (b) (Note 6) 30,000 –
38,225 17,116
Less : Amount due within 12 months (shown under current liabilities) (7,924) (8,238)
Amount due after 12 months 30,301 8,878
(a) As at the end of the reporting period, the term loan from a related party amounting to US$8,225,000 (2013 :
US$17,116,000) is unsecured and bears interest at a fl oating interest rate which approximates an effective interest rate
of 7.5% (2013 : 7.5%) per annum. It is repayable in 20 equal quarterly instalments of US$2,059,000 (S$2,600,000)
commencing September 2008 and certain instalments of the term loan have been deferred based on the agreement
with the related party.
The related party is a company wholly-owned by a director and substantial shareholder of the Company.
(b) As at the end of the reporting period, the term loan from a director of the Company amounting to US$30,000,000 is
unsecured and bears interest at a fi xed rate of 7.0% per annum.

Ann
ual R
epor
t 201
4
|
O
tto
Mar
ine
Lim
ited
99
Notes toFinancial Statements
For the Financial year ended 31 December 2014
23 TRADE PAYABLES
Group Company
2014 2013 2014 2013
US$’000 US$’000 US$’000 US$’000
Related parties (Note 6) 4,045 3,101 3,419 2,664
Subsidiaries (Note 16) – – 52,961 3,367
Associates (Note 17) 6,932 13,403 – –
Accruals 60,519 89,100 9,316 13,228
Third parties 235,924 215,169 176,225 159,337
Total 307,420 320,773 241,921 178,596
The average credit period on purchases of goods from third parties is 90 to 180 days. Trade payables principally
comprise amounts outstanding for trade purchases and ongoing costs.
The related parties mainly pertain to a company wholly-owned by the immediate family of a substantial
shareholder of the Company.
24 OTHER PAYABLES
Group Company
2014 2013 2014 2013
US$’000 US$’000 US$’000 US$’000
Advance from related parties (Note 6) 6,675 4,800 – –
Subsidiaries (Note 16) – – 546,134 368,471
Associates (Note 17) 8,279 297 7,788 –
Advance received from customers 10,635 15,692 – –
Other payables 19,694 18,959 2,810 4,486
Interest payable – third parties 16,707 3,598 1,752 5
Salary related accruals 24,869 28,184 1,252 1,362
Total 86,859 71,530 559,736 374,324
Salary related accruals include US$808,000 (2013 : US$870,000) due to directors. The amount due to directors
is unsecured, interest-free and repayable within 12 months from the end of the reporting period.
Advance from related parties is unsecured, interest-free, and repayable on demand. The related parties comprise
a director who is also a substantial shareholder of the Company and a company controlled by a director of the
Company.

Ann
ual R
epor
t 201
4
|
O
tto
Mar
ine
Lim
ited
100
Notes toFinancial StatementsFor the Financial year ended 31 December 2014
25 LOAN PAYABLES
Group Company
2014 2013 2014 2013
US$’000 US$’000 US$’000 US$’000
Unsecured notes (a) 52,176 – – –
Secured redeemable preference shares (b) 15,250 15,250 – –
Unsecured redeemable preference shares (b) (c) 14,481 14,342 – –
Secured funding 274 – – –
Total 82,181 29,592 – –
Less: Amount due within 12 months (shown
under current liabilities) (7,819) – – –
Amount due after 12 months 74,362 29,592 – –
(a) In 2014, the Group issued US$54,863,000 (S$70,000,000, net of transaction cost of S$1,800,000) second series
unsecured notes (the “Notes”), pursuant to the Group’s US$409,299,000 (S$500,000,000) Multi-Currency Medium Term
Note Programme. The Notes bear a fi xed interest rate of 7.0% per annum which is payable on a semi-annual basis.
The Notes are denominated in Singapore dollars.
(b) On 27 March 2013, investors subscribed for redeemable preference shares in a subsidiary (“Subsidiary A”) for a total of
US$22,500,000 (“Investment Amount A”).
Pursuant to the Option Agreement, the investors have a call option and put option over ordinary shares of another
subsidiary (“Subsidiary B”) which is the holding company of Subsidiary A at an agreed price upon certain event (“Event
A”) occurring on or before 26 March 2016 (“Prescribed Date”). In the event that the preference shares are not converted
to ordinary shares of Subsidiary B by the Prescribed Date, Subsidiary A has the choice to either redeem all the
preference shares equal to the Investment Amount A plus a fi xed rate of return or to not redeem the preference shares
but continue to pay quarterly dividend effective from the date of the Event A.
Management has reviewed all information available at the end of the reporting period including the probability of the
Event A occurring on or before the Prescribed Date and assessed that the fair value of the options is US$Nil as at
31 December 2014 and 2013.
(c) On 18 September 2013, investors subscribed for redeemable preference shares in a subsidiary (“Subsidiary C”) for a
total of US$7,619,000 (S$10,000,000) (“Investment Amount B”). Depending on the date of the occurrence of certain
events (“Event B”) with reference to 18 September 2013, different interest rates, fi xed for the applicable period, will apply
to the Investment Amount B to be paid by Subsidiary C to the investors.
The preference shares can be redeemed in full at the Redemption Amount at the option of (a) the investor if an event of
default or trade sale (subject to certain conditions) occurs prior to May 2015 (“Final Redemption Date”), or (b) Subsidiary
C if Event B occurs prior to the Final Redemption Date. Notwithstanding, the redemption of the preference shares
including all interest owing and dividend (if any) shall not be later than the Final Redemption Date.
Management has reviewed all information available as at the end of the reporting period including the timing of Event
B occurring and classifi ed the redeemable preference shares as “Non-current loan payable” at 31 December 2013.
The balance is classifi ed as “Current loan payable” at 31 December 2014 as the Final Redemption Date is May 2015.
Interest payable is accrued accordingly at the end of each reporting period.

Ann
ual R
epor
t 201
4
|
O
tto
Mar
ine
Lim
ited
101
Notes toFinancial Statements
For the Financial year ended 31 December 2014
26 DEFERRED GAIN
Group
2014 2013
US$’000 US$’000
Deferred gain 11,815 18,613
Current portion (675) (922)
Non-current portion 11,140 17,691
The deferred gain relates to the Group’s share of the unrealised profi t from the sale of vessels to associates. The
deferred gain will be realised over the remaining useful life of the vessels against the results of the associates in
profi t or loss (Note 17).
During the year, the Group recognised US$6,983,000 of previously deferred profi t on sales of vessels to an
associate which is disposed in 2014.
27 DERIVATIVE FINANCIAL INSTRUMENTS
2014 2013
Liabilities Liabilities
US$’000 US$’000
Group
Cross currency swap contracts 4,153 –
Foreign exchange forward contracts – 5,097
4,153 5,097
Analysed as:
Current – 5,097
Non-current 4,153 –
4,153 5,097
Company
Foreign exchange forward contracts – 5,097
Analysed as:
Current – 5,097
Non-current – –
– 5,097
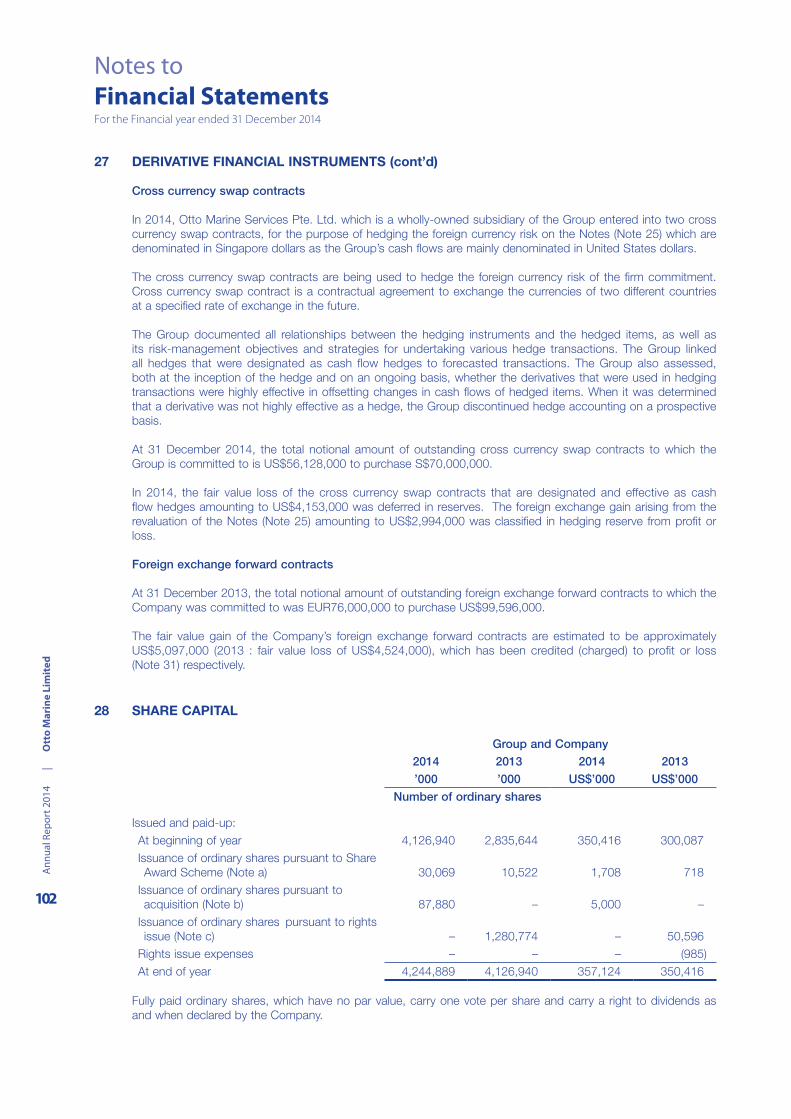
Ann
ual R
epor
t 201
4
|
O
tto
Mar
ine
Lim
ited
102
Notes toFinancial StatementsFor the Financial year ended 31 December 2014
27 DERIVATIVE FINANCIAL INSTRUMENTS (cont’d)
Cross currency swap contracts
In 2014, Otto Marine Services Pte. Ltd. which is a wholly-owned subsidiary of the Group entered into two cross
currency swap contracts, for the purpose of hedging the foreign currency risk on the Notes (Note 25) which are
denominated in Singapore dollars as the Group’s cash fl ows are mainly denominated in United States dollars.
The cross currency swap contracts are being used to hedge the foreign currency risk of the fi rm commitment.
Cross currency swap contract is a contractual agreement to exchange the currencies of two different countries
at a specifi ed rate of exchange in the future.
The Group documented all relationships between the hedging instruments and the hedged items, as well as
its risk-management objectives and strategies for undertaking various hedge transactions. The Group linked
all hedges that were designated as cash fl ow hedges to forecasted transactions. The Group also assessed,
both at the inception of the hedge and on an ongoing basis, whether the derivatives that were used in hedging
transactions were highly effective in offsetting changes in cash fl ows of hedged items. When it was determined
that a derivative was not highly effective as a hedge, the Group discontinued hedge accounting on a prospective
basis.
At 31 December 2014, the total notional amount of outstanding cross currency swap contracts to which the
Group is committed to is US$56,128,000 to purchase S$70,000,000.
In 2014, the fair value loss of the cross currency swap contracts that are designated and effective as cash
fl ow hedges amounting to US$4,153,000 was deferred in reserves. The foreign exchange gain arising from the
revaluation of the Notes (Note 25) amounting to US$2,994,000 was classifi ed in hedging reserve from profi t or
loss.
Foreign exchange forward contracts
At 31 December 2013, the total notional amount of outstanding foreign exchange forward contracts to which the
Company was committed to was EUR76,000,000 to purchase US$99,596,000.
The fair value gain of the Company’s foreign exchange forward contracts are estimated to be approximately
US$5,097,000 (2013 : fair value loss of US$4,524,000), which has been credited (charged) to profi t or loss
(Note 31) respectively.
28 SHARE CAPITAL
Group and Company
2014 2013 2014 2013
’000 ’000 US$’000 US$’000
Number of ordinary shares
Issued and paid-up:
At beginning of year 4,126,940 2,835,644 350,416 300,087
Issuance of ordinary shares pursuant to Share
Award Scheme (Note a) 30,069 10,522 1,708 718
Issuance of ordinary shares pursuant to
acquisition (Note b) 87,880 – 5,000 –
Issuance of ordinary shares pursuant to rights
issue (Note c) – 1,280,774 – 50,596
Rights issue expenses – – – (985)
At end of year 4,244,889 4,126,940 357,124 350,416
Fully paid ordinary shares, which have no par value, carry one vote per share and carry a right to dividends as
and when declared by the Company.

Ann
ual R
epor
t 201
4
|
O
tto
Mar
ine
Lim
ited
103
Notes toFinancial Statements
For the Financial year ended 31 December 2014
28 SHARE CAPITAL (cont’d)
Note a:
On 13 March, 30 April and 11 August 2014, 2,000,000, 1,383,500 and 26,685,106 new ordinary shares were respectively
issued under Otto Marine Share Award Scheme, resulting in an increase in share capital by approximately US$126,000,
US$82,000 and US$1,500,000.
On 31 May 2013, 10,521,800 new ordinary shares were issued under Otto Marine Share Award Scheme, resulting in an
increase in share capital by US$718,000.
Note b:
Pursuant to a resolution duly approved and passed at an Extraordinary General Meeting held on 4 July 2014, the Company
issued 87,880,281 new shares at US$0.057 (S$0.071) per share to Garrick James Stanley (Group Chief Executive Offi cer and
Executive Director) in consideration of the acquisition of 10% of Go Marine Group Pty Ltd, amounting to US$5,000,000. This
resulted in an increase in share capital of US$5,000,000.
Note c:
On 1 August 2013, 1,280,774,385 new ordinary shares were allotted at US$0.04 (S$0.05) per share each pursuant to the
Company’s rights issue exercise. Share issue expenses incurred for the rights issue amounting to US$985,000 were charged
against share capital.
29 CAPITAL RESERVE
Deemedcapital
contribution
US$’000
Group and Company
At 1 January 2013 and 31 December 2013 and 2014 1,546
The capital reserve represents deemed capital contribution arising from the waiver of interest on a related party
loan.
30 REVENUE
Group
2014 2013
US$’000 US$’000
Long-term construction contracts 40,442 205,741
Ship repairs, conversion and fabrication 40,690 17,094
Charter income 243,791 265,554
Finance lease income – 208
Marine seismic data acquisition income – 75
Subsea income 30,977 23,323
Total 355,900 511,995

Ann
ual R
epor
t 201
4
|
O
tto
Mar
ine
Lim
ited
104
Notes toFinancial StatementsFor the Financial year ended 31 December 2014
31 OTHER INCOME/EXPENSES
Group2014 2013
US$’000 US$’000
Other income
Net foreign exchange gain – 8,881
Interest income 938 751
Gain on disposal of property, plant and equipment 325 17,682
Gain on disposal of investment in associate and joint venture 4 235
Gain arising from the changes in the fair value of available-for-sale investment
(Note 18) 146 –
Gain arising from the changes in the fair value of foreign exchange forward
contracts (Note 27) 5,097 –
Gain on deconsolidation of subsidiary (Note 36) – 64,015
Realisation of previously deferred profi t on sale of vessels to an associate which
is disposed during the year 6,983 –
Other income 600 1,106
Total 14,093 92,670
Other expenses
Net foreign exchange loss 1,201 –
Property, plant and equipment written off – 2
Loss arising from the changes in the fair value of
interest rate swap contracts – 38
Loss arising from the changes in the fair value of
foreign exchange forward contracts (Note 27) – 4,524
Reversal of unrealised profi t for sale of vessels to an associate – 403
Other expenses 444 –
Total 1,645 4,967
32 FINANCE COSTS
Group2014 2013
US$’000 US$’000
Interest expense to related parties (Notes 6 and 22) 2,695 1,340
Interest expense to an associate (Note 6) 28 41
Interest expense to third parties:
Borrowings from fi nancial institutions 20,559 20,310
Finance leases 11,993 9,527
Loan payables 1,738 2,533
Total borrowing costs 37,013 33,751
Less: Capitalised borrowing costs in:
Inventories (3,682) (5,315)
Gross amount due from/to customers for contract work (1,972) (4,199)
Property, plant and equipment (3,473) –
27,886 24,237
Capitalised borrowing costs included in the cost of qualifying assets arose from specifi c project fi nancing.
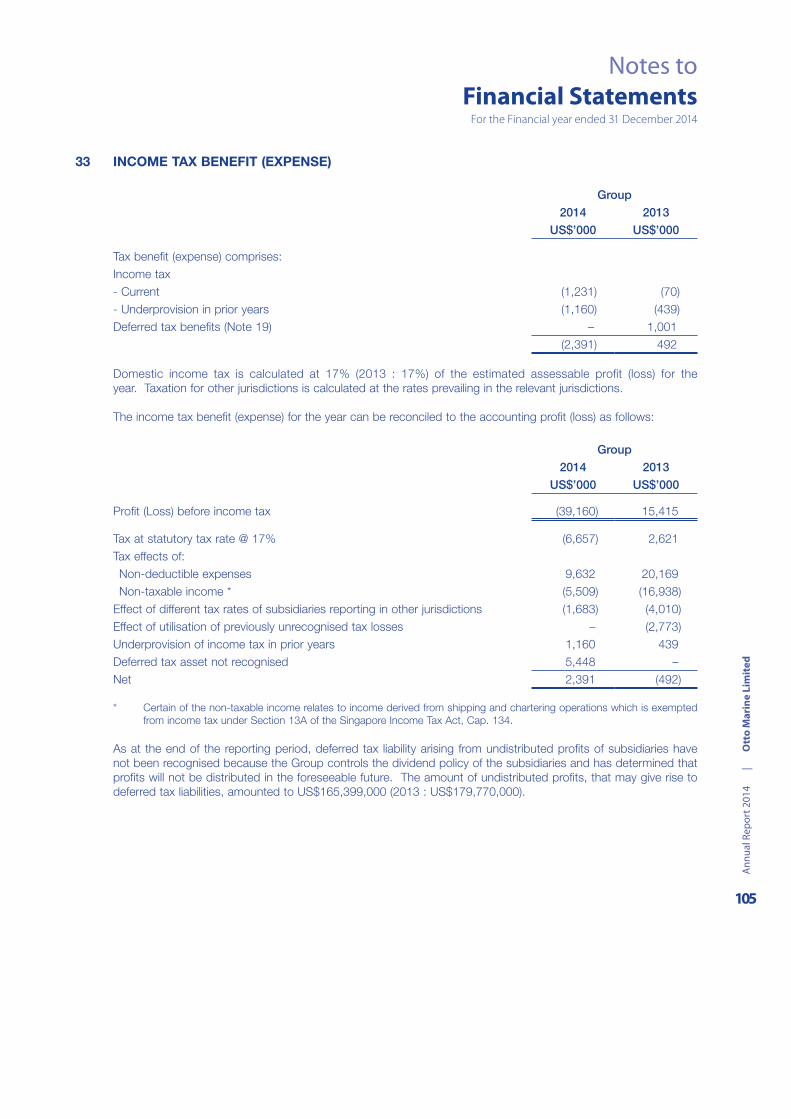
Ann
ual R
epor
t 201
4
|
O
tto
Mar
ine
Lim
ited
105
Notes toFinancial Statements
For the Financial year ended 31 December 2014
33 INCOME TAX BENEFIT (EXPENSE)
Group
2014 2013
US$’000 US$’000
Tax benefi t (expense) comprises:
Income tax
- Current (1,231) (70)
- Underprovision in prior years (1,160) (439)
Deferred tax benefi ts (Note 19) – 1,001
(2,391) 492
Domestic income tax is calculated at 17% (2013 : 17%) of the estimated assessable profi t (loss) for the
year. Taxation for other jurisdictions is calculated at the rates prevailing in the relevant jurisdictions.
The income tax benefi t (expense) for the year can be reconciled to the accounting profi t (loss) as follows:
Group
2014 2013
US$’000 US$’000
Profi t (Loss) before income tax (39,160) 15,415
Tax at statutory tax rate @ 17% (6,657) 2,621
Tax effects of:
Non-deductible expenses 9,632 20,169
Non-taxable income * (5,509) (16,938)
Effect of different tax rates of subsidiaries reporting in other jurisdictions (1,683) (4,010)
Effect of utilisation of previously unrecognised tax losses – (2,773)
Underprovision of income tax in prior years 1,160 439
Deferred tax asset not recognised 5,448 –
Net 2,391 (492)
* Certain of the non-taxable income relates to income derived from shipping and chartering operations which is exempted
from income tax under Section 13A of the Singapore Income Tax Act, Cap. 134.
As at the end of the reporting period, deferred tax liability arising from undistributed profi ts of subsidiaries have
not been recognised because the Group controls the dividend policy of the subsidiaries and has determined that
profi ts will not be distributed in the foreseeable future. The amount of undistributed profi ts, that may give rise to
deferred tax liabilities, amounted to US$165,399,000 (2013 : US$179,770,000).

Ann
ual R
epor
t 201
4
|
O
tto
Mar
ine
Lim
ited
106
Notes toFinancial StatementsFor the Financial year ended 31 December 2014
34 PROFIT (LOSS) FOR THE YEAR
Profi t (Loss) for the year has been arrived at after charging:
Group
2014 2013
US$’000 US$’000
Depreciation of property, plant and equipment:
Included in cost of sales 30,704 22,236
Included in administrative expenses 865 698
31,569 22,934
Capitalised in construction-in-progress and inventories 4,046 2,426
Total depreciation expense 35,615 25,360
Directors’ remuneration:
Directors of the Company 3,306 1,554
Directors’ fees 210 275
Employee benefi ts expense (including directors’ remuneration):
Defi ned contribution plans 6,765 9,226
Salaries and other benefi ts 82,863 89,544
Total employee benefi ts expense 89,628 98,770
Included in cost of sales 66,172 73,741
Capitalised in construction-in-progress – 4,749
Included in administrative expenses 23,456 20,280
Total 89,628 98,770
Audit fees:
Paid and payable to auditors of the Company 328 349
Paid and payable to other auditors 164 121
Non-audit fees:
Paid and payable to auditors of the Company 166 98
Paid and payable to other auditors 307 87
Allowance for doubtful receivables:
Trade receivable 897 67
Other receivable – 26,887
Loan receivable – 18,910
35 PROFIT (LOSS) PER SHARE
The calculation of the basic profi t (loss) per share is based on the loss of US$41,663,000 (2013 : profi t of
US$14,076,000) attributable to equity holders of the Company for the fi nancial years ended 31 December
2014 and 2013 over the weighted average number of ordinary shares of 4,182,423,000 (2013 : 3,676,185,000)
respectively.
There were no dilution of profi t (loss) per share for the fi nancial years ended 31 December 2014 and 2013 as
there were no potential ordinary shares outstanding.
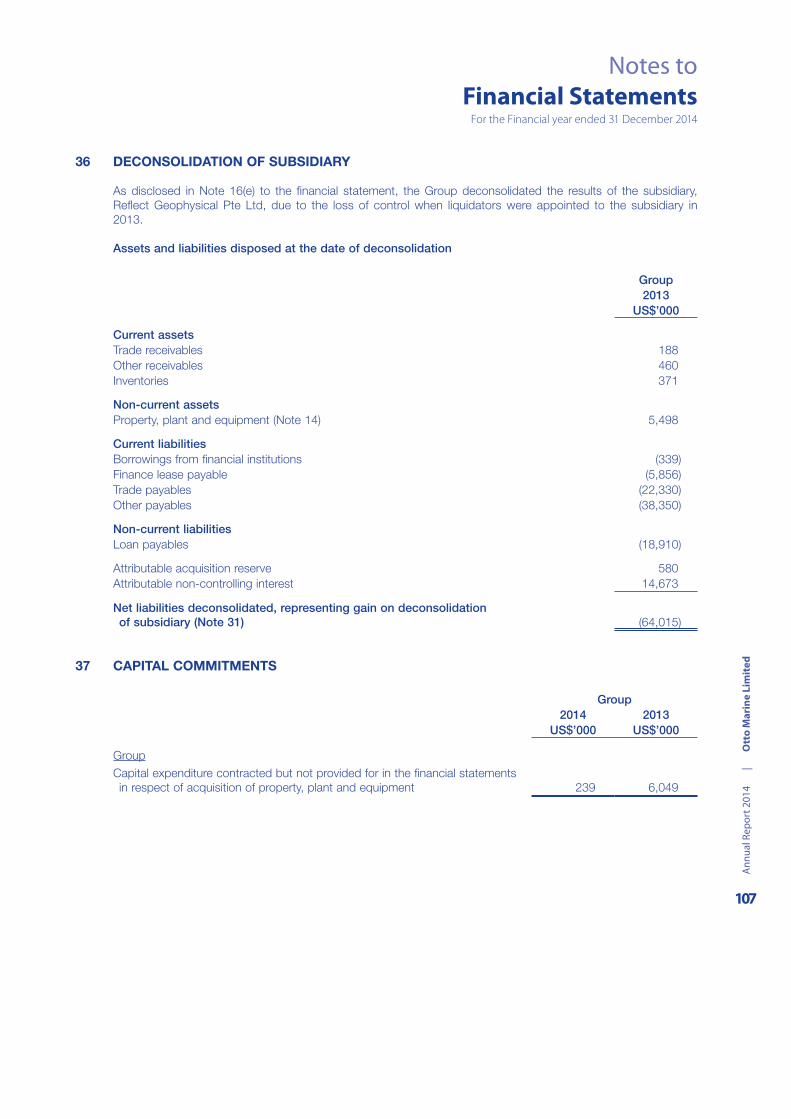
Ann
ual R
epor
t 201
4
|
O
tto
Mar
ine
Lim
ited
107
Notes toFinancial Statements
For the Financial year ended 31 December 2014
36 DECONSOLIDATION OF SUBSIDIARY
As disclosed in Note 16(e) to the fi nancial statement, the Group deconsolidated the results of the subsidiary,
Refl ect Geophysical Pte Ltd, due to the loss of control when liquidators were appointed to the subsidiary in
2013.
Assets and liabilities disposed at the date of deconsolidation
Group2013
US$’000
Current assets Trade receivables 188
Other receivables 460
Inventories 371
Non-current assetsProperty, plant and equipment (Note 14) 5,498
Current liabilitiesBorrowings from fi nancial institutions (339)
Finance lease payable (5,856)
Trade payables (22,330)
Other payables (38,350)
Non-current liabilitiesLoan payables (18,910)
Attributable acquisition reserve 580
Attributable non-controlling interest 14,673
Net liabilities deconsolidated, representing gain on deconsolidation of subsidiary (Note 31) (64,015)
37 CAPITAL COMMITMENTS
Group2014 2013
US$’000 US$’000
Group
Capital expenditure contracted but not provided for in the fi nancial statements
in respect of acquisition of property, plant and equipment 239 6,049

Ann
ual R
epor
t 201
4
|
O
tto
Mar
ine
Lim
ited
108
Notes toFinancial StatementsFor the Financial year ended 31 December 2014
38 OPERATING LEASE ARRANGEMENTS
The Group as a lessee
Group Company
2014 2013 2014 2013
US$’000 US$’000 US$’000 US$’000
Minimum lease payments under operating
leases recognised as an expense in the year 73,687 69,985 731 698
At the end of the reporting period, the Group and the Company have outstanding commitments under non-
cancellable operating leases which fall due as follows:
Group Company
2014 2013 2014 2013
US$’000 US$’000 US$’000 US$’000
Within one year 82,498 80,270 657 684
In the second to fi fth year inclusive 219,415 140,902 273 967
After fi ve years 6,003 18,778 – –
Total 307,916 239,950 930 1,651
Operating lease payments represent rentals payable by the Group for its offi ce premises, staff apartments and
vessels. Leases are negotiated and rentals are fi xed for an average of 2 years (2013 : 2 years).
The Group as a lessor
At the end of the reporting period, for those vessels on hire, the Group has contracted with charters for the
following minimum lease receipts:
Group
2014 2013
US$’000 US$’000
Within one year 114,752 69,037
In the second to fi fth year inclusive 118,281 17,522
Total 233,033 86,559
39 FINANCIAL GUARANTEES
As at 31 December 2014 and 2013, the maximum amount the Group and Company could be forced to settle
under the unsecured fi nancial guarantee contract, if the full guaranteed amount is claimed by the counterparties
to the guarantee is US$108,452,000 and US$331,792,000 (2013 : US$11,420,000 and US$341,600,000)
respectively. Based on expectations at the end of the reporting period, the Group considers that it is more
probable that no amount will be payable under the arrangement. However, this estimate is subject to change
depending on the probability of the counterparties claiming under the guarantee which is a function of the
likelihood that the fi nancial receivables held by the counterparties which are guaranteed suffer credit losses. The
earliest period that the guarantee could be called is within 1 year from the end of the reporting period.
Management is of the view that the fair value of the fi nancial guarantee provided by the Group and the Company
are not signifi cant.

Ann
ual R
epor
t 201
4
|
O
tto
Mar
ine
Lim
ited
109
Notes toFinancial Statements
For the Financial year ended 31 December 2014
40 SEGMENT INFORMATION
The Group determines and presents operating segments based on the information that is provided internally
to the Chief Executive Offi cer (“CEO”), who is the Group’s chief operating decision maker. An operating
segment is a component of the Group that engages in business activities from which it may earn revenues
and incur expenses, including revenues and expenses that relate to transactions with any of the Group’s other
components. An operating segment’s operating results are reviewed regularly by the CEO to make decisions
about resources to be allocated to the segment and assess its performance, and for which discrete fi nancial
information is available. Segment results that are reported to the CEO include items directly attributable to a
segment as well as those that can be allocated on a reasonable basis.
Operating segments
The principal activities of the Group are as follows:
Shipyard - Construction of small, medium and large offshore and other support vessels. Servicing and
conversion of wide range of vessels.
Shipping and chartering - Chartering of offshore and inshore support vessels.
Ship leasing - Finance income derived from fi nance lease receivables.
Geophysical - Acquisition of seismic data.
Subsea - Chartering of vessel for use in subsea.
a) Segment revenue and results
The accounting policies of the reportable segments are the same as the Group’s accounting policies
described in Note 2. Segment result represents the profi t earned by each segment without allocation
of other income and expenses, share of profi ts (losses) of associates and joint ventures, fi nance costs
and unallocated expenses. This is the measure reported to the chief operating decision maker for the
purposes of resource allocation and assessment of segment performance.
b) Segment assets
For the purpose of monitoring segment performance and allocating resources between segments, the
chief operating decision maker monitors the tangible, intangible and fi nancial assets attributable to each
segment.
All assets and liabilities are allocated to reportable segments other than unallocated corporate assets
and liabilities. Assets and liabilities used jointly by reportable segments are allocated on the basis of the
revenues earned by individual reportable segments.

Ann
ual R
epor
t 201
4
|
O
tto
Mar
ine
Lim
ited
110
Notes toFinancial StatementsFor the Financial year ended 31 December 2014
40 SEGMENT INFORMATION (cont’d)
Segment information for the fi nancial years ended 31 December 2014 and 2013 are as follows:
Consolidated Profi t or Loss Statement and Balance Sheet
Shipyard
Shippingand
chartering Leasing GeophysicalSubseaservices Elimination(a) Total
US$’000 US$’000 US$’000 US$’000 US$’000 US$’000 US$’000
31 December 2014
Revenue
External revenue 81,132 243,791 – – 30,977 – 355,900
Inter-segment revenue 25,098 6,277 – – – (31,375) –
Total revenue 106,230 250,068 – – 30,977 (31,375) 355,900
Cost of sales (99,270) (243,692) – – (23,652) 31,375 (335,239)
Segment results 6,960 6,376 – – 7,325 – 20,661
Other income 6,983 6,983
Unallocated other income 7,110
Other expenses (1,645)
Share of losses of associates
and joint ventures (4,386) (741) (5,127)
Finance costs (27,886)
Selling and administrative costs (39,256)
Loss before income tax (39,160)
Income tax expense (2,391)
Loss for the year (41,551)
Assets
Segment assets 278,130 776,453 – – 84,498 – 1,139,081
Investment in associates and
joint ventures 467 467
Unallocated corporate assets 73,928
Total assets 1,213,476
Liabilities
Segment liabilities 272,663 494,077 – – 33,260 – 800,000
Unallocated corporate liabilities 152,830
Total liabilities 952,830
Other information
Additions to non-current assets:
Allocated 1,240 56,389 – – 25,387 – 83,016
Unallocated 361
83,337
Depreciation 4,946 26,309 – – 4,360 – 35,615
Allowance for doubtful trade receivables – 897 – – – – 897
(a) Inter-segment revenue are eliminated upon consolidation.

Ann
ual R
epor
t 201
4
|
O
tto
Mar
ine
Lim
ited
111
Notes toFinancial Statements
For the Financial year ended 31 December 2014
40 SEGMENT INFORMATION (cont’d)
Shipyard
Shipping and
chartering Leasing GeophysicalSubseaservices Elimination(a) Total
US$’000 US$’000 US$’000 US$’000 US$’000 US$’000 US$’000
31 December 2013
Revenue
External revenue 222,835 265,554 208 75 23,323 – 511,995
Inter-segment revenue 2,154 – – – – (2,154) –
Total revenue 224,989 265,554 208 75 23,323 (2,154) 511,995
Cost of sales (213,148) (234,232) – (1,933) (18,362) 2,154 (465,521)
Segment results 11,841 31,322 208 (1,858) 4,961 – 46,474
Other income 64,015 64,015
Unallocated other income 28,655
Other expenses (4,967)
Share of losses of associates
and joint ventures (4,122) (4,122)
Finance costs (24,237)
Selling and administrative costs (45,797) (45,797)
Unallocated expenses (44,606)
Profi t before income tax 15,415
Income tax benefi t 492
Profi t for the year 15,907
Assets
Segment assets 389,212 782,911 – – 57,893 – 1,230,016
Investment in associates and
joint ventures 3,453 3,453
Unallocated corporate assets 48,237
Total assets 1,281,706
Liabilities
Segment liabilities 393,261 532,865 – – 20,153 – 946,279
Unallocated corporate liabilities 31,457
Total liabilities 977,736
Other information
Additions to non-current assets 1,047 75,394 – – 3,049 – 79,490
Depreciation 5,130 16,901 – – 3,329 – 25,360
Allowance for doubtful trade receivables – 46 – – 21 – 67
Allowance for doubtful non-trade
receivables – – – 45,797 – – 45,797
(a) Inter-segment revenue are eliminated upon consolidation.

Ann
ual R
epor
t 201
4
|
O
tto
Mar
ine
Lim
ited
112
Notes toFinancial StatementsFor the Financial year ended 31 December 2014
40 SEGMENT INFORMATION (cont’d)
Geographical segments
The Group’s business segments operate mainly in fi ve geographical areas namely Asia Pacifi c, America, Europe,
Middle East and Africa.
The revenue by geographical segments is based on location of the customers. Segment assets (non-current
assets excluding fi nance lease receivables, loan receivables, investment in associates and joint ventures,
available-for-sale investments and deferred tax assets) are based on the geographical location of the assets.
Group2014 2013
US$’000 US$’000
Revenue
Asia Pacifi c 198,808 399,329
America 63,155 29,758
Europe 60,696 35,697
Middle East 22,499 18,573
Africa 10,742 28,638
355,900 511,995
Non-current assets
Asia Pacifi c 290,719 416,171
America 107,800 57,542
Europe 120,298 531
Middle East 31,238 35,551
West Africa 35,962 50,567
586,017 560,362
Information about major customers
Shipyard segment
Included in shipyard’s revenue of US$81,132,000 (2013 : US$222,835,000) are revenues of approximately
US$27,503,000 and US$20,674,000 (2013 : US$102,114,000 and US$95,000,000) respectively which arose
from contracted sales of vessels to the Group’s two major customers.
Shipping and chartering segment
Included in shipping and chartering revenue of US$243,791,000 (2013 : US$265,554,000) is revenue of
approximately US$31,112,000 (2013 : US$25,480,000) which arose from contracted charter hire to one of the
Group’s customers.
41 DIVIDENDS
For the fi nancial year ended 31 December 2013, the directors proposed that a dividend of 0.1 Singapore cents
per ordinary share totalling approximately S$4,100,000 (equivalent to US$3,294,000) to be paid to shareholders.
This dividend has not been included as a liability in these fi nancial statements as at 31 December 2013 as it was
approved by shareholders subsequently at the Annual General Meeting on 30 April 2014. The dividend was paid
in June 2014.
42 CONTINGENT LIABILITY
As at the end of the reporting period, the associated costs and revenue relating to additional work performed on
a contract cannot be reliably measured. As a result, these have not been recognised in the fi nancial statements.

Ann
ual R
epor
t 201
4
|
O
tto
Mar
ine
Lim
ited
113
Statistics ofShareholdings
As at 17 March 2015
Total number of issued shares : 4,244,888,572 ordinary shares
Class of shares : Ordinary shares
Voting rights : One vote per ordinary share
Total number of treasury shares : Nil
DISTRIBUTION OF SHAREHOLDINGS AS AT 17 MARCH 2015
Size of Shareholdings No. of Shareholders % No. of Shares %
1 – 99 331 4.67 4,844 0.00
100 – 1,000 313 4.41 272,887 0.01
1,001 – 10,000 999 14.09 7,091,414 0.16
10,001 – 1,000,000 5,326 75.12 618,480,489 14.57
1,000,001 and above 121 1.71 3,619,038,938 85.26
Total 7,090 100.00 4,244,888,572 100.00
TWENTY LARGEST SHAREHOLDERS AS AT 17 MARCH 2015
No. Name of Shareholders No. of Shares %
1. Raffl es Nominees (Pte) Ltd 1,391,149,655 32.77
2. RHB Securities Singapore Pte Ltd 714,474,600 16.83
3. RHB Bank Nominees Pte Ltd 513,572,600 12.10
4. United Overseas Bank Nominees Pte Ltd 136,228,507 3.21
5. DBS Nominees Pte Ltd 119,933,040 2.83
6. Stanley Garrick James 94,928,920 2.24
7. Phillip Securities Pte Ltd 79,790,050 1.88
8. CEO Technology Asia Limited 74,865,175 1.76
9. OCBC Securities Private Ltd 46,358,185 1.09
10. Joseph Lau 36,500,000 0.86
11. Mercal Corporation (S) Pte Ltd 25,600,000 0.60
12. Maybank Kim Eng Securities Pte Ltd 24,357,850 0.57
13. See Kian Heng 24,257,170 0.57
14. UOB Kay Hian Pte Ltd 21,266,100 0.50
15. Citibank Nominees Singapore Pte Ltd 20,155,539 0.47
16. Ang Ah Kim 14,000,000 0.33
17. Loo Siew Lan 12,546,000 0.30
18. Bank of Singapore Nominees Pte Ltd 11,851,000 0.28
19. Lim & Tan Securities Pte Ltd 10,863,100 0.26
20. OCBC Nominees Singapore Pte Ltd 8,885,575 0.21
Total 3,381,583,066 79.66
PUBLIC SHAREHOLDERS
Based on the register of Directors’ shareholdings and register of Substantial Shareholders maintained by the Company
as at 17 March 2015, there were approximately 1,513,252,050 ordinary shares, representing 35.65% of the Company’s
total number of issued ordinary shares (excluding preference shares, convertible equity securities and treasury shares),
are held in the hands of the public and therefore, Rule 723 of the Listing Manual of Singapore Exchange Securities
Trading Limited is complied with.

Ann
ual R
epor
t 201
4
|
O
tto
Mar
ine
Lim
ited
114
Statistics ofShareholdingsAs at 17 March 2015
INTERESTS OF DIRECTORS AND SUBSTANTIAL SHAREHOLDERS
As at 17 March 2015, the direct interests and deemed interests of the Directors and the Substantial Shareholders of the
Comp any were as follows:
Directors
Direct Interests Deemed Interests Total Interests
No. of Shares % No. of Shares % No. of Shares %
Yaw Chee Siew 10,796,700 0.25 2,598,410,375(i)(ii) 61.21 2,609,207,075 61.46
Garrick James Stanley 94,928,920 2.24 – – 94,928,920 2.24
Michael See Kian Heng 24,257,170 0.57 2,000(iii) 0.00 24,259,170 0.57
Heng Hock Cheng @
Heng Heyok Chiang 727,700 0.02 – – 727,700 0.02
Ng Quek Peng 593,270 0.01 – – 593,270 0.01
Craig Foster Pickett 550,740 0.01 – – 550,740 0.01
Chin Yoong Kheong – – – – – –
Substantial Shareholders
Direct Interests Deemed Interests Total Interests
No. of Shares % No. of Shares % No. of Shares %
CEO Technology Asia Limited 74,865,175 1.76 – – 74,865,175 1.76
Business Companion
Investments Limited 2,523,545,200 59.45 – – 2,523,545,200 59.45
Yaw Chee Siew 10,796,700 0.25 2,598,410,375(i)(ii) 61.21 2,609,207,075 61.46
Notes
(i) CEO Technology Asia Limited (“CEOTA”) owns 74,865,175 ordinary shares in the Company and Mr Yaw Chee Siew is deemed
to have interest in shares held by CEOTA.
(ii) Raffl es Nominees (Pte) Ltd (1,296,400,000 shares), RHB Securities Singapore Pte Ltd (713,572,600 shares) and RHB Bank
Nominees Pte Ltd (513,572,600 shares) are bare trustees for Business Companion Investments Limited (“BCI”). Mr Yaw Chee
Siew is deemed to have interest in shares held by BCI.
(iii) Mr Michael See Kian Heng is deemed to have an interest in the shares held by his spouse.
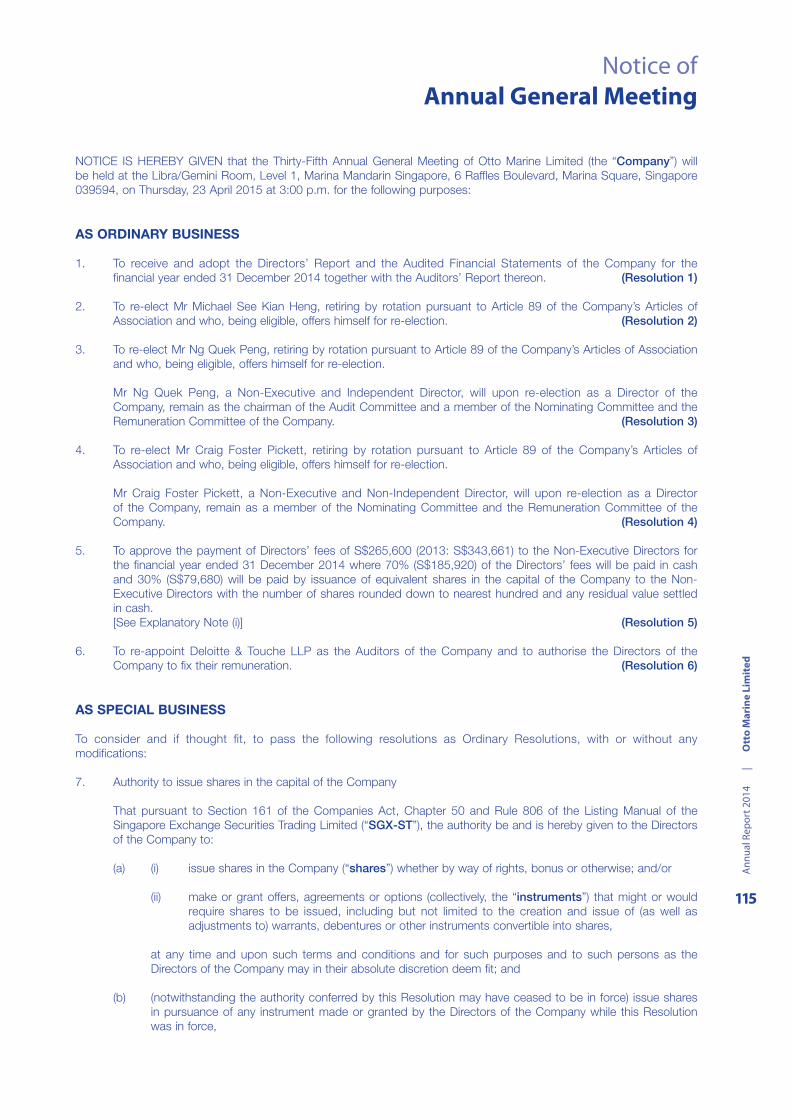
Ann
ual R
epor
t 201
4
|
O
tto
Mar
ine
Lim
ited
115
Notice ofAnnual General Meeting
NOTICE IS HEREBY GIVEN that the Thirty-Fifth Annual General Meeting of Otto Marine Limited (the “Company”) will
be held at the Libra/Gemini Room, Level 1, Marina Mandarin Singapore, 6 Raffl es Boulevard, Marina Square, Singapore
039594, on Thursday, 23 April 2015 at 3:00 p.m. for the following purposes:
AS ORDINARY BUSINESS
1. To receive and adopt the Directors’ Report and the Audited Financial Statements of the Company for the
fi nancial year ended 31 December 2014 together with the Auditors’ Report thereon. (Resolution 1)
2. To re-elect Mr Michael See Kian Heng, retiring by rotation pursuant to Article 89 of the Company’s Articles of
Association and who, being eligible, offers himself for re-election. (Resolution 2)
3. To re-elect Mr Ng Quek Peng, retiring by rotation pursuant to Article 89 of the Company’s Articles of Association
and who, being eligible, offers himself for re-election.
Mr Ng Quek Peng, a Non-Executive and Independent Director, will upon re-election as a Director of the
Company, remain as the chairman of the Audit Committee and a member of the Nominating Committee and the
Remuneration Committee of the Company. (Resolution 3)
4. To re-elect Mr Craig Foster Pickett, retiring by rotation pursuant to Article 89 of the Company’s Articles of
Association and who, being eligible, offers himself for re-election.
Mr Craig Foster Pickett, a Non-Executive and Non-Independent Director, will upon re-election as a Director
of the Company, remain as a member of the Nominating Committee and the Remuneration Committee of the
Company. (Resolution 4)
5. To approve the payment of Directors’ fees of S$265,600 (2013: S$343,661) to the Non-Executive Directors for
the fi nancial year ended 31 December 2014 where 70% (S$185,920) of the Directors’ fees will be paid in cash
and 30% (S$79,680) will be paid by issuance of equivalent shares in the capital of the Company to the Non-
Executive Directors with the number of shares rounded down to nearest hundred and any residual value settled
in cash.
[See Explanatory Note (i)] (Resolution 5)
6. To re-appoint Deloitte & Touche LLP as the Auditors of the Company and to authorise the Directors of the
Company to fi x their remuneration. (Resolution 6)
AS SPECIAL BUSINESS
To consider and if thought fi t, to pass the following resolutions as Ordinary Resolutions, with or without any
modifi cations:
7. Authority to issue shares in the capital of the Company
That pursuant to Section 161 of the Companies Act, Chapter 50 and Rule 806 of the Listing Manual of the
Singapore Exchange Securities Trading Limited (“SGX-ST”), the authority be and is hereby given to the Directors
of the Company to:
(a) (i) issue shares in the Company (“shares”) whether by way of rights, bonus or otherwise; and/or
(ii) make or grant offers, agreements or options (collectively, the “instruments”) that might or would
require shares to be issued, including but not limited to the creation and issue of (as well as
adjustments to) warrants, debentures or other instruments convertible into shares,
at any time and upon such terms and conditions and for such purposes and to such persons as the
Directors of the Company may in their absolute discretion deem fi t; and
(b) (notwithstanding the authority conferred by this Resolution may have ceased to be in force) issue shares
in pursuance of any instrument made or granted by the Directors of the Company while this Resolution
was in force,
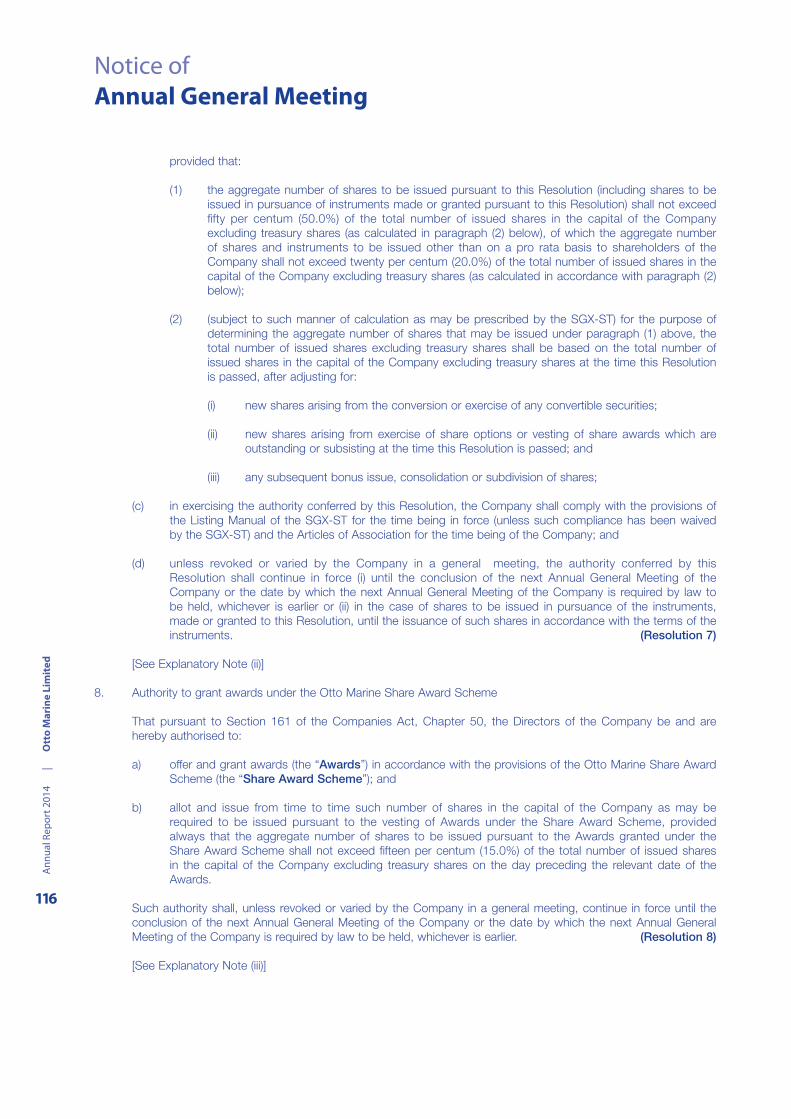
Ann
ual R
epor
t 201
4
|
O
tto
Mar
ine
Lim
ited
116
Notice ofAnnual General Meeting
provided that:
(1) the aggregate number of shares to be issued pursuant to this Resolution (including shares to be
issued in pursuance of instruments made or granted pursuant to this Resolution) shall not exceed
fi fty per centum (50.0%) of the total number of issued shares in the capital of the Company
excluding treasury shares (as calculated in paragraph (2) below), of which the aggregate number
of shares and instruments to be issued other than on a pro rata basis to shareholders of the
Company shall not exceed twenty per centum (20.0%) of the total number of issued shares in the
capital of the Company excluding treasury shares (as calculated in accordance with paragraph (2)
below);
(2) (subject to such manner of calculation as may be prescribed by the SGX-ST) for the purpose of
determining the aggregate number of shares that may be issued under paragraph (1) above, the
total number of issued shares excluding treasury shares shall be based on the total number of
issued shares in the capital of the Company excluding treasury shares at the time this Resolution
is passed, after adjusting for:
(i) new shares arising from the conversion or exercise of any convertible securities;
(ii) new shares arising from exercise of share options or vesting of share awards which are
outstanding or subsisting at the time this Resolution is passed; and
(iii) any subsequent bonus issue, consolidation or subdivision of shares;
(c) in exercising the authority conferred by this Resolution, the Company shall comply with the provisions of
the Listing Manual of the SGX-ST for the time being in force (unless such compliance has been waived
by the SGX-ST) and the Articles of Association for the time being of the Company; and
(d) unless revoked or varied by the Company in a general meeting, the authority conferred by this
Resolution shall continue in force (i) until the conclusion of the next Annual General Meeting of the
Company or the date by which the next Annual General Meeting of the Company is required by law to
be held, whichever is earlier or (ii) in the case of shares to be issued in pursuance of the instruments,
made or granted to this Resolution, until the issuance of such shares in accordance with the terms of the
instruments. (Resolution 7)
[See Explanatory Note (ii)]
8. Authority to grant awards under the Otto Marine Share Award Scheme
That pursuant to Section 161 of the Companies Act, Chapter 50, the Directors of the Company be and are
hereby authorised to:
a) offer and grant awards (the “Awards”) in accordance with the provisions of the Otto Marine Share Award
Scheme (the “Share Award Scheme”); and
b) allot and issue from time to time such number of shares in the capital of the Company as may be
required to be issued pursuant to the vesting of Awards under the Share Award Scheme, provided
always that the aggregate number of shares to be issued pursuant to the Awards granted under the
Share Award Scheme shall not exceed fi fteen per centum (15.0%) of the total number of issued shares
in the capital of the Company excluding treasury shares on the day preceding the relevant date of the
Awards.
Such authority shall, unless revoked or varied by the Company in a general meeting, continue in force until the
conclusion of the next Annual General Meeting of the Company or the date by which the next Annual General
Meeting of the Company is required by law to be held, whichever is earlier. (Resolution 8)
[See Explanatory Note (iii)]
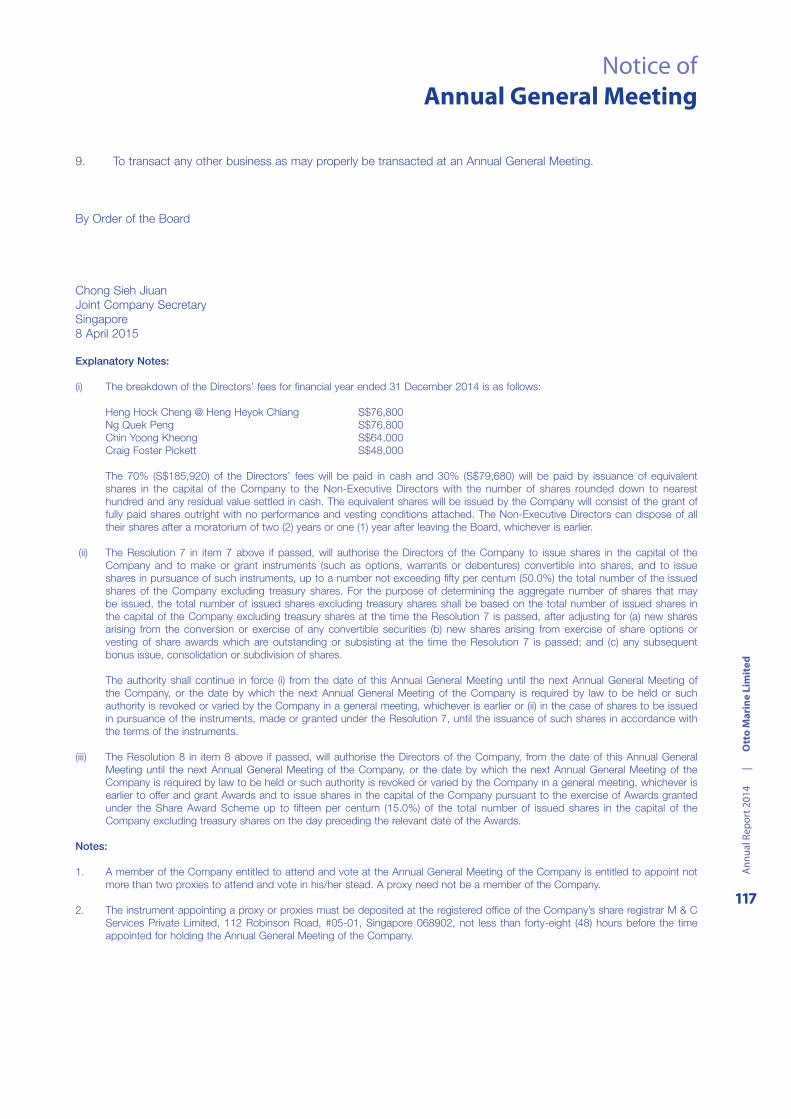
Ann
ual R
epor
t 201
4
|
O
tto
Mar
ine
Lim
ited
117
Notice ofAnnual General Meeting
9. To transact any other business as may properly be transacted at an Annual General Meeting.
By Order of the Board
Chong Sieh Jiuan
Joint Company Secretary
Singapore
8 April 2015
Explanatory Notes:
(i) The breakdown of the Directors’ fees for fi nancial year ended 31 December 2014 is as follows:
Heng Hock Cheng @ Heng Heyok Chiang S$76,800
Ng Quek Peng S$76,80 0
Chin Yoong Kheong S$64,000
Craig Foster Pickett S$48,000
The 70% (S$185,920) of the Directors’ fees will be paid in cash and 30% (S$79,680) will be paid by issuance of equivalent
shares in the capital of the Company to the Non-Executive Directors with the number of shares rounded down to nearest
hundred and any residual value settled in cash. The equivalent shares will be issued by the Company will consist of the grant of
fully paid shares outright with no performance and vesting conditions attached. The Non-Executive Directors can dispose of all
their shares after a moratorium of two (2) years or one (1) year after leaving the Board, whichever is earlier.
(ii) The Resolution 7 in item 7 above if passed, will authorise the Directors of the Company to issue shares in the capital of the
Company and to make or grant instruments (such as options, warrants or debentures) convertible into shares, and to issue
shares in pursuance of such instruments, up to a number not exceeding fi fty per centum (50.0%) the total number of the issued
shares of the Company excluding treasury shares. For the purpose of determining the aggregate number of shares that may
be issued, the total number of issued shares excluding treasury shares shall be based on the total number of issued shares in
the capital of the Company excluding treasury shares at the time the Resolution 7 is passed, after adjusting for (a) new shares
arising from the conversion or exercise of any convertible securities (b) new shares arising from exercise of share options or
vesting of share awards which are outstanding or subsisting at the time the Resolution 7 is passed; and (c) any subsequent
bonus issue, consolidation or subdivision of shares.
The authority shall continue in force (i) from the date of this Annual General Meeting until the next Annual General Meeting of
the Company, or the date by which the next Annual General Meeting of the Company is required by law to be held or such
authority is revoked or varied by the Company in a general meeting, whichever is earlier or (ii) in the case of shares to be issued
in pursuance of the instruments, made or granted under the Resolution 7, until the issuance of such shares in accordance with
the terms of the instruments.
(iii) The Resolution 8 in item 8 above if passed, will authorise the Directors of the Company, from the date of this Annual General
Meeting until the next Annual General Meeting of the Company, or the date by which the next Annual General Meeting of the
Company is required by law to be held or such authority is revoked or varied by the Company in a general meeting, whichever is
earlier to offer and grant Awards and to issue shares in the capital of the Company pursuant to the exercise of Awards granted
under the Share Award Scheme up to fi fteen per centum (15.0%) of the total number of issued shares in the capital of the
Company excluding treasury shares on the day preceding the relevant date of the Awards.
Notes:
1. A member of the Company entitled to attend and vote at the Annual General Meeting of the Company is entitled to appoint not
more than two proxies to attend and vote in his/her stead. A proxy need not be a member of the Company.
2. The instrument appointing a proxy or proxies must be deposited at the registered offi ce of the Company’s share registrar M & C
Services Private Limited, 112 Robinson Road, #05-01, Singapore 068902, not less than forty-eight (48) hours before the time
appointed for holding the Annual General Meeting of the Company.

Ann
ual R
epor
t 201
4
|
O
tto
Mar
ine
Lim
ited
118
Notice ofAnnual General Meeting
Personal Data Privacy
Where a member of the Company submits an instrument appointing a proxy(ies) and/or representative(s) to attend, speak and vote at
the Annual General Meeting of the Company and/or any adjournment thereof, a member of the Company (i) consents to the collection,
use and disclosure of the member’s personal data by the Company (or its agents) for the purpose of the processing and administration
by the Company (or its agents) of proxies and representatives appointed for the Annual General Meeting of the Company (including any
adjournment thereof) and the preparation and compilation of the attendance lists, proxy lists, minutes and other documents relating
to the Annual General Meeting of the Company (including any adjournment thereof), and in order for the Company (or its agents) to
comply with any applicable laws, listing rules, regulations and/or guidelines (collectively, the “Purposes”), (ii) warrants that where the
member discloses the personal data of the member’s proxy(ies) and/or representative(s) to the Company (or its agents), the member
has obtained the prior consent of such proxy(ies) and/or representative(s) for the collection, use and disclosure by the Company (or its
agents) of the personal data of such proxy(ies) and/or representative(s) for the Purposes, and (iii) agrees that the member will indemnify
the Company in respect of any penalties, liabilities, claims, demands, losses and damages as a result of the member’s breach of
warranty.
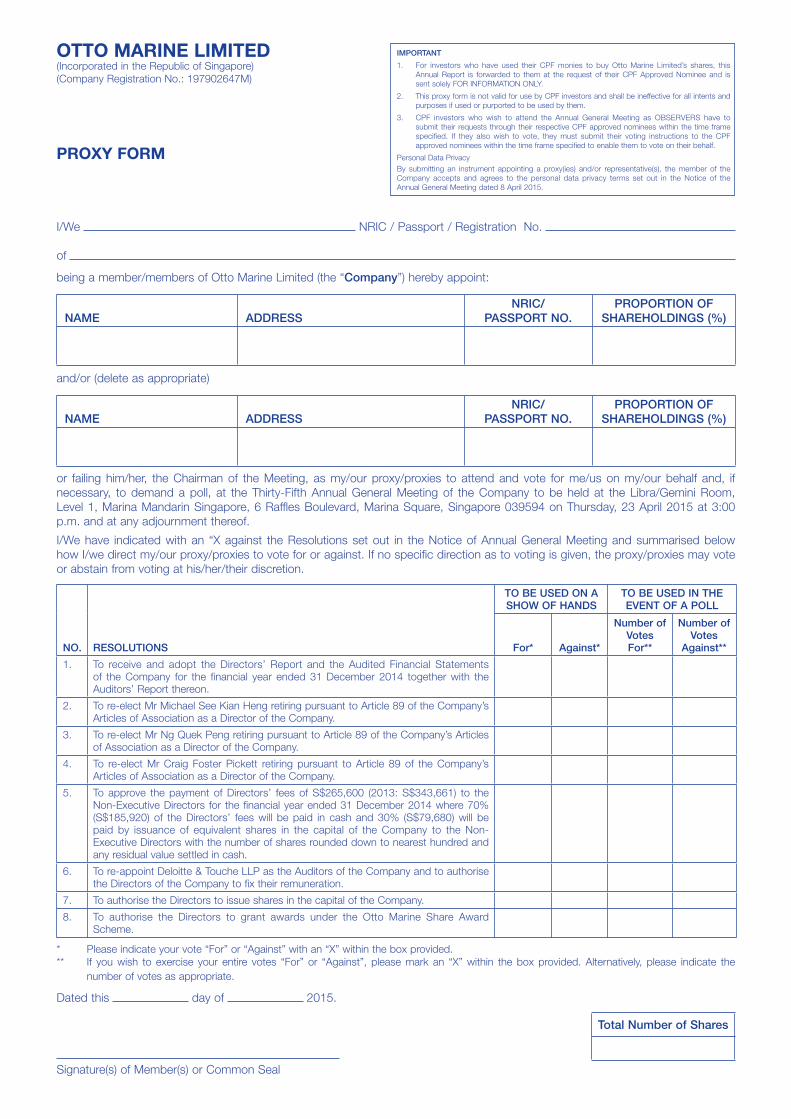
OTTO MARINE LIMITED(Incorporated in the Republic of Singapore)
(Company Registration No.: 197902647M)
PROXY FORM
I/We NRIC / Passport / Registration No.
of
being a member/members of Otto Marine Limited (the “Company”) hereby appoint:
NAME ADDRESSNRIC/
PASSPORT NO.PROPORTION OF
SHAREHOLDINGS (%)
and/or (delete as appropriate)
NAME ADDRESSNRIC/
PASSPORT NO.PROPORTION OF
SHAREHOLDINGS (%)
or failing him/her, the Chairman of the Meeting, as my/our proxy/proxies to attend and vote for me/us on my/our behalf and, if
necessary, to demand a poll, at the Thirty-Fifth Annual General Meeting of the Company to be held at the Libra/Gemini Room,
Level 1, Marina Mandarin Singapore, 6 Raffl es Boulevard, Marina Square, Singapore 039594 on Thursday, 23 April 2015 at 3:00
p.m. and at any adjournment thereof.
I/We have indicated with an “X against the Resolutions set out in the Notice of Annual General Meeting and summarised below
how I/we direct my/our proxy/proxies to vote for or against. If no specifi c direction as to voting is given, the proxy/proxies may vote
or abstain from voting at his/her/their discretion.
NO. RESOLUTIONS
TO BE USED ON A SHOW OF HANDS
TO BE USED IN THEEVENT OF A POLL
For* Against*
Number of VotesFor**
Number ofVotes
Against**
1. To receive and adopt the Directors’ Report and the Audited Financial Statements
of the Company for the fi nancial year ended 31 December 2014 together with the
Auditors’ Report thereon.
2. To re-elect Mr Michael See Kian Heng retiring pursuant to Article 89 of the Company’s
Articles of Association as a Director of the Company.
3. To re-elect Mr Ng Quek Peng retiring pursuant to Article 89 of the Company’s Articles
of Association as a Director of the Company.
4. To re-elect Mr Craig Foster Pickett retiring pursuant to Article 89 of the Company’s
Articles of Association as a Director of the Company.
5. To approve the payment of Directors’ fees of S$265,600 (2013: S$343,661) to the
Non-Executive Directors for the fi nancial year ended 31 December 2014 where 70%
(S$185,920) of the Directors’ fees will be paid in cash and 30% (S$79,680) will be
paid by issuance of equivalent shares in the capital of the Company to the Non-
Executive Directors with the number of shares rounded down to nearest hundred and
any residual value settled in cash.
6. To re-appoint Deloitte & Touche LLP as the Auditors of the Company and to authorise
the Directors of the Company to fi x their remuneration.
7. To authorise the Directors to issue shares in the capital of the Company.
8. To authorise the Directors to grant awards under the Otto Marine Share Award
Scheme.
* Please indicate your vote “For” or “Against” with an “X” within the box provided.
** If you wish to exercise your entire votes “For” or “Against”, please mark an “X” within the box provided. Alternatively, please indicate the
number of votes as appropriate.
Dated this day of 2015.
Signature(s) of Member(s) or Common Seal
Total Number of Shares
IMPORTANT
1. For investors who have used their CPF monies to buy Otto Marine Limited’s shares, this
Annual Report is forwarded to them at the request of their CPF Approved Nominee and is
sent solely FOR INFORMATION ONLY.
2. This proxy form is not valid for use by CPF investors and shall be ineffective for all intents and
purposes if used or purported to be used by them.
3. CPF investors who wish to attend the Annual General Meeting as OBSERVERS have to
submit their requests through their respective CPF approved nominees within the time frame
specifi ed. If they also wish to vote, they must submit their voting instructions to the CPF
approved nominees within the time frame specifi ed to enable them to vote on their behalf.
Personal Data Privacy
By submitting an instrument appointing a proxy(ies) and/or representative(s), the member of the
Company accepts and agrees to the personal data privacy terms set out in the Notice of the
Annual General Meeting dated 8 April 2015.

Important: Please read notes below
NOTES:
1. Please insert the total number of shares held by you. If you have shares entered against your name in the Depository Register (as defi ned in
Section 130A of the Companies Act, Chapter 50 of Singapore), you should insert that number of shares.
If you have shares registered in your name in the Register of Members, you should insert that number of shares. If you have shares entered
against your name in the Depository Register and shares registered in your name in the Register of Members, you should insert the
aggregate number of shares entered against your name in the Depository Register and registered in your name in the Register of Members.
If no number is inserted, the instrument appointing a proxy or proxies shall be deemed to relate to all the shares held by you.
2. A member of the Company entitled to attend and vote at the Annual General Meeting of the Company is entitled to appoint not more than
two proxies to attend and vote in his/her stead. A proxy need not be a member of the Company.
3. Where a member appoints two proxies, he/she shall specify the proportion of his/her shareholding (expressed as a percentage of the whole)
to be represented by each proxy. If the proportion of shareholding is not specifi ed, the Company shall be entitled to treat the fi rst named
proxy as representing the entire number of shares entered against his/her name in the Depository Register and the entire number of shares
registered in his/her name in the Register of Members, and any second named proxy as an alternate to the fi rst named proxy.
4. A corporation which is a member of the Company may appoint an authorised representative or representatives in accordance with Section
179 of the Companies Act, Chapter 50 of Singapore to attend and vote for and on behalf of such corporation.
First fold
Second fold
OTTO MARINE LIMITED C/o Share Registrar
M&C Services Private Limited
112 Robinson Road
#05-01
Singapore 068902
5. The instrument appointing a proxy or proxies must be under the hand of the appointor or of his attorney duly authorised in writing. Where
the instrument appointing a proxy or proxies is executed by a corporation, it must be executed either under its common seal or signed on its
behalf by an offi cer or attorney duly authorised in writing.
6. Where an instrument appointing a proxy or proxies is signed on behalf of the appointor by the attorney, the letter or power of attorney or a
duly certifi ed copy thereof must (failing previous registration with the Company) be lodged with the instrument appointing proxy or proxies,
failing which the instrument appointing proxy or proxies may be treated as invalid.
7. The instrument appointing a proxy or proxies must be deposited at the registered offi ce of the Company’s share registrar M & C Services
Private Limited, 112 Robinson Road, #05-01, Singapore 068902, not less than forty-eight (48) hours before the time appointed for holding
the Annual General Meeting of the Company.
General:
The Company shall be entitled to reject the instrument appointing a proxy or proxies if it is incomplete, improperly completed or illegible or where
the true intentions of the appointor are not ascertainable from the instructions of the appointor specifi ed in the instrument appointing a proxy or
proxies. In addition, in the case of members whose shares are deposited with Depository Register maintained by The Central Depository (Pte)
Limited, the Company may reject any instrument appointing a proxy or proxies lodged if the member, being the appointor, is not shown to have
shares entered against his/her name in the Depository Register as at forty-eight (48) hours before the time appointed for holding the Annual
General Meeting of the Company, as certifi ed by The Central Depository (Pte) Limited to the Company.
Personal Data Privacy:
By submitting an instrument appointing a proxy(ies) and/or representative(s), the member of the Company accepts and agrees to the personal data
privacy terms set out in the Notice of Annual General Meeting dated 8 April 2015.
Please
affi x
postage
stamp

CorporateInformation
BOARD OF DiRECTORS
Yaw Chee SiewExecutive Chairman
Garrick James StanleyExecutive Director & Group Chief Executive Officer
Michael See Kian HengGroup Executive Director
Heng Hock Cheng @ Heng Heyok ChiangNon-Executive Director & Lead Independent Director
Ng Quek PengNon-Executive Director & Independent Director
Chin Yoong Kheong (wef 1 January 2014)
Non-Executive Director & Independent Director
Craig Foster PickettNon-Executive Director & Non-Independent Director
AUDiT COMMiTTEE
Ng Quek Peng (Chairman)Heng Hock Cheng @ Heng Heyok ChiangChin Yoong Kheong (wef 1 January 2014)
NOMiNATiNG COMMiTTEE
Heng Hock Cheng @ Heng Heyok Chiang (Chairman)Ng Quek Peng Chin Yoong Kheong (wef 1 January 2014)
Craig Foster Pickett
REMUNERATiON COMMiTTEE
Heng Hock Cheng @ Heng Heyok Chiang (Chairman)Ng Quek Peng Chin Yoong Kheong (wef 1 January 2014)
Craig Foster Pickett
JOiNT COMPANY SECRETARiES
Chong Sieh Jiuan (wef 17 March 2014)
Noraini Latiff (wef 17 March 2014)
REGiSTERED OFFiCE AND PRiNCiPAL PLACE OF BUSiNESS
9 Temasek Boulevard#33-01 Suntec Tower 2Singapore 038989Tel: +65 6863 2366Fax: +65 6238 6848
COMPANY REGiSTRATiON NUMBER
197902647M
SHARE REGiSTRAR AND SHARE TRANSFER AGENT
M&C Services Private Limited112 Robinson Road #05-01Singapore 068902
iNDEPENDENT AUDiTORS
Deloitte & Touche LLP6 Shenton Way#33-00 OUE Downtown 2Singapore 068809Partner-in-charge: Tay Hwee Ling(Since Financial Year Ended 31 December 2013)
LEGAL ADViSER
Duane Morris & Selvam LLP16 Collyer Quay #17-00Income At RafflesSingapore 049318
PRiNCiPAL BANKERS
Oversea-Chinese Banking Corporation Limited BankPT Bank Mandiri (Persero) TbkUnited Overseas Bank LimitedRHB Bank BerhadMaybank BerhadStandard Chartered BankThe HongKong & Shanghai Banking Corporation
iNVESTOR RELATiONS
Michael See Kian Heng (email: [email protected])Romil Singh (email: [email protected])
CORPORATE WEBSiTE
www.ottomarine.com

9 Temasek Boulevard#33-01 Suntec Tower Two
Singapore 038989Tel +65 6863 2366 Fax +65 6238 6848
www.ottomarine.com