regarding water reclamation facility isclt dispersion ... · water reclamation facility isclt...
TRANSCRIPT

III1IIIIIIIIIIIIIII
/.
WATER RECLAMATION FACILITYISCLT DISPERSION MODELING
AND FATE EVALUATIONFOR VOC CONTAMINATION
ALCOA-DAVENPORT WORKSRIVERDALE, IOWA
Submitted to:
Aluminum Company of AmericaDavenport WorksRiverdale, Iowa
March 1992
Submitted by:
GERAGHTY & MILLER, INCEnvironmental Services6209 Riverside DriveDublin, Ohio 43017
(614) 764-2310

ALUMINUM COMPANY OF AMERICAP.O. BOX 3567
PAVENPORT, IOWA 52808 ALCOA
(319) 359-2000
March 27, 1992
James Colbert , . ir \jSuperfund BranchUSEPA Region VII ^AR 3 Q726 Minnesota Ave.Kansas City, Kansas 66101 gEM
Dear Jim:
Enclosed for your information are three copies of the report "Water Reclamation Facility ISCLTDispersion Modeling and Fate Evaluation for VOC Contamination, Alcoa-Davenport Works,Riverdale, Iowa" dated March, 1992.
7The issue of VOCs in our well water system was an agei-.da item in our November 21, 1991, meetingin Kansas City. In that meeting, we discussed the fact that VOCs in the bed rock aquifer are beingremoved by our process water wells. The VOCs are transported through the plant mill water systemand are partially volatilized at the water reclamation system as discussed in the enclosed report.However, removal is not complete and residual VOCs are discharged in our NPDES permittedoutfalls. This carry-through occasionally causes NPDES permit excursions.
Because the VOCs are impacting NPDES program compliance, EPA agreed in the November 21,1991, meeting that resolution of this problem could be addressed under the Iowa Department ofNatural Resources' (IDNR) NPDES authority instead of including it as a CERCLA Consent Orderitem. Based on that agreement, we are working with IDNR on development of a treatment system forremoving VOCs from the well water. An engineering report received from Geraghty & Miller wassubmitted to Darrel McAllister, IDNR, on March 9, 1992, and we will be meeting with them in thenear future to discuss the proposal in detail. A system will be installed according to a schedule yet tobe worked out with IDNR.
You asked in the November meeting to be kept apprised of our activities even though IDNR will bethe lead regulatory agency for this project. This letter should provide you with an update as to thestatus to date. I will keep you advised as we finalize an agreement with IDNR. In the meantime, ifyou have any questions, please do not hesitate to call.
Yours truly,
Marshall SonksenSr. Staff Envir. Engr.
cc: G.O. PrattT.P. Andersen, Geraghty & Miller

IIIIII
IIII
I
I
I
I
I
I
WATER RECLAMATION FACILITYISCLT DISPERSION MODELING
AND FATE EVALUATIONFOR VOC CONTAMINATION
ALCOA-DAVENPORT WORKSRIVERDALE, IOWA
March 1992
Geraghty & Miller, Inc. is submitting this report to Aluminum Company of America
for work performed at the Davenport Works. The report was prepared in conformance with
Geraghty & Miller's strict quality assurance/quality control procedures to ensure that the
report meets the highest standards in terms of the methods used and the information
presented. If you have any questions or comments concerning this report, please contact
one of the individuals listed below.
Respectfully submitted,
GERAGHTY & MILLER, INC.
abertProject Engineer/Air Quality Group
Thomas P. AndersonProject Scientist/Project Manager
GERAGHTY & MILLER, INC.

IIIIIIIiiiiiiiiiiii
TABLE OF CONTENTS
Page
1.0 INTRODUCTION 1
2.0 WATER RECLAMATION FACILITY DESCRIPTION 3
3.0 SAMPLING METHODOLOGY 4
4.0 ANALYTICAL RESULTS AND CONTAMINANT FATE EVALUATION ... 6
5.0 AIR MODELING AND RISK EVALUATION 85.1 AIR MODELING METHODOLOGY 85.2 AIR MODELING RESULTS 105.3 RISK EVALUATION 12
6.0 PRINCIPLE FINDINGS 15
7.0 REFERENCES 17
LIST OF FIGURES
FIGURE
1
2
3
4
5
TITLE
Water Reclamation Facility Site Map.
Mill Water and Water Reclamation Facility Flow Diagram.
Average Total VOC Mass Balance Flow Diagram.
Windrose.
General Isopleths and Facility Perimeter Receptors.
LIST OF TABLES
TABLE
1
TITLE
Summary Table of Analytical Results from Water Quality Sampling,Mill Water System and Water Reclamation Facility.
11
GERAGHTY & MILLER, INC.

I•
I
I
I
TABLE OF CONTENTS(Continued)
LIST OF TABLES(Continued)
* TABLE TITLE
I 2 Summary Table of VOC Mass-Per-Year Calculations.
_ 3 Mass Balance Analysis of Contaminants in the Mill Water and WaterI Reclamation Facility, Two Sceneries.
M 4 Volatile Organic Compound Analytical Data for Sample Point S7.
5 Volatile Organic Compound Analytical Data for Sample Point Sll.
6 Volatile Organic Compound Analytical Data for Sample Points S12and S13.
7 Volatile Organic Compound Analytical Data for Field Blanks.I
1 8 Volatile Organic Compound Analytical Data - Summary of MaximumValues.
1 9 Volatile Organic Compound Analytical Data - Summary of MaximumValues.
1 10 Volatile Organic Compound Analytical Data - Summary of AverageValues.
I 11 Volatile Organic Compound Analytical Data - Summary of Average™ Mass Emission Rates.
I 12 Summary of ISCLT Dispersion Modeling Results.
_ 13 ISCLT Predicted Maximum On-Site Annual Average Ambient• Concentration.
1 14 ISCLT Predicted Maximum Perimeter Annual Average AmbientConcentration.
15 Summary of Maximum Potential Source Impact.
in
GERAGHTY & MILLER, INC.

1111111111111111111
TABLE
16
17
18
APPENDIX
A
B
TABLE OF CONTENTS(Continued)
LIST OF TABLES(Continued)
TITLE
Cancer Risk Estimates for an Adult Resident and Site Worker, Pointof Maximum Impact, Air Emissions.
Hazard Quotients and Hazard Index for an Adult Resident and SiteWorker, Point of Maximum Impact, Air Emissions.
Exposure to Onsite Workers, Air Releases from the WaterReclamation Facility, Comparison of Two Sampling and ModelingEvents.
LIST OF APPENDICES
TITLE
GEP Program Description.
ISCLT Dispersion Modeling Output.
IV
GERAGHTY & MILLER, INC.

IIIIIIIIIIIIIIIIIII
1.0 INTRODUCTION
Water samples were collected from ground-water supply wells and from several
locations within Alcoa's Mill Water System and Water Reclamation Facility. The data was
used for two purposes, (1) to evaluate the fate of contaminants in the Mill Water and Water
Reclamation Facility and (2) to conduct modeling and a risk evaluation of air emissions
from the Water Reclamation Facility.
The fate of contaminants was evaluated using mass balance calculations of dissolved
contaminant movement as it leaves its source, Alcoa production wells, and travels through
the Mill Water System and Water Reclamation Facility. Mass balance calculations were
made using measured and estimated flow rates and conservative assumptions of contaminant
movement in the system. This evaluation did not, however, conservatively assume that
contaminants will continuously and completely volatilize to the atmosphere, as was required
for the air modeling and risk evaluation. This fate evaluation was completed to provide a
realistic understanding of how contamination may move through the water systems at Alcoa
and identify where contaminants might be released.
Air modeling estimated the transfer of contaminants from water to the atmosphere
using a conservative mass balance evaluation. The focus was on the mass and rate of
contaminants discharging to the atmosphere and the risks posed once they reach the
atmosphere. Source emission rates were determined for the .cooling tower and clarifier
sources at the Water Reclamation Facility. This was accomplished by calculating a mass
emission rate for each source based on the water flow rates and the aqueous volatile organic
compound (VOC) concentration gradient for each source at the Water Reclamation Facility.
These procedures conservatively assumed that the entire VOC gradient is evolved to the
atmosphere directly at the Water Reclamation Facility sources. The Industrial Source
Complex Long Term (ISCLT) air quality dispersion model was subsequently utilized to
predict annual average ambient air concentrations of the constituents emitted from the
Water Reclamation Facility for a receptor grid and facility perimeter receptor locations.
1
GERAGHTY & MILLER, INC.

I™ A Good Engineering Practice (GEP), wake area evaluation was performed by the
• Geraghty & Miller, Inc. Air Quality Group (GMAQG) for the clarifier tank and water
cooling towers. The results from the wake analysis were used as input to allow
• determination of building wake effects from the Foil Mill and surrounding buildings on
plume dispersion. Historical site-specific meteorological data for the year 1988 was obtained
• and utilized in the ISCLT modeling procedure. The results from this analysis have been
used as input to a screening health risk evaluation of air pathway emissions.
I
I
I
I
I
I
I
I
I
I
I
I
I
• GERAGHTY & MILLER, INC.

IIIIIIIIIIIIIIIIIII
2.0 WATER RECLAMATION FACILITY DESCRIPTION
The Water Reclamation Facility recycles water from Alcoa's Mill Water System. The
Mill Water System is used for non-contact cooling water, contact process water and to
supplement fire protection needs. The Water Reclamation Facility is located in the south-
central portion of the Alcoa facility as shown on Figure 1. Figure 1 also contains a blow-up
which illustrates the layout of the Facility. Figure 2 contains a flow chart which illustrates
flow within the Mill Water System and Water Reclamation Facility.
Mill water enters the Water Reclamation Facility at the clarifier. From the clarifier,
in May through October, the water is routed through the two cooling towers and then
recycled back to the Mill Water System. During the cooler months (November through
April) the water bypasses the cooling towers. Approximately 20 percent of the mill water
is lost during the water reclamation process. This water enters National Pollutant Discharge
Elimination System (NPDES) Outfall 004 as blowdown or overflow from the Water
Reclamation Facility.
Recycled water from the Water Reclamation Facility is the main source of water for
the Mill Water System. There are two additional water sources for the Mill Water System,
the Mississippi River water intake and ground-water supply wells. They replace water that
is lost to Outfall 004 at the Water Reclamation Facility or lost from cooling and process use
that discharge directly to Outfall 006. The ground-water supply wells are pumped at higher
rates during the warm months (May through October) since they provide a source of cool
water. During the cool months (November through April) only one well, PW-6, is normally
pumping. This well is left on to maintain a cone-of-depression in the aquifer which captures
contaminated ground water that might otherwise move off site. Prior to 1989 the wells were
shut down during the winter months.
GERAGHTY & MILLER, INC.

IIIIIIIIIIIIIIIIIII
3.0 SAMPLING METHODOLOGY
Water samples were collected at six locations within the Mill Water System and
Water Reclamation Facility, designated S-3, S-4, S-7, S-ll, S-12, and S-13 on Figure 2. One
sample was collected each week for five consecutive weeks starting the second week in July
1991 and ending the second week in August 1991. However only one sample was retained
from location designated S-13 due to intermittant flow at this point. Results from sampling
points designated S-3 (Well PW-6), S-4 (Well PW-5), and S-13 (blowdown and overflow
from the Water Reclamation Facility) were used for the contaminant fate evaluation only.
Results from sampling points S-7 (inlet to the water clarifier), S-ll (outlet from water
clarifier, inlet to cooling towers) and S-12 (outlet from the cooling towers) were used for
both air dispersion modeling and the contaminant fate evaluation.
All samples were collected in laboratory supplied 120 milliliter(ml) glass vials with
teflon lined caps. Samples jars were filled directly at each location without the use of any
intermediate sampling equipment. The sampling crew wore new latex gloves at each
sampling point to prevent cross-contamination.
Samples from PW-5 and PW-6 (designated S-4 and S-3, respectively) were filled from
in-line sampling ports at the well head. The wells were operating at capacity throughout the
five week period that samples were collected. Flow rates at each well were calculated from
the in-line flow meters.
The sample at the inlet to the water clarifier (S-7) was collected from the top-center
of the clarifier where water first enters. This location was accessed from a walkway that
ends at the center of the clarifier. The clarifier outlet/cooling tower inlet sample (S-ll) was
collected from the top edge of the clarifier where clarified water drops out to enter the
cooling towers. The sample from the outlet of the cooling towers (S-12) was filled from the
cold well, where water accumulates after flowing out of the cooling towers. The Water
Reclamation Facility blowdown and overflow (S-13) was collected from the end of the piping
GERAGHTY & MILLER, INC.

I• where the water enters Outfall 004. No flow measurements were taken from the sample
• points (S-7, S-ll, S-12, and S-13) at the Water Reclamation Facility because the flow meters
in the system were not functioning properly. The flow rates used were supplied by Alcoa
• and are estimates based on their knowledge of the system.
• All samples were shipped overnight courier to Wadsworth/Alert Laboratories in
North Canton, Ohio for analysis for volatile organic compounds using EPA Method 624.
I
I
I
I
I
I
I
I
I
I
I
I
I
• GERAGHTY & MILLER, INC.
IIIIIIIIIIIIIIII• The water sampling for this project was completed under conditions consistent with
Scenerio 1, when PW-5 and the cooling tower were both active. The mass per day values
I
I
4.0 ANALYTICAL RESULTS AND CONTAMINANT FATE EVALUATION
This section presents the analytical data from water sampling, identifies the sources
of contaminated water and presents an evaluation of the fate of contaminants using mass
balance calculations. This evaluation was conducted independent of the more conservative
mass balance calculations that were used for the air modeling and risk evaluation presented
in Section 5.0. This section will walk the reader through the mass balance evaluation
analysis. To follow the steps taken and calculations made, the reader must utilize the
information provided in the flow charts (Figures 2 and 3) and Tables 1, 2, and 3. The
principal findings of the mass balance analysis are presented in Section 6.0
Table 1 lists the analytical results from five sampling events. Figure 2 illustrates the
relative location of each of these sampling points. Table 1 also presents an average and
maximum mass of contaminants in pounds per day at each location. The mass per day
values presented in Table 1 represent the contaminant mass through each sampling point
based on actual sampling data and the best available flow measurements or estimates from
July and August 1991.
Depending on the season, one of two flow scenerios exist for the Mill Water System
and Water Reclamation Facility. In the warm months (Scenerio 1) May through October,
there is a greater need for cool water and Alcoa will maximize their use of ground water
which is a cool water source. Therefore PW-5 will be active in addition to PW-6, which is
active year round. The cooling towers at the Water Reclamation Facility will also be
operated. During the cold months (Scenerio 2), the need for cool water is lower. PW-5 is
inactive and the cooling towers are shut down. Because PW-5 is a significant VOC
contaminant source and the cooling towers are very effective at removing VOCs from the
water, the total mass and fate of contaminants is much different for each scenerio.
GERAGHTY & MILLER, INC.

IIIIIIII
IIIIIIIIII
presented in Table 1, therefore, are representative of Scenerio 1. This data represents the
maximum total mass of contaminants and the conservative data necessary for the air
modeling evaluation.
To estimate the total mass per year values for VOCs requires adding the daily values
estimated for Scenarios 1 and 2, assuming each is active half the year. Using the mass per
day values for the contamination sources (PW-5 and PW-6), mass per year values were
calculated assuming PW-5 is active only six months during the year. These values are listed
on Table 2. Based on an average of the five sampling episodes and assuming PW-5 is active
only six months, the average total VOC mass per year from combined sources (PW-5 and
PW-6) is approximately 9,800 pounds (Table 2).
Assuming the VOC mass contribution from PW-5 to the water entering the Water
Reclamation Facility at the water clarifier is only six months of the year, the average total
VOC mass per year entering the clarifier and the cooling towers is approximately 12,000
pounds (Table 2). Then if it is assumed when PW-5 is inactive, the cooling towers are also
inactive, the total VOC mass per year leaving or bypassing (depending on the time of year)
the cooling towers is approximately 3,129 pounds. This VOC mass is recycled into the Mill
Water System. Approximately 3,000 gallons per minute (gpm) is discharged as overflow to
Outfall 004, resulting in a discharge of approximately 1,325 pounds per year total VOCs.
A comparison of the two flow scenarios and the average mass of VOCs per day is
listed on Table 3 and illustrated on Figure 3. During the six months of the year when PW-5
is active (Scenario 1), despite the increased mass of VOCs in the Mill Water System from
PW-5, the average total VOCs recycled to the Mill Water System from the Water
Reclamation Facility is low because the cooling towers are very effective at volatilizing the
VOCs to the atmosphere. When PW-5 and the cooling towers are inactive (Scenario 2), the
VOCs from PW-6 are not volatilized to the atmosphere, and therefore, will be recycled
through to the Mill Water System. Once in the Mill Water, the VOCs can show up in the
direct discharge to Outfall 006, as explained in Section 2.0.
GERAGHTY & MILLER. INC.

IIIIIIIIIIIIIIIiIII
5.0 AIR MODELING AND RISK EVALUATION
5.1 AIR MODELING METHODOLOGY
The Alcoa Davenport Works uses water throughout the facility in a closed loop
process. Ground water is circulated to the Water Reclamation Facility with additional
sources of process water. Volatile organic compounds present may be released to the
atmosphere at the Water Reclamation Facility when the ground-water wells are operational.
Process operations are such that -the Water Reclamation Facility is currently utilizing
contaminated ground water year round, not on a seasonal basis as previously modeled
(Geraghty & Miller, January 1990). Annual average ambient ground-level concentrations
were predicted by ISCLT air quality dispersion modeling using an arbitrary mass emission
rate of 1 gram per second (g/s) from each source. Actual ambient air concentration values
for the constituents of concern were subsequently ratioed from the results of these runs.
The sources under investigation include the water clarifier and cooling towers of the
Water Reclamation Facility. Figure 1 illustrates source locations. The water clarifier and
cooling towers were modeled assuming a water flow rate of 15,300 gpm and the
concentration gradients, based upon the sampling results obtained from mass balance points
S-7, S-ll, and S-12, respectively. A general flow diagram illustrating the sampling points is
presented in Figure 2.
It should be noted that a strict mass balance would also include overflow and blow-
down associated with stream S-13. Due to the intermittent operation of this flow stream,
it was omitted from the source emission rate determinations. Performing the mass balance
in this manner assures the most conservative bias on mass emissions, since any VOC
concentration gradient is assumed to be lost via the air pathway at the appropriate water
reclamation source. Potential biological or chemical degradation of the compounds was not
considered, and would have the effect of reducing the portion of emissions released via air.
This conservative approach provides an assessment of potential worst case conditions.
8
GERAGHTY & MILLER, INC.

IIIIIIIIIIIIIIIIIII
The ISCLT model has an option permitting evaluation of the wake effects of "nearby"
buildings on source emissions. Nearby is defined as five times the lessor of building height
or projected cross-wind width. The Foil Mill Water Reclamation office, and an additional
small support building, were determined to meet the "nearby" criteria for both sources. The
building wake evaluation data including a brief program description as provided by Bowman
Environmental Engineering is presented in Appendix A. Due to the influence of wake
effects on plume dispersion, it was more conservative to model the cooling tower source as
two separate units.
Although the water clarifier is in close proximity to facility buildings, the ISCLT
program algorithm will not permit building wake effects to be analyzed for area sources.
To assess the potential impact of building wake effects on this source, the tank was modeled
as a series of individual point sources influenced by downwash. The source was also
modeled as an area source with no influence from the nearby buildings. The results from
the area source modeling analysis are presented in this report due to their more
conservative predictions of ground-level ambient concentrations.
The meteorological requirements of the model were satisfied by a stability array
(STAR) deck processed from National Climatic Data Center (NCDC) data for 1988 for the
Moline, Illinois surface National Weather Service Station (14923) obtained from U.S.
Environmental Protection Agency's (USEPA) Support Center for Regulatory Air Models
(SCRAM). The 1988 data represents the most current complete year of data available. The
STAR deck contains the percent frequency of occurrence information for wind speed and
direction as classified by the six Pasquill Stability Classes. The STAR data is represented
by the annual Windrose illustrated in Figure 4. The summary table included in Figure 4
presents the percent frequency of occurrence data for wind speed and direction used in
generation of the Windrose.
GERAGHTY & MILLER, INC.

IIIIIIIIIIIIIIIIIII
5.2 AIR MODELING RESULTS
The source impact analysis is based upon a combination of ground-water sampling
and air quality dispersion modeling. Tables 4, 5, and 6 summarize the data collected from
sampling locations S-7 (inlet to clarifier), S-ll (outlet from clarifier, inlet to cooling towers),
and S-12 (outlet from cooling towers). The maximum and average concentrations observed
during sampling are presented. Table 7 summarizes the results from field blank analysis.
No compounds were detected above the analytical detection limit.
To interpret the results from ground-water sampling, the outlet concentrations are
subtracted from the inlet concentrations. Tables 8 and 9 present the calculation of the
maximum and average concentration gradients. Review of this data illustrates for the water
clarifier source numerous compounds detected in the effluent at higher levels than in the
influent. Biological reactions or other chemically mediated phenomena may explain this
occurrence.
Table 10 summarizes the calculation of average mass emission rates for the clarifier
and cooling tower sources. The concentration gradient in micrograms per liter (/xg/L) was
multiplied by the water flow rate to yield a source emission rate in g/s. Emission rates were
based on a 15,300 gpm throughput for all sources. Mass emission rates for compounds
potentially generated in the clarifier are denoted by the letters "EEI" meaning effluent
exceeded influent.
The following compounds showed ambient losses via volatilization between the inlet
and outlet of the clarifier: 1,1,2,2-tetrachloroethane; tetrachloroethene; and vinyl chloride.
The maximum mass emission rate was 0.009 g/s for the compound tetrachloroethene which
is the major constituent of concern at the site.
The following compounds showed ambient losses via volatilization between the inlet
and outlet of the cooling towers: bromodichloromethane; chloroform; 1,1,-dichloroethane;
10
GERAGHTY & MILLER, INC.

IIIIIIIIIIIIIIIIIII
1,2-dichloroethene (total); tetrachloroethene; toluene; trichlorethene; and vinyl chloride.
The maximum mass emission rate was 0.1 g/s for the compound tetrachloroethene. The
results of source emission calculations for the clarifier and cooling towers are summarized
in Table 11.
Air quality dispersion modeling was performed for the sources using an arbitrary
mass emission rate of 1 g/s per source. Performing the modeling in this manner permits
ambient concentrations for all compounds of concern to be ratioed from a single modeling
run. The results from modeling the 1 g/s mass emission rate are summarized in Table 12.
The absolute maximum concentrations are presented for each source. Ten additional
receptor locations were specified at the facility perimeter. The complete modeling output
is included as Appendix B. Figure 5 depicts concentration isopleths in micrograms per cubic
meter (/xg/m3) for the combined clarifier and cooling tower emissions based on an arbitrary
emission rate of 1 g/s per source.
Tables 13 and 14 present the combination of mass emission rate calculations and
dispersion modeling results. The maximum on-site and perimeter concentrations are
presented for each source individually using the average source mass emission rates.
The maximum annual average on-site ground-level concentrations predicted by
ISCLT for the water clarifier source was located at coordinate 900, -700. Annual ground-
level ambient constituent concentration values at the maximum location ranged between a
low of 5.18 x 10'2 Mg/m3 for 1,1,2,2-tetrachloroethane to 4.69 x 10'1 /ig/m3 for
tetrachloroethene. The maximum annual average ground-level concentration predicted by
ISCLT for cooling tower source "A" was located at coordinate 900, -700. Annual constituent
concentration values at the maximum location ranged between a low of 9.06 x 10"3 jtg/m3
for vinyl chloride to 9.48 x 10"1 j*g/m3 for tetrachloroethene. The maximum annual average
ground-level concentration predicted by ISCLT for cooling tower "B" was located at
coordinate 900, -700. Annual constituent concentration values at the maximum location
ranged from a low of 7.94 x 10"3 >ig/m3 for vinyl chloride to 8.62 x 10"1 /xg/m3 for
11
GERAGHTY & MILLER, INC.

IIIIIIIIIIIIIIIIIII
tetrachloroethene. In computing the reported maximum average ambient concentration
values, the source mass emission rate was assumed to be split equally between cooling
towers "A" and "B".
The maximum annual average off-site ground-level concentrations predicted by
ISCLT for the water clarifier and cooling tower sources was located at perimeter coordinate
P9 (211.2, -1134.5). Annual ground-level ambient constituent concentration values for the
water clarifier at the maximum location ranged between a low of 3.73 x 10"3 /zg/m3 for
1,1,2,2-tetrachloroethane to 3.38 x 10"2 /*g/m3 for tetrachloroethene. The maximum annual
average off-site ground-level concentration predicted by ISCLT for cooling tower source "A"
at the maximum location ranged between a low of 5.75 x 10^ [ig/m3 for vinyl chloride to
6.24 x 10"2 /ig/m3 f°r tetrachloroethene. The maximum annual average off-site ground-level
concentration predicted by ISCLT for cooling tower "B" at the maximum location ranged
from a low of 4.34 x 10"* /ig/m3 for vinyl chloride to 4.71 x 10~2 /xg/m3 for tetrachloroethene.
In computing the reported maximum average ambient concentration values, the source mass
emission rate was assumed to be split equally between cooling towers "A" and "B".
Table 15 summarizes the combination of the individual source contributions to the
total Water Reclamation Facility impact on ambient air quality both onsite and at the plant
perimeter. The point of maximum concentration onsite is specified at coordinates 900, -700
and represents the combined maximum ambient concentration from each source
individually. The point of maximum impact at the plant perimeter is located at coordinates
211.2, -1134.5.
5.3 RISK EVALUATION
Risk estimates were calculated based on data provided from ISCLT modeling.
Exposure to a site worker and adult resident was assessed. Assumptions for the site worker
include: (1) body mass of 70 kg, (2) inhalation rate of 2.5 m3/hour, (3) exposure duration
of 8 hours/day, and (4) exposure frequency of 250 days per year for 25 years. Assumptions
12
GERAGHTY & MILLER, INC.

IIIIIIIIIIIIIIIIIII
for the resident include: (1) body mass of 70 kg, (2) inhalation rate of 0.83 m3/hour, (3)
exposure duration of 17 hours per day, and (4) exposure frequency of 350 days per year for
30 years. According to current guidance, exposure estimates for vinyl chloride are doubled
to account for greater sensitivity during early childhood. Exposure estimates for residents
to vinyl chloride were calculated according to the above assumptions and doubled. All of
the exposure assumptions (site worker and resident) were based on current standard
assumptions (USEPA, 1991a) with the exception of the 17 hours daily exposure duration for
the resident. The exposure duration was based on guidance (Table 5-9) from USEPA's
Exposure Factors Handbook (1989).
Toxicity values (cancer slope factors and reference doses) were obtained from the
Integrated Risk Information System (IRIS), Health Effects Assessment Summary Tables
(HEAST) (USEPA, 1991), and Agency for Toxic Substances and Disease Registry Toxicity
Profiles (ATSDR, 1990). Inhalation values were used if available. Oral toxicity values were
used only for bromodichloromethane because inhalation data were not sufficient to develop
toxicity values. All slope factors were obtained from IRIS or HEAST. Because relatively
few inhalation reference doses (RfDs) have been developed, most of the RfDs were derived
from minimal risk levels (MRLs) reported in the ATSDR documents. In most cases chronic
MRLs were not available; therefore, subchronic MRLs (called intermediate MRLs in the
ATSDR documents) were divided by an uncertainty factor of 10 to derive a chronic MRL.
Sources for all toxicity values are indicated on Tables 16 and 17. Complete references are
provided in Section 7.0.
Cancer risk estimates were 6 x 10"7 (resident) and 7 x 10"6 (worker) (Table 16). These
values fall within the potentially acceptable range of 1 x 10^ to 1 x 10"6. Typically, an excess
lifetime cancer risk of 1 x 10"6 is often used as the criterion for residential exposure and 1
x 10"5 is used for worker exposure. The hazard index was 0.02 (resident) and 0.6 (worker)
and are considered acceptable because they are below 1 (Table 17).
13
GERAGHTY & MILLER, INC.

IIIIIIIIIIIIIIIIIII
This same air contamination source was modeled and risk calculations completed in
1989 (Geraghty & Miller, January 1990). The 1989 modeling included the assumption that
the contaminant source, the ground-water production wells, were active only six months
during the year. The concentration of contaminants entering the Water Reclamation
Facility in the 1989 modeling study were based on one sampling episode and a flow rate of
12,000 gpm. In addition, the wells were not sampled during a sampling episode, only the
points in and out of the Water Reclamation Facility. The concentrations of contaminants,
specifically tetrachloroethene, was significantly higher in 1989. However, because the flow
volume was less in 1989, 12,000 gpm, the mass per day values are not significantly different.
The current study was conducted for two reasons: because regulator monitoring of
the production wells suggested that the concentration of contaminants had increased
significantly since 1989, and because Alcoa was operating production well PW-6 year round
to maintain capture of a contamination plume. Although the pounds per day amounts in
1991 are less than 1989, the total mass per year is higher assuming year round source.
As outlined on Table 18, the 1991 study resulted in higher total cancer risks and
hazard index. These values, however, are still within an acceptable range.
14
GERAGHTY & MILLER, INC.

IIIIIIIIIIIIIIIIIII
6.0 PRINCIPLE FINDINGS
The ISCLT model has been employed to predict receptor concentrations on an
annual basis for all compounds of concern emitted at the Water Reclamation Facility. This
analysis was accomplished utilizing actual facility operating parameters, measured water
concentrations, refined air quality dispersion modeling techniques, and site-specific
meteorology. Results of this modeling were used to evaluate risk to Alcoa employees and
area residents. A mass balance of VOC contaminants in the Mill Water System and Water
Reclamation Facility was also conducted. The principle findings are outlined below.
• Ambient concentration values predicted using conservative assumptions and through
the use of ISCLT modeling have been used in performing a risk evaluation of the
impact of air emission from the Water Reclamation Facility operation on worker
safety and public health. The facility as currently operated appears to pose
acceptable risk to public health and worker safety.
• Although this air modeling and risk evaluation conservatively assumed the total mass
of contaminants at the Water Reclamation Facility are emitted to the air year round,
the sampling data and a mass balance evaluation suggest significant air emissions
would occur only when the cooling towers are operational. Due to seasonal
variations in water temperature, the cooling towers are operational only during the
warmer months.
• Sampling data reveals that even when the cooling towers are active, a small
percentage of the VOC mass will leave the Water Reclamation Facility in the
aqueous phase. This aqueous phase contaminant mass can reach the NPDES
discharge points in one of two ways: (1) as overflow from the Water Reclamation
Facility directly to Outfall 004, or (2) after being recycled into the Mill Water System
and used as cooling or process water in the ingot plant and/or hot rolling mill
operations, the water is discharged directly to Outfall 006.
15
GERAGHTY & MILLER, INC.
• The mass balance evaluation suggest that when the cooling towers are inactive, a
high percentage of the contaminant mass will be recycled into the Mill Water System.
IIIIIIIIIIIIIIIIIII GERAGHTY & MILLER, INC.

I• 7.0 REFERENCES
Agency for Toxic Substances and Disease Registry (ATSDR), 1990. Draft Health
• Assessment Guidance Manual, U.S. Department of Health and Human Services,
Atlanta, Georgia.
Geraghty & Miller, Inc. Air Quality Group, 1990a. Source Impact Evaluation ISCLT
I Dispersion Modeling for the Water Reclamation Facility at the Alcoa - Davenport,
Iowa Works Plant. Unpublished consultant's report prepared for the Aluminum
• Company of America.
I Geraghty & Miller, Inc., 1990b. Final Ground-Water Assessment for the Alcoa - Davenport
Waste Site. Unpublished consultants report prepared for the Aluminum Company
I of America.
I Integrated Risk Information System (IRIS), 1991. U.S. Environmental Protection Agency,
Office of Health and Environmental Assessment, Cincinnati, OH.
IU.S. Environmental Protection Agency (USEPA), 1991a. Human Health Evaluation
| Manual, Supplemental Guidance: "Standard Default Exposure Factors". Office of
Solid Waste and Emergency Response, Washington, DC.
— U.S. Environmental Protection Agency (USEPA), 1991b. Health Effects Assessment
• Summary Tables, FY-1991 Annual. Office of Emergency and Remedial Response,
_ Washington, DC.
• U.S. Environmental Protection Agency (USEPA), 1989. Exposure Factors Handbook, Office
• of Health and Environmental Assessment, Washington, DC.
I
I
• GERAGHTY # MILLER, INC.

GERAGHTY& MILLER, INC.
Environmental Services
DRAWING CONFIDENTIAL THS DRAWINGAND ALL HFORMATION CONTAINED THEREON ISAND SHALL REMAIN THE PROPERTY OT CEftACKTY
* MILLER. WC. AS AH INSTRUMENT Of PROFES-SIONAL SERVICE. THIS INFORMATION SHALL NOT
BE USED M WHOLE Oft IN PART WITHOUT THE
FULL KNOWLEDGE AND PRIOR WRITTEN CONSENTOf CERACHTY * WU.ER. INC
SCALE VERIFICATION
IMS BAR REPRESENTSONE INCH ON THEORIGINAL DRAWING:
USE TO VCRtfY FIGUREREPRODUCTION SCALE
PCOJCCT NO.: OHO 1141
OKATTED 91: tMJ
CKCCXCO BT: TA
FU NO: UTUTT
DAIt lOHOVIt
DATE: 21NOV11
DATE: IINOVft
WATER RECLAMATION FACILITY SITE MAP FIGURE
ALCOA ALUMINUM COMPANY OF AMERICADAVENPORT WORKS

I
I
I
I
I
I
I
I
I
I
I
I
I
I
I
I
I
I
I
J^GERAGHTYW& MILLER, INC.^Br E n v i r o n m e n l a l S e r v i c e s
MississippiRiver Water
Supply
fllcoaGround-WaterSupply Well
#6
Notsampled
370 GPM
Mill WaterTreatment
NPDES Outfall#6
fllcoaGround-WaterSupply Well
SampleNo. S-3
320 GPM SampleNo. S-4
Plant OperationsCooling and Process
(Hot Mill, ColdMill, Plate Mill)
Foil MillOperationsfor Cooling
Lift Stations001, 002, 003,
004, 005
15,300 GPM
Lift Station 003
SampleNo. S-7
fllcoaGround-WaterSupply Well
#1
0 GPM
Not In operation at timeof sampling
Recycled toPlant CoolingWater System
Water Reclame Ion Facility
WaterClarlfler
SampleNo. S-11
Cool IngTouers
12,300 GPM
Bloudou
3000 GP
SampleNo. S-12
T and Overflou NPOES Outfall
1 SampleNo. S-13
Figure 2. M i l l Water and Water Reclamation FacilityFlow Diagram and Sampling Locations

IIII
IIIIIIIIIIIIII
Figure 3. Average Total VOC Mass Balance Flow DiagramM i l l Water and Water Reclamation Facility
MississippiRiver later
Supply
RlcoaGround" WaterSupply Well
#6
Notsampled
370 6PM
Mill WaterTreatment
RlcoaGround-WaterSupply Well
#5
10-60 lb/day
3868 Ib/year
320 GPM
NPDES Outfall#6
Plant OpeCooling ar
(Hot MlMill, Pit
•rationsid Process1, Coldite Mill)
RlcoaGround-WaterSupply Well
#1
32-47 Ib/day
5926 Ib/year
0 GPM 0 lb/day
Not In operation at timeof sampling
43-07 lb/day PW-5 RCTIVE
10-6 lb/day PW-5 INRCTIVE
9795 Ib/year
Foil MillOperat ionsfor Cooling
Lift Stations001, 002, 003,
004, 005
15,300 GPM
Lift Station 003
48-08 Ib/day PW-5 ACTIVE15-75 lb/day PW-riNACTIVE11,620 Ib/year
Water Reclamation Facility
Recycled toPlant CoolingWater System
WaterClarifler
48-71 lb/day PW
18-08 lb/day PW
12,180 Ib/year
CoolingTouers
12,300 GPM
Bloudour
5 RCTIVE
5 INACTIVE
3000 GPMi end Overfloui
3-72 lb/day PW-5 flCT^3-54 lb/day PW-5 INflC
! 1325-95 IbA
2-61 lb/day COOLING TOWERRCTIVE !18-07 Ib/day COOLING
-TOWER-INRCTIVE-1
3129 Ib/year
NPDES Outfall#004
GERAGHTY & MILLER, INC.

IIIIIIIIIIIIIIIIIII
^GERAGHTY? MILLER, INC.
E n v i r o n m e n t a l Services
Figure 5
-500
-1000
-1500-500
General Isoplethsand Facility Perimeter ReceptorsAlcoa Davenport WorksDavenport, Iowa 1991
500 1000 1500 2000 2500500
- 0
- -500
- -1000
-1500500 1000 1500
SCALE 1:600 m
2000 2500
Note: ISCLT Predicted Maximum Annual Average Ambient
Concentration Isopleths for Combined Sources
in micrograms per cubic meter (ug/m3)
assuming a 1 g/s mass emission rate
SURFER File: olc91.plt

II
Figure 4 N
3.0 7.0 12.0 18.0 I
24.0
WIND SPEED CLASS BOUNDARIES(MILES/HOUR)
NOTES:
DIAGRAM OF THE FREQUENCY OF
OCCURRENCE FOR EACH WIND DIRECTION.
WIND DIRECTION IS THE DIRECTION
FROM WHICH THE WIND IS BLOWING.
EXAMPLE - WIND IS BLOWING FROM THE
NORTH 4.8 PERCENT OF THE TIME.
WINDROSESTATION NO. 14923Moline, IllinoisPERIOD: 1988
SUMMARY TABLEWIMOROSE DATA
Station No. 14923Moline, Illinois .Period: 1988
Wind-s Classestf I I *iW % • VI •
.022.545.067.590.0112.5135.0157.5180.0202.5225.0247.5270.0292.5315.0337.5
TOTAL
.00524
.00191
.00270
.00752
.02071
.01496
.00386
.00630
.01573
.00607
.00850
.01626
.00632
.00489
.00080
.00191
.12368
.01275
.00569
.00763
.01651
.03324
.02084
.00535
.01105
.02869
.01196
.01423
.02903
.01423
.01469
.00478
.00467
.23535
.01753 .01173
.00535 i .00262
.00695 ! .00558
.01879 .01025
.01753 i .01070
.01765
.01093
.01196
.04394
.02061
.01013
.00888
.00911
.03996
.02186.01662 I .01446.02562.02391.03336.01526.00956
.29557
.02049
.02914
.04531
.01594
.01070
.26686
.00034
.00000
.00046
.00080
.00091
.00046
.00159
.00205
.00660
.00262
.00194
.00695
.01104
.01810
.00444
.00194
.06023
.00000
.00000
.00000
.00000
.00023
.00046
.00011
.00000
.00148
.00023
.00011
.00342
.00535
.00558
.00103
.00046
.01845
AM\
.04759
.01558
.02331
.05386
.08333
.06449
.03073
.04046
.13641
.06334
.05586
.10176
.09000
.12193
.04224
.02924
1.00015
WGf&i'fnvir
GERAGHTY& MILLER, INC.
Environmental Services

TABLE 1. SUMMARY TABLE OF ANALYTICAL RESULTS FROM W A T E RQUALITY SAMPLING, MILL WATER SYSTEM AND WATER RECLAMATION FACILITY
PUMPING SEASON FOR WELL #5 IS MAY THROUGH OCTOBER
PARAMETER
Tetrachloroethene1,2-Dlchloroethene(Total)TrichloroetheneVinyl chloride
TOTAL VOCS
LOCATION WELL #5 WELL #5 WELL #5 WELL #5 WELL #5DESIGNATION S-4 S-4 S-4 S-4 S-4DATE 7/11/91 7/17/91 7/24/91 8/1/91 8/8/91UNITS (ug/L) (ug/L) (ug/L) (ug/L) (ug/L)
3700 5800 6200 5500 54001800 2200 2100 2200 2100
650 870 940 970 9100 230 230 0 340
6150 9100 9470 8670 8750
A V E R A G E MAXIMUM(ug/L) (ug/L)
5320 62002080 2200
868 970160 340
8428 9470
MASSBASED ON 320 GPM
AVERAGE MAXIMUM(LB/DAY) (LB/DAY)
20.50 23.898.01 8.483.34 3.740.62 1.31
32.47 36.49
WELL #6 IS PUMPING YEAR ROUND
PARAMETER
Tetrachloroethene1,2-Dlchloroethene(Total)TrichloroetheneVinyl chlorideChloroformBromodlchloro methane
TOTAL VOCS
LOCATION WELL #6 WELL #6 . WELL #6 WELL #6 WELL #6DESIGNATION S-3 S-3 S-3 S-3 S-3DATE 7/11/91 7/17/91 7/24/91 8/1/91 8/8/91UNITS (ug/L) (ug/L) (ug/L) (ug/L) (ug/L)
1500 1200 1300 940 750860 680 880 700 440600 470 550 420 180150 0 160 0 13
0 0 30 37 00 0 4 0 31
3110 2350 2924 2097 1414
AVERAGE MAXIMUM(ug/L) (ug/L)
1138 1500712 880444 600
64.6 16013.4 37
7 31
2379 3110
MASSBASED ON 370 GPM
AVERAGE MAXIMUM(LB/DAY) (LB/DAY)
5.07 6.683.17 3.921.98 2.670.29 0.710.06 0.160.03 0.14
10.60 13.86
PARAMETER
Tetrachloroethene1,2-Dlchloroethene(Total)TrichloroetheneVinyl chlorideChloroformBromodlchloro methaneOTHER
TOTAL VOCS
LOCATION TO CLARIFIER TO CLARIFIER TO CLARIFIER TO CLARIFIER TO CLARIFIERDESIGNATION S-7 S-7 S-7 S-7 S-7DATE 7/11/91 7/17/91 7/24/91 8/1/91 8/8/91UNITS (ug/L) (ug/L) (ug/L) (ug/L) (ug/L)
140 120 96 ' 160 9873 56 62 68 6638 30 29 32 310 0 0 7 6
58 36 30 37 136 0 4 0 06 0 0 3 0
321 242 221 307 214
AVERAGE MAXIMUM(ug/L) (ug/L)
122.8 16065 7332 38
2.6 734.8 58
2 6: 1.8 6
261 321
MASSBASED ON 15,300 GPMAVERAGE MAXIMUM(LB/DAY) (LB/DAY)
22.62 29.4811.97 13.455.90 7.000.48 1.296.41 10.690.37 1.110.33 1.11
48.08 59.14
GERAGHTY & MILLER, INC.

TABLE 1 (CONTINUED)SUMMARY TABLE OF ANALYTICAL RESULTS FROM WATERQUALITY SAMPLING, MILL WATER SYSTEM/WATER RECLAMATION FACILITY
PARAMETER
Tetrachloroethene1,2-Dlchloroethene(Total)TrlchloroetheneVinyl chlorideChloroformBromodlchloro methaneOTHER
TOTAL VOCS
LOCATION TO COOLING TO COOLING TO COOLING TO COOLING TO COOLINGDESIGNATION T O W E R S - 1 1 T O W E R S - 1 1 T O W E R S - 1 1 T O W E R S - 1 1 T O W E R S - 1 1DATE 7/11/91 7/17/91 7/24/91 8/1/91 8/8/91UNITS (ug/L) (ug/L) (ug/L) (ug/L) (ug/L)
120 140 120 93 8578 67 66 65 7134 33 31 30 280 0 0 0 5
70 49 39 52 186 6 0 4 03 3 0 3 3
311 298 256 247 210
AVERAG MAXIMUM(ug/L (ug/L)
111.6 14069.4 7831.2 34
1 545.6 70
3.2 62.4 3
264.4 311
MASSBASED ON 15,300 GPMAVERAGE MAXIMUM
(LB/DAY) (LB/DAY)
20.56 25.7912.79 14.37
5.75 6.260.18 0.928.40 12.900.59 1.110.44 ' 0.55
48.71 57.29
PARAMETER
Tetrachloroethene1 ,2 - Dichloroethene(Total)TrlchloroetheneVinyl chlorideChloroformBromodlchloro methaneOTHER
TOTAL VOCS
LOCATION LEAVE COOL LEAVE COOL LEAVE COOL LEAVE COOL LEAVE COOL
DATE 7/11/91 7/17/91 7/24/91 8/1/91 8/8/91UNITS (ug/L) (ug/L) (ug/L) (ug/L) (ug/L)
7 4 0 4 07 0 0 3 - 00 0 0 0 00 0 0 0 . 0
40 19 0 4 00 0 0 0 00 0 0 0 0
54 23 0 11 0
AVERAG MAXIMUM(ug/L (ug/L)
3 72 70 00 0
12.6 400 00 0
17.6 54
MASSBASED ON 12,300 GPMAVERAG MAXIMUM
(LB/DAY) (LB/DAY)
0.44 1.040.30 1.040.00 0.000.00 0.001.87 5.920.00 0.000.00 0.00
2.61 8.00
PARAMETER
Tetrachloroethene1,2-Dlchloroethene(Total)TrlchloroetheneVinyl chlorideChloroformBromodlchloro methaneOTHER
TOTAL VOCS
LOCATION OVERFLOWDESIGNATION S-13DATE 7/17/91UNITS (ug/L)
36261 1
030
00
103
MASS BASEDON 3000 GPM
(LB/DAY]
1.300.940.400.001.080.000.00
3.72
GERAGHTY & MILLER, INC.

TABLE 2. SUMMARY TABLE OF VOC MASS PER YEAR CALCULATIONS
WELL #5
PARANETER
Tetrachloroethene1 ,2-Dichloroethene(TotaOTrichloroetheneVinyl chloride
TOTAL VOCS
MASS PER DAYBASED ON 320 GPM
AVERAGE MAXIMUM(IB/DAY) (LB/DAY)
20.50 23.898.01 8.483.34 3.740.62 1.31
32.47 36.49
MASS PER YEARACTIVE MAY -OCTOBER
AVERAGE MAXIMUM(LB/YEAR) (LB/YEAR)
3740.98 4359.781462.64 1547.02610.37 682.10112.51 239.08
5926.49 6659.22
PERCJENT UJNTHIDUIIUN TO MILL WATERBASED ON MASS PER DAY VALUES INTO CLARIFIER
AVERAGE MAXIMUM(LB/YEAR) (LB/YEAR)
90.61%66.93%56.73%
128.71%
67.54%
81.05%63.03%53.39%
101.59%
61.70%
WELL #6
PARAJVETER
Tetrachloroethene1 ,2-Dichloroethene(Total)TrichloroetheneVinyl chlorideChloroformBromodchloromethane
TOTAL VOCS
MASSBASED ON 370 GPM
AVERAGE MAXIMUM(LB/DAY) (LB/DAY)
5.07 6.683.17 3.921.98 2.670.29 0.710.06 0.160.03 0.14
10.60 13.86
MASS PER YEARACTIVE YEAR ROUNDAVERAGE MAXIMUM(IB/YEAR) (LB/YEAR)
1850.53 2439.191157.80 1430.99722.00 975.68105.05 260.1821.79 60.1711.38 50.41
3868.56 5057.26
MAbbl-HUM UUMbNED SUUHUEbWELL #5 + WELL #6
AVERAGE(LB/DAY)
43.07
MAXIMUM(LB/DAY)
50.34
AVERAGE(LB/YEAR)
9795.05
MAXIMUM(IB/YEAR)
11716.48
INTO CLARIFIER
PARANETER
Telrachloroethene1 ,2-Dichloroe1hene(Total)TrichloroetheneVinyl chlorideChloroformBromodichloromethaneOTHER
TOTAL VOCS
MASS BASED ON 15,300 GPM\AO-L #5 ACTIVE
AVERAGE MAXIMUM(LB/DAY) (LB/DAY)
22.62 29.4811.97 13.455.90 7.000.48 1.296.41 10.690.37 1.110.33 1.11
48.08 59.14
ESTIMATED MASS WfTHWELL #5 INACTIVE
AVERAGE MAXIMUM(LB/DAY) (LB/DAY)
2.12 5.593.96 4.972.55 3.260.00 0.006.41 10.690.37 1.110.33 1.11
15.75 26.72
MASS PER YEAH WlPHWELL #5 SOURCE ONLY HALF YEARAVERAGE(LB/YEAR)
4516.422908.131541.39
62.322340.04134.49121.04
11623.83
MAXIMUM(LB/YEAR)
6399.043361.691873.12231.61
3900.07403.46403.46
16572.45
GERAGHTY & MILLER, INC.
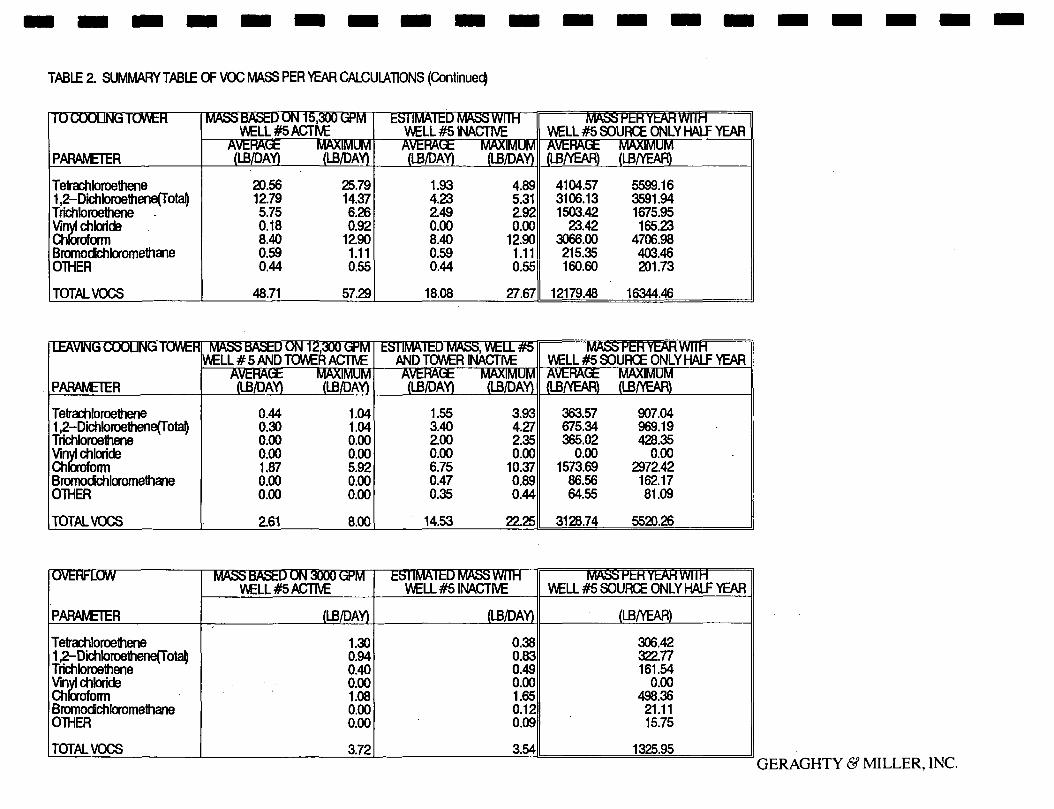
TABLE 2. SUMMARY TABLE OF VOC MASS PER YEAR CALCULATIONS (Continue^
TO COOLJNG TOWER
PARAMETER
Tetrachloroethene1 ,2-Dfchloroethene(Total)TrichloroetheneVinyl chlorideChloroformBromodchloromethaneOTHER
TOTAL VOCS
MASS BASED ON 15,300 GPMV\ELL #5 ACTIVE
AVERAGE MAXIMUM(LB/DAY) OB/DAY)
20.56 25.7912.79 14.375.75 6.260.18 0.928.40 12.900.59 1.110.44 0.55
48.71 57.29
ESTIMAltD MASS WITHWELL #5 INACTIVEAVERAGE MAXIMUM(LB/DAY) (LB/DAY)
1.93 4.894.23 5.312.49 2.920.00 0.008.40 12.900.59 1.110.44 0.55
18.08 27.67
MASSHL-HYbAHWIIHWELL #5 SOURCE ONLY HALF YEARAVERAGE MAXIMUM(IB/YEAR) (LB/YEAR)
4104.57 5599.163106.13 3591.941503.42 1675.95
23.42 165.233066.00 4706.98215.35 403.46160.60 201.73
12179.43 16344.46
LEAVING COOLING I OWhH
PARAMETER
Tetrachloroethene1 ,2-Dichloroethene(Tbtal)TrichloroetheneVinyl chlorideChloroformBromodchloromethaneOTHER
TOTAL VOCS
MASS BASED ON 12,300 GPMWELL # 5 AND TOWER ACTIVE
AVERAGE MAXIMUM(LB/DAY) (LB/DAY)
0.44 1.040.30 1.040.00 0.000.00 0.001.87 5.920.00 0.000.00 0.00
2.61 8.00
ESTIMAI bD MASS, WELL #5AND TOWER INACTIVEAVERAGE MAXIMUM(LB/DAY) (IB/DAY)
1.55 3.933.40 4.272.00 2.350.00 0.006.75 10.370.47 0.890.35 0.44
14.53 22.25
MASSHhHYkAHWIIHWELL #5 SOURCE ONLY HALF YEARAVERAGE MAXIMUM(LB/YEAR) (LB/YEAR)
363.57 907.04675.34 969.19365.02 428.35
0.00 0.001573.69 2972.42
86.56 162.1764.55 81.09
3128.74 5520.26
OVERFLOW
PARAMETER
Tetrachloroethene1 ,2-Dichloroethene(TotaDTrichloroetheneVinyl chlorideChloroformBromodchloromethaneOTHER
TOTAL VOCS
MASS BASED ON 3000 GPMWELL #5 ACTIVE
(LB/DAY)
1.300.940.400.001.080.000.00
3.72
ESTIMAIhUMASSWmHWELL #5 INACTIVE
(LB/DAY)
0.380.830.490.001.650.120.09
3.54
MASSPhHYbAHWIIHWELL #5 SOURCE ONLY HALF YEAR
(LB/YEAR)
306.42322.77161.54
0.00498.36
21.1115.75
1325.95GERAGHTY & MILLER, INC.

IIIIIIIIIIIIIIIIIII
TABLE 3. MASS BALANCE ANALYSIS OF CONTAMINANTS IN THE MILL WATER AND
WATER RECLAMATION FACILITY, TWO SCENERIOS.
SCENERIO #1 BOTH PRODUCTION WELL #5 AND COOLING TOWERS ACTIVE
MASS FROM COMBINED SOURCE OF PW-5 AND PW-6
FLOW COMBINED WITH MILL WATER BEFORE ENTERING
THE WATER CLARIFIER. MASS OF CONTAMINANTS INCREASES
DUE TO WATER TREATMENT RELATED CHEMICALS IN MILL WATER.
INTO THE WATER CLARIFIER
WITHIN THE CLARIFIER THERE APPEARS TO BE A SLIGHT INCREASE
IN THE WATER TREATMENT COMPOUNDS. THIS OVERSHADOWS
A DECREASE IN THE VOCS FROM THE PRODUCTION WELL SOURCE
INTO COOLING TOWERS
ADD
FLOW MASS
(GPM) (LBS/DAY)
690 43.07
1461O 5.01
15300
0
48.08
0.83
SIGNIFICANT LOSS OF CONTAMINANTS TO THE AIR
DUE TO VOLATILIZATION WITHIN THE COOLING TOWERS
OVERFLOW FROM WATER RECLAMATION
RECYCLED INTO MILL WATER SYSTEM
SUBTRACT 0
SUB TOTAL 1530O
3OOO
12300
-42.38
8.33
3.72
2.81
SCENERIO #2 BOTH PRODUCTION WELL *5 AND COOLING TOWERS INACTIVE
MASS FROM PRODUCTION WELL #B ONLY
FLOW COMBINED WITH MILL WATER BEFORE ENTERING
THE WATER CLARIFIER. MASS OF CONTAMINANTS INCREASES
DUE TO WATER TREATMENT RELATED CHEMICALS IN MILL WATER
INTO THE WATER CLARIFIER
WITHIN THE CLARIFIER THERE APPEARS TO BE A SLIGHT INCREASE
IN THE WATER TREATMENT COMPOUNDS. THIS OVERSHADOWS
A DECREASE IN THE VOCS FROM THE PRODUCTION WELL SOURCE,
WHICH IS SIGNIFICANTLY LESS OF A SOURCE WITH PW-6 INACTIVE.
BY-PASSING COOLING TOWERS
OVERFLOW FROM WATER RECLAMATION
RECYCLED INTO MILL WATER SYSTEM
FLOW MASS
(GPM) (LBS/DAY)
370 10.8
ADD
ADD
SUB TOTAL
14930
163OO
0
5.14
15.74
2.33
1S300 18.07
3000 3.54
1230O 14.53
GERAGHTY & MILLER, INC.

Table 4. Volatile Organic Compound Analytical Data for Sample Point S7Aluminum Company of AmericaDavenport, Iowa
S7 S7 S7 S7-RE S7 S7 Maximum Average(7/11/91) (7/17/91) (7/24/91) (7/24/91) (8/1/91) (8/8/91) S7 S7
Compound fue/11 Cug/11 • (/ug/n fug/11 (wg/1) (fig/h T/ug/ll fwg/1}
AcroleinAcrylonitrileBenzeneBromodichloromethaneBromoformBromomethaneCarbon TetrachlorideChlorobenzeneChloroethane2 — Chloroethylvinyl etherChloroformChloromethaneDibromochloromethane1 ,2 — Dichlorobenzene1 ,3 — Dichlorobenzene1,4 — Dichlorobenzene1,1 — Dichloroethane1 ,2 - Dichloroethane1,1 — Dichloroethene1,2-Dichloroethene (total)1 ,2 — Dichloropropanecis — 1 ,3 — Dichloropropenetrans — 1,3 — DichloropropeneEthylbenzeneMethylene chloride1 ,1,2,2 — TetrachloroethaneTetrachloroetheneToluene1,1,1 — Trichloroethane1,1,2— TrichloroethaneTrichloroetheneTrichlorofluoromethaneVinyl chloride
0006000000
5800000000
73000006
140000
3800
0000000000
3600000000
56000000
120400
3000
0000000000
2600000000
60000000
110000
2600
0004000000
3000000000
62000000
96000
2900
0000000000
3700000000
68000000
160000
3207
0000000000
1300000000
66000000
98000
3106
0006000000
5800000000
73000006
160400
3807
000
1.7000000
33.300000000
64.200000
1.0120.7
0.700
31.00
2.2
0 Value inserted for compound not detected in sample.
OH01302MSCLTDAT.WK3 03-Mar-92
GERAGHTY & MILLER, INC.

Table 5. Volatile Organic Compound Analytical Data for Sample Point SllAluminum Company of AmericaDavenport, Iowa
Sll Sll Sll Sll Sll Maximum Average(7/11/91) (7/17/91) (7/24/91) (8/1/91) (8/8/91) Sll Sll
Compound (ug/l) (jug/ll fwg/11 (jug/I) fug/ll fug/H (jj.g/1)
AcroleinAcrylonitrileBenzeneBromodichloromethaneBromoformBromomethaneCarbon TetrachlorideChlorobenzeneChloroethane2 — Chloroethylvinyl etherChloroformChloromethaneDibromochloromethane1,2 — Dichlorobenzene1 ,3 — Dichlorobenzene1,4 — Dichlorobenzene1,1 — Dichloroethane1,2 — Dichloroethane1,1 — Dichloroethene1,2 — Dichloroethene (total)1 ,2 — Dichloropropanecis — 1 ,3 — Dichloropropenetrans — 1,3 — DichloropropeneEthylbenzeneMethylene chloride1 ,1 ,2,2 - TetrachloroethaneTetrachloroetheneToluene1,1,1 — Trichloroethane1 ,1,2 — TrichloroethaneTrichloroetheneTrichlorofluoromethaneVinyl chloride
0006000000
7000000300
78000000
120000
3400
0000000000
4900000000
67000000
140500
3300
0 -000000000
39000000.00
66000000
120000
3100
0004000000
5200000300
65000000
93000
3000
0000000000
1800000300
71000000
85400
2805
0006000000
7000000300
78000000
140500
3405
000
2.0000000
45.600000
1.800
69.4000000
111.61.8
00
31.20
1.0
0 Value inserted for compound not detected in sample.
OH01302MSCLTDAT.WK3 06:14 PM 03-Mar-92
GERAGHTY & MILLER, INC.

Table 6. Volatile Organic Compound Analytical Data for Sample Point S12 and S13Aluminum Company of AmericaDavenport, Iowa
Compound
AcroleinAcrylonitrileBenzeneBromodichloromethaneBromoformBromomethaneCarbon TetrachlorideChlorobenzeneChloroethane2 — Chloroethylvinyl etherChloroformChloromethaneDibromochloromethane1,2 — Dichlorobenzene1,3 — Dichlorobenzene1 ,4 — Dichlorobenzene1,1 — Dichloroethane1 ,2 — Dichloroethane1,1 — Dichloroethene1,2-Dichloroethene (total)1 ,2 — Dichloropropanecis — 1,3 — Dichloropropenetrans — 1,3 — DichloropropeneEthylbenzeneMethyiene chloride1 ,1 ,2,2 - TetrachloroethaneTetrachloroetheneToluene1,1,1 — Trichloroethane1 ,1 ,2 — TrichloroethaneTrichloroetheneTrichlorofluoromethaneVinyl chloride
S12(7/11/91)
<>g/n
0000000000
400000000070000007000000
S12(7/17/91)
fug/n
0000000000
190000000000000004000000
S12(7/24/91)
Oie/11
000000000000000000000000000000000
S12-A(8/1/91)o*e/n
000000000040000000030000004000000
S12(8/8/91)f^g/n
000000000000000000000000000000000
MaximumS12
(«e/n
0000000000
400000000070000007000000
AverageS12
r«g/n
0000000000
12.600000000
2.0000000
3.0000000
0 Value inserted for compound not detected in sample.
OH01302MSCLTDAT.WK3 06:14 PM 03-Mar-92
GERAGHTY & MILLER, INC.

Table 7. Volatile Organic Compound Analytical Data for Field BlanksAluminum Company of AmericaDavenport, Iowa
Compound
AcroleinAcrylonitrileBenzeneBromodichloromethaneBromoformBromomethaneCarbon TetrachlorideChlorobenzeneChloroethane2 — Chloroethylvinyl etherChloroformChloromethaneDibromochloromethane1 ,2 — Dichlorobenzene1,3 — Dichlorobenzene1,4— Dichlorobenzene1,1 — Dichloroethane1 ,2 — Dichloroethane1,1 — Dichloroethene1,2 — Dichloroethene (total)1 ,2 — Dichloropropanecis — 1 ,3 — Dichloropropenetrans — 1,3 — DichloropropeneEthylbenzeneMethjdene chloride1 ,1 ,2,2 — TetrachloroethaneTetrachloroet heneToluene1,1,1 — Trichloroethane1 , 1 ,2 — TrichloroethaneTrichloroetheneTrichlorofluoromethaneVinyl chloride
TRIP0717(7/17/91)
fue/n
000000000000000000000000000000000
STB-1(7/24/91)
fue/1)
000000000000000000000000000000000
BDW(7/31/91)
fw.e/11
000000000000000000000000000000000
Trip Blank(8/1/91)
fwe/1)
000000000000000000000000000000000
STB -3(8/8/91)
fMe/n
000000000000000000000000000000000
MaximumBlank(ME/11
000000000000000000000000000000000
AverageBlankfw.e/1)
000000000000000000000000000000000
0 Value inserted for compound not detected in sample.
OH01302MSCLTDAT.WK3 06:14 PM 03-Mar-92
GERAGHTY & MILLER, INC.

VolatileOrganic Compound Analytical Data — Summary of Maximum ValuesAluminum Company of AmericaDavenport, Iowa
Clarifier SourceMaximum Maximum Maximum
S7 Sll S7-S11Compound fug/I) (wg/11 fu.g/11
AcroleinAcrylonitrileBenzeneBromodichloromethaneBromoformBromomethaneCarbon TetrachlorideChlorobenzeneChloroethane2 — Chloroethylvinyl etherChloroformChloromethaneDibromochloromethane1,2 — Dichlorobenzene1,3 — Dichlorobenzene1 ,4 — Dichlorobenzene1,1 — Dichloroethane1,2 — Dichloroethane1,1 — Dichloroethene1,2-Dichloroethene (total)1 ,2 — Dichloropropanecis — 1 ,3 — Dichloropropenetrans — 1,3 — DichloropropeneEthylbenzeneMethylene chloride1 ,1 ,2,2 - TetrachloroethaneTetrachloroetheneToluene1,1,1 — Trichloroethane1 ,1 ,2 — TrichloroethaneTrichloroetheneTrichlorofluoromethaneVinyl chloride
0006000000
5800000000
73000006
160400
3807
0006000000
7000000300
78000000
140500
3405
0000000000
-1200000
-300
-5000006
20-1
00402
Cooling Tower SourceMaximum Maximum Maximum
Sll S12 S11-S12Oxe/n f*ig/n fug/ii
0006000000
7000000300
78000000
140500
3405
0000000000
400000000070000007000000
0006000000
3000000300
71000000
133500
3405
0 Value inserted for compound not detected in sample.
OH01302VISCLTDAT.WK3 06:14 PM 03-Mar-92
GERAGHTY & MILLER, INC.

Table 9. Volatile Organic Compound Analytical Data — Summary of Average ValuesAluminum Company of AmericaDavenport, Iowa
Compound
AcroleinAcrylonitrileBenzeneBromodichloromethaneBromoformBromomethaneCarbon TetrachlorideChlorobenzeneChloroethane2 — Chloroethylvinyl etherChloroformChloromethaneDibromochloromethane1 ,2 — Dichlorobenzene1,3— Dichlorobenzene1 ,4 — Dichlorobenzene1,1 — Dichloroethane1,2 — Dichloroethane1,1 — Dichloroethene1,2-Dichloroethene (total)1 ,2 — Dichloropropanecis — 1 ,3 — Dichloropropenetrans — 1,3 — DichloropropeneEthylbenzeneMethylene chloride1 ,1 ,2,2 — TetrachloroethaneTetrachloroetheneToluene1,1,1 -Trichloroethane1 ,1 ,2 — TrichloroethaneTrichloroetheneTrichlorofluoromethaneVinyl chloride
Clarifier SourceAverage Average Average
S7 Sll S7-S11
fwg/U Cue/H (ftg/11
000
1.7000000
33.300000000
64.200000
1.0120.7
0.700
31.00
2.2
000
2.0000000
45.600000
1.800
69.4000000
111.61.8
00
31.20
1.0
000
-0.3000000
-12.300000
-1.800
-5.2000001
9.1-1.1
00
-0.20
1.2
Cooling Tower Source
Average Average AverageSll S12 S11-S12
Jw.e/H (neA) Ou.e/11
000
2.0000000
45.600000
1.800
69.4000000
111.61.8
00
31.20
1.0
0000000000
12.600000000
2.0000000
3.0000000
0002000000
3300000
1.800
67.4000000
108.61.8
00
31.201
0 Value inserted for compound not detected in sample.
OH01302MSCLTDAT.WK3 06:14 PM 03-Mar-92
GERAGHTY & MILLER, INC.

Table 10. Volatile Organic Compound Analytical Data — Summary of Maximum ValuesAluminum Company of AmericaDavenport, Iowa
Clarifier SourceMaximum Average AverageS7-S11 S7-S11 Mass Emission Rate
Compound frig/1) (WJ/1) (g/s)
AcroleinAcrylonitrileBenzeneBromodichloromethaneBromoformBromometbaneCarbon TetrachlorideChlorobenzeneChloroethane2-Chloroethylvinyl etherChloroformChloromethaneDibromochloromethane12-Dichlorobenzene1 ,3 - Dichlorobenzene1,4-Dichloro benzene1,1-Dichloroethane12-Dichloroethane1,1- Dichloroethene12-Dichloroethene (total)12-Dichloropropanecis- 1 ,3 - Dichloropropenetrans- 1 3 - DichloropropeneEthylbenzeneMethyiene chloride1,12,2 -TetracbloroethaneTetrachloroetheneToluene1,1,1 -Trichloroethane1 ,1 ,2 -TrichloroethaneTrichloroetheneTrichlorofluoromethaneVinyl chloride
0000000000
-1200000
-300
-5000006
20-1
00402
000
-0.3000000
-12.300000
-1.800
-5.2000001
9.1-1.1
00
-020
12
000
EEI000000
EEI00000
EEI00
EEI00000
0.0009650.008752
EEI00
EEI0
0.001126
Cooling Tower SourceMaximum Average AverageS11-S12 S11-S12 Mass Emission Rate
Oig/1) (fig/1) (g/s)
0006000000
3000000300
71000000
133500
3405
0002000000
3300000
1.800
67.4000000
108.61.8
00
31201
000
0.001931000000
0.03185400000
0.00173800
0.065060000000
0.1048300.001738
00
0.0301170
0.000965
Water flow rate through the system was assumed to be a constant 15300 Gallons per Minute.EEI Effluent Exceeded Influent0 Value inserted for compound not detected in sample.
OHOI30ZUSCLTDAT.WK3

IIIIIIIIIIIIIIIIIII
TABLE 11. Volatile Organic Compound Analytical DataSummary of Average Mass Emission RatesAluminum Company of AmericaDavenport, Iowa
Clarifier Source Cooling Tower SourceAverage Average
Mass Emission Rate Mass Emission RateCompound (g/s) (g/s)
Bromodichloromethane EEI 0.001931Chloroform EEI 0.0318541,1-Dichloroethane EEI 0.001738U-Dichloroethene (total) EEI 0.0650601,1,2,2-Tetrachloroethane 0.000965 0Tetrachloroethene . 0.008752 0.104830Toluene EEI 0.001738Trichloroethene EEI 0.030117Vinyl chloride 0.001126 0.000965
Water flow rate through the system was assumed to be a constant 15300 Gallons per Minute.EEI Effluent Exceeded Influent0 Value inserted for compound not detected in sample.
OH01302MSCDAT2.WK3 . 06:32 PM 03-Mar-92
GERAGHTY & MILLER, INC.

IIIIIIIIIIIIIIIIIII
Table 12. Summary of ISCLT Dispersion Modeling ResultsAluminum Company of AmericaDavenport, Iowa
Receptor Coordinates(X Coord., Y Coord.)
(meters, meters)
Maximum Individual On -Site
(900, -700)(900,-700)(900,-700)
Perimiter Concentration from
(14.3.-26.9)(1600.1,281.3)(1725.8,-23.5)(1948.7.-23.5)(1948.7.-667.4)(1430.6.-983.6)(564.5, -1265.0)(542.8,-1184.0)(211.2, -1134.5)
(58.2,-402.0)
ReceptorIdentification
Concentrations
Maximum ClarifierMaximum Cooling "A"Maximum Cooling "B"
Combined Sources
P-lP-2P-3P-4P-5P-6P-7P-8P-9P-10
MaximumAnnual Average
Concentration Predicted1 g/s Mass Emission Rate
per SourceC/ig/m3)
53.61362018.77967016.453690
1.4893342.8473664.2817863.2230383.9698974.1175853.7082195.5902565.9545421.760651
Individual Source Contributions to Perimeter Maximum
(21U.-1134.5)(211.2.-1134.5)("211.2,-1134.5)
P-9 - ClarifierP-9 - Cooling "A"P-9 - Cooling "B"
3.8650161.1905800.898946
OH01302\ISCDAT2.WK3 06:32 PM 03-Mar-92
GERAGHTY & MILLER, INC.

Table 13. ISCLT Predicted Maximum On-Site Annual Average Ambient ConcentrationAluminum Company of AmericaDavenport, Iowa
ISCLT PredictedMaximum Annual
Volatile Organic CompoundsArbitrary Concentration (g/sec)Maximum Impact Coordinates (m)
BromodichloromethaneChloroform1,1 -Dichloroethane1,2-Dichloroethene (total)1 ,1 ,2,2 -TetrachloroethaneTetrachloroetheneTolueneTrichloroetheneVinyl chloride
ISCLT Predicted ISCLT PredictedMaximum Annual Maximum Annual
Average Ambient Average Ambient Average AmbientAverage Mass Concentration Average Mass Concentration ConcentrationEmission Rate Clarifier Source Emission Rate Cooling "A" Cooling "B"
fg/sec) (/ig/rn31 (g/sec) O^B/m3) (MS/m3)1
EEIEEIEEIEEI
0.0009650.008752
EEIEEI
0.001126
53.6136(900,-700)
00
. 00
5.18E-024.69E-01
00
6.04E-02
1
0.0019310.0318540.0017380.065060
00.1048300.0017380.0301170.000965
18.7797(900.-700)
1.81E-022.99E-011.63E-026.11E-01
09.84E-011.63E-022.83E-019.06E-03
16.45369(900, -700)
1.59E-022.62E-011.43E-025.35E-01
08.62E-011.43E-022.48E-017.94E-03
OH01302\ISCDAT3.WK3 06:24 PM 03-Mar-92
GERAGHTY & MILLER, INC.

Table 14. ISCLT Predicted Maximum Perimeter Annual Average Ambient ConcentrationAluminum Company of AmericaDavenport, Iowa
Volatile Organic ComooundsArbitrary Concentration (g/sec)Maximum Impact Coordinates (m)
BromodichloromethaneChloroform1,1- Dichloroethane1,2-Dichloroethene (total)1 ,1 ,2,2 - TetrachloroethaneTetrachloroetheneTolueneTrichloroetheneVinyl chloride
Average MassEmission Rate
(g/sec)1
EEIEEIEEIEEI
0.0009650.008752
EEIEEI
0.001126
ISCLT PredictedMaximum AnnualAverage Ambient
ConcentrationClarifier Source
(jig/m3)3.865016
(211.2-1134.5)3.85
0000
3.73E-033.38E-02
00
4.35E-03
Average MassEmission Rate
fg/sec)1
0.0019310.0318540.0017380.065060
00.1048300.0017380.0301170.000965
ISCLT PredictedMaximum AnnualAverage Ambient
ConcentrationCooling "A"
(ju,g/m3)1.19058
(211.2-1134.5)
1.15E-031.90E-021.03E-033.87E-02
06.24E-021.03E-031.79E-025.75E-04
ISCLT PredictedMaximum AnnualAverage Ambient
ConcentrationCooling "B"
fag/m3)0.898946
(211.2-1134.5)
8.68E-041.43E-027.81E-042.92E-02
04.71E-027.81E-041.35E-024.34E-04
OH01302\ISCDAT3.Wk3 06:24 PM 03-Mar-92
GERAGHTY & MILLER, INC.

Table 15. Summary of Maximum Potential Source ImpactAluminum Company of AmericaDavenport, Iowa
Volatile Organic Compounds
ISCLT PredictedMaximum On-Site
Annual AverageCombined Sources
Average Mass Emission Rates(ug/m3')
ISCLT PredictedMaximum Perimeter
Annual AverageCombined Sources
Average Mass Emission Rates
Maximum Impact Coordinates (m)
BromodichloromethaneChloroform1,1-Dichloroethane1,2-Dichloroethene (total)1,1,2,2 -TetrachloroethaneTetrachloroetheneTolueneTrichloroetheneVinyl chloride
(900, -700)
3.40E-025.61E-013.06E-021.15E+005.18E-022.32E+003.06E-025.31E-017.74E-02
(211.2, -1134.5)
2.02E-033.33E-021.82E-036.80E-023.73E-031.43E-011.82E-033.15E-025.36E-03
OH01302VSCDAT3.WK3 06:24 PM 03-Mar-92
GERAGHTY & MILLER, INC.

TABLE 16CANCER RISK ESTIMATES FOR AN ADULT RESIDENT AND SITE WORKER,
POINT OF MAXIMUM IMPACT, AIR EMISSIONS
Constituent
Bromodi chl oromethane*
Chloroform
1,1-Dichloroethane
1 , 1 , 2 , 2-Tet rachl oroethane
Tetrachl oroethene
Trichloroethene
Vinyl Chloride
Maximum AverageAnnual Concentration (ug/m3)
Site Border On Site
2.02E-03
3.33E-02
1.82E-03
3.73E-03
1.43E-01
3.15E-02
5.36E-03
3.40E-02
5.61E-01
3.06E-02
5.18E-02
2.32E+00
5.31E-01
7.74E-02
Slope
Factor
0.13
0.081
„._
0.2
0.0018
0.017
0.295
Exposure Dose
Resident Worker
1.68E-07
2.77E-06__
3.10E-07
1.19E-05
2.62E-06
8.91E-07
2.38E-06
3.92E-05__
3.62E-06
1.62E-04
3.71E-05
5.41E-06
Total Risk
Cancer Risk
Resident Worker
2E-08
2E-07
6E-08
2E-08
4E-08
3E-07
6E-07
3E-07
3E-06
7E-07
7E-07
6E-07
2E-06
7E-06
Notes:
- - Slope Factor not Available.* = Oral Slope Factor Used.
alco«r«v\t«bl«. U
GERAGHTY & MILLER, INC.

TABLE 17HAZARD QUOTIENTS AND HAZARD INDEX FOR AN ADULT RESIDENTAND SITE WORKER, POINT OF MAXIMUM IMPACT. AIR EMISSIONS
Constituent
Bromodi chl oromethane*
Chloroform
1,1-Dtchloroethane**
1,2-Dichloroethene*
1,1,2, 2-Tetrachl oroethane
Tetrachl oroethene
Tol uene**
Trichloroethene
Vinyl Chloride
Maximum AverageAnnual Concentration (ug/m3)
Site Border On Site
2.02E-03
3.33E-03
1.82E-03
6.80E-03
3.73E-03
1.43E-01
1.82E-03
3.15E-03
5.36E-03
3.40E-02
5.61E-01
3.06E-03
1.15E+00
5.18E-02
2.32E+00
3.06E-02
5.31E-01
7.74E-02
Slope
Factor
0.02
0.0014
0.1
0.01
0.1
0.0017
0.57
0.0005
0.0004
Exposure Dose
Resident Worker
3.92E-07
6.46E-07
3.53E-07
1.32E-06
7.24E-07
2.77E-05
3.53E-07
6.11E-07
2.08E-06
6.65E-06
1.10E-04
5.99E-07
2.25E--4
1.01E-05
4.54E-04
5.99E-06
1.04E-04
1.51E-05
HI
Cancer Risk
Resident Worker
2E-05
5E-04
4E-06
1E-04
7E-06
2E-02
6E-07
1E-03
5E-03
2E-02
3E-04
8E-02
6E-06
2E-02
1E-04
3E-01
1E-06
2E-01
4E-02
6E-01
Notes:
* = Oral RfD.** = Inhalation RfD (all other Rfds were derived from the ATSDR lexicological profiles).
GERAGHTY & MILLER, INC.

Table 18. Exposure to Onsite Workers, Air Releases from the Water Reclamation FacilityComparison of Two Sampling and Modeling EventsAlcoa-Davenport Works, Riverdale.lowa
alcoa\wrf-comp.wk1
Constituent
BromodichloromethaneChloroform1,1-Dichloroethane1,2-Dfchloroethene1 ,1 ,2,2-TetrachloroethaneTetrachloroetheneTolueneTrlchloroetheneVinyl Chloride
Total
Maximum ContaminantConcentration at the WaterReclamation Facility (ug/l)
1989 19913 6
33 702 3
12 78ND 6
500 160ND 514 3816 7
580.00 373.00
Maximum Mass ofContaminants (pounds/day)
1989 Aug/1991@12,000gpm @15,300gpm
0.43 1 .084.77 12.640.29 0.541.73 14.090.00 1 .08
72.25 28.900.00 0.902.02 6.862.31 1.26
83.80 67.37
Modelling Predicted Maximum On-SlteAnnual Average Combined Sources
Average Mass Emission Rates (ug/m3)1989 1991
0.037 0.0340.23 0.561
0.016 0.03060.15 1.15
NA 0.05184.3 2.32NA 0.0306
0.16 0.5310.17 0.0774
RiskEsCancer Effects
1989 19919.0E-09 3E-075.8E-08 3E-064.6E-09 NA
NA NANA 7E-07
4.4E-08 7E-07NA NA
8.3E-09 6E-071.6E-07 2E-06
Total Cancer Risk2.8E-07 7E-06
rtimatesThreshold Effects
1989 19912.2E-05 3E-041.3E-04 8E-029.4E-07 6E-068.7E-05 2E-02
NA 1E-042.5E-03 3E-01
NA 5E-051.2E-04 2E-017.6E-04 4E-02
Hazard Index3.6E-03 6E-01
Note: The 1989 modeling was based on the assumption that the contaminant source (production wells) were active only six months during the yearwhen cooling water was needed. Since that time Alcoa has operated production well PW-6 continuously. Therefor the 1991 modeling was for a year round source.
GERAGHTY & MILLER, INC.

IIIII• APPENDIX A
GEP PROGRAM DESCRIPTION
I
I
I
I
I
I
I
I
I
I
I
I

II
GEP Program Description
The Bowman Environmental Engineering (BEE) GEP program calculates direction-specificbuilding heights and widths. A maximum of 20 buildings and 100 stacks may be analyzed.The user must enter the location and height of each building and stack to be analyzed.I
I
I
I
I
I
I
I
I
I
I
I
I
I
I
Program Algorithm.
Step 1 - Determining "Nearby Buildings.
The GEP program determines the stacks that are "nearby" buildings. Nearbyis defined as five times the lessor of building height or projected cross-windwidth (5L). The GEP program can calculate cross-wind projection either: (1)based on all wind directions; or, (2) based on only downwind directions. Ifa stack is not within 5L (nearby) of a building, zeros are written to thesource card (card type 6,1 in ISCST; card type 17 in ISCLT). If a stack iswithin 5L of only one building, the building height and 0.88623 times thecross-wind projection is written to the source card. If a stack is within 5Lof more than one building, the building height and 0.88623 times the cross-wind projection of the building with the greatest calculated GEP height iswritten to the source card. (Aside: the ISC models calculate an equivalentdiameter using the source card building parameters. This equivalentdiameter is used as the cross-wind projection within the ISC models. Inorder to "force" the model to use the actual cross-wind projection, a valueof 0.88623 times the actual cross-wind projection must be entered. Thisvalue is entered as both the width and length in ISCST and as width inISCLT. The constant 0.88623 converts the actual cross-wind projection(equivalent diameter) to a side length of a square. Note: the square root ofpi/4 = 0.88623)
Step 2 — Determining Direction-Specific Building Dimensions.
If a stack is not nearby a building as determined in Step 1, zeros are writtento the direction-specific cards (card type 6,4a-b in ISCST and card type 17ca-b in ISCLT). The GEP program loops through each wind-direction sector(36 sectors for ISCST or 16 sectors for ISCLT) and determines the wakearea around each building. This wake area is defined as a rectangle 5LBdownwind, 2LB upwind, and 0.5LB to either side of each building. The GEP

IIIIIIIIIIIIIIIIII
program can calculate the cross-wind projection based on either: (1) themaximum projection for all flow vectors within the sector; or, (2) the mid-sector vector only. A sector is defined as the mid-sector vector +/- one halfsector width (e.g. A mid-sector vector of 40 degrees in ISCST represents asector from 35 degrees to 45 degrees). If a stack is not within the wake areaof any building, zeros are written ,to the direction-specific card for this flowvector. If a stack is within the wake area of only one building, the buildingheight and cross-wind projection isf written to the direction-specific card. Ifa stack is within the wake of more than one building, the building height andcross-wind projection of the buildirig with the greatest calculated GEP heightfor this sector is written to the direction-specific card.
Table of Results. The GEP program produces a table that contains the GEP height foreach stack and the buildings that influence each stack. This table also contains the actualdistance from each stack to each building and the distance of influence of each stack-building combination.
GEP Graphics Output. The GEP program can produce a figure showing the buildings,stacks and wake areas. The user may select to show wake areas for a single flow vectoror for multiple flow vectors.

IIIIIIIIIIIIIIIIIII
GEP Table
Geraghty & Hi Her Engineers Inc.
Input DataFile Name: ALCOA.TAB
Date: 9-10-1991
Model: ISCLT
Wake Area Section Option: Maximum of all directions within sector.
Wake Area Shape Option: Building edge moved 2L upwind& 5L downwind.
Combine Structures: Combine buildings and tanks withinone "L" crosswind and 5.00 "L"upwind-downwind of each other.
Number of Buildings: 3
Number of Tanks: 0
Number of Stacks: 3
Plant Rotation Angle: .000%

1111111111111111111
Input Data <cont.)
Building No. 7Name: Foil MillHeight: 60
Corner East (FT)
1 1951.342 2031.663 2031.66^ 2151.745 2151.746 2313.167 2313.168 2474.589 2474.5810 2636.0011 2636.0012 2695.0613 2695.0614 2655.6815 2655.6816 2175.3617 2175.3618 1955.3619 1951.34
.00 (FT)
North (FT)
-2100.13-2100.13-2064.69-2064.69-2100.13-2100.13-2064.69-2064.69-2100.13-2100.13-2389.51-2389.11-2539.11-2539.11-2739.89-2739.89-2700.51-2700.51-2100.13
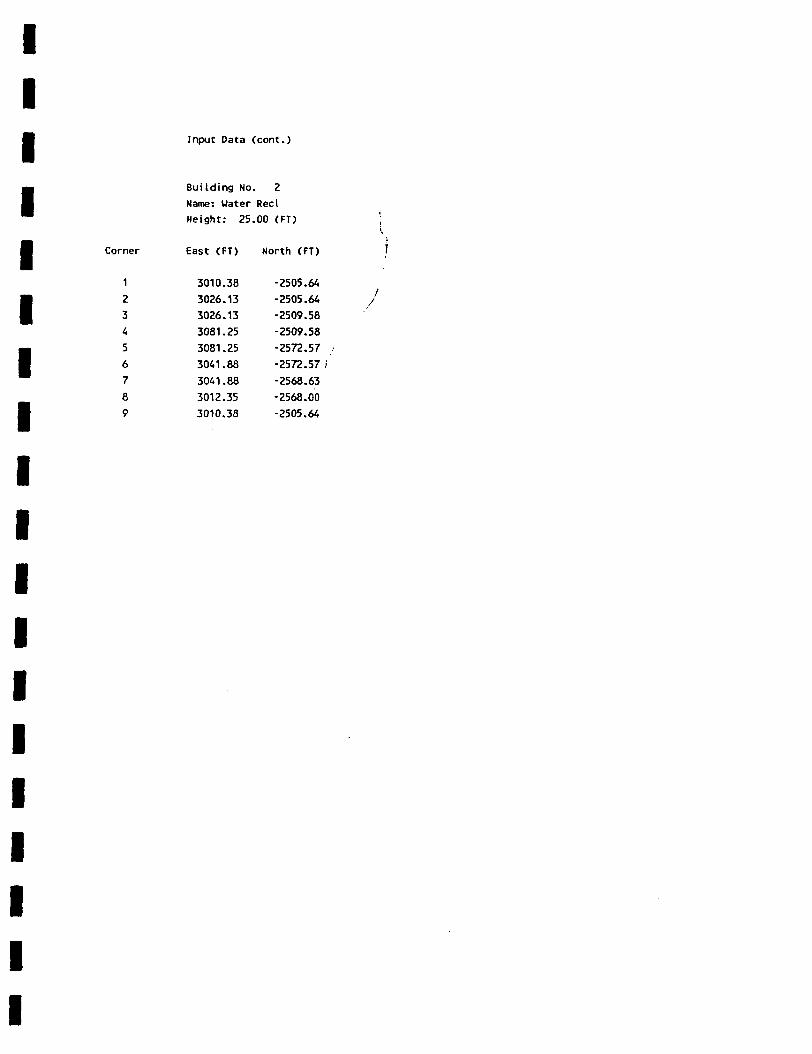
IIIIIIIIIIIIIIIIIII
Input Data (cont.)
Building No. 2Name: Water ReelHeight: 25.00 (FT) ';
v.
Corner East (FT) North (FT)
1 3010.38 -2505.642 3026.13 -2505.64 /3 3026.13 -2509.584 3081.25 -2509.585 3081.25 -2572.57 /6 3041.88 -2572.57;7 3041.88 -2568.638 3012.35 -2568.009 3010.38 -2505.64

1111111111111111111
Input Data (cont.)
Building No. 3Name: UnknownHeight: 17.00 (FT)
Corner East (FT) North (FT)
1 2943.43 -2548.902 2994.61 -2548.903 2994.61 -2564.654 2943.43 -2564.655 2943.43 -2548.90

Input Data (cont.)
Stack Parameters
Stack Height . . . . . . Location .. . . . . . v_No. (FT) East (FT) North (FT) j
IIH
_
•
1 17.00 2959.17 -2521.39
12 17.00 2959.17 -2533.24 J3 17.00 2992.66 -2647.37
I
I
I
I
I
I
I
I
I
I
I
I
I

IIIII
III/
Iijiiii
GEP Table
Geraghty & Miller Engineers Inc.
STACK ID 01
critical
Flow Vector
(deg)
-11.25
11.2548.50
73.00
101.25
116.50
131.00
152.50
168.75
191.25
228.50
253.00
258.75
303.75
326.25
326.75
utf stacic
Height
(FT)
42.500
42.500
62.500
62.500
150.000
150.000
62.500
42.500
42.500
42.500
62.500
62.500
62.500
62.500
62.500
62.500
Name-1
Uate
Uate
Foil
Foil
Foil
Foil
Foil
Foil
Uate
Uate
Foil
Foil
Foil
Foil
Foil
Foil
controlling :
Name-2
Unkn ;Unkn
Uate
Uate
Uate
Unkn
Unkn
Unkn
Uate
Uate
Uate
Uate
Uate
Uate
acrucLUF*
Height
(FT)
17.000
17.000
25.000
25.000
60.000
60.000
25.000
17.000
17.000
17.000
25.000
25.000
25.000
25.000
25.000
25.000
:s
Projected
Width (FT)
145.915
139.790
1102.536
828.139
724.901
841.004
899.655
991.831
145.916
139.790
1102.537
828.140783.964
877.343
1042.217
1046.250

IIIIIIIIIIIII
GEP Table
Geraghty & Miller Engineers Inc.
STACK ID 02
uri i icai
Flow Vector
(deg)
-11.25
11.2546.50
61.75101.25118.25146.25
152.50168.75
191.25
228.50
241.75258.75
303.00326.25
326.75
btr btacK
Height(FT)
42.500
42.500
42.50062.500150.000150.000
42.500
42.50042.500
42.500
62.500
62.500
62.500
62.500
62.50062.500
Name-1
Uate
UateFoilFoilFoilFoil
Foil
Foil
Uate
UateFoil
FoilFoil
FoilFoil
Foil
control line
Name- 2
Unkn
UnknUnkn
Uate
UnknUnkn
Unkn
Unkn
Uate
Uate
Uate
Uate
UateUate
1 airuuiuni
Height(FT)
;' 17.000
17.000
17.00025.000
60.00060.000
17.00017.000
17.000
17.000
25.000
25.000
25.000
25.00025.00025.000
as .
Projected
Uidth (FT)
145.915
139.790
1055.089950.974
724.901
851.032
948.335991.831
145.916139.790
1102.537
950.976783.964
874.2261042.217
1046.250

IIIIIIIIIII
GEP Table
Geraghty & Killer Engineers Inc.
STACK ID 03
Critical GEP Stack -- Controlling Structure^Flow Vector Height Height / Projected
(deg) (FT) Name-1 Name-2 (FT) Width (FT)
.00 No structure within 5L22.50 No structure within 5L45.00 No structure within 5167.50 No structure within 5L90.00 No structure within 5L112.50 No structure within 5L135.00 No structure within 5L166.75 42.500 Wate Unkn 17.000 U6.773191.25 62.500 Wate 25.000 82.566213.75 62.500 Wate 25.000 96.111228.50 62.500 Foil Wate 25.000 1102.537247.50 No structure within 5L270.00 No structure within 5L292.50 No structure within 5L315.00 No structure within 5L337.50 No structure within 5L

IIIII• APPENDIX B
ISCLT DISPERSION MODELING OUTPUT
I
I
I
I
I
I
I
I
I
I
I
I

IIIIIIIIIIiiIiiiiii
ISCLT - VERSION DATED 90008
BOVMAN ENVIRONMENTAL ENGINEERING VERSION 6.94
SESSION INFORMATION
INPUT DATA FILE NAME : ALC.DTA
OUTPUT LIST FILE NAME : ALC.LST
MASTER GRAPHICS FILE NAME : ALC.GRF

I'*** ISCLT ************* Alcoa Davenport Works - Water Reclamation Faclility Modeling - 1991
• - ISCLT INPUT DATA -
******** PAGE 1 ****
I
I
I
1
I
I
I
I
I
NUMBER OF SOURCES = 3NUMBER OF X AXIS GRID SYSTEM POINTS = 41NUMBER OF Y AXIS GRID SYSTEM POINTS = 41NUMBER OF SPECIAL POINTS = 10NUMBER OF SEASONS = 1NUMBER OF WIND SPEED CLASSES = 6NUMBER OF STABILITY CLASSES = 6NUMBER OF WIND DIRECTION CLASSES = 16FILE NUMBER OF DATA FILE USED FOR REPORTS = 1THE PROGRAM IS RUN IN RURAL MODECONCENTRATION (DEPOSITION) UNITS CONVERSION FACTOR = .10000000E+07ACCELERATION OF GRAVITY (METERS/SEC**2) = 9.800HEIGHT OF MEASUREMENT OF WIND SPEED (METERS) = 10.000CORRECTION ANGLE FOR GRID SYSTEM VERSUS DIRECTION DATA NORTH (DEGREES) = .000DECAY COEFFICIENT = .OOOOOOOOE+00PROGRAM OPTION SWITCHES =1, 1, 1, 0. 0, 3, 2, 3, 3, 2, 1, 0, 0, 0, 0, 0, 0, 0, 0, 1ALL SOURCES ARE USED TO FORM SOURCE COMBINATION 1DISTANCE X AXIS GRID SYSTEM POINTS (METERS )= 2000.00, 1900.00, 1800.00,
1400.00. 1300.00, 1200.00, 1100.00, 1000.00, 900.00, 800.00,400.00, 300.00, 200.00, 100.00,-600.00, -700.00, -800.00, -900.00,-1600.00, -1700.00, -1800.00, -1900.00,
DISTANCE X SPECIAL DISCRETE POINTS (METERS )=564.50, 542.80. 211.20, 58.20,
DISTANCE Y AXIS GRID SYSTEM POINTS (METERS )= 2000.00. 1900.00, 1800.00,1400.00, 1300.00, 1200.00, 1100.00, 1000.00, 900.00, 800.00,400.00, 300.00, 200.00, 100.00, .00, -100.00,-600.00, -700.00, -800.00, -900.00, -1000.00, -1100.00,-1600.00, -1700.00, -1800.00. -1900.00. -2000.00,
DISTANCE Y SPECIAL DISCRETE POINTS (METERS )= -26.90, 281.30,-1265.00, -1184.00, -1134.50, -402.00,
0, 0. 1. 1, 0,
.00,-1000.00,-2000.00,14.30, 1600.10,
-100.00,-1100.00,
-200.00,-1200.00,
1700.00,700.00,-300.00,-1300.00,
1600.00,600.00,-400.00,-1400.00,
1500.00,500.00,-500.00,-1500.00,
1725.80, 1948.70, 1948.70, 1430.60,
-200.00,-1200.00,
-23.50,
1700.00.700.00,-300.00,-1300.00,
1600.00.600.00,-400.00,-1400.00.
1500.00.500.00,-500.00,-1500.00,
-23.50, -667.40, -983.60,
I
I
I
- AMBIENT AIR TEMPERATURE (DEGREES KELVIN) -
STABILITY STABILITY STABILITY STABILITY STABILITY STABILITYCATEGORY 1 CATEGORY 2 CATEGORY 3 CATEGORY 4 CATEGORY 5 CATEGORY 6
SEASON 1 293.0000 293.0000 293.0000 293.0000 293.0000 293.0000
- MIXING LAYER HEIGHT (METERS) -
STABILITY CATEGORY 1
KILITY CATEGORY 2ILITY CATEGORY 3ILITY CATEGORY 4
fBILITY CATEGORY 5BILITY CATEGORY 6
WIND SPEEDCATEGORY 1.180000E+04.120000E+04.120000E+04.120000E+04.100000E+05.100000E+05
WIND SPEEDCATEGORY 2.180000E+04.120000E+04.120000E+04.120000E+04.100000E+05.100000E+05
SEASON 1WIND SPEEDCATEGORY 3.180000E+04.120000E+04.120000E+04.120000E+04.100000E+05.100000E+05
WIND SPEEDCATEGORY 4.180000E+04.120000E+04.120000E+04.120000E+04.100000E+05.100000E+05
WIND SPEEDCATEGORY 5.180000E+04.120000E+04.120000E+04.120000E+04.100000E+05.100000E+05
WIND SPEEDCATEGORY 6.180000E+04.120000E+04.120000E+04.120000E+04.100000E+05.100000E+05
II

1-***
111.1•.
1•
1
ISCLT ************* Alcoa Davenport Works - Water Reclamation Faclility Modeling - 1991
- ISCLT INPUT DATA (CONT.) -
- FREQUENCY OF OCCURRENCE OF WIND SPEED, DIRECTION AND STABILITY -
SEASON 1
STABILITY CATEGORY 1
WIND SPEED WIND SPEED WIND SPEED WIND SPEED WIND SPEED WIND SPEED
DIRECTION
(DEGREES).000
22.50045.00067.50090.000112.500135.000157.500
180.000
202.500225.000
247.500
270.000
292.500315.000
337.500
CATEGORY 1
( 1.5000MPSM
.00017300
.00011800
.00000000
.00011800
.00029000
.00000000
.00005900
.00005900
.00020200
.00003000
.00026100
.00005900
.00005900
.00000000
.00014400
.00116000
CATEGORY 22.5000MPS)(
.00011400
.00045600
.00000000
.00045600
.00057000
.00000000
.00022800
.00022800
.00022800
.00011400
.00045600
.00022800
.00022800
.00000000
.00000000
.00352999
CATEGORY 3
4.3000HPS)(
.00000000
.00000000
.00000000
.00000000
.00000000
.00000000
.00000000
.00000000
.00000000
.00000000
.00000000
.00000000
.00000000
.00000000
.00000000
.00045600
SEASON 1
CATEGORY 46.8000MPSX
.00000000
.00000000
.00000000
.00000000
.00000000
.00000000
.00000000
.00000000
.00000000
.00000000
.00000000
.00000000
.00000000
.00000000
.00000000
.00000000
CATEGORY 5 CATEGORY 6
9.5000MPS)(12.5000HPS)
.00000000
.00000000
.00000000
.00000000
.00000000
.00000000
.00000000
.00000000
.00000000
.00000000
.00000000
.00000000
.00000000
.00000000
.00000000
.00000000
.00000000
.00000000
.00000000
.00000000
.00000000
.00000000
.00000000
.00000000
.00000000
.00000000
.00000000
.00000000
.00000000
.00000000
.00000000
.00000000
STABILITY CATEGORY 2
I•
I•
1
1
DIRECTION
(DEGREES).000
22.50045.00067.50090.000
112.500
135.000157.500
180.000
202.500
225.000
247.500
270.000
292.500315.000337.500
WIND SPEEDCATEGORY 1
( 1.5000MPSM
.00021900
.00025800
.00085600
.00071300
.00101700
.00045700
.00047600
.00077100
.00042900
.00038100
.00160600
.00039100
.00027700
.00003900
.00006700
.00025500
WIND SPEEDCATEGORY 2
2.5000MPSX
.00113900
.00159400
.00284699
.00113900
.00182200
.00102500
.00125300
.00330199
.00216400
.00159400
.00295999
.00170800
.00182200
.00045600
.00079700
.00113900
WIND SPEEDCATEGORY 3
4.3000MPSX
.00057000
.00113900
.00193600
.00239099
.00136700
.00011400
.00057000
.00307399
.00136700
.00091100
.00216400
.00170800
.00148000
.00102500
.00045600
.00330199
WIND SPEEDCATEGORY 4
6.8000MPSX
.00000000
.00000000
.00000000
.00000000
.00000000
.00000000
.00000000
.00000000
.00000000
.00000000
.00000000
.00000000
.00000000
.00000000
.00000000
.00034200
WIND SPEEDCATEGORY 5
WIND SPEEDCATEGORY 6
9.5000MPS)(12.5000MPS)
.00000000
.00000000
.00000000
.00000000
.00000000
.00000000
.00000000
.00000000
.00000000
.00000000
.00000000
.00000000
.00000000
.00000000
.00000000
.00000000
.00000000
.00000000
.00000000
.00000000
.00000000
.00000000
.00000000
.00000000
.00000000
.00000000
.00000000
.00000000
.00000000
.00000000
.00000000
.00000000
******** PAGE

1-***
111
1•
I•
1
ISCLT ************* Alcoa Davenport Works - Water Reclamation Faclility Modeling - 1991
- ISCLT INPUT DATA (CONT.) -
- FREQUENCY OF OCCURRENCE OF WIND SPEED, DIRECTION AND STABILITY -
SEASON 1
STABILITY CATEGORY 3
WIND SPEED WIND SPEED WIND SPEED WIND SPEED WIND SPEED WIND SPEED
DIRECTION
(DEGREES).000
22.500
45.000
67.500
90.000
112.500135.000157.500180.000
202.500225.000247.500
270.000
292.500
315.000337.500
CATEGORY 1
( 1.5000MPSX
.00010200
.00020400
.00030600
.00097800
.00114200
.00019100
.00030600
.00059800
.00030600
.00045800
.00090200
.00057100
.00035700
.00002600
.00002600
.00038600
CATEGORY 2
2.5000MPSX
.00091100
.00068400
.00159400
.00307399
.00227700
.00057000
.00159400
.00307399
.00159400
.00182200
.00352999
.00170800
.00205000
.00022800
.00022800
.00364299
CATEGORY 3
4.3000MPSX
.00193600
.00182200
.00443999
.00295999
.00330199
.00136700
.00182200
.01024598
.00739998
.00455399
.00739998
.00466799
.00614799
.00227700
.00216400
.00933598
SEASON 1
CATEGORY 4
6.8000MPSX
.00045600
.00034200
.00079700
.00045600
.00022800
.00079700
.00045600
.00273299
.00193600
.00136700
.00216400
.00091100
.00091100
.00022800
.00034200
.01138498
CATEGORY 5 CATEGORY 6
9.5000MPSX12.5000MPS)
.00000000
.00000000
.00000000
.00000000
.00000000
.00000000
.00000000
.00011400
.00000000
.00011400
.00011400
.00000000
.00000000
.00000000
.00022800
.00034200
.00000000
.00000000
.00000000
.00000000
.00000000
.00000000
.00000000
.00000000
.00000000
.00000000
.00000000
.00000000
.00000000
.00000000
.00000000
.00000000
STABILITY CATEGORY 4
I•
_
•™
1
1
DIRECTION
(DEGREES).000
22.500
45.00067.500
90.000112.500135.000157.500180.000
202.500225.000
247.500
270.000
292.500
315.000
337.500
WIND SPEEDCATEGORY 1
( 1.5000MPSX
.00023800
.00017300
.00064600
.00048500
.00065500
.00007500
.00049800
.00067100
.00027100
.00055600
.00105400
.00087300
.00047500
.00009100
.00060400
.00000000
WIND SPEEDCATEGORY 2
2.5000MPSX
.00159400
.00239099
.00387099
.00500999
.00398499
.00102500
.00182200
.00421299
.00205000
.00261899
.00443999
.00193600
.00318799
.00125300
.00159400
.00136700
WIND SPEEDCATEGORY 3
4.3000MPSX
.00250499
.00330199
.01035998
.00865298
.00865298
.00671699
.00694499
.01707696
.00614799
.00626199
.00887998
.00796998
.01263697
.00523699
.00398499
.00443999
WIND SPEEDCATEGORY 4
6.8000HPSX
.00216400
.00523699
.00944898
.01024598
.00990498
.00808298
.00865298
.03722692
.01992296
.01309197
.01832896
.02823394
.04439890
.01571097
.01035998
.00000000
WIND SPEEDCATEGORY 5
WIND SPEEDCATEGORY 6
9 . 5000MPS ) ( 1 2 . 5000MPS )
.00000000
.00045600
.00079700
.00091100
.00045600
.00159400
.00205000
.00648999
.00261899
.00182200
.00683099
.01104298
.01810196
.00443999
.00170800
.00000000
.00000000
.00000000
.00000000
.00022800
.00045600
.00011400
.00000000
.00148000
.00022800
.00011400
.00341599
.00535099
.00557899
.00102500
.00045600
.00000000
******** PAGE 3 ***

1**
11.i•
1
ISCLT ************* Alcoa Davenport Works - Water Reclamation Faclility Modeling - 1991
- ISCLT INPUT DATA (CONT.) -
- FREQUENCY OF OCCURRENCE OF WIND SPEED, DIRECTION AND STABILITY -
SEASON 1
STABILITY CATEGORY 5
WIND SPEED WIND SPEED WIND SPEED WIND SPEED WIND SPEED WIND SPEED
DIRECTION(DEGREES)
.00022.50045.000
67.500
90.000112.500
135.000
157.500
180.000202.500225.000
247.500270.000
292.500315.000
337.500
CATEGORY 1
( 1.5000MPSX
.00000000
.00000000
.00000000
.00000000
.00000000
.00000000
.00000000
.00000000
.00000000
.00000000
.00000000
.00000000
.00000000
.00000000
.00000000
.00340499
CATEGORY 22.5000HPSX
.00034200
.00102500
.00330199
.00819698
.00478199
.00113900
.00261899
.00637599
.00148000
.00193600
.00364299
.00182200
.00182200
.00136700
.00034200
.00295999
CATEGORY 3
4.3000MPSX
.00034200
.00068400
.00205000
.00352999
.00432699
.00273299
.00261899
.01354797
.00569299
.00489599
.00717298
.00956298
.01309197
.00671699
.00295999
.00000000
SEASON 1
CATEGORY 46.8000MPSX
.00000000
.00000000
.00000000
.00000000
.00000000
.00000000
.00000000
.00000000
.00000000
.00000000
.00000000
.00000000
.00000000
.00000000
.00000000
.00000000
CATEGORY 5 CATEGORY 6
9.5000MPSX12.5000MPS)
.00000000
.00000000
.00000000
.00000000
.00000000
.00000000
.00000000
.00000000
.00000000
.00000000
.00000000
.00000000
.00000000
.00000000
.00000000
.00000000
.00000000
.00000000
.00000000
.00000000
.00000000
.00000000
.00000000
.00000000
.00000000
.00000000
.00000000
.00000000
.00000000
.00000000
.00000000
.00000000
STABILITY CATEGORY 6
1•
1•
1
1
DIRECTION
(DEGREES).000
22.500
45.00067.500
90.000112.500
135.000157.500180.000202.500225.000
247.500
270.000
292.500
315.000
337.500
WIND SPEEDCATEGORY 1
( 1.5000MPSX
.00118100
.00194800
.00571299
.01841296
.01185798
.00313899
.00495799
.01363397
.00486299
.00707198
.01243497
.00442999
.00372399
.00064200
.00106700
.00000000
WIND SPEEDCATEGORY 2
2.5000MPSX
.00159400
.00148000
.00489599
.01536897
.00739998
.00159400
.00352999
.01149898
.00443999
.00614799
.01400297
.00683099
.00557899
.00148000
.00170800
.00000000
WIND SPEEDCATEGORY 3
4.3000MPSX
.00000000
.00000000
.00000000
.00000000
.00000000
.00000000
.00000000
.00000000
.00000000
.00000000
.00000000
.00000000
.00000000
.00000000
.00000000
.00000000
WIND SPEEDCATEGORY I*
6.8000HPSX
.00000000
.00000000
.00000000
.00000000
.00000000
.00000000
.00000000
.00000000
.00000000
.00000000
.00000000
.00000000
.00000000
.00000000
.00000000
.00000000
WIND SPEEDCATEGORY 5
WIND SPEEDCATEGORY 6
9 . 5000MPS X 1 2 . 5000MPS )
.00000000
.00000000
.00000000
.00000000
.00000000
.00000000
.00000000
.00000000
.00000000
.00000000
.00000000
.00000000
.00000000
.00000000
.00000000
.00000000
.00000000
.00000000
.00000000
.00000000
.00000000
.00000000
.00000000
.00000000
.00000000
.00000000
.00000000
.00000000
.00000000
.00000000
.00000000
.00000000
******** PAGE 4 **

I•*** ISCLT ************* Alcoa Davenport Works - Water Reclamation Faclility Modeling - 1991
• - ISCLT INPUT DATA (CONT.) -
I
I
I
I
I
I
I
I
I
I
I
I
I
- VERTICAL POTENTIAL TEMPERATURE GRADIENT (DEGREES KELVIN/METER) -
(ABILITY CATEGORY 1STABILITY CATEGORY 2
KILITY CATEGORY 3ILITY CATEGORY 4ILITY CATEGORY 5
STABILITY CATEGORY 6
STABILITY CATEGORY 1
(ABILITY CATEGORY 2ABILITY CATEGORY 3ABILITY CATEGORY 4
STABILITY CATEGORY 5VABILITY CATEGORY 6
WIND SPEEDCATEGORY 1.0000005+00.OOOOOOE+00.OOOOOOE+00
.OOOOOOE+00
.200000E-01
.350000E-01
WIND SPEEDCATEGORY 1.700000E-01.700000E-01.100000E+00.150000E+00.350000E+00.550000E+00
WIND SPEEDCATEGORY 2.OOOOOOE+00
.OOOOOOE+00
.OOOOOOE+00
.OOOOOOE+00
.200000E-01
.350000E-01
- WIND
WIND SPEEDCATEGORY 2.700000E-01.700000E-01.100000E+00.150000E+00.350000E+00.550000E+00
WIND SPEEDCATEGORY 3.OOOOOOE+00.OOOOOOE+00.OOOOOOE+00.OOOOOOE+00.200000E-01.350000E-01
WIND SPEEDCATEGORY 4.OOOOOOE+00.OOOOOOE+00.OOOOOOE+00.OOOOOOE+00.200000E-01.350000E-01
WIND SPEEDCATEGORY 5.OOOOOOE+00.OOOOOOE+00.OOOOOOE+00.OOOOOOE+00.200000E-01.350000E-01
WIND SPEEDCATEGORY 6.OOOOOOE+00.OOOOOOE+00.OOOOOOE+00
.OOOOOOE+00
.200000E-01
.3SOOOOE-01
PROFILE POWER LAW EXPONENTS -
WIND SPEEDCATEGORY 3.700000E-01.700000E-01.100000E+00.150000E+00.350000E+00.550000E+00
WIND SPEEDCATEGORY 4.700000E-01.700000E-01.100000E+00.150000E+00.350000E+00.550000E+00
WIND SPEEDCATEGORY 5.700000E-01.700000E-01.100000E+00.150000E+00.3SOOOOE+00.550000E+00
WIND SPEEDCATEGORY 6.700000E-01.700000E-01.100000E+00.150000E+00.350000E+00.5SOOOOE+00
******** PAGE 5 **

I-•*<
I-*** ISCLT ************* Alcoa Davenport Works - Water Reclamation Faclility Modeling - 1991
- SOURCE INPUT DATA -
******** PAGE 6 ****
K SOURCE SOURCE X Y EMISSION BASE /NUMBER TYPE COORDINATE COORDINATE HEIGHT ELEV- /
. P (M) (H) (M) ATION /- SOURCE DETAILS DEPENDING ON TYPE -
I
IIIIIIIIIIIII
1 STACK 901.96 -768.52 5.18 .00 GAS EXIT TEMP (DEC K)= 294.26, GAS EXIT VEL. (M/SEC>= 3.05,
STACK DIAMETER (H)= 7.833, HEIGHT OF ASSO. BLDG. (M)= -5.18, WIDTH OFASSO. BLDG. (H)= 16.59, WAKE EFFECTS FLAG = 0
- DIRECTION SPECIFIC BUILDING DIMENSIONS -
:TOR15913
DSBH
5.2.7.6.5.2.18.3,
DSBU
44.5.239.0.44.5.220.9,
I WAKE0000
SECTOR
261014
DSBH
5.2.7.6,5.2,18.3,
DSBW42.6,267.4,42.6,256.3,
I WAKE0000
SECTOR37
1115
DSBH
7.6.7.6,7.6.7.6.
DSBW
336.0.317.7,336.0,274.2,
I WAKE0000
SECTOR481216
DSBH7.6,7.6.7.6.5-2,
DSBW252.4,
318.9,252.4,
302.3,
I WAKE0000
SOURCE STRENGTHS ( GRAMS PER SEC
SEASON 1 SEASON 2 SEASON1.00000E+00
SEASON 4
RNING - HW/HB > 5 FOR SOURCE
1. 2, 3, 4,
1 PROG. USES LATERAL VIRTUAL DIST. FOR UPPER BOUND OF CONCENTRATION (DEPOSITION) IN SECTOR(S):
5, 6, 7, 8, 9, 10, 11, 12, 13, 14, 15, 16.
LOWER BOUND IS DESIRED SET THE DIRECTION SPECIFIC BUILDING HEIGHT TO < 0 (WAKE EFFECTS FLAG) AND RERUN.
RNING - DISTANCE BETWEEN SOURCE 1 AND POINT X,Y= 900.00, -800.00 IS LESS THAN PERMITTED FOR SECTOR(S):14,

I*** ISCLT ************* Alcoa Davenport Works - Water Reclamation Faclility Modeling - 1991 ******** PAGE 7 ****
I** ANNUAL GROUND LEVEL CONCENTRATION ( MICROGRAHS PER CUBIC HETER
- GRID SYSTEM RECEPTORS -• - X AXIS (DISTANCE, METERS) -• 2000.000 1900.000 1800.000 1700.000 1600.000AXIS (DISTANCE , METERS ) - CONCENTRATION -
) DUE TO SOURCE 1
1500.000 UOO.OOO 1300.000 1200.000
1
1•
1•
1•
I•
-2000.000-1900.000-1800.000-1700.000-1600.000-1500.000-UOO.OOO-1300.000-1200.000-1100.000-1000.000-900.000-800.000-700.000-600.000-500.000-400.000-300.000-200.000-100.000
.000100.000200.000300.000400.000500.000600.000700.000800.000900.0001000.0001100.0001200.0001300.0001400.0001500.0001600.0001700.0001800.0001900.0002000.000
.172522
.179996
.196353
.219516
.245517
.274501
.306488
.341352
.408094
.579165
.762650
.9516161.1381021.1396591.050438.954874.856979.775559.788553.796093.798353.795794.789041.778772.719292.648092.585346.530007.481497.438246.399779.365367.334735.307396.282932.260983.241240.223435.207333.193807.186081
.185389
.194707
.203733
.224248
.253877
.287604
.325667
.365708
.411157
.593698
.8214101.0580241.2927051.2912011.1737701.049086.923190.874747.882697.884538.880739.872012.859182.787771.703313.629785.565702.509739.460734.417938.379991.346225.316238.289611.265893.244702.225710.212929.203937.195469.187495
.199093
.210598
.222124
.233228
.259431
.297912
.342432
.393200
.449974
.594734
.8809531.1833641 .4855421.4748011.3198721.154636.989652.990865.990942.984223.971862.954869.867500.765862.678696.603830.539345.483603.435225.393064.356293.323654.294788.269235.246667.235352.224785.214871.205567.196835.188633
.213551
.227623
.242168
.256782
.270781
.305466
.358090
.419921
.489638
.571601
.9353871.331486.731635.712787.486555.254474.131392.127444.1141271.0956891.071460.961887.837281.732451.644057.569221.505552.451092.404249.363736.328511.297662.275418.261971.249402.237661.226692.216441.206854.197881.189477
.228617
.245651
.263791
.282742
.301898
.320053
.367902
.438446
.530409
.637408
.9699341.5026312.0503502.018115.698687.374430.296538.273651.246641.217209.076323.919855.791413.685668.598106.525096.463760.411844.367583.329590.309775.293962.278851.264777.251679.239500.228168.217613.207772.198588.190006
.244068
.264448
.286780
.310987
.336689
.362392
.380809
.450895
.566854
.708818
.9577911.7043992.4927922.4349171 .9578721.5748231.5228781.4625241 .4009461.2156181.014915.855919.727286.623853.539838.470869.413656.371539.351027.331831.313928.297254.281629.266979.253401.240829.229175.218357.208299.198937.190207
.255958
.283646
.310735
.341138
.374252
.406813
.443431
.479287
.589521
.779597
.9928591 .8676593.0415172.9648702.2507681.9191331.7961491 .6788491.4001571.125945.921240.765923.642766.545891.468740.428204.402527.378668.356572.336140.317260.299814.283684.268524.254523.241614.229688.218650.208416.198911.190067
.238797
.274891
.320695
.372456
.413556
.461507
.516720
.577562
.636878
.8209991.1550192.0166533.9680113.8160742.6487822.3942912.1230891.6741081.275527.992982.790670.643879.541201.504119.470057.438945.410575.384697.361070.339470.319691.301546.284872.269365.255013.241827.229683.218476.208109.198500.189577
.217123
.249373
.290581
.343705
.415012
.513795
.598125
.695550
.815355
.9331411.3054722.0193265.4868975.1993363.5974212.9867702.1432371.4754011.065974.802016.670717.612893.566918.522342.483085.448296.417277.389464.364407.341739.321155.302403.285268.269469.254842.241448.229148.217822.207369.197698.188732
III
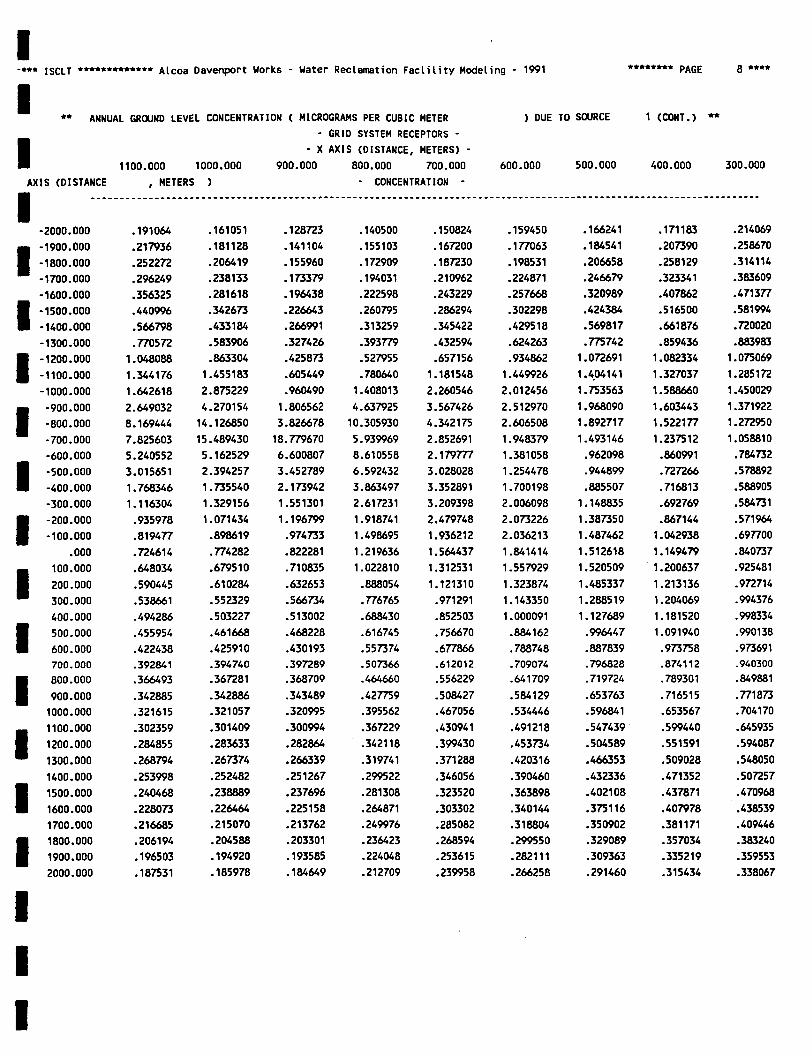
I-*** ISCLT ************* Alcoa Davenport Works - Water Reclamation Faclility Modeling - 1991 ******** PAGE 8 ****
I** ANNUAL GROUND LEVEL CONCENTRATION ( HICROGRAHS PER CUBIC METER
- GRID SYSTEM RECEPTORS -
I - X AXIS (DISTANCE, METERS) -
• 1100.000 1000.000 900.000 800.000 700.000
AXIS (DISTANCE , METERS ) - CONCENTRATION -
) DUE TO SOURCE 1 (CONT.) **
600.000 500.000 400.000 300.000
1
1•
1•
1•
1•
-2000.000
-1900.000
-1800.000
-1700.000
-1600.000-1500.000-1400.000-1300.000-1200.000-1100.000
-1000.000-900.000
-800.000
-700.000
-600.000
-500.000
-400.000
-300.000
-200.000
-100.000
.000
100.000
200.000
300.000
400.000
500.000
600.000
700.000
800.000
900.000
1000.000
1100.0001200.000
1300.000
1400.000
1500.0001600.0001700.0001800.000
1900.000
2000.000
.191064
.217936
.252272
.296249
.356325
.440996
.566798
.770572
1.048088
1.344176
1 .642618
2.649032
8.169444
7.825603
5.2405523.0156511.768346
1.116304
.935978
.819477
.724614
.648034
.590445
.538661
.494286
.455954
.422438
.392841
.366493
.342885
.321615
.302359
.284855
.268794
.253998
.240468
.228073
.216685
.206194
.196503
.187531
.161051
.181128
.206419
.238133
.281618
.342673
.433184
.583906
.8633041.4551832.8752294.27015414.12685015.4894305.1625292.394257
1.735540
1.329156
1.071434
.898619
.774282
.679510
.610284
.552329
.503227
.461668
.425910
.394740
.367281
.342886
.321057
.301409
.283633
.267374
.252482
.238889
.226464
.215070
.204588
.194920
.185978
.128723
.141104
.155960
.173379
.196438
.226643
.266991
.327426
.425873
.605449
.960490
1.8065623.82667818.7796706.6008073.4527892.1739421.551301
1.196799
.974733
.822281
.710835
.632653
.566734
.513002
.468228
.430193
.397289
.368709
.343489
.320995
.300994
.282864
.266339
.251267
.237696
.225158
.213762
.203301
.193585
.184649
.140500
.155103
.172909
.194031
.222598
.260795
.313259
.393779
.527955
.7806401.408013
4.63792510.3059305.939969
8.610558
6.592432
3.863497
2.617231
1.918741
1.498695
1.219636
1.022810.888054.776765
.688430
.616745
.557374
.507366
.464660
.427759
.395562
.367229
.342118
.319741
.299522
.281308
.264871
.249976
.236423
.224048
.212709
.150824
.167200
.187230
.210962
.243229
.286294
.345422
.432594
.6571561.1815482.2605463.567426
4.342175
2.852691
2.1797773.028028
3.3528913.209398
2.479748
1.9362121.5644371.3125311.121310.971291.852503.756670.677866.612012.556229
.508427
.467056
.430941
.399430
.371288
.346056
.323520
.303302
.285082
.268594
.253615
.239958
.159450
.177063
.198531
.224871
.257668
.302298
.429518
.624263
.9348621 .4499262.0124562.5129702.6065081.948379
1.381058
1.254478
1.700198
2.006098
2.073226
2.036213
1.841414
1.557929
1.3238741.143350
1.000091
.884162
.788748
.709074
.641709
.584129
.534446
.491218
.453734
.420316
.390460
.363898
.340144
.318804
.299550
.282111
.266258
.166241
.184541
.206658
.246679
.320989
.424384
.569817
.7757421.0726911 .404141
1.7535631 .968090
1.892717
1.493146
.962098
.944899
.885507
1.148835
1.387350
1.487462
1.512618
1.5205091 .4853371.288519
1.127689
.996447
.887839
.796828
.719724
.653763
.596841
.547439
.504589
.466353
.432336
.402108
.375116
.350902
.329089
.309363
.291460
.171183
.207390
.258129
.323341
.407862
.516500
.661876
.8594361.0823341 .3270371.5886601.603443
1.5221771.237512.860991.727266
.716813
.692769
.867144
1.0429381.149479
1.2006371.2131361.204069
1.1815201.091940
.973758
.874112
.789301
.716515
.653567
.599440
.551591
.509028
.471352
.437871
.407978
.381171
.357034
.335219
.315434
.214069
.258670
.314114
.383609
.471377
.581994
.720020
.8839831.0750691.285172
1 .4500291.3719221.2729501.058810
.784732
.578892
.588905
.584731
.571964
.697700
.840737
.925481
.972714
.994376
.998334
.990138
.973691
.940300
.849881
.771873
.704170
.645935
.594087
.548050
.507257
.470968
.438539
.409446
.383240
.359553
.338067
III

11
** ANNUAL
I•AXIS (DISTANCE
-2000.000
1 -1900.000
-1800.000
-1700.000
-1600.000
• -1500.000
• -1400.000
-1300.000
1 -1200.000-1100.000-1000.000
1 -900.000
-800.000
-700.000
-600.000• -500.000
• -400.000
-300.000
1 -200.000
-100.000.000
_ 100.000
• 200.000
™ 300.000
400.000
1 500.000
600.000700.000
1 800.000
900.000
1000.000
_ 1100.000
• 1200.000* 1300.000
1400.000
1 1500.000
1600.0001700.000
1 1800.000
1900.000
2000.000
1
1
1
GROUND LEVEL CONCENTRATION
- Water Reclamation Faclility Modeling - 1991
( MICROGRAMS PER CUBICMETER ) DUE
******** n*/*r-
TO SOURCE
rMUC
1 (CONT.)
o ****
**
- GRID SYSTEM RECEPTORS -
200.000
, METERS
.253272
.300600
.358274
.428901
.515682
.622319
.752363
.8980891.0688561.2519321.2891271.2095351.115872.943140.727718.520781
.490041
.497261
.498356
.494549
.588140
.694493
.764877
.808680
.832941
.842924
.842552
.834736
.821647
.804914
.749425
.687305
.632063
.583230
.539879
.501239
.466661
.435600
.407596
.382262
.359271
100.000
- X
.000AXIS (DISTANCE,
-100.000
METERS) -
-200.000 -300.000 -400.000 -500.000 -600.000
) - CONCENTRATION -
.285313
.333769
.391732
.461207
.544489
.650517
.774883
.9133891.066315 1
1.213988 11.158338 11.081720.996586.853536.678915.509207.418441.433046.438263.437783.432536.503770.588057.646807
.685857
.709834
.722358
.726243
.723673
.716318
.706474
.693434
.665432
.614474
.569120
.528594
.492253
.459548
.430021
.403274
.378979
.310726
.359058
.415890
.482694
.570350
.674171
.790393
.918106
.054611
.112999
.054826
.982164
.906466
.785240
.641662
.501828
.369631
.376463
.384899
.388242
.387449
.383371
.439341
.507369
.556609
.590908
.613431
.626738
.632887
.634268
.631072
.624250
.615041
.604168
.592125
.552997
.515268
.481245
.450468
.422545
.397144
.330199
.377484
.432224
.505862
.593592
.691449
.799157
.9155091.0380131.020583.965956.902923.835085.732025.609638.488262.372988.329792.339848.345692.347843.346889.343435.388304.444070
.485625
.515621
.536289
.549493
.557485
.560359
.559198
.555224
.549128
.541429
.532538
.522774
.500677
.468924
.440053
.414387
.344489
.390084
.452724
.527627
.610846
.702378
.801682
.907473
.980685
.938681
.888499
.831777
.770903
.681659
.576989
.472581
.372203
.291133
.301893
.309144
.313183
.314408
.313259
.310167
.346759
.393097
.428443
.454685
.473567
.486809
.494699
.498386
.498962
.497070
.493238
.487893
.481383
.473991
.465937
.455788
.429651
.354347
.408148
.472649
.544018
.622367
.707490
.798726
.894815
.906050
.866986
.821213
.770074
.715431
.637556
.547101
.456484
.368526
.285509
.269705
.277665
.282872
.285583
.286114
.284798
.281966
.312234
.351203
.381669
.405030
.422241
.434106
.441890
.446346
.448097
.447662
.445472
.441880
.437177
.431607
.425368
.419519
.370247
.426195
.487853
.555374
.628717
.707558
.791198
.869473
.839691
.803646
.762021
.715899
.666739
.598298
.519454
.440213
.362720
.288778
.242212
.250444
.256329
.260028
.261763
.261787
.260360
.257731
.283290
.316416
.342874
.363228
.378516
.389670
.397384
.402249
.404763
.405344
.404347
.402065
.398746
.395200
.390652
.386510
.440131
.498692
.562229
.630601
.703416
.780001
.808287
.780407
.747269
.709435
.667776
.623432
.562919
.493705
.423971
.355368
.289330
.226989
.226798
.233030
.237360
.239941
.240962
.240627
.239331
.236933
.258516
.286977
.309773
.327739
.341613
.352021
.359511
.364551
.367544
.368831
.368703
.367405
.365852
.362971
.399386
.450303
.505645
.565190
.628735
.695874
.765980
.753164
.727206
.696782
.662368
.624660
.584569
.530769
.469634
.407922
.346921
.287778
.231431
.206157
.212518
.217226
.220387
.222139
.222791
.222259
.220855
.218524
.236895
.261523
.281529
.297550
.310147
.319819
.326999
.332065
.335342
.337111
.338081
.337782
.336477
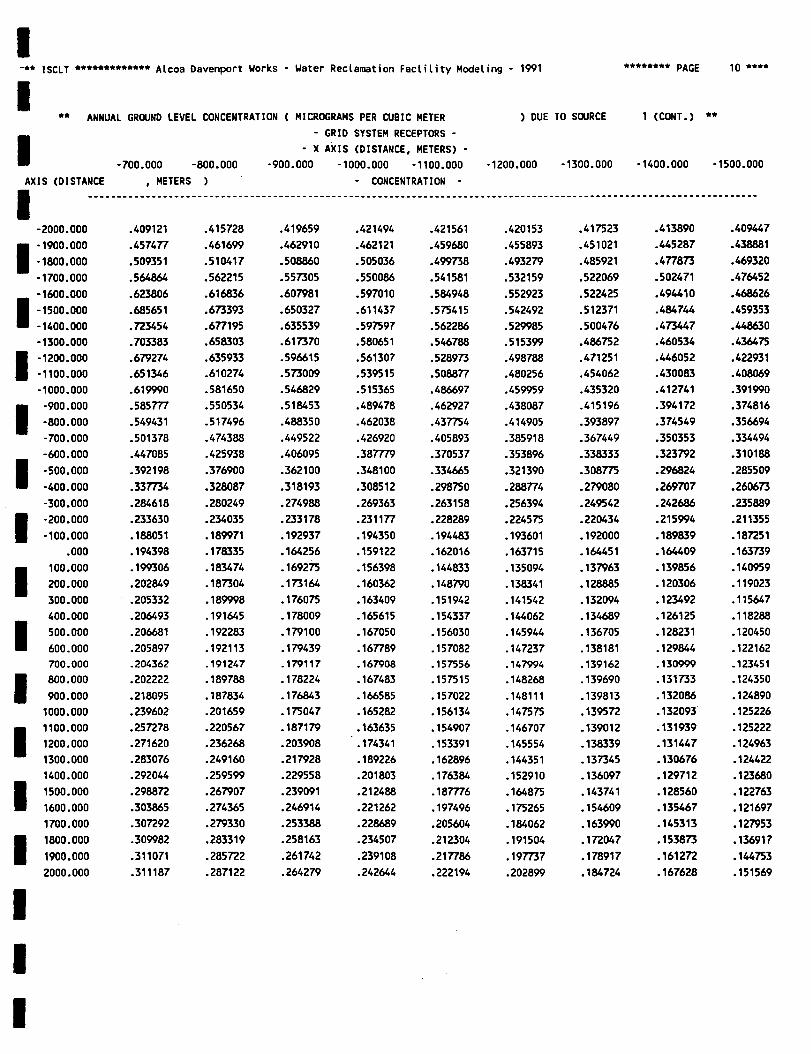
1-** ISCLT ************* Alcoa Davenport Works
1** ANNUAL GROUND LEVEL
1•AXIS (DISTANCE
-2000.000
1 -1900.000-1800.000-1700.000-1600.000
• -1500.000• -1400.000
-1300.000
1 -1200.000-1100.000-1000.000
1 -900.000-800.000-700.000-600.000
1 -500.000• -400.000
-300.000
1 -200.000-100.000
.000
1 100.000200.000300.000400.000
1 500.000600.000700.000
1 800.000900.0001000.000
11100.0001200.0001300.0001400.000
1 1500.0001600.0001700.000
1 1800.0001900.0002000.000
1
1
1
CONCENTRATION
- Water Reclamation Faclility Modeling - 1991
( MICROGRAMS PER CUBIC METER ) DUE
******** PAGE
TO SOURCE 1 (CONT.)
10 ****
**
- GRID SYSTEM RECEPTORS -- X
-700.000 -800.000 -900.000, METERS
.409121
.457477
.509351
.564864
.623806
.685651
.723454
.703383
.679274
.651346
.619990
.585777
.549431
.501378
.447085
.392198
.337734
.284618
.233630
.188051
.194398
.199306
.202849
.205332
.206493
.206681
.205897
.204362
.202222
.218095
.239602
.257278
.271620
.283076
.292044
.298872
.303865
.307292
.309982
.311071
.311187
AXIS (DISTANCE,-1000.000
METERS) --1100.000 -1200.000 -1300.000 -1400.000 -1500.000
) - CONCENTRATION -
.415728
.461699
.510417
.562215
.616836
.673393
.677195
.658303
.635933
.610274
.581650
.550534
.517496
.474388
.425938
.376900
.328087
.280249
.234035
.189971
.178335
.183474
.187304
.189998
.191645
.192283
.192113
.191247
.189788
.187834
.201659
.220567
.236268
.249160
.259599
.267907
.274365
.279330
.283319
.285722
.287122
.419659
.462910
.508860
.557305
.607981
.650327
.635539
.617370
.596615
.573009
.546829
.518453
.488350
.449522
.406095
.362100
.318193
.274988
.233178
.192937
.164256
.169275
.173164
.176075
.178009
.179100
.179439
.179117
.178224
.176843
.175047
.187179
.203908
.217928
.229558
.239091
.246914
.253388
.258163
.261742
.264279
.421494
.462121
.505036
.550086
.597010
.611437
.597597
.580651
.561307
.539515
.515365
.489478
.462038
.426920
.387779
.348100
.308512
.269363
.231177
.194350
.159122
.156398
.160362
.163409
.165615
.167050
.167789
.167908
.167483
.166585
.165282
.163635' .174341.189226.201803.212488.221262.228689.234507.239108.242644
.421561
.459680
.499738
.541581
.584948
.575415
.562286
.546788
.528973
.508877
.486697
.462927
.437754
.405893
.370537
.334665
.298750
.263158
.228289
.194483
.162016
.144833
.148790
.151942
.154337
.156030
.157082
.157556
.157515
.157022
.156134
.154907
.153391
.162896
.176384
.187776
.197496
.205604
.212304
.217786
.222194
.420153
.455893
.493279
.532159
.552923
.542492
.529985
.515399
.498788
.480256
.459959
.438087
.414905
.385918
.353896
.321390
.288774
.256394
.224575
.193601
.163715
.135094
.138341
.141542
.144062
.145944
.147237
.147994
.148268
.148111
.147575
.146707
.145554
.144351
.152910
.164875
.175265
.184062
.191504
.197737
.202899
.417523
.451021
.485921
.522069
.522425
.512371
.500476
.486752
.471251
.454062
.435320
.415196
.393897
.367449
.338333
.308775
.279080
.249542
.220434
.192000
.164451
.137963
.128885
.132094
.134689
.136705
.138181
.139162
.139690
.139813
.139572
.139012
.138339
.137345
.136097
.143741
.154609
.163990
.172047
.178917
.184724
.413890
.445287
.477873
.502471
.494410
.484744
.473447
.460534
.446052
.430083
.412741
.394172
.374549
.350353
.323792
.296824
.269707
.242686
.215994
.189839
.164409
.139856
.120306
.123492
.126125
.128231
.129844
.130999
.131733
.132086
.132093
.131939
.131447
.130676
.129712
.128560
.135467
.145313
.153873
.161272
.167628
.409447
.438881
.469320
.476452
.468626
.459353
.448630
.436475
.422931
.408069
.391990
.374816
.356694
.334494
.310188
.285509
.260673
.235889
.211355
.187251
.163739
.140959
.119023
.115647
.118288
.120450
.122162
.123451
.124350
.124890
.125226
.125222
.124963
.124422
.123680
.122763
.121697
.127953
.136917
.144753
.151569

1** ISCLT ************* Alcoa Davenport Works - Water Reclamation Faclility Modeling - 1991 ******** PAGE ^ **<
™ ** ANNUAL GROUND LEVEL CONCENTRATION ( HICROGRAMS PER CUBIC METER ) DUE TO SOURCE 1 (CONT.) **- GRID SYSTEM RECEPTORS -
I•AXIS (DISTANCE
-2000.000
_- 1900. 000
• - 1800. 000
'-1700.000
-1600.000
1-1500.000
-1400.000
-1300.000
1-1200.000-1100.000-1000.000
_ -900.000
• -800.000
• -700.000-600.000
1 -500.000
-400.000
-300.000
1 -200.000
-100.000
.000
100.000
• 200.000
™ 300.000
400.000
1 500.000
600.000
700.000
1 800.000
900.0001000.0001100.000
• 1200.000• 1300.000
1400.000
1 1500.000
1600.000
1700.000
1 1800.0001900.000
2000.000
1
1
1
-1600.000 -1700.000, METERS
.404352
.431956
.458745
.452427
.444842
.435964
.425792
.414345
.401663
.387808
.372869
.356950
.340177
.319751
.297445
.274796
.251987
.229197
.206596
.184338
.162567
.141406
.120957
.108479
.111104
.113297
.115075
.116466
.117494
.118348
.118817
.118951
.118837
.118503
.117972
.117267
.116412
.115422
.121115
.129305
.136500
- X-1800.000
AXIS (DISTANCE,-1900.000
METERS) --2000.000
) - CONCENTRATION -
.398742
.424638
.436378
.430198
.422867
.414376
.404726
.393938
.382049
.369113
.355206
.340420
.324862
.306021
.285492
.264652
.243652
.222645
.201778
.181187
.160996
.141313
.122234
.103838
.104509
.106710
.108532
.110084
.111324
.112183
.112735
.113027
.113083
.112926
.112578
.112060
.111392
.110592
.109673
.114872
.122376
.393352
.417051
.415626
.409592
.402522
.394408
.385255
.375080
.363920
.351824
.338855
.325094
.310635
.293211
.274272
.255044
.235662
.216254
.196949
.177864
.159108
.140779
.122961
.105724
.098569
.100812
.102650
.104209
.105448
.106383
.107052
.107476
.107676
.107671
.107482
.107128
.106626
.105993
.105243
.104392
.109150
.387113
.401973
.396942
.390943
.383654
.375904
.367218
.357615
.347127
.335798
.323683
.310852
.297388
.281241
.263723
.245943
.228012
.210043
.192146
.174426
.156976
.139884
.123333
.107254
.093073
.095233
.097108
.098683
.099963
.100977
.101741
.102274
.102595
.102721
.102670
.102458
.102102
.101617
.101017
.100315
.099563
.380701
.383970
.379015
.373233
.366607
.359088
.350479
.341409
.331540
.320913
.309576
.297591
.285027
.270031
.253796
.237316
.220691
.204020
.187398
.170950
.154784
.138847
.123282
.108147
.093492
.090090
.091954
.093538
.094860
.095934
.096774
.097398
.097820
.098057
.098124
.098037
.097809
.097455
.096988
.096454
.095799
-

*** ISCLT ************* Alcoa Davenport Works - Water Reclamation Faclility Modeling - 1991
- DISCRETE RECEPTORS -
X Y CONCENTRATION X Y CONCENTRATION X Y CONCENTRATION
DISTANCE DISTANCE DISTANCE DISTANCE DISTANCE DISTANCE
I-**
IIDI
I
I
I
I
I
I
I
I
I
I
I
I
I
I
I
I
******** PAGE 12 ***
** ANNUAL GROUND LEVEL CONCENTRATION ( MICROGRAMS PER CUBIC METER ) DUE TO SOURCE 1 (CONT.) **
IETERS) (METERS )
K.31948.7564.558.2
-26.9
-23.5-1265.0-402.0
.394267
.840137
.780524
.395339
(METERS) (METERS ) (METERS) (METERS )
1600.11948.7542.8
281.3-667.4-1184.0
.7039891.1812161.090236
1725.81430.6211.2
- PROGRAM DETERMINED MAXIMUM 10 VALUES -
X Y CONCENTRATIONCOORDINATE COORDINATE
(METERS) (METERS )
900.001000.001000.00800.00800.001100.001100.00900.00800.00800.00
-700.00-700.00-800.00-800.00-600.00-800.00-700.00-600.00-500.00-700.00
18.77967015.48943014.12685010.3059308.6105588.1694447.8256036.6008076.5924325.939969
-23.5-983.6-1134.5
1.0502931.0365221.190580

1**<
II
*** ISCLT ************* Alcoa Davenport Works - Water Reclamation Faclility Modeling - 1991
- SOURCE INPUT DATA -
PAGE 13 **
SOURCE SOURCE X Y EMISSION BASE /
[NUMBER TYPE COORDINATE COORDINATE HEIGHT ELEV-/
P (M) (M) (M) ATION /
•l (M) /
- SOURCE DETAILS DEPENDING ON TYPE -
I
I
I
I
I
I
I
I
I
I
I
I
I
I
I
2 STACK 901.96 -772.12 5.18 .00 GAS EXIT TEMP (DEC K)= 294.26, GAS EXIT VEL. <M/SEC}=STACK DIAMETER (H)= 7.833, HEIGHT OF ASSO. BLDG. (M)=ASSO. BLDG. (M)= 16.59, WAKE EFFECTS FLAG = 0
3.05,-5.18, WIDTH OF
- DIRECTION SPECIFIC BUILDING DIMENSIONS -
TOR DSBH DSBW IWAKE SECTOR DSBH DSBW IWAKE SECTOR DSBH DSBW IWAKE SECTOR DSBH DSBW IWAKE
15
9
13
5.2.
5.2.
5.2,
5.2,
16.6,
16.6,
16.6.
16.6,
0
0
0
0
2
6
10
U
5.2,
5-2,
5-2,
5.2,
16.6,
16.6,
16.6,
16.6,
0
0
0
0
3
7
11
15
5.2.
5.2.
5.2.
5.2.
16.6,
16.6,
16.6,
16.6,
0
0
0
0
I*
8
12
16
5.2.
5.2,
5.2.
5.2.
16.6,
16.6,
16.6,
16.6,
0
0
0
0
- SOURCE STRENGTHS ( GRAMS PER SEC
SEASON 1 SEASON 2 SEASON 3 SEASON 4
1.00000E+00
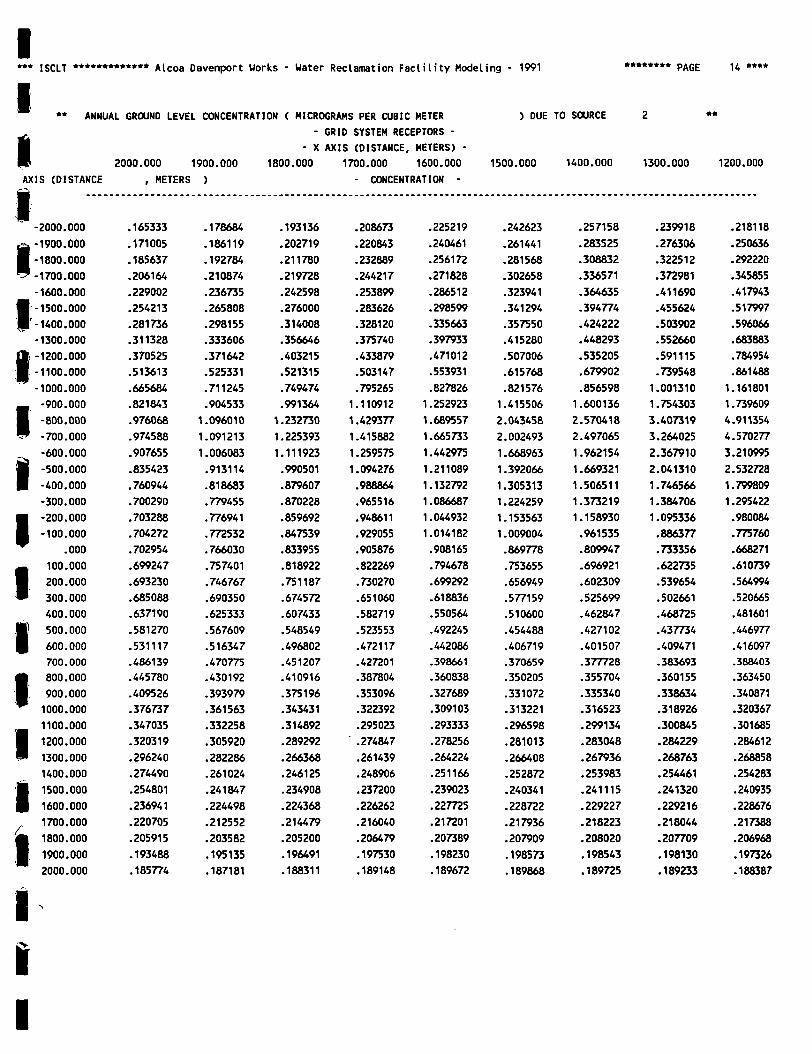
I*** ISCLT ************* Alcoa Davenport Works - Water Reclamation Faclility Modeling - 1991 ******** PAGE U
I** ANNUAL GROUND LEVEL CONCENTRATION ( MICROGRAMS PER CUBIC METER
- GRID SYSTEM RECEPTORS -
• - X AXIS (DISTANCE, METERS) -
M 2000.000 1900.000 1800.000 1700.000 1600.000
AXIS (DISTANCE , METERS ) - CONCENTRATION -
) DUE TO SOURCE 2
1500.000 1400.000 1300.000 1200.000
I
ii§iiiiiIiiiiiI
-2000.000
1-1900.000-1800.000-1700.000-1600.000
1 -1500.000'-UOO.OOO-1300.000
f -1200. 000-1100.000-1000.000
, -900.000i -800.000' -700.000-600.000-500.000-400.000-300.000
I -200. 000-100.000
.000100.000200.000300.000400.000
[ 500.000600.000700.000
I 800. 000900.0001000.0001100.0001200.0001300.0001400.000
1 1500.0001600.0001700.000
1 1800.0001900.0002000.000
.165333
.171005
.185637
.206164
.229002
.254213
.281736
.311328
.370525
.513613
.665684
.821843
.976068
.974588
.907655
.835423
.760944
.700290
.703288
.704272
.702954
.699247
.693230
.685088
.637190
.581270
.531117
.486139
.445780
.409526
.376737
.347035
.320319
.296240
.274490
.254801
.236941
.220705
.205915
.193488
.185774
.178684
.186119
.192784
.210874
.236735
.265808
.298155
.333606
.371642
.525331
.711245
.9045331 .0960101.0912131.006083.913114.818683.779455.776941.772532.766030.757401.746767.690350.625333.567609.516347.470775.430192.393979.361563.332258.305920.282286.261024.241847.224498.212552.203582.195135.187181
.193136
.202719
.211780
.219728
.242598
.276000
.314008
.356646
.403215
.521315
.749474
.9913641.2327301.2253931.111923.990501.879607.870228.859692.847539.833955.818922.751187.674572.607433.548549.496802.451207.410916.375196.343431.314892.289292.266368.246125.234908.224368.214479.205200.196491.188311
.208673
.220843
.232889
.244217
.253899
.283626
.328120
.375740
.433879
.503147
.7952651.1109121.4293771.4158821.2595751.094276.988864.965516.948611.929055.905876.822269.730270.651060.582719.523553.472117.427201.387804.353096.322392.295023.274847.261439.248906.237200.226262.216040.206479.197530.189148
.225219
.240461
.256172
.271828
.286512
.298599
.335663
.397933
.471012
.553931
.8278261.2529231 .689557.665733.442975.211089.132792.0866871.0449321.014182.908165.794678.699292.618836.550564.492245.442086.398661.360838.327689.309103.293333.278256.264224.251166.239023.227725.217201.207389.198230.189672
.242623
.261441
.281568
.302658
.323941
.341294
.357550
.415280
.507006
.615768
.8215761.4155062.0434582.0024931 .6689631.3920661.3053131.2242591.1535631.009004.869778.753655.656949.577159.510600.454488.406719.370659.350205.331072.313221.296598.281013.266408.252872.240341.228722.217936.207909.198573.189868
.257158
.283525
.308832
.336571
.364635
.394774
.424222
.448293
.535205
.679902
.8565981.6001362.5704182.4970651.9621541.6693211.5065111.3732191.158930.961535.809947.696921.602309.525699.462847.427102.401507.377728.355704.335340.316523.299134.283048.267936.253983.241115.229227.218223.208020.198543.189725
.239918
.276306
.322512
.372981
.411690
.455624
.503902
.552660
.591115
.7395481.0013101.7543033.4073193.2640252.3679102.0413101.7465661 .3847061.095336.886377.733356.622735.539654.502661.468725.437734.409471.383693.360155.338634.318926.300845.284229.268763.254461.241320.229216.218044.207709.198130.189233
.218118
.250636
.292220
.345855
.417943
.517997
.596066
.683883
.784954
.8614881.1618011.7396094.9113544.5702773.2109952.5327281.7998091.295422.980084.775760.668271.610739.564994.520665.481601.446977.416097.388403.363450.340871.320367.301685.284612.268858.254283.240935.228676.217388.206968.197326.188387

I***
IISCLT ************** Alcoa Davenport Works - Water Reclamation Faclility Modeling - 1991 ******** PAGE 15
** ANNUAL GROUND LEVEL CONCENTRATION ( HICROGRAHS PER CUBIC METER- GRID SYSTEM RECEPTORS -
I - X AXIS (DISTANCE, METERS) -1100.000 1000.000 900.000 800.000 700.000
AXIS (DISTANCE , METERS ) - CONCENTRATION -
) DUE TO SOURCE 2 (CONT.) **
600.000 500.000 400.000 300.000
I
iii
Iiiiiiiiiii
-2000.000-1900.000-1800.000-1700.000-1600.000-1500.000-UOO.OOO-1300.000-1200.000-1100.000-1000.000-900.000-800.000-700.000-600.000-500.000-400.000-300.000-200.000-100.000
.000100.000200.000300.000400.000500.000600.000700.000800.000900.0001000.0001100.0001200.0001300.000UOO.OOO1500.0001600.0001700.0001800.0001900.0002000.000
.191889
.218981
.253632
.298045
.358808
.444599
.572351
.7801301.0486691.3142231.5196602.4061787.9012486.8530704.5485632.6634601 .6299231.094556.930863.815566.721341.645372.588173.536769.492656.454533.421186.391729.365499.341992.320808.301627.284189.268180.253435.239953.227601.216251.205793.196132.187187
.161664
.181895
.207398
.239428
.283402
.345261
.437183
.591017
.8775391.4869322.9101723.92446912.88177012.0887004.6125382.3644451.7172481.3177041.063674.893300.770198.676360.607707.550240.501464.460155.424597.393585.366259.341973.320237.300667.282962.266755.251919.238375.225993.214637.204189.194551.185637
.129111
.141554
.156512
.174063
.197341
.227845
.268654
.330081
.430664
.614246
.9789911.8548383.96229916.4536906.3383003.3663062.1350231.5291921.182724.965320.815481.705681.628575.563471.510368.466033.428290.395743.367288.342285.319934.300054.282025.265576.250620.237075.224636.213248.202788.193153.184290
.140943
.155640
.173581
.194888
.223730
.262350
.315465
.397376
.534525
.7931651 .4250023.9910566.8519544.3631967.2516085.6268823.3556652.2874471.7023941.3477741.111012.941371.819851.726065.648286.584531.531218.485903.446879.412901.383049.356615.333051.311812.292609.275250.259540.245262.232235.220314.209368
.151323
.167807
.187987
.211933
.244507
.288047
.347886
.436454
.6429671.0993792.0192792.9435133.4642162.3188321.8617942.6504192.8577502.6885652.0950411.6655911.3671331.1526231.001058.877377.778009.696829.629250.572114.523182.480826.443825.411249.382371.356524.333218.312282.293418.276350.260847.246715.233790
.159988
.177716
.199342
.225916
.259008
.304485
.414875
.578522
.8387631.2626871.6611811.9592622.1527981.6439381.2104101.075541.455734.700458.753213.730865.570490
1 .3295031.1568811.011991.895415.799768.719990.652515.594776.544869.501362.463147.429359.399188.372050.347773.325956.306264.288423.272199.257396
.166804
.185218
.207490
.245268
.309158
.397312
.518295
.685970
.9246571.1359291.3174291.4616811 .5237971.240563.846749.812427.752621.9826721.1829131.2721411.3008131.3076521.2840191.126321.997595.891019.801573.725616.660458.604062.554867.511661.473479.439315.408743.381422.356895.334784.314776.296604.280047
.171757
.204745
.248911
.304707
.373534
.465581
.586088
.744837
.8852131.0149561.1383441.1823161.1899121.001572.728743.633170.615268.591509.748086.898757.9843271.0377451.0555721.0551341.042729.969168.872772.790372.719349.657663.603727.556274.514295.476588.443001.412975.386019.361724.339745.319794.301624
.207011
.245792
.293270
.351876
.424791
.512575
.626400
.737588
.848435
.9582271.0324581.0181931 .000322.856584.655750.510207.512782.505683.492953.605307.724283.804671.850571.875050.884260.882604.873253.846227.770913.705193.647510.596616.551291.510747.474588.442228.413153.386929.363197.341647.322020

**1
II
** ISCLT **• Alcoa Davenport Works - Water Reclamation Faclility Modeling - 1991 ******** PAGE 16
ANNUAL GROUND LEVEL CONCENTRATION
AXIS (DISTANCE
I
I
I
1
I
I
I
I
I
I
I
I
I
I
I
200.000 100.000
, METERS )
( MICROGRAMS PER CUBIC METER
- GRID SYSTEM RECEPTORS -
- X AXIS (DISTANCE, METERS) -
.000 -100.000 -200.000
- CONCENTRATION -
) DUE TO SOURCE 2 (CONT.) **
-300.000 -400.000 -500.000 -600.000
-2000.000-1900.000
-1800.000-1700.000-1600.000
-1500.000
-1400.000
-1300.000
-1200.000
-1100.000
-1000.000
-900.000
-800.000
-700.000
-600.000
-500.000
-400.000
-300.000
-200.000
-100.000.000
100.000
200.000
300.000
400.000
500.000
600.000
700.000800.000
900.000
1000.000
1100.0001200.0001300.0001400.000
1500.000
1600.000
1700.000
1800.0001900.000
2000.000
.239079
.279800
.328738
.387819
.459378
.546044
.633963
.730254
.831182
.930649
.947910
.917690
.885987
.767012
.606770
.452154
.432289
.434782
.432063
.428186
.514436
.608269
.672669
.714988
.740691
.753935
.757872
.754912
.746877
.735164
.685994
.632548
.584436
.541610
.503344
.469036
.438161
.410283
.385025
.362072
.341154
.265626
.307076
.356018
.413892
.482304
.560102
.644987
.732416
.826148
.912109
.876547
.838896
.801785
.700007
.567431
.437912
.369516
.377148
.382850
.382640
.378791
.445451
.520733
.574950
.612585
.637244
.651817
.658598
.659395
.655637
.648448
.638543
.613610
.569081
.529177
.493308
.460962
.431701
.405154
.380998
.358960
.286961
.328187
.376067
.431623
.498281
.573066
.654367
.740792
.829100
.858892
.817548
.777221
.737859
.649005
.536395
.425420
.324182
.333144
.339554
.342293
.342042
.339335
.392439
.453877
.499625
.532646
.555424
.570024
.578138
.581138
.580138
.575702
.568821
.560265
.550458
.514999
.481506
.451139
.423535
.398379
.375397
.303546
.343838
.389921
.447731
.513566
.585356
.662423
.743352
.825773
.807100
.769775
.729462
.689889
.610944
.513977
.417392
.325808
.294684
.302511
.307341
.309459
.309224
.307025
.350104
.400930
.439752
.468619
.489303
.503317
.511924
.516151
.516516
.514219
.509877
.503961
.496835
.488820
.468583
.440149
.414197
.390440
.315920
.354774
.405303
.463457
.526915
.595373
.668082
.743697
.789948
.757573
.721570
.683491
.645212
.575322
.490518
.406064
.324979
.262513
.271035
.277050
.280688
.282173
.281780
.279803
.315285
.357849
.391023
.416281
.434923
.448082
.456519
.461106
.462793
.462152
.459652
.455678
.450546
.444518
.437800
.428495
.404073
.324637
.369061
.420565
.476734
.537457
.602348
.670642
.741117
.743251
.712397
.678348
.642382
.606037
.543748
.469252
.394760
.322566
.254513
.244103
.250729
.255305
.257960
.258883
.258294
.256427
.286038
.322068
.350622
.372788
.389533
.401401
.409551
.414635
.417197
.417700
.416525
.413999
.410382
.405897
.400735
.395064
.337708
.383443
.433253
.487123
.544867
.606062
.669973
.725347
.699930
.670910
.639049
.605391
.571177
.515392
.449480
.383364
.318809
.257297
.220891
.227766
.232886
.236316
.238181
.238644
.237883
.236083
.261072
.291870
.316567
.335936
.350752
.361827
.369756
.375056
.378164
.379453
.379239
.377789
.375329
.372046
.368149
.351056
.395322
.443173
.494531
.549167
.606642
.666273
.683673
.659749
.632644
.603004
.571669
.539643
.489483
.430834
.371857
.313931
.258246
.205739
.207644
.213044
.216966
.219491
.220735
.220837
.219945
.218205
.239438
.265861
.287297
.304411
.317838
.328118
.335722
.341062
.344490
.346312
.346790
.346147
.344587
.342294
.362058
.404646
.450363
.499092
.550578
.604394
.659894
.644897
.622479
.597259
.569763
.540678
.510811
.465551
.413116
.360283
.308142
.257657
.209617
.189931
.195432
.199647
.202622
.204439
.205204
.205033
.203988
.202151
.220358
.243314
.262166
.277445
.289629
.299145
.306370
.311637
.315234
.317410
.318384
.318372
.317532

I*** ISCLT ************* Alcoa Davenport Works - Water Reclamation Faclility Modeling - 1991 ******** PAGE 17 ****
W ** ANNUAL GROUND LEVEL CONCENTRATION ( HICROGRAHS PER CUBIC METER
- GRID SYSTEM RECEPTORS -
I - X AXIS (DISTANCE, METERS) -
-700.000 -800.000 -900.000 -1000.000 -1100.000
AXIS (DISTANCE , METERS ) - CONCENTRATION -
) DUE TO SOURCE 2 (CONT.) **
-1200.000 -1300.000 -1400.000 -1500.000
§
I
I
I
I
I
I
§
I
I
I
I
I
I
I
I
-2000.000-1900.000
1 -1800.000| -1700.000-1600.000
1 -1500.000, -UOO.OOO-1300.000
f - 1200.000-1100.000-1000.000-900.000
1 -800.0001 -700.000
-600.000
1 -500.000-400.000-300.000
I~ -200.000-100.000
.000100.000
I 200. 000300.000400.000
I 500. 000600.000700.000
1 800.0001 900.000* 1000.000
1100.000
1 1200.0001300.0001400.000
( 1500.0001600.0001700.000
. 1800.0001 1900.000•' 2000.000
.370753
.411512
.454996
.501055
.549422
.599696
.627014
.608854
.587909
.564484
.539011
.512049
.484262
.443293
.396222
.348714
.301646
.255803
.211845
.174261
.179753
.184119
.187388
.189616
.190884
.191234
.190734
.189567
. 187857
.203654
.223772
.240469
.254165
.265241
.274040
.280867
.285992
.289650
.292054
.293424
.293890
.376949
.416102
.457319
.500725
.546063
.592959
.592469
.575380
.555837
.534089
.510498
.485518
.459690
.422508
.380093
.337229
.294625
.252925
.212684
.174352
.165749
.170168
.173616
.176133
.177735
.178455
.178469
.177868
.176734
.175154
.188964
.206710
.221578
.233903
.243995
.252129
.258557
.263497
.267168
.269745
.271377
.380977
.418049
.457220
.498272
.540856
.574099
.560353
.544302
.526074
.505881
.484024
.460879
.436877
.403051
.364697
.325901
.287237
.249238
.212369
.177022
.153206
.157623
.161123
.163781
.165609
.166708
.167151
.167010
.166358
.165266
.163796
.175958
.191703
.205007
.216141
.225357
.232881
.238923
.243687
.247329
.249991
.383291
.418322
.455144
.493600
.533439
.543200
.530537
.515446
.498439
.479680
.459415
.437957
.415661
.384802
.350012
.314793
.279617
.244924
.211110
.178509
.147339
.146172
.149716
.152488
.154542
.155930
.156710
.156943
.156691
.156012
.154964
.153598
.164370
.178416
.190376
.200470
.208911
.215891
.221589
.226154
.229722
.384116
.417171
.451754
.487708
.524305
.514100
.502133
.488311
.472712
.455334
.436530
.416623
.395912
.367685
.336031
.303968
.271884
.240133
.209039
.178913
.149997
.135828
.139364
.142222
.144433
.146037
.147082
.147616
.147692
.147361
.146670
.145670
.144400
.153990
.166584
.177385
.186577
.194341
.200832
.206192
.210550
.383662
.414820
.447281
.480900
.496923
.487197
.475797
.462755
.448142
.432074
.414710
.396226
.376899
.351058
.322251
.293038
.263751
.234700
.206172
.178420
.151656
.126471
.129976
.132874
.135189
.136951
.138200
.138975
.139320
.139277
.138891
.138202
.137248
.136066
.144656
.156008
.165806
.174212
.181369
.187407
.192447
.382121
.411474
.441938
.473358
.471694
.462340
.451494
.439188
.425491
.410500
.394351
.377211
.359279
.335568
.309246
.282552
.255757
.229124
.202897
.177291
.152497
.128667
.121447
.124349
.126725
.128600
.130003
. 130968
.131532
.131730
.131600
.131178
.130497
.129597
.128506
.136241
.146515
.155440
.163148
.169759
.175383
.379666
.407310
.435898
.455958
.448317
.439339
.429027
.417417
.404567
.390563
.375521
.359583
.342918
.321116
.296998
.272534
.247955
.223480
.199318
.175658
.152664
.130474
.113683
.116559
.118965
.120916
.122434
.123548
.124288
.124684
.124769
.124574
.124135- .123480.122638.121631.128621.137959.146115.153202.159321
.376450
.402480
.429320
.434026
.426626
.418022
.408226
.397267
.385200
.372100
.358069
.343227
.327711
.307615
.285456
.262977
.240370
.217827
.195524
.173625
.152275
.131599
.111696
.109430
.111841
.113837
.115438
.116667
.117547
.118106
.118372
.118374
.118142
.117701
.117074
.116282
.115352
.121694
.130211
.137688
.144221

'*** ISCLT ************* Alcoa Davenport Works - Water Reclamation Faclility Modeling - 1991 ******** PAGE 18 ••.
§9 ** ANNUAL GROUND LEVEL CONCENTRATION ( MICROGRAMS PER CUBICMETER ) DUE TO SOURCE 2 (CONT.) **
- GRID SYSTEM RECEPTORS -
1' AXIS (DISTANCE
1̂ -2000.000
-1900.000
1 -1800.000
9 -1700.000
-1600.000
1 -1500.000-1400.000
" -1300.000
1 -1200.000
-1100.000
-1000.000
-900.000
• -800.000
9 -700.000
-600.000
1 -500.000
-400.000-300.000
1- -200.000
-100.000
.000100.000
1 200.000
300.000
400.000
§ 500.000
600.000
700.000^ 800.000
• 900.000™ 1000.000
1100.000
1 1200.000
1300.000
1400.000
1 1500.000
1600.000
1700.000
— 1800.000
• 1900.000
"' 2000.000
1
1
1
-1600.000 -1700.000
. METERS
.372607
.397120
.419704
.413626
.406473
.398238
.388931
.378583
.367241
.354972
.341862
.328017
.313555
.294981
.274569
.253860
.233019
.212209
.191583
.171282
.151434
.132150
.113522
.102893
.105290
.107310
.108968
.110282
.111274
.111966
.112384
.112557
.112503
.112245
.111805
.111205
.110462
.109596
.115377
.123168
.130042
- X
-1800.000
AXIS (DISTANCE,-1900.000
METERS) -
-2000.000
) - CONCENTRATION -
.368251
.391343
.400548
.394623
.387724
.379848
.371007
.361229
.350558
.339051
.326785
.313847
.300339
.283147
.264296
.245171
.225913
.206662
.187550
.168700
.150223
.132221
.114777
.097960
.099257
.101283
.102976
.104354
.105435
.106239
.106787
.107099
.107195
.107095
.106820
.106386
.105812
.105115
.104311
.109592
.116743
.363485
.385248
.382661
.376903
.370256
.362726
.354327
.345082
.335032
.324227
.312733
.300629
.288000
.272039
.254592
.236890
.219057
.201211
.183469
.165938
.148717
.131894
.115547
.099739
.093693
.095710
.097428
.098854
.100005
.100897
.101549
.101977
.102200
.102237
.102103
.101816
.101391
.100843
.100187
.099434
.104279
.358367
.370738
.365948
.360355
.353961
.346765
.338783
.330036
.320560
.310401
.299616
.288272
.276447
.261604
.245419
.228999
.212450
.195875
.179376
.163046
.146974
.131237
.115904
.101040
.088564
.090567
.092291
.093746
.094948
.095908
.096643
.097169
.097500
.097652
.097642
.097482
.097189
.096774
.096252
.095635
.094932
.353008
.354959
.350276
.344872
.338739
.331863
.324273
.315991
.307048
.297484
.287351
.276705
.265615
.251788
.236741
.221479
.206092
.190669
.175299
.160065
.145044
.130310
.115925
.101940
.088404
.085804
.087523
.088996
.090233
.091246
.092049
.092654
.093075
.093327
.093422
.093374
.093196
.092900
.092497
.092000
.091419

IX Y CONCENTRATION
DISTANCE DISTANCE
TERS) (METERS )
I**4
I
IOIS
I
I
I
I
iiiiiiiiiiii
ISCLT ************* Alcoa Davenport Works - Water Reclamation Faclility Modeling - 1991 ******** PAGE 19 ****
ANNUAL GROUND LEVEL CONCENTRATION ( HICROGRAMS PER CUBIC METER
- DISCRETE RECEPTORS -
X Y CONCENTRATIONDISTANCE DISTANCE
(METERS) (METERS )
) DUE TO SOURCE 2 (CONT.) **
X Y CONCENTRATION
DISTANCE DISTANCE
(METERS) (METERS )
I U.3 -26.9 .347483 1600.1 2811948.7 -23.5 .735773 1948.7 -667
564.5 -1265.0 .700100 542.8 -1184I 58.2 -402.0 .347194
.3 .632917
.4 1.008099
.0 .949030
- PROGRAM DETERMINED MAXIMUM 10
X
COORDINATE
(METERS)
900.00
1000.00
1000.00
1100.00800.00
1100.00800.00
900.00
800.00
1200.00
1725.8 -23.51430.6 -983.6
211.2 -1134.5
VALUES -
.891855
.886668
.898946
Y CONCENTRATION
COORDINATE
(METERS )
-700.00
-800.00
-700.00
-800.00
-600.00
-700.00-800.00
-600.00
-500.00
-800.00
16.453690
12.88177012.088700
7.9012487.251608
6.8530706.851954
6.338300
5.626882
4.911354

**
II
** ISCLT ************* Alcoa Davenport Works - Water Reclamation Faclility Modeling - 1991 ******** PAGE 20 ****
- SOURCE INPUT DATA -
SOURCE SOURCE X Y EMISSION BASE /•NUMBER TYPE COORDINATE COORDINATE HEIGHT ELEV- / - SOURCE DETAILS DEPENDING ON TYPE -P (M) (M) (M) ATION /
§ a.L'.3 AREA 918.16 -782.92 5.18 .00 WIDTH OF AREA (M)= 36.58
I - SOURCE STRENGTHS ( GRAMS PER SEC PER SQUARE METER )
SEASON 1 SEASON 2 SEASON 3 SEASON 47.A7330E-04
I
I
iiiiiiiiiiii

I'** ISCLT ************* Alcoa Davenport Works - Water Reclamation Faclility Modeling - 1991 ******** PAGE 21 ****
I'* ANNUAL GROUND LEVEL CONCENTRATION ( MICROGRAHS PER CUBIC METER
- GRID SYSTEM RECEPTORS -
I - X AXIS (DISTANCE, METERS) -
2000.000 1900.000 1800.000 1700.000 1600.000
AXIS (DISTANCE . METERS ) - CONCENTRATION -
) DUE TO SOURCE 3
1500.000 1400.000 1300.000
III
1200.000
-2000.000
— -1900.000• -1800.000P -1700.000
-1600.000
1-1500.000-1400.000-1300.000
1 -1200.000-1100.000-1000.000
_ -900.000• -800.000P -700.000
-600.000
1 -500.000-400.000-300.000
1 -200.000-100.000
.000100.000
• 200.000™ 300.000
400.000
1 500.000600.000700.000
1 800.000900.000
- 1000.0001100.000
1 1200.000• 1300.000
1400.000
1 1500.0001600.0001700.000
11800.0001900.0002000.000
.244902
.259883
.290097
.311387
.345584
.382406
.421312
.461373
.625230
.8231531.0598581.2990431.5457201 .6660431.6076311.525373.424990.472894.490261.521883.524975.506912.473784.477595.264275.1240901.001682.894791.801365.719593.648907.587211.532757.484576.441837.403826.369935.339703.321339.286527.270484
.265990
.284792
.303951
.342558
.370141
.414721
.462824
.513437
.587853
.8745041.1726181.4772061.7916501.9440561.8641781.7524781.6643401.7108031.7696441.7840411.7659931.7253501.7297821.4586141.2827201.1311241.000419.887588.789995.705376.632171.569191.514248.465938 "".423334.390641.358159.322880.304727.288069.272754
.288385
.311684
.336248
.361393
.412002
.448736
.508505
.573043
.640993
.9498911.3131791.7145162.1291712.3263052.2129472.0513782.1424892.0825142.1185122.1037482.0534792.0593261.7056001.4802471.2890321.126678.988577.870792.770013.683482.608902.545459.490559.455270.401196.369215.346630.326073.307315.290159.274431
.311833
.340338
.371346
.404413
.438495
.506967
.557901
.644096
.738376
.9824131.4713582.0137952.5773842.8390562.6718232.4357782.5026902.5783802.5625312.4942482.5015672.0269981.7308961 .4844491.2790811.107489.963583.842383.739838.652659.583716.530096.459320.427435.398777.372939.349575.328386.309115.291539.275469
.335932
.370336
.408868
.451520
.497735
.546193
.646430
.725679
.854083
.9917421.6473862.3964743.1920083.5513093.2913493.3593463.2178503.2291783.1329003.1267142.4574172.0560801.7301521 .4648301.2479701.069799.922572.800166.717753.618430.545646.502401.464968.431784.402100.375450.351441.329737.310055.292150.275817
.360095
.401001
.448082
.502021
.563156
.634214
.711900
.865434
.9883791.1889041.9344832.8993954.0809084.5960444.1677014.2697144.2058954.0847034.0732373.0773222.4944012.0444361.6930751.4137591.1900491.013404.904547.732813.664284.604907.553170.507857.468633.434395.403902.376624.352128.330046.310071.291941.275433
.362886
.443832
.492311
.554565
.634830
.733483
.847889
.9744011.2260601.4348111.7702393.5468715.4114446.1859025.9160175.7498715.6066135.5636133.9951573.1239722.4696841.9761081.6073161.3606851.129673.929993.830109.745513.673318.611262.557562.510796.470079.435091.404039.376349.351548.329244.309109.290866.274281
.353516
.411119
.484121
.598741
.733363
.8394871.0005471.1976961.4284251 .8876392.2730894.6185987.5261248.7595659.2274438.2232228.1750925.4504704.0314713.0466942.3427381 .9490911.4559281.2276231.072973.945991.840575.752169.677327.613426.558433.510762.469168.433712.402392.374530.349627.327271.307119.288886.272330
.338117
.393895
.465150
.558412
.688210
.8720241.2402911.4527351.8314002.3125593.2823185.18490311.13775013.23076013.10897013.1893907.9136125.4354283.9455882.9556222.0759571.7209171.4509721.2467671.083624.951286.842467.751896.675690.610944.555450.507508.465794.430131.398862.371093.346306.324081.304068.285974.269557

I***
IISCLT ****** Aicoa Davenport Uorks - Water Reclamation Faclility Modeling - 1991 PAGE 22 **
** ANNUAL GROUND LEVEL CONCENTRATION ( HICROGRAHS PER CUBIC METER
- GRID SYSTEM RECEPTORS -
I - X AXIS (DISTANCE, METERS) -
1100.000 1000.000 900.000 800.000 700.000
AXIS (DISTANCE , METERS ) - CONCENTRATION -
) DUE TO SOURCE
600.000 500.000
3 (CONT.)
400.000
III
300.000
I
1•11•
1•
.
.1•
.
•
-2000.000
-1900.000-1800.000
-1700.000-1600.000-1500.000-1400.000
-1300.000
-1200.000-1100.000
-1000.000
-900.000
-800.000
-700.000
-600.000-500.000-400.000-300.000
-200.000-100.000
.000100.000200.000
300.000400.000
500.000
600.000700.000800.000
900.0001000.000
1100.000
1200.0001300.000
1400.000
1500.0001600.000
1700.000
1800.000
1900.0002000.000
1123
.316272
.368034
.434365
.522798
.645750
.818348
.071274
.461632
.278652
.277508
4.376148
718292412843221111
.021654
.413460
.500100
.361870
.352850
.274857
.968714
.406414
.646921
.123911
.742561
.456487
.245088
.078418
.944320
.834742
.743982
.667907
.603465
.548364
.500851
.459575
.424258
.393384
.365987
.341548
.319647
.299931
.282113
.265950
.287869
.333276
.391204
.468613
.575552
.725509
.946141
1.290922
1.8655152.917293
5.366680
12.305260
35.321330
52.326750
24.09869010.1410906.6633064.6655533.4392182.639216
2.1008511.7156621.429857
1.219794
1.055638.924010
.816701
.727961
.653661
.590771
.537022
.490684
.450431
.416105
.385925
.359187
.335338
.313955
.294704
.277299
.261504
.272063
.313128
.364989
.433423
.526813
.655486
.8416911.126169
1.583603
2.379740
3.923756
10.632040
49.099620
53.613620
29.67334015.811150
9.7023036.4719364.598807
3.4283422.6641342.133334
1.748687
1.469915
1.256732
1.088373.952974
.842346
.750728
.673925
.608863
.553230
.505270
.464504
.428915
.397610
.369837
.345071
.322870
.302894
.284843
.288011
.332143
.387880
.461184
.561184
.698343
.8945781.190444
1 .6539853.632765
6.430189
20.711570
37.067530
17.398580
18.73531016.75850012.8777708.259121
5.8559194.339400
3.3486092.658539
2.160390
1.801531
1.527570
1.312648
1.1409501.001601.886933
.791422
.711002
.642633
.584010
.534151
.491176
.453465
.420160
.390590
.364206
.340557
.319271
.301536
.347648
.405609
.480408
.582362
.7201261.032738
1.679671
2.525608
4.07478810.054340
17.490730
20.848650
10.712400
6.0279278.8466448.3532447.482688
6.8679795.006545
3.8671763.0767612.503356
2.0864751.765197
1.5127481.3109841.1473051.012760.900859.806808
.727012
.658734
.600854
.550996
.507325
.468846
.434763
.404422
.377288
.352922
.310091
.356572
.414454
.487808
.709228
.9644911.337368
1.9141212.787135
5.751431
9.05420115.380350
13.310910
7.491467
4.5567253.6297265.0027454.9787454.7162404.336169
4.0314983.428374
2.765246
2.311739
1.959014
1.680008
1.4559401.2735431.123247
.998047
.892713
.803301
.726783
.662247
.606335
.557387
.514294
.476155
.442238
.411937
.384754
.314028
.375830
.512544
.638855
.8377061.112794
1.493359
2.0248783.694614
5.4610617.969250
9.883485
9.095538
5.617691
3.7799412.557370
2.4103813.1871183.2726493.225667
3.0700452.871209
2.693822
2.5394912.108904
1.813886
1.5751431.3796151.217749
1.082409.968213
.871063
.788088
.717957
.656887
.603394
.556281
.514577
.477487
.444358
.414643
.383108
.468225
.585348
.736464
.9331461.1978531.549941
2.5832753.619971
5.070331
7.319366
7.194423
6.574872
4.342402
2.9406191.8544791 .8230201.722400
2.2148512.317788
2.3350422.2812122.195274
2.089214
1.975522
1 .898772
1.6815631.4656491.296194
1.153784
1.033111.930090
.842621
.767765
.702460
.645168
.594648
.549886
.510046
.474438
.442488
.436486
.531171
.649696
.798976
.9879991.2286841 .919235
2.588962
3.495932
4.5922865.750165
5.445885
4.968001
3.451521
2.5083281.823964
1.4035781 .372400
1 .3033591 .6345951.7278491.775709
1.7689581.728864
1.669669
1.600418
1.5268081.4636111 .378465
1.2123991.087497
.980460
.890045
.811587
.742954
.682611
.629302
.581992
.539827
.502101
.468219

III
ISCLT ************* Alcoa Davenport Uorks - Water Reclamation Faclil ity Modeling - 1991
ANNUAL GROUND LEVEL CONCENTRATION
AXIS (DISTANCE
200.000 100.000
, METERS )
( MICROGRAMS PER CUBIC METER
- GRID SYSTEM RECEPTORS -
- X AXIS (DISTANCE. METERS) -
.000 -100.000 -200.000
- CONCENTRATION -
) DUE TO SOURCE
-300.000 -400.000
PAGE 23
3 (CONT.) **
-500.000 -600.000
-2000.000_ -1900.000• -1800.000~ -1700.000
-1600.000
1-1500. 000-1400.000-1300.000
1 -1200.000-1100.000-1000.000
_ -900.000• -800.000* -700.000
-600.000
1 -500.000-400.000-300.000
1 -200.000-100.000
.000100.000
• 200.000•' 300.000
400.000
1 500.000600.000700.000
1 800.000900.0001000.0001100.000
• 1200.000• 1300.000
1400.000
1 1500.0001600.0001700.000
1 1800.0001900.0002000.000
.480816
.575279
.691230
.8340851.0105251 .4930261 .9453772.5541113.2824344.2222914.4808174.2796133.9035502.8228292.1556031.5041771.1002571.1041311.0742401.0262131.2657711 .3500941.4004591.4106221.3947331 .3623911 .3200821.2721601.2215601.1701771.1394671.026174.930449.849454.778374.715705.660207.610853.566788.527301.491790
.512055
.603948
.714727
.8484931.2049251.5299031.9542642.4547473.0393563.8257573.6404613.4582723.1613912.3592711.8679061.3750411.015000.898028.893232.871847.838754.016749.086455.133459.150874.148003.131445.105881.074611.039956.003539.968506.942094.889008.808804.744499.687386.636479.590925.550027.513184
.532480
.620254
.724328
.9957741.2389021.5517831.9165752.3355312.8072083.0977243.0143162.8547422.6171272.0042711.6314331.254878.936960.742428.751625.744626.726394.700855.836948.894712.936917.956933.961062.953948.939005.918725.895500.871579.846404.820532.795474.779173.710927.658912.612263.570292.532408
.544143
.626876
.8388841.0260141.2638151.5381951.8511642.2028832.7142702.6344232.5497702.4082482.2145431.7343211 .4433261.148655.861285.646917.637529.639566.631431.616109.595983.702647.750815.788113.808468.816269.814852.806742.795061.780683.763892.745497.726097.706148.685996.672285.633979.588143.549492
.548839
.718102
.8653661.0506921.2625271.5024991.7712472.0679112.3223682.2681422.1883032.0662841 .9065381.5210571.2885601.052314.819915.648079.545032.552600.551233.543181.530324.514182.599506.640002.672765.692374.701965.704202.702202.695920.686458.674680.661245.646675.631368.615627.599701.585710.569835
.622892
.741009
.888496
.055673
.243813
.453634
.685005
.9793422.0169221.973629.900143.794744.661456.346788.157804.965315.774714.590718.469503.480323.483419.480485.472989.462162.449004.518451.552779.581531.600034.611261.616703.617306.614174.608185.600034.590274.579338.567576.555256.542595.530339
.642653
.762138
.896560
.046904
.213833
.397512
.597434
.827339
.776776
.733552
.6667401.5753751 .4629811.2023921.046473.887414.729119.575089.464712.419956.425927.426555.422980.416189.407014.396140.453509.482991.508759.526790.538359.544742.547012.546035.542515.537015.529994.521819.512786.503214.493883
.661724
.771557
.8936991.0287141.1768731 .3380301.5153571.6013401.5771031.5354031 .4750361 .3954721.2997701.081251.950958.817894.684947.554756.439389.369260.377015.380083.379350.375604.369528.361699.352755.401393.427205.450337.466869.478039.484863.488181.488679.486922.483372.478408.472341.465777.458891
.671555
.772221
.8830211.0042441.1359151.2777131.4815371 .4347831 .4094901 .3700231.3156241.2460001.163783.978547.868422.755883.643100.532083.424590.345100.335233.339939.341243.339777.336096.330813.324645.317548.358807.381378.401864.416941.427561.434515.438466.439966.439471.437362.433953.430074.425472
III

I'*"* ISCLT ************* Alcoa Davenport Works - Water Reclamation Faclility Modeling - 1991 ******** PAGE 24
I'* ANNUAL GROUND LEVEL CONCENTRATION ( HICROGRAHS PER CUBIC METER
- GRID SYSTEM RECEPTORS -
I - X AXIS (DISTANCE, METERS) -
-700.000 -800.000 -900.000 -1000.000 -1100.000
AXIS (DISTANCE , METERS ) - CONCENTRATION -
) DUE TO SOURCE 3 (CONT.) **
-1200.000 -1300.000 -1400.000 -1500.000
-2000.000_ -1900.000
• -1800.000
™ -1700.000
-1600.000
1-1500.000
-1400.000-1300.000
1 -1200.000-1100.000
-1000.000
— -900.000
• -800.000
* -700.000
-600.000
1 -500.000
-400.000
-300.000
1 -200.000
-100.000
.000
100.000
• 200.000
• 300.000
400.000
1 500.000
600.000
700.000
1 800.000
900.0001000.000
1100.000• 1200.000
• 1300.000
1400.000
1 1500.000
1600.000
1700.000
1 1800.000
1900.000
~ 2000.000
.675080
.766405
.866859
.975763
1.0930021.2181701.3077121.2928371.2675111.2305981.181597
1.120365
1.049203
.890632
.796620
.700513
.603965
.508532
.415595
.342844
.299389
.305156
.307902
.308128
.306387
.303402
.299132
.293848
.287794
.323180
.342935
.361153
.374889
.384890
.391781
.396089
.398259
.398665
.397814
.396203
.393609
.674168
.757617
.847786
.944902
1.0495281.185566.186708.170993.146262.111969.067799
.013687
.951630
.814720
.733757
.650972
.567645
.484997
.404124
.325977
.268502
.274919
.278704
.280369
.280357
.278805
.275995
.272175
.267561
.262334
.292953
.310343
.326607
.339128
.348492
.355199
.359676
.362299
.363802
.364100
.363310
.669200
.745709
.827777
.9153061.0081271.100945
1.0819181.0657021.0419231.010198.970317.922278.867804
.748692
.678402
.606531
.534082
.462016
.391219
.322459
.273807
.248853
.253421
.256102
.257090
.256645
.255004
.252380
.248957
.244903
.240353
.267047
.282450
.297026
.308450
.317187
.323660
.328389
.331758
.333745
.334563
.661171
.731339
.806122
.885374
.9757151.003929
.992322
.974902
.951510
.922218
.886140
.843299
.795220
.690845
.629389
.566554
.503137
.439919
.377748
.317149
.260681
.226206
.231245
.234520
.236256
.236669
.235959
.234305
.231870
.228798
.225216
.221229
.244662
.258375
.271489
.281947
.290257
.296727
.301632
.305104
.307348
.650867
.715258
.783494
.855406
.948036
.926499
.914389
.897284
.874952
.847238
.814093
.775814
.733310
.641237
.586974
.531546
.475626
.419803
.364655
.310702
.258391
.220082
.211601
.215282
.217570
.218644
.218670
.217803
.216181
.213933
.211168
.207985
.204470
.225169
.237460
.249503
.259216
.267134
.273365
.278133
.281634
.638904
.698050
.760401
.825786
.865997
.857813
.845568
.829021
.808001
.782401
.752202
.717476
.679421
.597670
.549494
.500300
.450606
.400918
.351709
.303412
.256407
.217482
.194152
.198095
.200782
.202359
.202965
.202732
.201779
.200216
.198143
.195646
.192806
.189715
.208335
.219537
.230467
.239522
.246888
.252778
.257380
.625769
.680160
.737233
.813811
.805202
.796583
.784411
.768519
.748779
.725118
.697538
.666105
.631886
.558776
.515765
.471857
.427476
.383036
.338932
.295526
.253141
.212057
.180941
.182704
.185671
.187625
.188685
.188959
.188553
.187562
.186071
.184161
.181923
.179588
.177031
.193655
.203794
.213798
.222126
.228980
.234539
.611840
.661919
.714246
.759627
.750636
.741784
.729830
.714646
.696131
.674244
.648994
.620441
.589540
.523857
.485274
.445896
.406074
.366153
.326461
.287304
.248955
.211658
.184615
.168889
.172044
.174276
.175685
.176365
.176404
.175886
.174886
.173494
.171919
.170063
.167979
.165701
.180660
.189864
.198999
.206675
.213059
.597413
.643583
.698422
.707802
.701478
.692561
.680924
.666462
.649112
.628840
.605667
.579647
.551638
.492373
.457606
.422135
.386252
.350243
.314384
.278934
.244127
.210172
.177249
.156458
.159729
.162161
.163837
.164836
.165237
.165110
.164537
.163708
.162572
.161145
.159470
.157589
.155535
.169048
.177427
.185796
.192885
III

1'** ISCLT ************* Alcoa Davenport Works - Water Reclamation Facli lity Modeling - 1991 ******** PAGE 25 **.*
* ** ANNUAL GROUND LEVEL CONCENTRATION ( MICROGRAMS PER CUBIC METER ) DUE TO SOURCE 3 (CONT.) **- GRID SYSTEM RECEPTORS -
1AXIS (DISTANCE
-2000.000_ -1900.000• -1800.000™ -1700.000
-1600.000
1-1500.000-1400.000-1300.000
1 -1200.000-1100.000-1000.000
_ -900.000• -800.000• -700.000
-600.000
1 -500.000-400.000-300.000
1 -200.000-100.000
.000100.000
• 200.000™ 300.000
400.000
1 500.000600.000700.000
1 800.000900.0001000.0001100.000
• 1200.000• 1300.000
1400.000
1 1500.0001600.0001700.000
1 1800.0001900.000
' 2000.000
1
1
1
-1600.000 -1700.000, METERS
.582721
.625348
.674527
.663629
.657057
.648192
.636930
.623192
.606934
.588137
.566819
.543038
.517567
.463863
.432414
.400333
.367871
.335267
.302754
.270552
.238862
.207867
.177723
.155852
.148578
.151147
.153023
.154274
.154965
.155191
.155110
.154652
.153863
.152788
.151466
.149933
.148222
.146363
.158616
.166272
.173960
- X-1800.000
AXIS (DISTANCE,-1900.000
METERS) --2000.000
) - CONCENTRATION -
.567934
.607355
.628249
.623492
.616796
.608063
.597213
.584188
.568950
.551494
.531841
.510038
.486786
.437961
.409401
.380278
.350803
.321177
.291597
.262255
.233320
.204952
.177291
.153087
.138460
.141117
.143139
.144633
.145611
.146204
.146391
.146218
.145726
.144954
.143938
.142712
.141305
.139746
.138056
.149207
.156226
.553610
.602156
.591914
.586927
.580199
.571657
.561238
.548898
.534612
.518378
.500219
.480177
.458885
.414344
.388317
.361788
.334932
.307922
.280928
.254110
.227618
.201590
.176148
.151398
.132850
.132059
.134238
.135878
.137094
.137886
.138295
.138360
.138120
.137610
.136860
.135903
.134765
.133471
.132043
.130505
.140686
.540011
.563947
.559228
.553680
.546837
.538527
.528546
.516863
.503462
.488343
.471528
.453057
.433506
.392742
.368944
.344699
.320152
.295452
.270743
.246164
.221845
.197907
.174503
.151712
.134165
.123865
.126098
.127880
.129228
.130180
.130771
.131037
.131012
.130725
.130207
.129484
.128582
.127524
.126331
.125021
.123616
.532668
.533909
.529568
.523923
.516925
.508527
.498749
.487692
.475110
.461008
.445407
.428342
.410343
.372918
.351100
.328875
.306371
.283716
.261035 '
.238453
.216126
.194122
.172534
.151447
.130935
.116371
.118657
.120508
.121956
.123035
.123775
.124209
.124364
.124270
.123952
.123434
.122740
.121891
.120906
.119803
.118614

'*** ISCLT ************* Alcoa Davenport Works - Water Reclamation Faclility Modeling - 1991
X Y CONCENTRATION
DISTANCE DISTANCE
ETERS) (METERS )
I'*«
II01
IIIIIIIIIIIIIIII
******** PAGE 26
ANNUAL GROUND LEVEL CONCENTRATION ( MICROGRAMS PER CUBIC METER ) DUE TO SOURCE 3 (CONT.) **
14.3
1948.7
564.5
58.2
-26.9-23.5
-1265.0
-402.0
.747584
1.6471292.227594
1.018119
- DISCRETE RECEPTORS -
X Y CONCENTRATION X Y CONCENTRATION
DISTANCE DISTANCE DISTANCE DISTANCE
(METERS) (METERS ) (METERS) (METERS )
1600.1
1948.7
542.8
281.3-667.4
-1184.0
1.510460
1.780583
3.550990
1725.8
1430.6
211.2
- PROGRAM DETERMINED MAXIMUM 10 VALUES -
X Y CONCENTRATION
COORDINATE COORDINATE
(METERS) (METERS )
900.00
1000.00
900.00
800.00
1000.00
900.00
1100.00
1100.00
1000.00
700.00
-700.00
-700.00
-800.00
-800.00
-800.00
-600.00
-700.00
-600.00
-600.00
-800.00
53.61362052.326750
49.099620
37.067530
35.321330
29.673340
29.500100
24.361870
24.098690
20.848650
-23.5-983.6
-1134.5
2.339638
2.194395
3.865016

I:**
I
I
ISCLT Alcoa Davenport Works - Water Reclamation Faclility Modeling - 1991 ******** PAGE
ANNUAL GROUND LEVEL CONCENTRATION ( MICROGRAHS PER CUBIC METER- GRID SYSTEM RECEPTORS -
- X AXIS (DISTANCE, METERS) -
2000.000 1900.000 1800.000 1700.000 1600.000
AXIS (DISTANCE . METERS ) - CONCENTRATION -
) FROM ALL SOURCES COMBINED
1500.000 1400.000 1300.000
III
27
1200.000
-2000.000
— -1900.000• -1800.000• -1700.000
-1600.000
1-1500.000
-1400.000
-1300.000
1 -1200.000
-1100.000
-1000.000
_ -900.000
• -800.000
^ -700.000-600.000
1 -500.000
-400.000
-300.000
1 -200.000
-100.000
.000
100.000
• 200.000
• 300.000
400.000
1 500.000600.000
700.000
1 800.000
900.0001000.000
1100.000• 1200.000
• 1300.0001400.000
1 1500.0001600.0001700.000
1 1800.0001900.0002000.000
.582756
.610883
.672086
.737066
.820103
.911120
1 .0095361.1140531.403849
1.9159322.488192
3.0725013.6598913.7802913.5657233.3156703.0429142.948743
2.9821013.022248
3.0262823.001954
2.956054
2.941455
2.6207582.3534522.1181451.9109371.728642
1.5673641 .425424
1.2996131.1878111.088212.999260.919610.848115.783844.734587
.673821
.642340
.630064
.665618
.700467
.777680
.860752
.968134
1.086646
1.2127521.3706511 .9935322.7052733.4397634.180366
4.3264704.044031
3.714679
3.406213
3.3650053.429282
3.441111
3.4127623.354764
3.3357302.936735
2.6113662.3285172.0824691.8681021.680921
1.5172931 .3737251.2476741.1364061.037835.950250.877190.808367.748361.712246.678672.647429
.680614
.725001
.770151
.814349
.9140321.022648
1.164946
1 .3228901.494182
2.0659402.943606
3.8892444.847443
5.026499
4.644742
4.196515
4.0117493.943607
3.969146
3.9355093.8592963.833117
3.3242872.9206812.5751612.2790562.0247231.8056021.616154
1.4517421 .308626
1.1840061.074638.990873.893987.839474.795784.755422.718082.683484.651375
.734056
.788805
.846404
.905413
.9631751.096060
1.2441121 .4397561.6618932.0571623.2020104.4561925.738396
5.9677245.4179534.7845284.622946
4.671340
4.625268
4.518992
4.4789033.811154.
3.298446
2.867960
2.5058572.2002631.9412521.7206751.531891
1 .3694911.234619
1.1227811.009585.950845.897086.847799.802530.760867.722448.686950.654093
.789768
.856447
.928832
.006091
.086145
.164845
.349995
.562058
.8555032.1830813.4451465.1520286.9319167.2351576.4330125.944864
5.6471805.589516
5.424473
5.358105
4.441904
3.770612
3.2208582.769334
2.3966412.087139.828417.610671.446174
.275709
.164524
.089696
.022075
.960784
.904944
.853973
.807333
.764551
.725216
.688968
.655495
.846786
.9268891.016429
1.115665
1.2237861 .337900
1.450259
1.7316092.0622392.5134903.7138506.0193008.617158
9.033455
7.794537
7.2366037.034086
6.771486
6.6277465.301944
4.379093
3.654010
3.077311
2.614772
2.240487
1.938761
1.7249221.4750111.365516
1.2678101.180319
1.1017091.031275.967782.910174.857794.810025.766339.726279.689451.655509
.876002
1.011004
1.111878
1.2322731.3737171.535070
1.715542
1.9019812.350787
2.894310
3.619697
7.014667
11.023380
11.647840
10.128940
9.3383268.9092738.6156816.554244
5.211452
4.200871
3.4389522.8523912.432275
2.061260
1.785299
1.6341431.5019091.385594
1.2827421.191345
1.1097451.036811.971551.912545.859078
.810463
.766117
.725544
.688319
.654074
.832231
.9623171.1273281.344178
1.5586091.756618
2.021168
2.3279192.656418
3.4481854.4294188.38955414.90145015.83966014.244130
12.65882012.044750
8.5092836.402334
4.9260543.8667643.215704
2.5367842.234404
2.0117551.8226701.6606211.5205591.398553
1.2915311.197049
1.1131531.038269.971840.911866
.857676
.808526
.763790
.722937
.685516
.651140
.773358
.8939041.0479511.2479721.5211641.903817
2.4344812.8321693.4317104.1071885.749591
8.94383721.53601023.000370
19.917380
18.708890
11.856660
8.206251
5.991646
4.5333993.414944
2.944549
2.582885
2.2897742.048309
1.8465591.6758411.5297631.403547
1.293553
1 . 196972
1.1115961.035674.968458.907987.853476.804130.759291.718404.680998
.646676

I'*** ISCLT ************* Alcoa Davenport Works - Water Reclamation Faclility Modeling - 1991 PAGE
I ** ANNUAL GROUND LEVEL CONCENTRATION ( MICROGRAMS PER CUBIC METER- GRID SYSTEM RECEPTORS -
I - X AXIS (DISTANCE, METERS) -1100.000 1000.000 900.000 800.000 700.000
AXIS (DISTANCE , METERS ) - CONCENTRATION -
) FROM ALL SOURCES COMBINED (CONT.)
600.000 500.000 400.000
III
300.000
11•
1•
I•
1•
1•
-2000.000-1900.000-1800.000-1700.000-1600.000-1500.000-UOO.OOO-1300.000-1200.000-1100.000-1000.000-900.000-800.000-700.000-600.000-500.000-400.000-300.000-200.000-100.000
.000100.000200.000300.000400.000500.000600.000700.000800.000900.0001000.0001100.0001200.0001300.0001400.0001500.0001600.0001700.0001800.0001900.0002000.000
.1.1.1.2.3.4.5.7.12.34.44.34.18.11.7.5.4.3.3.2.2.2....
.
.
.
.
.
.
.
.
699225804951940269117092360883703943210423012334375409935906538425076860484150178780150990031960673130179574273254281965569865035967635105320518065359854807678365528551399899
288342190787104836028618961233900818846408797222752583711917674748640668
.610584
.696299
.805020
.9461741.1405721.4134431.8165082.4658443.6063585.85940811.15208020.49989062.32995079.90488033.87376014.89980010.1160907.3124125.5743254.4311363.6453303.0715322.6478472.3223642.0603291.8458331.6672081.5162861.3872011.2756301.1783161.0927601.017026.950234.890326.836451.787795.743662.703480.666770.633119
.529897
.595786
.677461
.780864
.9205921.1099741.3773361.7836762.4401403.5994355.86323714.29344056.88860088.84698042.61245022.63024014.0112709.5524286.9783305.3683954.3018963.5498513.0099142.6001202.2801032.0226341.8114571.6353781.486725
1.3596991.2497921.1542771.070159.996419.930802.872381.819631.772081.728959.689632.653782
.569454
.642887
.734370
.8501021.0075121.2214881.5233021 .9816002.7164655.2065709.26320529.34055054.22542027.70175034.59748028.97782020.09693013.1638009.4770557.1858685.6792574.6227203.8682943.3043612.8642862.5139242.2295421.9948701.7984731.6320821.4896121.3664771.2591791.1657031.0833061.010022.944570.885828.832865.784920.741348
.603683
.682656
.780826
.9033031.0700981.2944681.7260462.5487193.8257316.35571514.33417024.00167028.65504015.88392010.06950014.52509014.56388013.38065011.4427708.6083496.7987475.5419154.6257243.9351433.3957102.9662472.6180992.3314322.092171
1.8901131.7176891.5692011.4405361.3286661.2302701.1431271.065566.996196.933863.877618.826670
.629529
.711351
.812327
.9385951.2259041.5712742.1817613.1169054.5607608.46404512.72784019.85258018.07022011.0837807.1481935.9597448.1586778.6853028.5426798.1032477.4434026.3158065.2460014.4670813.8545203.3639372.9646782.6351322.359732
2.127045.928520.757666.609876.481751.368845.269058.180394.101223.030211.966247.908407
.647073
.745588
.9266921.1308021.4678531 .9344892.5814723.4865905.6919628.00113111.04024013.31326012.5120508.3513995.5887894.3146964.0485095.3186255.8429125.9852705.8834775.6993705.4631784.9543314.2341893.7013533.2645552.9020592.5979312.3402332.1199211 .9301631; 7661 561.623625.497966.386925.288292.200263.121352.050325.986150
.726048
.8803611.0923881.3645131.7145422.1799342.7979054.1875475.5875187.41232410.0463709.9801829.2869626.5814854.5303543.2149153.1551013.0066783.8300814.2594824.4688484.5195944.4639834.3484174.1997703.9598803.5280933.1301342.804844
2.5279622.2904052.085804.908507.753382.616813.496014.388646.292781.2068261.1294521.059546
.8575661.0356331.2570801.5344611.8841672.3232533.2656564.2105345.4194366.8356858.2326527.8359997.2412735.3669153.9488102.9130622.5052662.4628132.3682762.9376033.2928693.5058613.5922433.5982903.5522623.4731613.3737523.2501382.999259
2.6894662.4391772.2230112.0354241 .8703841.7247991.595808.480994.378367.286264.203301.128306

IT** ISCLT ************* Alcoa Davenport Works - Water Reclamation Faclility Modeling - 1991 ******** PAGE 29 ****
I** ANNUAL GROUND LEVEL CONCENTRATION ( HICROGRAMS PER CUBIC METER
- GRID SYSTEM RECEPTORS -
I - X AXIS (DISTANCE, METERS) -
200.000 100.000 .000 -100.000 -200.000
AXIS (DISTANCE , METERS ) - CONCENTRATION -
) FROM ALL SOURCES COMBINED (CONT.)
-300.000 -400.000 -500.000
III
-600.000
-2000.000
_ -1900.000
• -1800.000
™ -1700.000
-1600.000
1-1500.000
-KOO.OOO
-1300.000
1 -1200.000-1100.000
-1000.000_ -900.000
• -800.000
™ -700.000
-600.000
1 -500.000
-400.000
-300.000
1 -200.000
-100.000
.000
_ 100.000
• 200.000
™ 300.000
400.000
1 500.000
600.000
700.000
1 800.000
900.000
1000.000
1100.000
• 1200.000
• 1300.000
1400.000
1 1500.0001600.000
1700.000
1 1800.000
1900.000
2000.000
.973168
1.1556801 .3782421 .6508051 .9855842.6613893.3317034.1824545.1824726.404871
6.7178546.406837
5.905410
4.532981
3.490091
2.477112
2.022587
2.036175
2.0046591.948948
2.3683462.6528562.838004
2.934291
2.968365
2.9592512.920506
2.861809
2.790083
2.710255
2.5748862.3460272.1469481.974294
1.8215971.6859801.5650291 .4567361 .359408
1.2716361.192216
1 .062994
1.2447931 .462478
1.7235922.2317172.7405223.3741354.1005534.9318195.9518555.6753465.378888
4.959763
3.912814
3.1142522.322160.802957.708222
.714344
.692269
.650081
1 .965970
2.195245
2.3552162.4493152.495081
2.5056202.490722
2.457679
2.411911
2.3584602.3004832.2211372.0725631.9071011.766402
1.6406011.5277271.4261001 .3342991.251122
1.1301671 .3074991.5162841.9100912.3075332.7990193.3613343.994429
4.6909195.069615
4.886690
4.614127
4.261453
3.438516
2.809491
2.182126
1.630773
1.452035
1.476079
1.475162
1 .4558851 .4235611.668728
1.855957
1.993150
2.080487
2.129918
2.150710
2.150029
2.134131
2.106710
2.071531
2.0302661 .984965
1 .9380571.8471691.707701
1.5912961 .486266
1.3912161.304950
1.177888
1 .3481981.661028
1.9796082.3709732.8150003.3127443.8617444.5780554.4621064.2855014.040633
3.7395163.0772912.566941
2.054309
1.560081
1.271393
1.2798881 .2925991.2887331.2722231.246443
1.441055
1.595815
1.713490
1.792707
1.841862
1 .867663
1.876151
1.8715701 .8563971 .8333351 .8045021.7714881.7355211.6975891.6415451.543052
1.4423931.354319
1.209247
1 .4629601.7233932.0417762.4002882.8002513.2410113.7190804.0930013.964397
3.7983733.581551
3.3226532.778038
2.356067
.930959
.517097
.201725
.117960
.138794
.145104
.139762
.125363
.104151
.261551
.390948
1.492230
1.563339
1.610455
1 .639093
1 .6534211.6554131.6482131 .6339021.6141361.5902461.5632981.5341361.5034371 .4699931 .403559
1.3018761.5182181.7817092.0764252.4036372.7634723.1543733.6152733.6662243.5530123.3997053.2072002.9829242.528092
2.174157
1.816558
1.4658061.130740
.9833111.0087161.0215961.0240281.0179871.005254.987397
1.1167221.226049
1.313822
1.377852
.423035
.452210
.468747
.475155
.473479
.465396
.452271
.435217
.415135
.392761
.368698
.344922
1.3506081.5717761.8176662.0894012.3874172.7111323.0586053.4221593.3163973.2081073.0678102.896666
2.700897
2.316082
2.015407
1.710991
1.410648
1.121163
.927816
.898166
.915142
.922899
.922924
.916620
.905257
.889953
.9978711.091277
.168200
.225954
.267627
.296238
.314152
.323340
.3254421.3218131.3135811 .3016731.2868601.2704601.252685
1 .3992901.6070101 .835564
2.0854752.3566402.6480882.9616313.0933003.0172592.9153162.7874752.6349172.462845
2.133653
1.875498
1.613723
1 .354246
1.102331
.872118
.803703
.823088
.834409
.838783
.837301
.830991
.820975
.807894
.899347
.980043
.047407
.099020
.137490
.165002
.183415
.194292
.198956
.198515
.193902
.185894
.1762151.164156
1.432999
1.6271701.8390292.0685262.3152282.5779802.9074102.8328442.7591752.6640642.5477542.411337
2.2591631.974867
1.751173
1.524087
1.298162
1.077518
.865637
.741188
.743183
.756812
.764253
.766355
.764090
.758105
.749488
.738223
.816060
.886214
.945559
.991936
1.0273371.0534791.0718361.0836681.090046
1.0918821.0904181.0862281.079480

I**«
II
** ISCLT ***** ******** Alcoa Davenport Works - Water Reclamation Faclility Modeling - 1991 ******** PAGE 30
ANNUAL GROUND LEVEL CONCENTRATION ( HICROGRAHS PER CUBIC METER
- GRID SYSTEM RECEPTORS -
- X AXIS (DISTANCE, METERS) -
-700.000 -800.000 -900.000 -1000.000 -1100.000
AXIS (DISTANCE , METERS ) - CONCENTRATION -
) FROM ALL SOURCES COMBINED (CONT.) **
-1200.000 -1300.000 -1400.000 -1500.000
1
1•
1•
1•
-2000.000
-1900.000-1800.000
-1700.000
-1600.000
-1500.000
-1400.000
-1300.000-1200.000
-1100.000
-1000.000
-900.000
-800.000
-700.000-600.000
-500.000
-400.000
-300.000
-200.000
-100.000
.000
100.000
200.000
300.000
400.000
500.000
600.000700.000800.000
900.000
1000.000
1100.0001200.000
1300.000
1400.000
1500.0001600.000
1700.000
1800.000
1900.000
2000.000
1
1
1
222222222211111
1
.454955
.635394
.831206
.041681
.266231
.503518
.658181
.605074
.534694
.446427
.340598
.218190
.082896
.835303
.639926
.441426
.243344
.048953
.861070
.705156
.673540
.688581
.698139
.703076
.703765
.701318
.695763
.687777
.677873
.744929
.806309
.858899
.900674
.933207
.957866
.975828
.988116
.995607
.999850
.000699
.998687
1.4668461.635418
1.815522
2.007842
2.212427
2.451918
2.4563722.4046772.338033
2.2563322.159947
2.049739
1.928816
1.7116171.539787
1.365100
1.190356
1.018170
.850843
.690300
.612587
.628560
.639624
.646499
.649737
.649543
.646578
.641290
.634082
.625321
.683576
.737620
.784453
.822191
.852086
.875235
.892598
.905126
.914289
.919567
.921809
1.469836
1.6266681.793858
1 .9708832.1569642.3253712.2778112.2273742.164611
2.089087
2.001170
1.901609
1.7930321.601265
1 .449194
1.294532
1.139513
.986242
.836765
.692418
.591269
.575750
.587709
.595958
.600709
.602454
.601594
.598507
.593539
.587011
.579196
.630184
.678061
.719961
.754150
.781635
.803455
.820699
.833608
.842816
.848834
1.465956
1.6117821.766303
1 .9290602.1061642.1585652.1204562.0710002.0112561.9414131 .8609201.7707341.6729191.502567
1 .367180
1.229447
1.091266
.954206
.820035
.690008
.567143
.528776
.541324
.550416
.556413
.559649
.560458
.559157
.556045
.551395
.545461
.538462
.583374
.626017
.663668
.694906
.720430
.741308
.757728
.770365
.779714
1 .456544
1.5921081.734986
1.8846952.0572892.016015.978807.932382.876636.811448
.737320
.6553631.5669761.4148151.293543
1.170180
1.046260
.923093
.801983
.684098
.570404
.500743
.499755
.509446
.516339
.520711
.522834
.522975
.521389
.518315
.513972
.508562
.502261
.542055
.580428
.614663
.643289
.667080
.686502
.702111
.714378
1.442719
1.5687631.700961
1.838844
1.9158421.887502
1.8513501.8071751.754930
1.694731
1.626871
1.551790
1.471225
1.3346461.225641
1.114728
1.003132
.892013
.782456
.675433
.571778
.479048
.462470
.472511
.480033
.485255
.488402
.489700
.489366
.487605
.484609
.480555
.475608
.470132
.505901
.540420
.571538
.597796
.619761
.637922
.652726
1.4254121.542654
1 .665091
1 .8092381.7993211.7712931.7363811 .6944601.6455211.589680
1.527209
1.458513
1.385062
1.2617931.163343
1.063183
.962313
.861702
.762262
.664817
.570089
.478687
.431273
.439147
.447085
.452930
.456869
.459089
.459775
.459105
.457244
.454351
.450759
.446530
.441635
.473636
.504917
.533228
.557321
.577656
.594646
1.405396
1.5145161.628017
1.7180561.6933631.6658681 .6323041.5925971.5467501 .494890
1.4372571.3741971.307007
1.1953261.106064
1.015254
.923737
.832319
.741774
.652801
.566028
.481988
.418603
.408941
.417134
.423423
.427963
.430912
.432425
.432655
.431749
.430006
.427501
.424219
.420329
.415891
.444748
.473135
.498987
.521149
.540008
1.3833101.484944
1.597063
1.618280
1 .5967301 .569936
1.5377811.5002041 .457242
1.409009
1 .355726
1.297690
1.236043
1.1344821.053250
.970621
.887295
.803959
.721263
.639810
.560141
.482729
.407968
.381535
.389858
.396449
.401437
.404954
.407134
.408106
.408134
.407304
.405677
.403267
.400224
.396634
.392584
.418694
.444555
.468237
.488674
III

I*** ISCLT ************* Alcoa Davenport Works - Water Reclamation Faclility Modeling - 1991 ******** PAGE 31
II
** ANNUAL GROUND LEVEL CONCENTRATION ( MICROGRAMS PER CUBIC METER- GRID SYSTEM RECEPTORS -
- X AXIS (DISTANCE, METERS) --1600.000 -1700.000 -1800.000 -1900.000 -2000.000
'AXIS (DISTANCE , METERS ) - CONCENTRATION -
) FROM ALL SOURCES COMBINED (CONT.)
11•
I•
1•
-2000.-1900.
000000
-1800.000-1700.-1600.-1500.-1400.-1300.-1200.-1100.-1000.-900.-800.-700.-600.-500.-400.-300.-200.-100.
.
100.200.300.400.500.600.
000000000000000000000000000000000000000000000000000000000000000000000000
700.000
I•
800.900.1000.1100.1200.1300.
000000000000000000
1400.0001500.0001600.0001700.0001800.0001900.0002000.000
1.3596801 .4544241.5529761.5296811.5083711 .4823941.4516531.4161201 .3758381.3309171.2815511.2280041.1712981.0785951.004429.928989.852877.776673.700932.626172.552864.481423.412203.367224.364972.371754.377066.381022.383733.385504.386311.386160.385204.383536.381243.378405.375097.371381.395108.418745.440503
1 .3349261 .4233371.4651741.4483131 .4273871 .4022871.3729461.3393551.3015561.2596591.2138321 . 1643051.1119871.027129.959189.890101.820368.750484.680924.612141.544539.478487.414302.354885.342226.349110.354647.359071.362369.364627.365913.366344.366003.364975.363336.361158.358510.355453.352041.373671.395345
1.3104471 .4044551.3902011.3734211 .3529771 .3287921.3008201.2690611.2335641.1944301.1518071.1059001.057520.979594.917181.853722.789651.725387.661346.597912.535443.474263.414655.356861.325112.328581.334316.338941.342547.345166.346896.347814.347997.347518.346446.344847.342781.340307.337474.334330.354114
.285491
.336658
.322118
.304978
.284452
.261196
.234548
.204515
.171149
.134541
.094827
.052182
.007341
.935587
.878086
.819641
.760614
.701370
.642265
.583636
.525794
.469028
.413741
.360006
.315802
.309665
.315497
.320309
.324139
.327065
.329156
.330480
.331106
.331098
.330518
.329424
.327873
.325916
.323599
.320971
.318112
.266377
.272837
.258858
.242028
.222271
.199478
.173501
.145092
.113698
.079405
.042334
.002638
.960984
.894737
.841638
.787670
.733154
.678405
.623732
.569468
.515955
.463280
.411741
.361534
.312831
.292265
.298133
.303042
.307049
.310215
.312598
.314260
.315259
.315654
.315498
.314845
.313745
.312246
.310391
.308257
.305832
III

*** ISCLT ************* Alcoa Davenport Works - Water Reclamation Faclility Modeling • 1991
X Y CONCENTRATION
DISTANCE DISTANCE
IETERS) (METERS )
*1
II0
IIIIIIIIIIIIIIII
PAGE 32
ANNUAL GROUND LEVEL CONCENTRATION ( MICROGRAMS PER CUBIC METER ) FROM ALL SOURCES COMBINED (CONT.) **
U.3
1948.7
564.5
58.2
-26.9
-23.5
-1265.0-402.0
1.4893343.2230383.7082191.760651
- DISCRETE RECEPTORS -
X Y CONCENTRATION X Y CONCENTRATION
DISTANCE DISTANCE DISTANCE DISTANCE
(METERS) (METERS ) (METERS) (METERS )
1600.1
1948.7
542.8
281.3
-667.4
-1184.0
2.847366
3.969897
5.590256
1725.81430.6211.2
- PROGRAM DETERMINED MAXIMUM 10 VALUES -
X Y CONCENTRATION
COORDINATE COORDINATE
(METERS) (METERS )
900.00
1000.00
1000.00
900.00
800.00
1100.00
900.00
800.00
1100.00
1100.00
-700.00
-700.00
-800.00
-800.00
-800.00
-700.00
-600.00
-600.00
-800.00
-600.00
88.846980
79.904880
62.329950
56.888600
54.225420
44.178780
42.612450
34.597480
34.484150
34.150990
-23.5-983.6-1134.5
4.281786
4.117585
5.954542

II
IIIIIIIIIIIIIIII
ft***************************** ENO OF JSCLT PROGRAM, 3 SOURCES PROCESSED•••••A**********************************