regency at boxborough massachusetts avenue€¦ · traffic impact and access study . regency at...
TRANSCRIPT
REGENCY AT BOXBOROUGH
Massachusetts Avenue
Boxborough, MA December 12, 2016
Boxborough Town Center, LLC
TRAFFIC IMPACT AND ACCESS STUDY
REGENCY AT BOXBOROUGH
Massachusetts Avenue Boxborough, Massachusetts
Prepared for:
BOXBOROUGH TOWN CENTER, LLC
December 12, 2016
Prepared by:
Bayside Engineering 600 Unicorn Park Drive
Woburn, MA 01801
TABLE OF CONTENTS
Section Title Page
1 Executive Summary 1
2 Existing Traffic Conditions 6
Study Area 6 Field Survey 6 Geometrics 7 Traffic Volumes 8 Motor Vehicle Crash Data 12 Vehicle Speeds 14 Planned Roadway Improvements 14
3 Future No-Build and Build Traffic Conditions 15
Future 2023 No-Build Traffic Volumes 15 Future 2023 Build Conditions 19
4 Analysis 25
Methodology 25 Capacity Analysis Results 27 Sight Distance Analysis 30
5 Recommendations and Conclusion 34
Recommendations 34 Conclusion 34
Appendix
TABLES
No. Title Page
1 Existing Weekday Traffic-Volume Summary 9
2 Motor Vehicle Crash Data Summary 13
3 Observed Vehicle Speeds 14
4 Trip-Generation Summary 19
5 Proposed Trip Distribution 20
6 Traffic-Volume Increases 21
7 Level-of-Service Criteria for Signalized Intersections 26
8 Level-of-Service Criteria for Unsignalized Intersections 27
9 Unsignalized Level-of-Service Summary 28
10 Sight Distance Summary 31
FIGURES
No. Title Page
1 Site Location Map 2
2 2016 Existing Weekday Morning Peak Hour Traffic Volumes 10
3 2016 Existing Weekday Evening Peak Hour Traffic Volumes 11
4 2023 No-Build Weekday Morning Peak Hour Traffic Volumes 17
5 2023 No-Build Weekday Morning Peak Hour Traffic Volumes 18
6 Site Generated Traffic Volumes 22
7 2023 Build Weekday Morning Peak Hour Traffic Volumes 23
8 2023 Build Weekday Evening Peak Hour Traffic Volumes 24
1 Q:\Projects\16 PROJECTS\2162135 - BOXBOROUGH TOWN CENTER-Residential\Traffic\Reports\TIAS 121216 F.docx
SECTION 1: EXECUTIVE SUMMARY
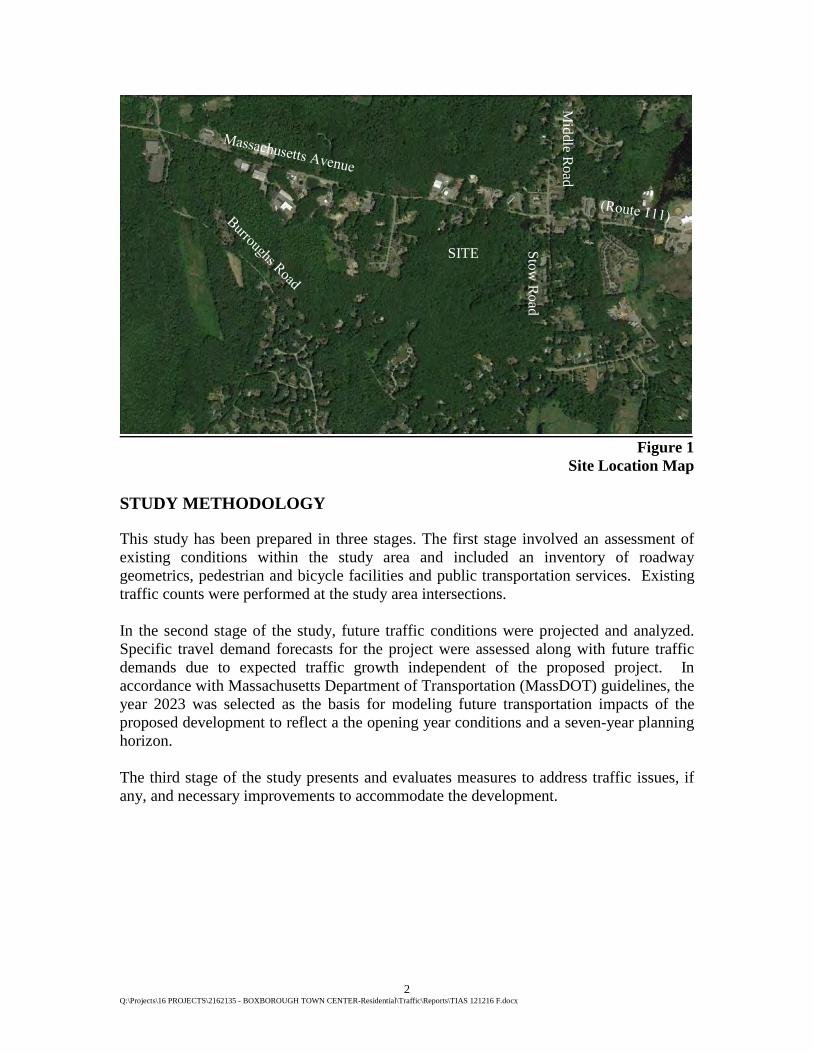
Bayside Engineering has prepared this study to assess the traffic impact and to evaluate the access requirements of the proposed Regency at Boxborough located at 800 Massachusetts Avenue in Boxborough, Massachusetts. This report identifies existing traffic operating parameters on key roadways and intersections within the study area, evaluates the anticipated traffic volume increases as a result of the proposed project, analyzes the project’s traffic-related impacts, determines the projects access/egress requirements and identifies appropriate mitigating measures designed to minimize the traffic-related impacts created by the project. The following provides a brief summary of the study findings. PROJECT DESCRIPTION The existing site is located along the south side of Massachusetts Avenue (Route 111) west of the intersection of Stow Road and Middle Road in Boxborough, MA. Currently, the site contains a single-family home. Access to the home is currently provided by way of a single driveway. As currently proposed, the project will consist of razing the existing home and the construction of 100 age-restricted townhouse units. Access to the site will be provided by way of a full-movement driveway to Massachusetts Avenue. Emergency access is proposed by way of driveway connections at the end of Priest’s Lane and through the Sheriff’s Meadow residential development on Stow Road. Figure 1 shows the site location in relation to the surrounding area.
2 Q:\Projects\16 PROJECTS\2162135 - BOXBOROUGH TOWN CENTER-Residential\Traffic\Reports\TIAS 121216 F.docx
Figure 1
Site Location Map
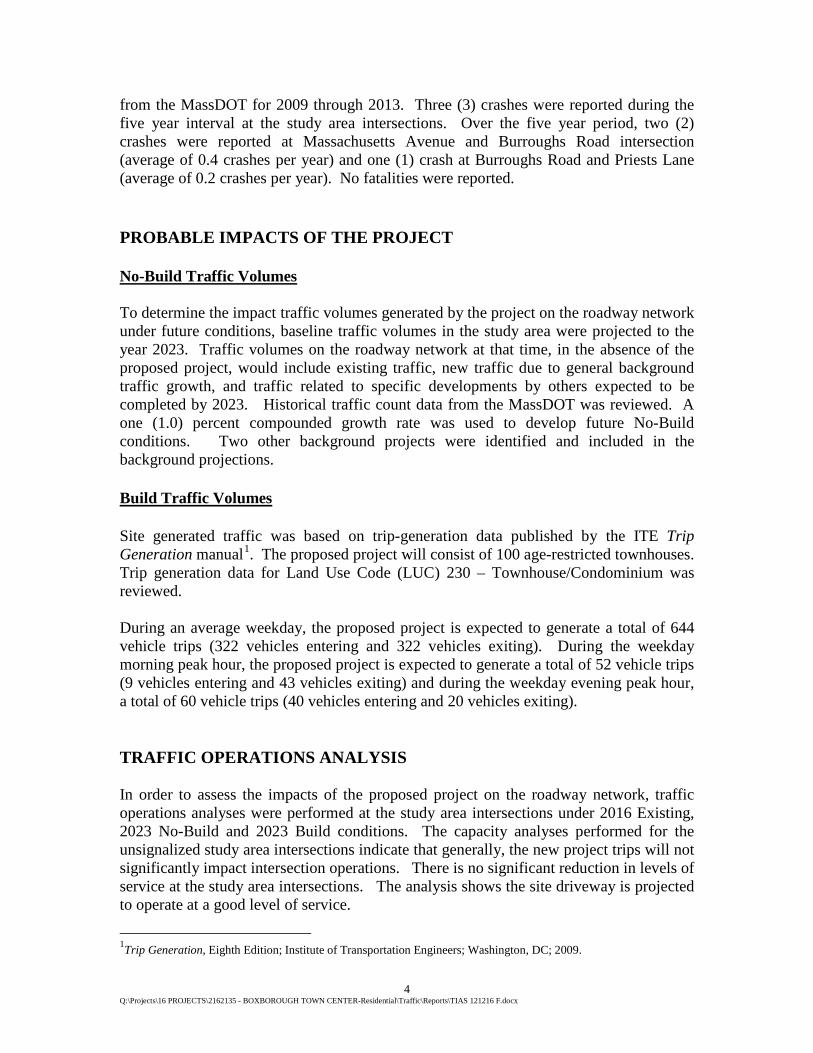
STUDY METHODOLOGY This study has been prepared in three stages. The first stage involved an assessment of existing conditions within the study area and included an inventory of roadway geometrics, pedestrian and bicycle facilities and public transportation services. Existing traffic counts were performed at the study area intersections. In the second stage of the study, future traffic conditions were projected and analyzed. Specific travel demand forecasts for the project were assessed along with future traffic demands due to expected traffic growth independent of the proposed project. In accordance with Massachusetts Department of Transportation (MassDOT) guidelines, the year 2023 was selected as the basis for modeling future transportation impacts of the proposed development to reflect a the opening year conditions and a seven-year planning horizon. The third stage of the study presents and evaluates measures to address traffic issues, if any, and necessary improvements to accommodate the development.
SITE Stow R
oad
Middle R
oad

3 Q:\Projects\16 PROJECTS\2162135 - BOXBOROUGH TOWN CENTER-Residential\Traffic\Reports\TIAS 121216 F.docx
STUDY AREA Roadway geometry and traffic control information was collected for the following locations:
• Massachusetts Avenue, Stow Road and Middle Road • Massachusetts Avenue, Burroughs Road and Hill Street • Stow Road and Sheriff’s Meadow Driveway • Stow Road and Burroughs Road • Burroughs Road and Priest’s Lane
EXISTING CONDITIONS Evaluation of existing conditions within the study area includes a description of roadway geometrics, traffic constraints, land uses at the intersections, and quantification of traffic volumes. Existing Traffic Volumes To establish base traffic conditions within the study area, manual turning movement and vehicle classification counts were obtained in February 2016. Peak-period turning movement counts were conducted during the weekday morning period (7:00 to 9:00 AM) and the weekday evening peak period (4:00 to 6:00 PM). Daily traffic counts were conducted on Massachusetts Avenue and Stow Road for a two day period using automatic traffic recorders (ATR). The traffic-volume data gathered as part of this study was collected during the month of February 2016. Data from the MassDOT was reviewed to determine the monthly variations of the traffic volumes. Based upon the available traffic count data, February volumes are slightly lower than average month conditions. To represent average month conditions, existing volumes were adjusted upward by a factor of 1.07. Massachusetts Avenue, west of Stow Road was recorded to carry approximately 7,150 vehicles per day (vpd). During the weekday morning peak hour, approximately 634 vehicles per hour (vph) were recorded and during the weekday evening peak hour, 696 vph were recorded. Stow Road, south of Massachusetts Avenue was recorded to carry approximately 1,050 vpd. During the weekday morning peak hour, approximately 122 vph were recorded on Stow Road south of Massachusetts Avenue and during the weekday evening peak hour, 95 vph were recorded. Motor Vehicle Crash Data Motor vehicle crash data for the study area intersections and roadways were obtained
4 Q:\Projects\16 PROJECTS\2162135 - BOXBOROUGH TOWN CENTER-Residential\Traffic\Reports\TIAS 121216 F.docx
from the MassDOT for 2009 through 2013. Three (3) crashes were reported during the five year interval at the study area intersections. Over the five year period, two (2) crashes were reported at Massachusetts Avenue and Burroughs Road intersection (average of 0.4 crashes per year) and one (1) crash at Burroughs Road and Priests Lane (average of 0.2 crashes per year). No fatalities were reported. PROBABLE IMPACTS OF THE PROJECT No-Build Traffic Volumes To determine the impact traffic volumes generated by the project on the roadway network under future conditions, baseline traffic volumes in the study area were projected to the year 2023. Traffic volumes on the roadway network at that time, in the absence of the proposed project, would include existing traffic, new traffic due to general background traffic growth, and traffic related to specific developments by others expected to be completed by 2023. Historical traffic count data from the MassDOT was reviewed. A one (1.0) percent compounded growth rate was used to develop future No-Build conditions. Two other background projects were identified and included in the background projections. Build Traffic Volumes Site generated traffic was based on trip-generation data published by the ITE Trip Generation manual1. The proposed project will consist of 100 age-restricted townhouses. Trip generation data for Land Use Code (LUC) 230 – Townhouse/Condominium was reviewed. During an average weekday, the proposed project is expected to generate a total of 644 vehicle trips (322 vehicles entering and 322 vehicles exiting). During the weekday morning peak hour, the proposed project is expected to generate a total of 52 vehicle trips (9 vehicles entering and 43 vehicles exiting) and during the weekday evening peak hour, a total of 60 vehicle trips (40 vehicles entering and 20 vehicles exiting). TRAFFIC OPERATIONS ANALYSIS In order to assess the impacts of the proposed project on the roadway network, traffic operations analyses were performed at the study area intersections under 2016 Existing, 2023 No-Build and 2023 Build conditions. The capacity analyses performed for the unsignalized study area intersections indicate that generally, the new project trips will not significantly impact intersection operations. There is no significant reduction in levels of service at the study area intersections. The analysis shows the site driveway is projected to operate at a good level of service.
1Trip Generation, Eighth Edition; Institute of Transportation Engineers; Washington, DC; 2009.

5 Q:\Projects\16 PROJECTS\2162135 - BOXBOROUGH TOWN CENTER-Residential\Traffic\Reports\TIAS 121216 F.docx
RECOMMENDATIONS As a result of the additional traffic generation being relatively low, it is expected that the project will not have a significant impact on intersection operations in the study area. The Massachusetts Avenue main site driveway should permit entering movements from both directions on Massachusetts Avenue. Exiting movements should be in a single lane under STOP-sign control. It is recommended that a sight distance easement be established east of the site driveway and that this area be re-graded to provide the sight lines and be kept clear of plantings that would obstruct sight distances. Also, at the site driveway intersection, and along the site frontage and within the existing Massachusetts Avenue layout, it is recommended that any proposed landscaping be designed to not exceed three (3) feet in height in order to maintain these sight lines. SUMMARY Review of the proposed project and the access plan shows that in relation to roadway capacity, traffic safety, and traffic impacts upon the surrounding roadway network, the proposed project will meet safety standards and have a minimal impact on existing traffic conditions. With the proposed access, and maintaining sight distances from the Massachusetts Avenue driveway (clear sight lines along frontage), safe and efficient access can be provided to the patrons of the proposed project and to the motoring public in the area.
6 Q:\Projects\16 PROJECTS\2162135 - BOXBOROUGH TOWN CENTER-Residential\Traffic\Reports\TIAS 121216 F.docx
SECTION 2: EXISTING TRAFFIC CONDITIONS
STUDY AREA Roadway geometry and traffic control information was collected for the following locations:
• Massachusetts Avenue, Stow Road and Middle Road • Massachusetts Avenue, Burroughs Road and Hill Street • Stow Road and Sheriff’s Meadow Driveway • Stow Road and Burroughs Road • Burroughs Road and Priest’s Lane
FIELD SURVEY A comprehensive field inventory of the proposed site was conducted in February 2016. The inventory included collection of existing roadway geometrics, traffic volumes, and safety data for the existing study area intersections and site access driveway location. Traffic volumes were measured by means of automatic traffic recorder (ATR) counts and substantiated by manual turning movement counts (TMCs) conducted at the study area intersections.
7 Q:\Projects\16 PROJECTS\2162135 - BOXBOROUGH TOWN CENTER-Residential\Traffic\Reports\TIAS 121216 F.docx
GEOMETRICS Primary study area roadways are described below. Roadways Massachusetts Avenue (Route 111) Massachusetts Avenue (Route 111) is classified as an Urban Minor Arterial and is under the jurisdiction of the MassDOT. Route 111 traverses northeastern Massachusetts in an east-west direction from its eastern terminus at the Concord Rotary in Concord, MA to Route 110 in Harvard, MA where the roadway then turns northerly to the New Hampshire state line. In the study area, Massachusetts Avenue is a two-lane roadway. Additional turn lanes are provided at major signalized intersections. The posted speed limit is 40 miles per hour (mph). Land use along Massachusetts Avenue in the study area is primarily residential, with several commercial properties along the north side of the road. Stow Road Stow Road is a local street extending in a north/south direction from Massachusetts Avenue southerly to the intersection of Boxboro Road, Fifers Lane and Flagg Hill Road. Stow Road is under the jurisdiction of the Town of Boxborough. Stow Road provides one travel lane per direction, separated by a double yellow centerline. The posted speed limit is 30 mph. Land use along Stow Road is residential. Intersections Massachusetts Avenue, Stow Road and Middle Road Stow Road intersects Massachusetts Avenue from the south and Middle Road intersects from the north to form this four-legged, unsignalized intersection. The Massachusetts Avenue eastbound and westbound approaches each consist of a through lane permitting left- or right-turns. The Stow Road approach consists of a single lane permitting all movements and is under STOP-sign control. The Middle Road approach consists of a single lane permitting all movements and is under STOP-sign control. A sidewalk exists along the north side of Massachusetts Avenue east of the intersection. Land use in the vicinity of the intersection consists of a church, a single-family home, a multi-family apartment complex and a small commercial building. Massachusetts Avenue, Burroughs Road and Hill Road Burroughs Road intersects Massachusetts Avenue from the south and Hill Road intersects from the north to form this four-legged, unsignalized intersection. The Massachusetts Avenue eastbound and westbound approaches each consist of a through lane permitting left- or right-turns. The Burroughs Road approach consists of a single lane permitting all
8 Q:\Projects\16 PROJECTS\2162135 - BOXBOROUGH TOWN CENTER-Residential\Traffic\Reports\TIAS 121216 F.docx
movements and is under STOP-sign control. The Hill Road approach consists of a single lane permitting all movements and is under STOP-sign control. Land use in the vicinity of the intersection consists of wooded land, an office building and a single-family home. Stow Road and Sheriff’s Meadow Driveway The Sheriff’s Meadow driveway intersects Stow Road from the west to form this three-legged, unsignalized intersection. The Stow Road northbound and southbound approaches each consist of a through lane permitting left- or right-turns. The Sheriff’s Meadow driveway approach consists of a single lane permitting all movements and is under STOP-sign control. Land use in the vicinity of the intersection consists of wooded land and residential homes. Stow Road and Burroughs Road Burroughs Road intersects Stow Road from the east and west to form this four-legged, unsignalized intersection. All approaches to the intersection consist of a through lane permitting left- or right-turns. The Burroughs Road approaches are under STOP-sign control. Land use in the vicinity of the intersection consists of wooded land, a cemetery and a single-family home. Burroughs Road and Priest’s Lane Priest’s Lane intersects Burroughs Road from the north to form this three-legged, unsignalized intersection. The Burroughs Road approaches to the intersection consist of a through lane permitting left- or right-turns. The Priest’s Lane approach consists of a single lane and permit’s left- or right-turns and is under STOP-sign control. Land use in the vicinity intersection consists of wooded land and single-family homes. TRAFFIC VOLUMES Existing Traffic Volumes To establish base traffic conditions within the study area, manual turning movement and vehicle classification counts were obtained in February 2016. Peak-period turning movement counts were conducted on Wednesday, February 24, 2016 during the weekday morning and evening peak periods (7:00 to 9:00 AM and 4:00 to 6:00 PM) at the following intersections:
• Massachusetts Avenue, Stow Road and Middle Road • Massachusetts Avenue, Burroughs Road and Hill Street • Stow Road and Sheriff’s Meadow Driveway • Stow Road and Burroughs Road • Burroughs Road and Priest’s Lane
Daily traffic counts were conducted on Massachusetts Avenue and Stow Road for a two

9 Q:\Projects\16 PROJECTS\2162135 - BOXBOROUGH TOWN CENTER-Residential\Traffic\Reports\TIAS 121216 F.docx
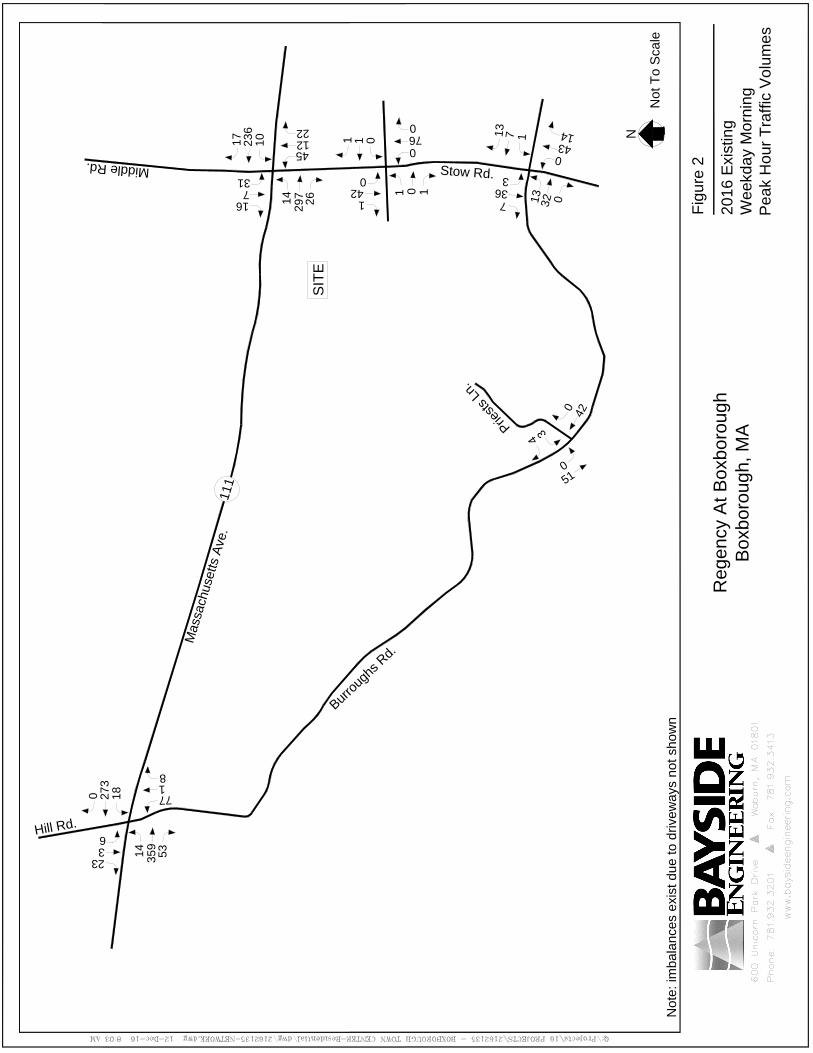
day period using automatic traffic recorders (ATR). Analysis of the peak-period traffic counts indicated that the weekday morning commuter peak hour generally occurs between 7:30 AM and 8:30 AM and the weekday evening commuter peak hour generally occurs between 5:00 and 6:00 PM. The traffic count worksheets are provided in the Appendix. Seasonal Adjustment The traffic-volume data gathered as part of this study was collected during the month of February 2016. Available traffic volume data from the MassDOT was reviewed to determine the monthly variations of the traffic volumes. The traffic data showed February volumes to be slightly lower than average month conditions. Therefore, the February traffic volumes were adjusted upward by a factor of 1.07 to represent average month conditions. The 2016 existing weekday daily and peak-hour traffic volumes for average-month conditions are summarized below in Table 1. The 2016 Existing weekday morning and weekday evening peak hour traffic flow networks are shown graphically on Figures 2 and 3. The seasonal worksheets are provided in the Appendix.
TABLE 1 EXISTING WEEKDAY TRAFFIC-VOLUME SUMMARYa
Daily
Weekday Morning Peak Hour Weekday Evening Peak Hour
Location Traffic
Volumeb Traffic
Volumec K
Factord Directional
Distributione Traffic Volume
K Factor
Directional Distribution
Massachusetts Avenue, west of Stow Road
7,150
634
8.9
53.2% EB
696
9.7
50.9% EB
Stow Road, south of Massachusetts Avenue
1,050
122
11.6
64.8% NB
95
9.0
56.8% NB
aTwo-way traffic volume. bDaily traffic expressed in vehicles per day. cExpressed in vehicles per hour. dPercent of daily traffic volumes which occurs during the peak hour. ePercent of peak-hour volume in the predominant direction of travel. NB = northbound; SB = southbound; EB = eastbound; WB = westbound.
20
16
E
xistin
g
We
ekd
ay M
orn
in
g
Pe
ak H
ou
r T
ra
ffic V
olu
me
s
N
Not T
o S
cale
Fig
ure
2
Regency A
t B
oxborough
Boxborough, M
A
Note: im
balances exist due to drivew
ays not show
n
10
236
17
M
a
s
s
a
c
h
u
s
e
tts
A
v
e
.1
1
1
26
297
14
45
B
u
r
r
o
u
g
h
s
R
d
.
P
r
i
e
s
t
s
L
n
.
4
3
12
22
16
7
31
0
4
2
5
1
0
23
3
6
18
273
0
53
359
14
77
1
8
01
3
0
4
3
7
36
H
ill R
d
.
1
4
3
2
3
1
13
7
01
1
1
0
1
0
76
0
1
42
0
Sto
w R
d.
Mid
dle
Rd.
SIT
E

20
16
E
xistin
g
We
ekd
ay E
ve
nin
g
Pe
ak H
ou
r T
ra
ffic V
olu
me
s
N
Not T
o S
cale
Fig
ure
3
Regency A
t B
oxborough
Boxborough, M
A
Note: im
balances exist due to drivew
ays not show
n
11
303
35
M
a
s
s
a
c
h
u
s
e
tts
A
v
e
.
1
1
1
26
313
15
29
B
u
r
r
o
u
g
h
s
R
d
.
P
r
i
e
s
t
s
L
n
.
0
3
13
12
10
4
23
1
5
3
5
7
4
21
3
6
14
332
14
72
349
35
68
4
9
0
6
1
3
1
7
26
H
ill R
d
.
1
0
1
8
6
23
12
42
00
0
0
0
1
1
44
1
3
40
0
Sto
w R
d.
Mid
dle
Rd.
SIT
E
12 Q:\Projects\16 PROJECTS\2162135 - BOXBOROUGH TOWN CENTER-Residential\Traffic\Reports\TIAS 121216 F.docx
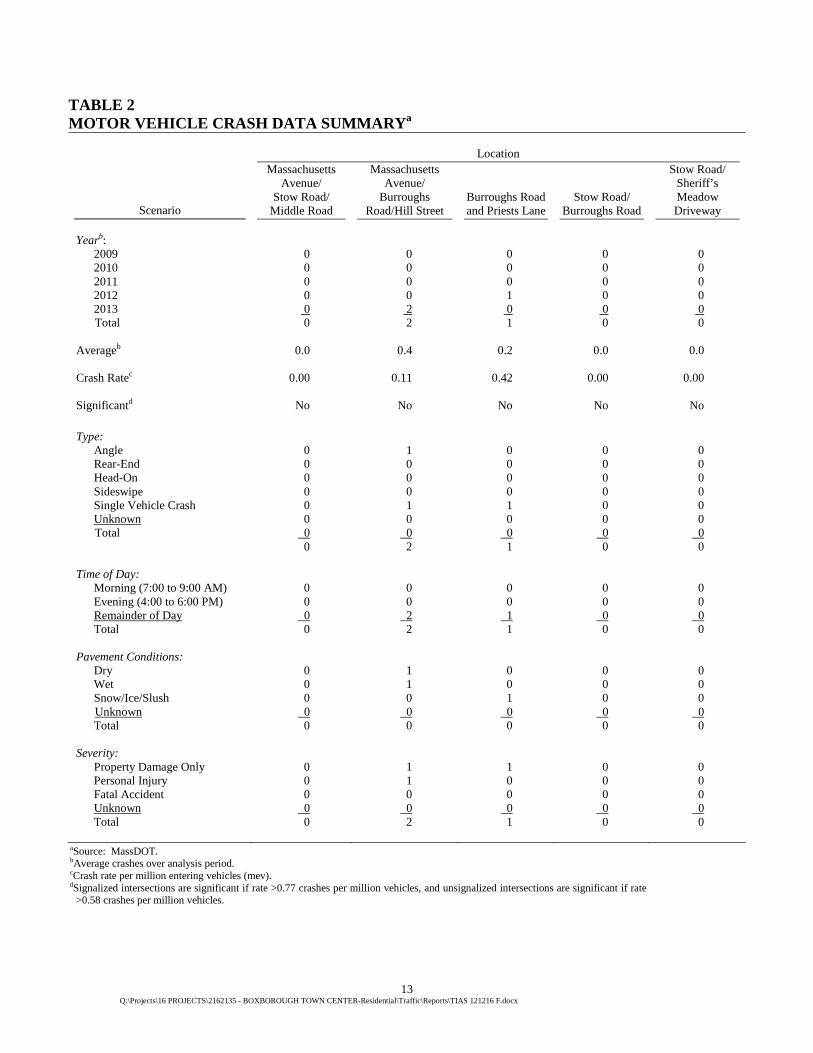
Massachusetts Avenue, west of Stow Road was recorded to carry approximately 7,150 vehicles per day (vpd). During the weekday morning peak hour, approximately 634 vehicles per hour (vph) were recorded and during the weekday evening peak hour, 696 vph were recorded. Stow Road, south of Massachusetts Avenue was recorded to carry approximately 1,050 vpd. During the weekday morning peak hour, approximately 122 vph were recorded on Stow Road, south of Massachusetts Avenue and during the weekday evening peak hour, 95 vph were recorded. MOTOR VEHICLE CRASH DATA Motor vehicle crash data for the study area intersections and roadways were obtained from the MassDOT for 2009 through 2013. Three (3) crashes were reported during the five year interval at the study area intersections. Over the five year period, two (2) crashes were reported at Massachusetts Avenue and Burroughs Road intersection (average of 0.4 crashes per year) and one (1) crash at Burroughs Road and Priests Lane (average of 0.2 crashes per year). No fatalities were reported. The crash data is included in the Appendix. The crash data is summarized in Table 2. None of the intersections experienced a significant crash rate.
13 Q:\Projects\16 PROJECTS\2162135 - BOXBOROUGH TOWN CENTER-Residential\Traffic\Reports\TIAS 121216 F.docx
TABLE 2 MOTOR VEHICLE CRASH DATA SUMMARYa
Location
Scenario
Massachusetts Avenue/
Stow Road/ Middle Road
Massachusetts Avenue/
Burroughs Road/Hill Street
Burroughs Road and Priests Lane
Stow Road/ Burroughs Road
Stow Road/ Sheriff’s Meadow Driveway
Yearb: 2009 2010 2011 2012 2013 Total
0 0 0 0 0 0
0 0 0 0 2 2
0 0 0 1 0 1
0 0 0 0 0 0
0 0 0 0 0 0
Averageb
0.0
0.4
0.2
0.0
0.0
Crash Ratec
0.00
0.11
0.42
0.00
0.00
Significantd
No
No
No
No
No
Type: Angle Rear-End Head-On Sideswipe Single Vehicle Crash Unknown Total
0 0 0 0 0 0
0 0
1 0 0 0 1 0
0 2
0 0 0 0 1 0
0 1
0 0 0 0 0 0
0 0
0 0 0 0 0 0
0 0
Time of Day: Morning (7:00 to 9:00 AM) Evening (4:00 to 6:00 PM) Remainder of Day Total
0 0
0 0
0 0
2 2
0 0
1 1
0 0
0 0
0 0
0 0
Pavement Conditions: Dry Wet Snow/Ice/Slush Unknown Total
0 0
0 0 0
1 1
0 0 0
0 0
1 0 0
0 0
0 0 0
0 0
0 0 0
Severity: Property Damage Only Personal Injury Fatal Accident Unknown Total
0 0 0
0 0
1 1 0
0 2
1 0 0
0 1
0 0 0
0 0
0 0 0
0 0
aSource: MassDOT. bAverage crashes over analysis period. cCrash rate per million entering vehicles (mev). dSignalized intersections are significant if rate >0.77 crashes per million vehicles, and unsignalized intersections are significant if rate
>0.58 crashes per million vehicles.
14 Q:\Projects\16 PROJECTS\2162135 - BOXBOROUGH TOWN CENTER-Residential\Traffic\Reports\TIAS 121216 F.docx
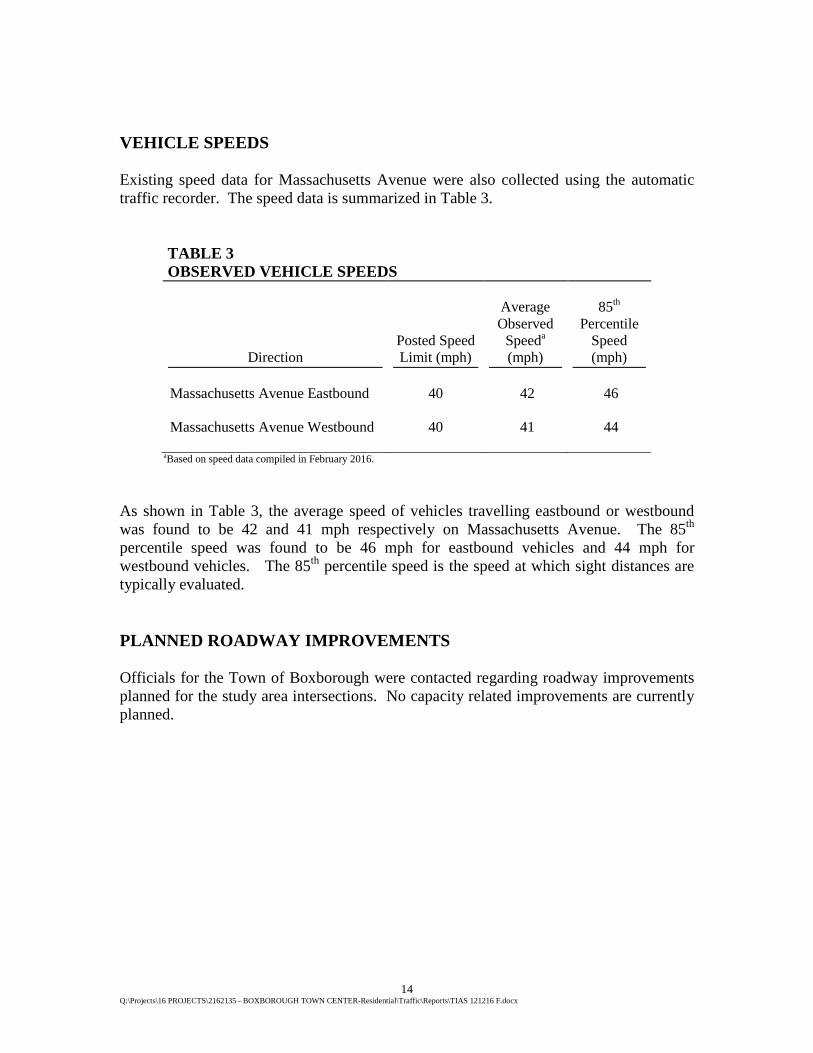
VEHICLE SPEEDS Existing speed data for Massachusetts Avenue were also collected using the automatic traffic recorder. The speed data is summarized in Table 3.
TABLE 3 OBSERVED VEHICLE SPEEDS
Direction
Posted Speed Limit (mph)
Average Observed
Speeda (mph)
85th
Percentile Speed (mph)
Massachusetts Avenue Eastbound
40
42
46
Massachusetts Avenue Westbound
40
41
44
aBased on speed data compiled in February 2016. As shown in Table 3, the average speed of vehicles travelling eastbound or westbound was found to be 42 and 41 mph respectively on Massachusetts Avenue. The 85th percentile speed was found to be 46 mph for eastbound vehicles and 44 mph for westbound vehicles. The 85th percentile speed is the speed at which sight distances are typically evaluated. PLANNED ROADWAY IMPROVEMENTS Officials for the Town of Boxborough were contacted regarding roadway improvements planned for the study area intersections. No capacity related improvements are currently planned.
15 Q:\Projects\16 PROJECTS\2162135 - BOXBOROUGH TOWN CENTER-Residential\Traffic\Reports\TIAS 121216 F.docx
SECTION 3: FUTURE NO-BUILD AND BUILD TRAFFIC CONDITIONS
To determine the impact of site-generated traffic volumes on the roadway network under future conditions, baseline traffic volumes in the study area were projected to the year 2023. Traffic volumes on the roadway network at that time, in the absence of the proposed project, would include existing traffic, new traffic due to general background traffic growth, and traffic related to specific developments by others expected to be completed by 2023. Consideration of these factors resulted in the development of 2023 No-Build traffic volumes. Anticipated site-generated traffic volumes were then superimposed upon these No-Build traffic flow networks to develop the 2023 Build conditions. FUTURE 2023 NO-BUILD TRAFFIC VOLUMES Traffic growth on area roadways is a function of the expected land development in the immediate area as well as the surrounding region. Several methods can be used to estimate this growth. A procedure frequently employed estimates an annual percentage increase in traffic growth and applies that percentage to all traffic volumes under study. The drawback to such a procedure is that some turning volumes may actually grow at either a higher or a lower rate at particular intersections. An alternative procedure identifies the location and type of planned development, estimates the traffic to be generated, and assigns it to the area roadway network. This produces a more realistic estimate of growth for local traffic. However, the drawback of this procedure is that the potential growth in population and development external to the study area would not be accounted for in the traffic projections. To provide a conservative analysis framework, both procedures were used.
16 Q:\Projects\16 PROJECTS\2162135 - BOXBOROUGH TOWN CENTER-Residential\Traffic\Reports\TIAS 121216 F.docx
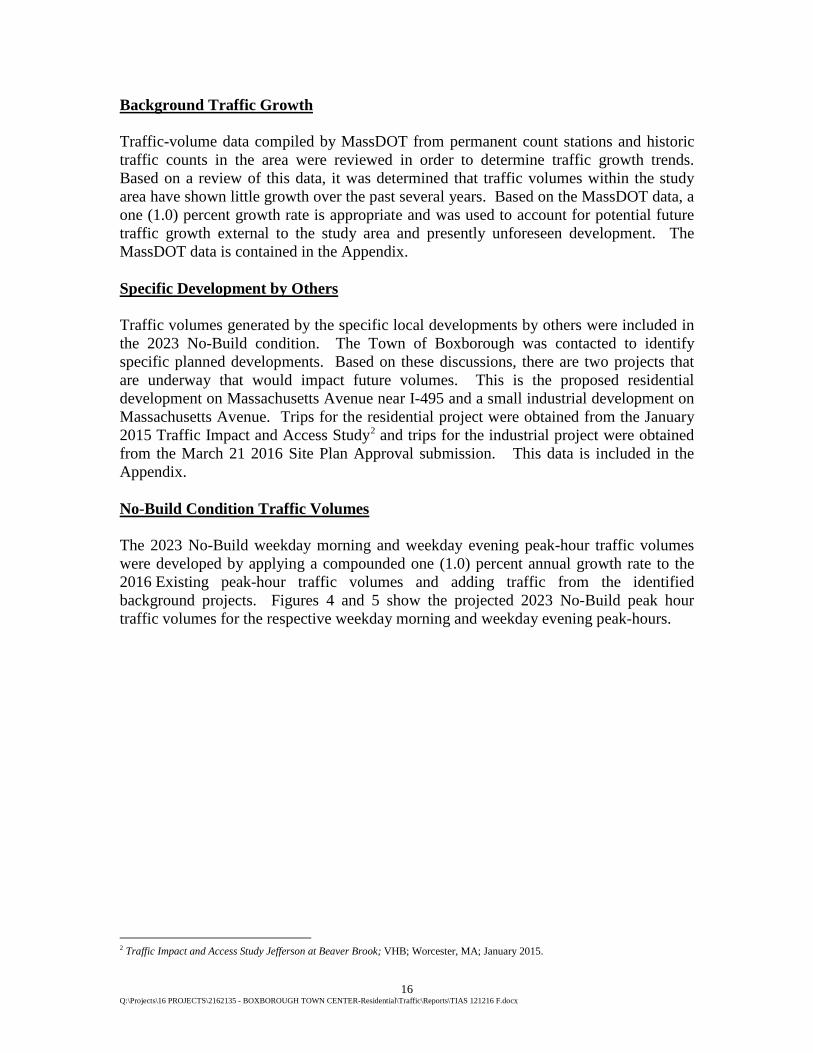
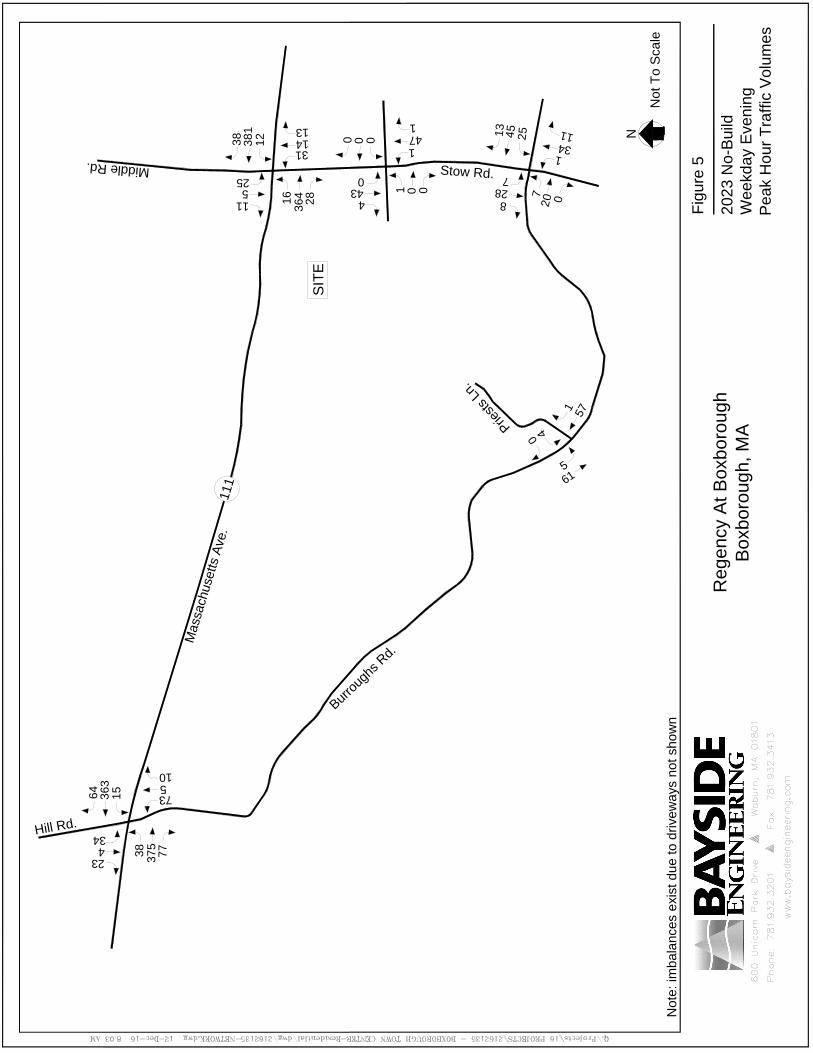
Background Traffic Growth Traffic-volume data compiled by MassDOT from permanent count stations and historic traffic counts in the area were reviewed in order to determine traffic growth trends. Based on a review of this data, it was determined that traffic volumes within the study area have shown little growth over the past several years. Based on the MassDOT data, a one (1.0) percent growth rate is appropriate and was used to account for potential future traffic growth external to the study area and presently unforeseen development. The MassDOT data is contained in the Appendix. Specific Development by Others Traffic volumes generated by the specific local developments by others were included in the 2023 No-Build condition. The Town of Boxborough was contacted to identify specific planned developments. Based on these discussions, there are two projects that are underway that would impact future volumes. This is the proposed residential development on Massachusetts Avenue near I-495 and a small industrial development on Massachusetts Avenue. Trips for the residential project were obtained from the January 2015 Traffic Impact and Access Study2 and trips for the industrial project were obtained from the March 21 2016 Site Plan Approval submission. This data is included in the Appendix. No-Build Condition Traffic Volumes The 2023 No-Build weekday morning and weekday evening peak-hour traffic volumes were developed by applying a compounded one (1.0) percent annual growth rate to the 2016 Existing peak-hour traffic volumes and adding traffic from the identified background projects. Figures 4 and 5 show the projected 2023 No-Build peak hour traffic volumes for the respective weekday morning and weekday evening peak-hours.
2 Traffic Impact and Access Study Jefferson at Beaver Brook; VHB; Worcester, MA; January 2015.

20
23
N
o-B
uild
We
ekd
ay M
orn
in
g
Pe
ak H
ou
r T
ra
ffic V
olu
me
s
N
Not T
o S
cale
Fig
ure
4
Regency A
t B
oxborough
Boxborough, M
A
Note: im
balances exist due to drivew
ays not show
n
11
265
19
M
a
s
s
a
c
h
u
s
e
tts
A
v
e
.
1
1
1
28
375
15
49
B
u
r
r
o
u
g
h
s
R
d
.
P
r
i
e
s
t
s
L
n
.
5
4
13
24
18
8
34
0
4
5
5
5
0
25
4
56
20
294
12
57
392
15
83
1
9
01
4
0
4
6
8
39
H
ill R
d
.
1
5
3
5
4
1
14
8
01
1
1
0
1
0
82
0
1
45
0
Sto
w R
d.
Mid
dle
Rd.
SIT
E
20
23
N
o-B
uild
We
ekd
ay E
ve
nin
g
Pe
ak H
ou
r T
ra
ffic V
olu
me
s
N
Not T
o S
cale
Fig
ure
5
Regency A
t B
oxborough
Boxborough, M
A
Note: im
balances exist due to drivew
ays not show
n
12
381
38
M
a
s
s
a
c
h
u
s
e
tts
A
v
e
.
1
1
1
28
364
16
31
B
u
r
r
o
u
g
h
s
R
d
.
P
r
i
e
s
t
s
L
n
.
0
4
14
13
11
5
25
1
5
7
6
1
5
23
4
34
15
363
64
77
375
38
73
5
10
0
7
1
3
4
8
28
H
ill R
d
.
1
1
2
0
7
25
13
45
00
0
0
0
1
1
47
1
4
43
0
Sto
w R
d.
Mid
dle
Rd.
SIT
E
19 Q:\Projects\16 PROJECTS\2162135 - BOXBOROUGH TOWN CENTER-Residential\Traffic\Reports\TIAS 121216 F.docx
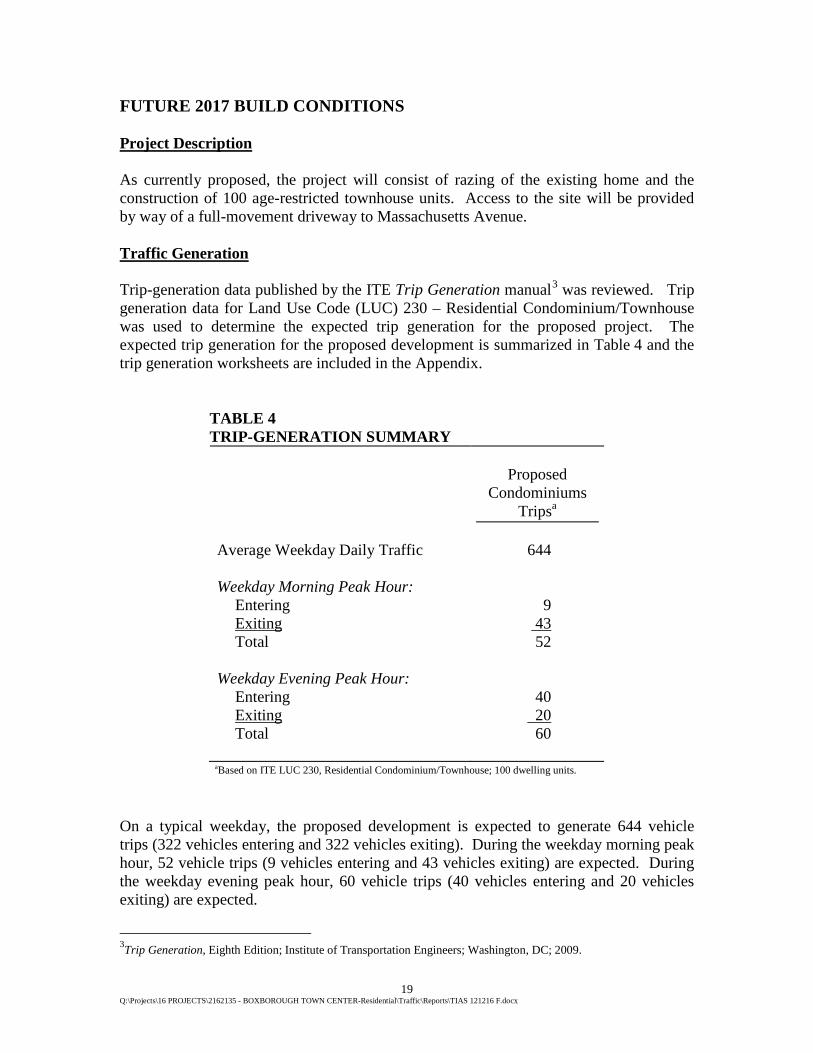
FUTURE 2017 BUILD CONDITIONS Project Description As currently proposed, the project will consist of razing of the existing home and the construction of 100 age-restricted townhouse units. Access to the site will be provided by way of a full-movement driveway to Massachusetts Avenue. Traffic Generation Trip-generation data published by the ITE Trip Generation manual3 was reviewed. Trip generation data for Land Use Code (LUC) 230 – Residential Condominium/Townhouse was used to determine the expected trip generation for the proposed project. The expected trip generation for the proposed development is summarized in Table 4 and the trip generation worksheets are included in the Appendix.
TABLE 4 TRIP-GENERATION SUMMARY
Proposed Condominiums
Tripsa Average Weekday Daily Traffic
644
Weekday Morning Peak Hour: Entering Exiting Total
9 43 52
Weekday Evening Peak Hour: Entering Exiting Total
40 20 60
aBased on ITE LUC 230, Residential Condominium/Townhouse; 100 dwelling units.
On a typical weekday, the proposed development is expected to generate 644 vehicle trips (322 vehicles entering and 322 vehicles exiting). During the weekday morning peak hour, 52 vehicle trips (9 vehicles entering and 43 vehicles exiting) are expected. During the weekday evening peak hour, 60 vehicle trips (40 vehicles entering and 20 vehicles exiting) are expected.
3Trip Generation, Eighth Edition; Institute of Transportation Engineers; Washington, DC; 2009.
20 Q:\Projects\16 PROJECTS\2162135 - BOXBOROUGH TOWN CENTER-Residential\Traffic\Reports\TIAS 121216 F.docx
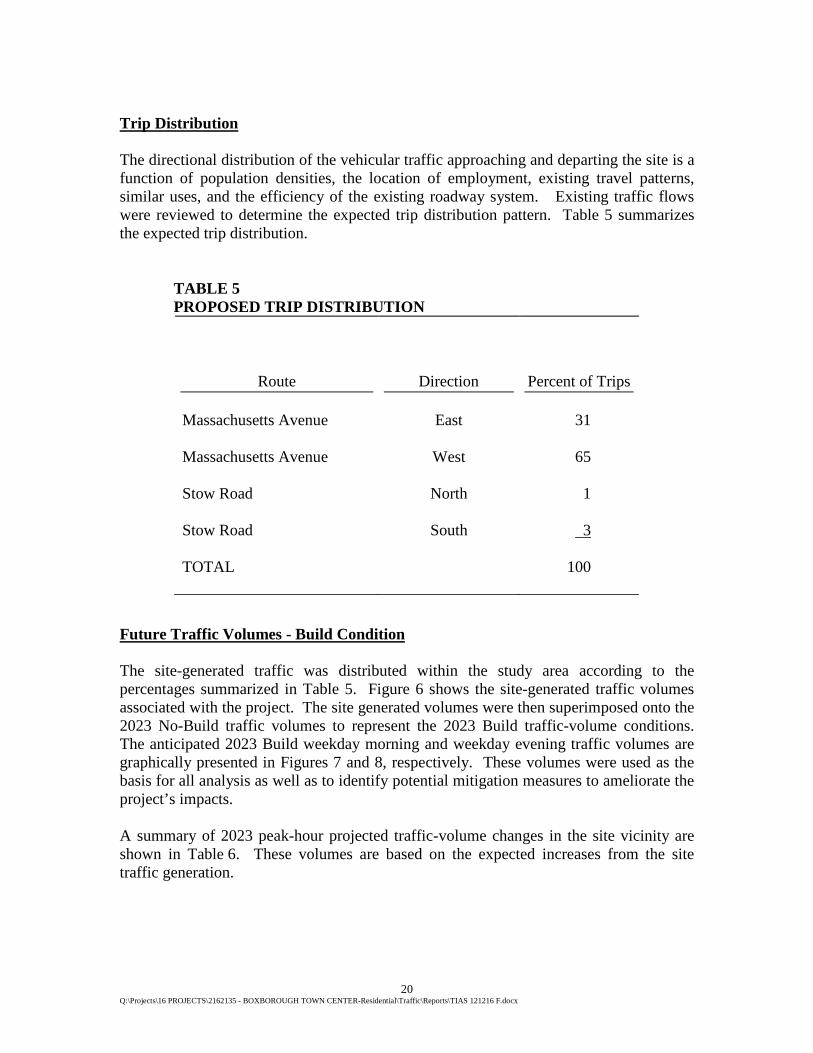
Trip Distribution The directional distribution of the vehicular traffic approaching and departing the site is a function of population densities, the location of employment, existing travel patterns, similar uses, and the efficiency of the existing roadway system. Existing traffic flows were reviewed to determine the expected trip distribution pattern. Table 5 summarizes the expected trip distribution.
TABLE 5 PROPOSED TRIP DISTRIBUTION
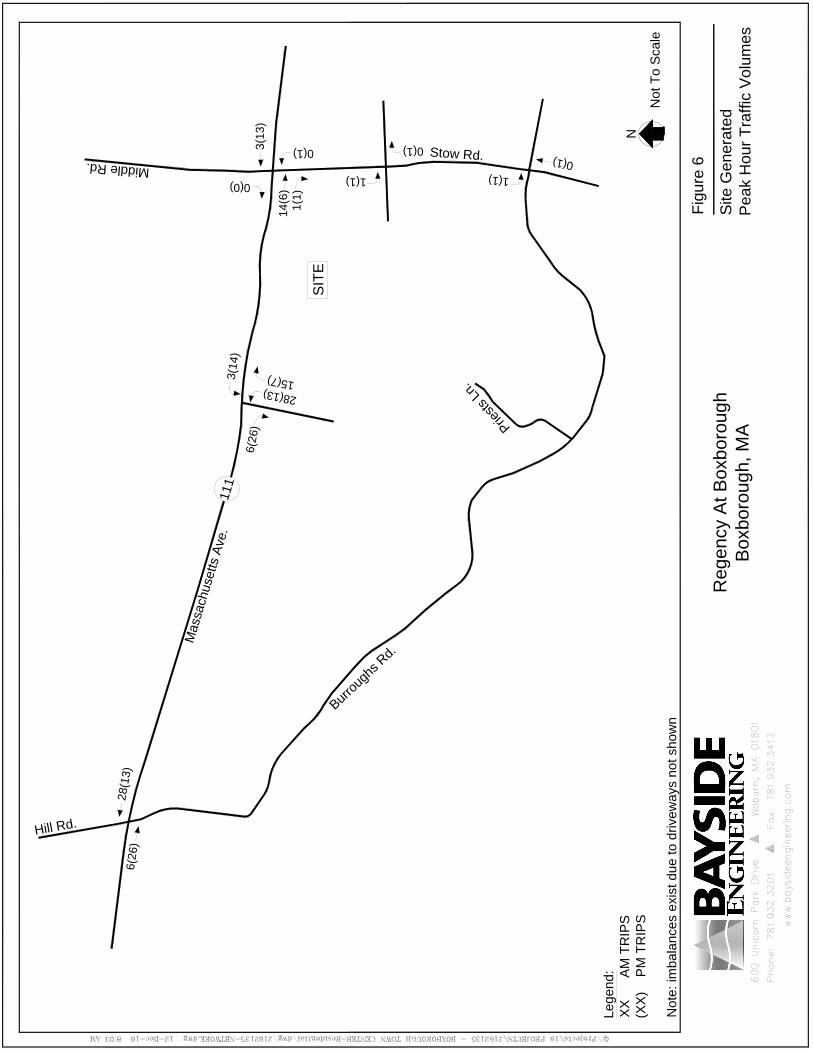
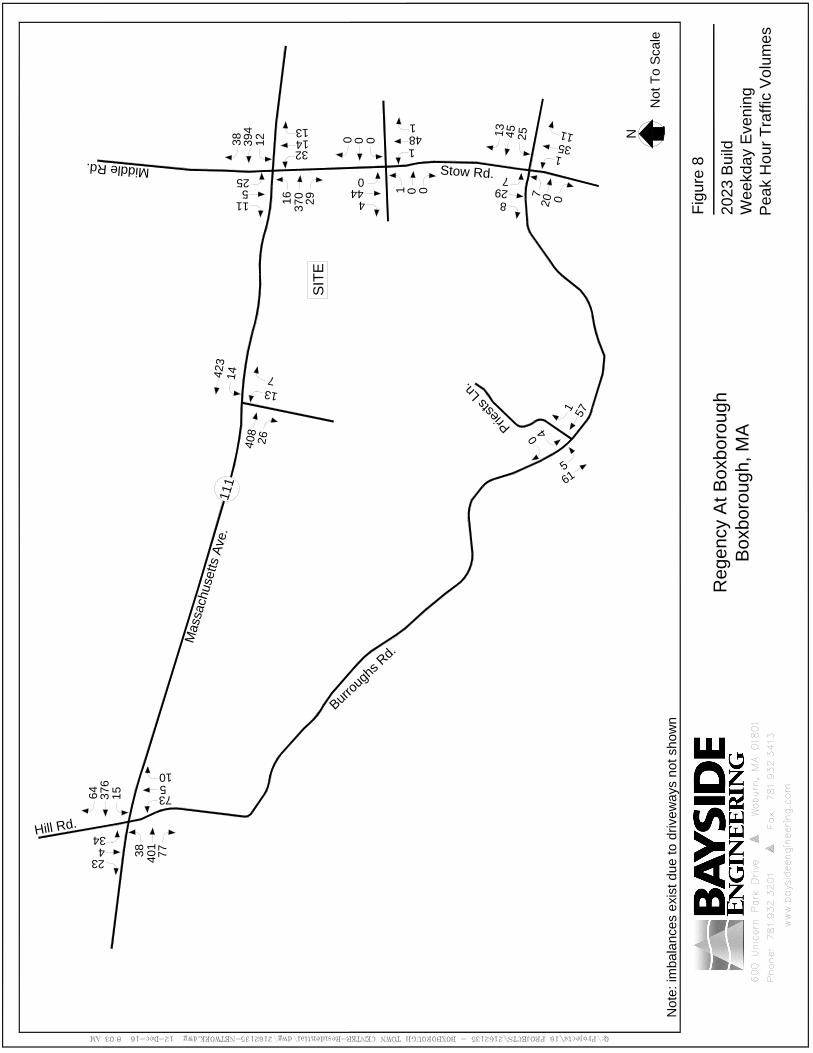
Future Traffic Volumes - Build Condition The site-generated traffic was distributed within the study area according to the percentages summarized in Table 5. Figure 6 shows the site-generated traffic volumes associated with the project. The site generated volumes were then superimposed onto the 2023 No-Build traffic volumes to represent the 2023 Build traffic-volume conditions. The anticipated 2023 Build weekday morning and weekday evening traffic volumes are graphically presented in Figures 7 and 8, respectively. These volumes were used as the basis for all analysis as well as to identify potential mitigation measures to ameliorate the project’s impacts.
A summary of 2023 peak-hour projected traffic-volume changes in the site vicinity are shown in Table 6. These volumes are based on the expected increases from the site traffic generation.
Route
Direction
Percent of Trips Massachusetts Avenue East 31 Massachusetts Avenue
West
65
Stow Road North 1 Stow Road
South
3
TOTAL 100
21 Q:\Projects\16 PROJECTS\2162135 - BOXBOROUGH TOWN CENTER-Residential\Traffic\Reports\TIAS 121216 F.docx
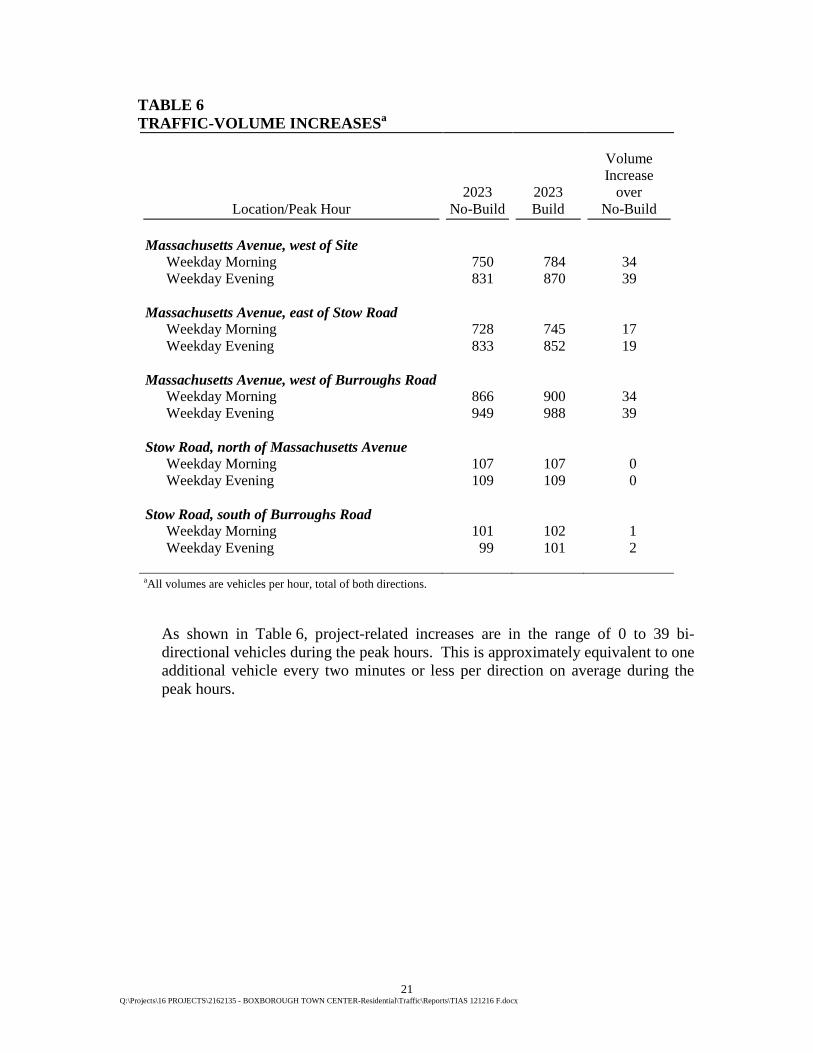
TABLE 6 TRAFFIC-VOLUME INCREASESa
Location/Peak Hour 2023
No-Build 2023 Build
Volume Increase
over No-Build
Massachusetts Avenue, west of Site Weekday Morning Weekday Evening
750 831
784 870
34 39
Massachusetts Avenue, east of Stow Road Weekday Morning Weekday Evening
728 833
745 852
17 19
Massachusetts Avenue, west of Burroughs Road Weekday Morning Weekday Evening
866 949
900 988
34 39
Stow Road, north of Massachusetts Avenue Weekday Morning Weekday Evening
107 109
107 109
0 0
Stow Road, south of Burroughs Road Weekday Morning Weekday Evening
101 99
102 101
1 2
aAll volumes are vehicles per hour, total of both directions.
As shown in Table 6, project-related increases are in the range of 0 to 39 bi-directional vehicles during the peak hours. This is approximately equivalent to one additional vehicle every two minutes or less per direction on average during the peak hours.
Site
G
en
era
te
d
Pe
ak H
ou
r T
ra
ffic V
olu
me
s
N
Not T
o S
cale
Fig
ure
6
Regency A
t B
oxborough
Boxborough, M
A
Note: im
balances exist due to drivew
ays not show
n
3(13)
M
a
s
s
a
c
h
u
s
e
tts
A
v
e
.1
1
1
1(1)
14(6)
0(1)
B
u
r
r
o
u
g
h
s
R
d
.
P
r
i
e
s
t
s
L
n
.
0(0)
2
8
(1
3
)
6(26)
0
(1
)
H
ill R
d
.
1(1
)
0(1)
1(1)
Sto
w R
d.
Mid
dle
Rd.
SIT
E
Legend:
XX
A
M T
RIP
S
(X
X) P
M T
RIP
S
6
(2
6
)
2
8
(1
3
)
1
5
(7
)
3
(1
4
)

20
23
B
uild
We
ekd
ay M
orn
in
g
Pe
ak H
ou
r T
ra
ffic V
olu
me
s
N
Not T
o S
cale
Fig
ure
7
Regency A
t B
oxborough
Boxborough, M
A
Note: im
balances exist due to drivew
ays not show
n
11
268
19
M
a
s
s
a
c
h
u
s
e
tts
A
v
e
.
1
1
1
29
389
15
49
B
u
r
r
o
u
g
h
s
R
d
.
P
r
i
e
s
t
s
L
n
.
5
4
13
24
18
8
34
0
4
5
5
5
0
25
4
56
20
322
12
57
398
15
83
1
9
01
4
0
4
6
8
40
H
ill R
d
.
1
5
3
5
4
1
14
8
01
1
1
0
1
0
82
0
1
46
0
Sto
w R
d.
Mid
dle
Rd.
SIT
E
6
4
1
8
2
8
1
5
3
3
3
2
20
23
B
uild
We
ekd
ay E
ve
nin
g
Pe
ak H
ou
r T
ra
ffic V
olu
me
s
N
Not T
o S
cale
Fig
ure
8
Regency A
t B
oxborough
Boxborough, M
A
Note: im
balances exist due to drivew
ays not show
n
12
394
38
M
a
s
s
a
c
h
u
s
e
tts
A
v
e
.1
1
1
29
370
16
32
B
u
r
r
o
u
g
h
s
R
d
.
P
r
i
e
s
t
s
L
n
.
0
4
14
13
11
5
25
1
5
7
6
1
5
23
4
34
15
376
64
77
401
38
73
5
10
0
7
1
3
5
8
29
H
ill R
d
.
1
1
2
0
7
25
13
45
00
0
0
0
1
1
48
1
4
44
0
Sto
w R
d.
Mid
dle
Rd.
SIT
E
2
6
4
0
8
1
3
7
14
4
2
3
25 Q:\Projects\16 PROJECTS\2162135 - BOXBOROUGH TOWN CENTER-Residential\Traffic\Reports\TIAS 121216 F.docx
SECTION 4: ANALYSIS
To assess intersection operations, capacity analyses were conducted for Existing, No-Build, and Build traffic-volume conditions. Capacity analyses provide an indication of how well the study area intersections serve existing and projected traffic volumes. Vehicle queue analyses provide a secondary measure of the operational characteristics of an intersection or section of roadway under study in terms of lane use and demand. METHODOLOGY Levels of Service Level of service (LOS) is a quantitative measure used to describe the operation of an intersection or roadway segment. The level of service definition is described by the quality of traffic flow and is primarily defined in terms of traffic delays. The primary result of capacity analyses4 is the assignment of a level of service to traffic intersections or roadway segments under various traffic-flow conditions. Six levels of service are defined for traffic intersections and roadway segments. Levels of service range from LOS A to LOS F. LOS A represents very good operating conditions and LOS F represents very poor operating conditions. Signalized Intersections Levels of service for signalized intersections are calculated using the methodology and procedures described in the 2010 Highway Capacity Manual. The methodology assesses the intersection based on type of signal operation, signal timing and phasing, progression, vehicle mix, and intersection geometrics. Level-of-service designations are based on the delay per vehicle. Table 7 summarizes the relationship between level of service and delay. The calculated delay values result in level-of-service designations which are
4The capacity analysis methodology is based on procedures presented in the Highway Capacity Manual; Transportation
Research Board; Washington, DC; 2010.
26 Q:\Projects\16 PROJECTS\2162135 - BOXBOROUGH TOWN CENTER-Residential\Traffic\Reports\TIAS 121216 F.docx
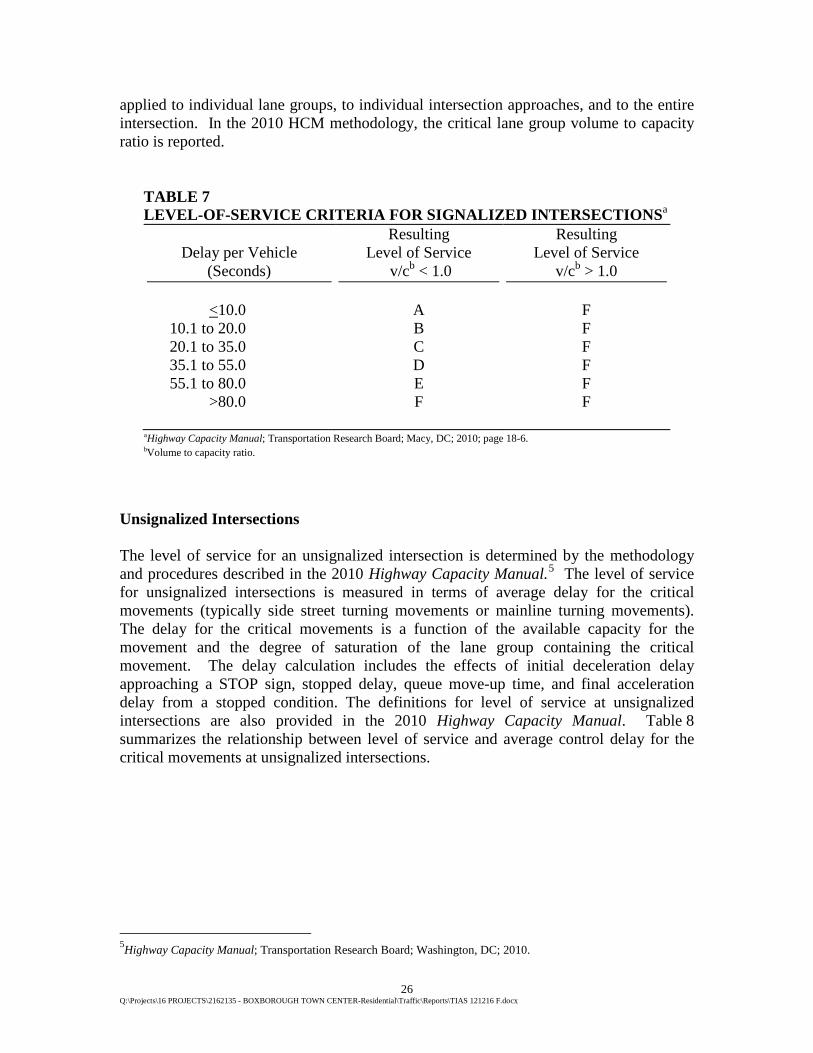
applied to individual lane groups, to individual intersection approaches, and to the entire intersection. In the 2010 HCM methodology, the critical lane group volume to capacity ratio is reported.
TABLE 7 LEVEL-OF-SERVICE CRITERIA FOR SIGNALIZED INTERSECTIONSa
Delay per Vehicle
(Seconds)
Resulting Level of Service
v/cb < 1.0
Resulting Level of Service
v/cb > 1.0
<10.0 10.1 to 20.0 20.1 to 35.0 35.1 to 55.0 55.1 to 80.0
>80.0
A B C D E F
F F F F F F
aHighway Capacity Manual; Transportation Research Board; Macy, DC; 2010; page 18-6. bVolume to capacity ratio.
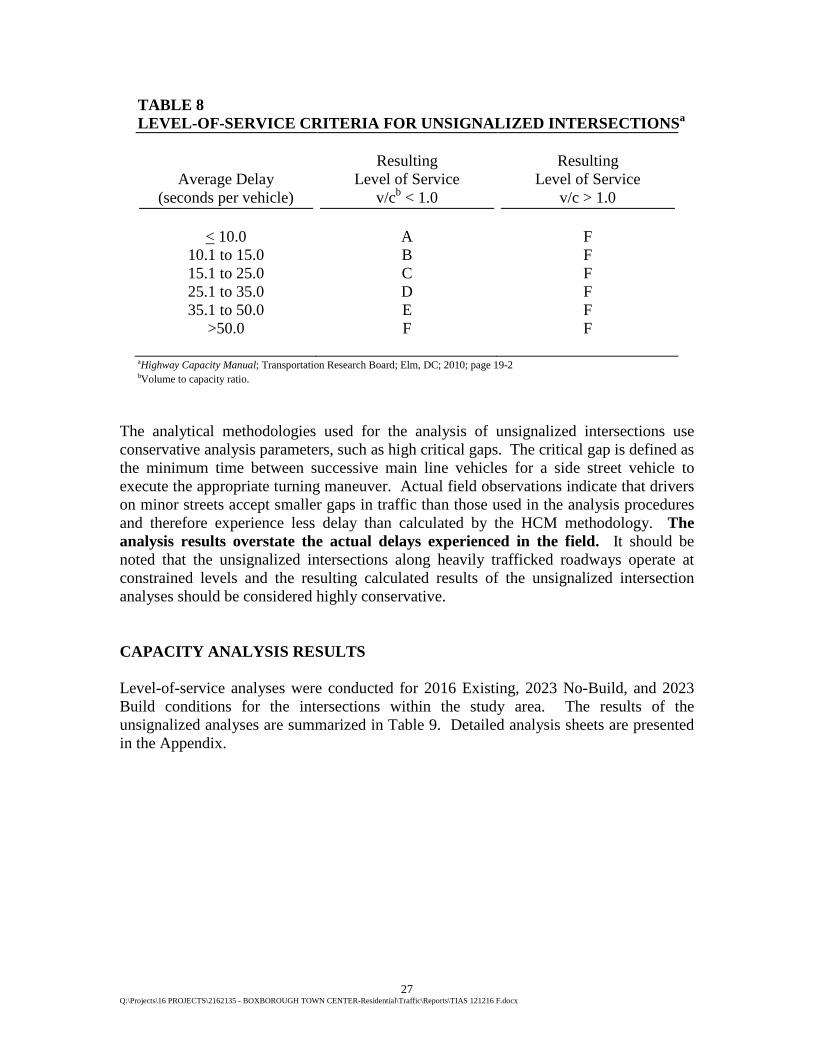
Unsignalized Intersections The level of service for an unsignalized intersection is determined by the methodology and procedures described in the 2010 Highway Capacity Manual.5 The level of service for unsignalized intersections is measured in terms of average delay for the critical movements (typically side street turning movements or mainline turning movements). The delay for the critical movements is a function of the available capacity for the movement and the degree of saturation of the lane group containing the critical movement. The delay calculation includes the effects of initial deceleration delay approaching a STOP sign, stopped delay, queue move-up time, and final acceleration delay from a stopped condition. The definitions for level of service at unsignalized intersections are also provided in the 2010 Highway Capacity Manual. Table 8 summarizes the relationship between level of service and average control delay for the critical movements at unsignalized intersections.
5Highway Capacity Manual; Transportation Research Board; Washington, DC; 2010.
27 Q:\Projects\16 PROJECTS\2162135 - BOXBOROUGH TOWN CENTER-Residential\Traffic\Reports\TIAS 121216 F.docx
TABLE 8 LEVEL-OF-SERVICE CRITERIA FOR UNSIGNALIZED INTERSECTIONSa
Average Delay
(seconds per vehicle)
Resulting
Level of Service v/cb < 1.0
Resulting Level of Service
v/c > 1.0
< 10.0 10.1 to 15.0 15.1 to 25.0 25.1 to 35.0 35.1 to 50.0
>50.0
A B C D E F
F F F F F F
aHighway Capacity Manual; Transportation Research Board; Elm, DC; 2010; page 19-2 bVolume to capacity ratio.
The analytical methodologies used for the analysis of unsignalized intersections use conservative analysis parameters, such as high critical gaps. The critical gap is defined as the minimum time between successive main line vehicles for a side street vehicle to execute the appropriate turning maneuver. Actual field observations indicate that drivers on minor streets accept smaller gaps in traffic than those used in the analysis procedures and therefore experience less delay than calculated by the HCM methodology. The analysis results overstate the actual delays experienced in the field. It should be noted that the unsignalized intersections along heavily trafficked roadways operate at constrained levels and the resulting calculated results of the unsignalized intersection analyses should be considered highly conservative. CAPACITY ANALYSIS RESULTS Level-of-service analyses were conducted for 2016 Existing, 2023 No-Build, and 2023 Build conditions for the intersections within the study area. The results of the unsignalized analyses are summarized in Table 9. Detailed analysis sheets are presented in the Appendix.
28 Q:\Projects\16 PROJECTS\2162135 - BOXBOROUGH TOWN CENTER-Residential\Traffic\Reports\TIAS 121216 F.docx
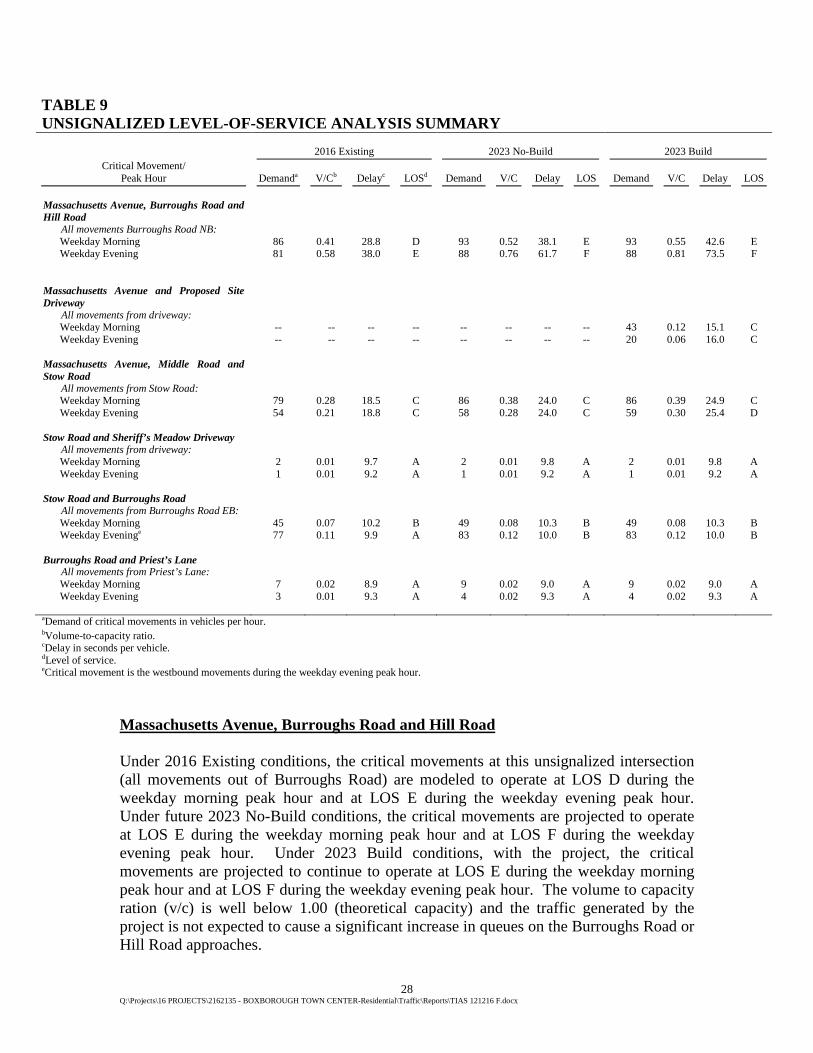
TABLE 9 UNSIGNALIZED LEVEL-OF-SERVICE ANALYSIS SUMMARY
2016 Existing
2023 No-Build
2023 Build Critical Movement/
Peak Hour
Demanda
V/Cb
Delayc
LOSd
Demand
V/C
Delay
LOS
Demand
V/C
Delay
LOS Massachusetts Avenue, Burroughs Road and Hill Road
All movements Burroughs Road NB: Weekday Morning Weekday Evening
86 81
0.41 0.58
28.8 38.0
D E
93 88
0.52 0.76
38.1 61.7
E F
93 88
0.55 0.81
42.6 73.5
E F
Massachusetts Avenue and Proposed Site Driveway
All movements from driveway: Weekday Morning Weekday Evening
-- --
-- --
-- --
-- --
-- --
-- --
-- --
-- --
43 20
0.12 0.06
15.1 16.0
C C
Massachusetts Avenue, Middle Road and Stow Road
All movements from Stow Road: Weekday Morning Weekday Evening
79 54
0.28 0.21
18.5 18.8
C C
86 58
0.38 0.28
24.0 24.0
C C
86 59
0.39 0.30
24.9 25.4
C D
Stow Road and Sheriff’s Meadow Driveway All movements from driveway:
Weekday Morning Weekday Evening
2 1
0.01 0.01
9.7 9.2
A A
2 1
0.01 0.01
9.8 9.2
A A
2 1
0.01 0.01
9.8 9.2
A A
Stow Road and Burroughs Road All movements from Burroughs Road EB:
Weekday Morning Weekday Eveninge
45 77
0.07 0.11
10.2 9.9
B A
49 83
0.08 0.12
10.3 10.0
B B
49 83
0.08 0.12
10.3 10.0
B B
Burroughs Road and Priest’s Lane All movements from Priest’s Lane:
Weekday Morning Weekday Evening
7 3
0.02 0.01
8.9 9.3
A A
9 4
0.02 0.02
9.0 9.3
A A
9 4
0.02 0.02
9.0 9.3
A A
aDemand of critical movements in vehicles per hour. bVolume-to-capacity ratio. cDelay in seconds per vehicle. dLevel of service. eCritical movement is the westbound movements during the weekday evening peak hour.
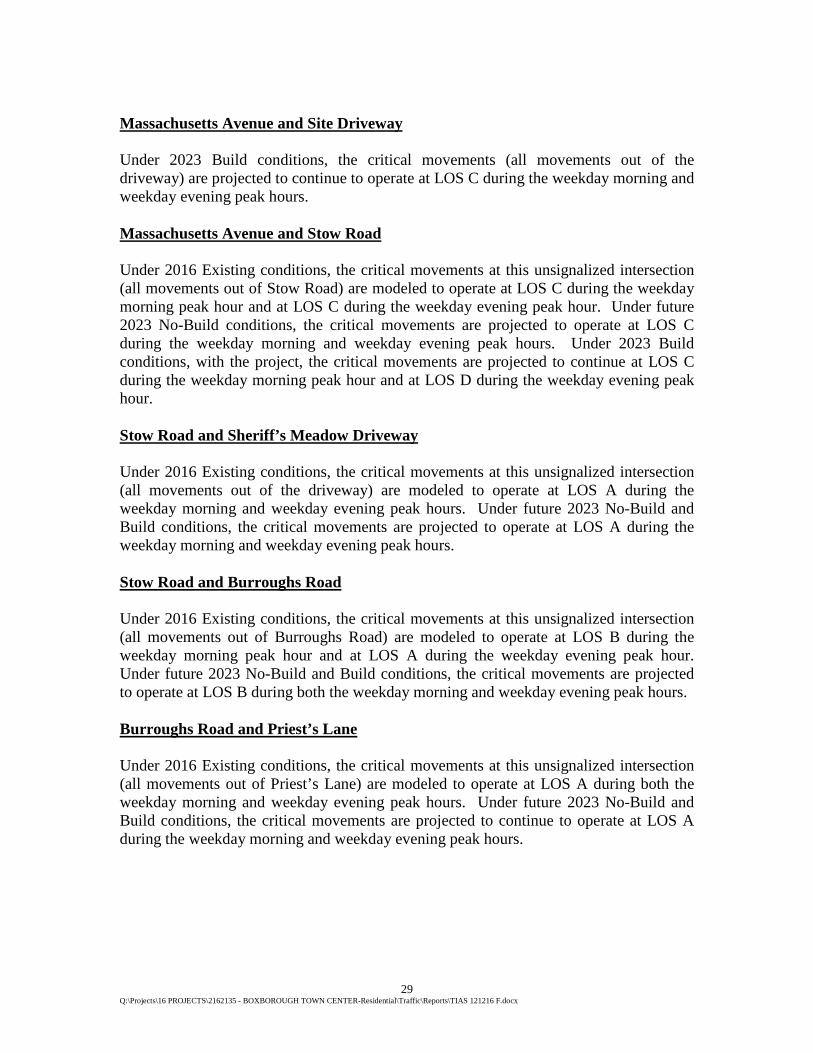
Massachusetts Avenue, Burroughs Road and Hill Road Under 2016 Existing conditions, the critical movements at this unsignalized intersection (all movements out of Burroughs Road) are modeled to operate at LOS D during the weekday morning peak hour and at LOS E during the weekday evening peak hour. Under future 2023 No-Build conditions, the critical movements are projected to operate at LOS E during the weekday morning peak hour and at LOS F during the weekday evening peak hour. Under 2023 Build conditions, with the project, the critical movements are projected to continue to operate at LOS E during the weekday morning peak hour and at LOS F during the weekday evening peak hour. The volume to capacity ration (v/c) is well below 1.00 (theoretical capacity) and the traffic generated by the project is not expected to cause a significant increase in queues on the Burroughs Road or Hill Road approaches.
29 Q:\Projects\16 PROJECTS\2162135 - BOXBOROUGH TOWN CENTER-Residential\Traffic\Reports\TIAS 121216 F.docx
Massachusetts Avenue and Site Driveway Under 2023 Build conditions, the critical movements (all movements out of the driveway) are projected to continue to operate at LOS C during the weekday morning and weekday evening peak hours. Massachusetts Avenue and Stow Road Under 2016 Existing conditions, the critical movements at this unsignalized intersection (all movements out of Stow Road) are modeled to operate at LOS C during the weekday morning peak hour and at LOS C during the weekday evening peak hour. Under future 2023 No-Build conditions, the critical movements are projected to operate at LOS C during the weekday morning and weekday evening peak hours. Under 2023 Build conditions, with the project, the critical movements are projected to continue at LOS C during the weekday morning peak hour and at LOS D during the weekday evening peak hour. Stow Road and Sheriff’s Meadow Driveway Under 2016 Existing conditions, the critical movements at this unsignalized intersection (all movements out of the driveway) are modeled to operate at LOS A during the weekday morning and weekday evening peak hours. Under future 2023 No-Build and Build conditions, the critical movements are projected to operate at LOS A during the weekday morning and weekday evening peak hours. Stow Road and Burroughs Road Under 2016 Existing conditions, the critical movements at this unsignalized intersection (all movements out of Burroughs Road) are modeled to operate at LOS B during the weekday morning peak hour and at LOS A during the weekday evening peak hour. Under future 2023 No-Build and Build conditions, the critical movements are projected to operate at LOS B during both the weekday morning and weekday evening peak hours. Burroughs Road and Priest’s Lane Under 2016 Existing conditions, the critical movements at this unsignalized intersection (all movements out of Priest’s Lane) are modeled to operate at LOS A during both the weekday morning and weekday evening peak hours. Under future 2023 No-Build and Build conditions, the critical movements are projected to continue to operate at LOS A during the weekday morning and weekday evening peak hours.
30 Q:\Projects\16 PROJECTS\2162135 - BOXBOROUGH TOWN CENTER-Residential\Traffic\Reports\TIAS 121216 F.docx
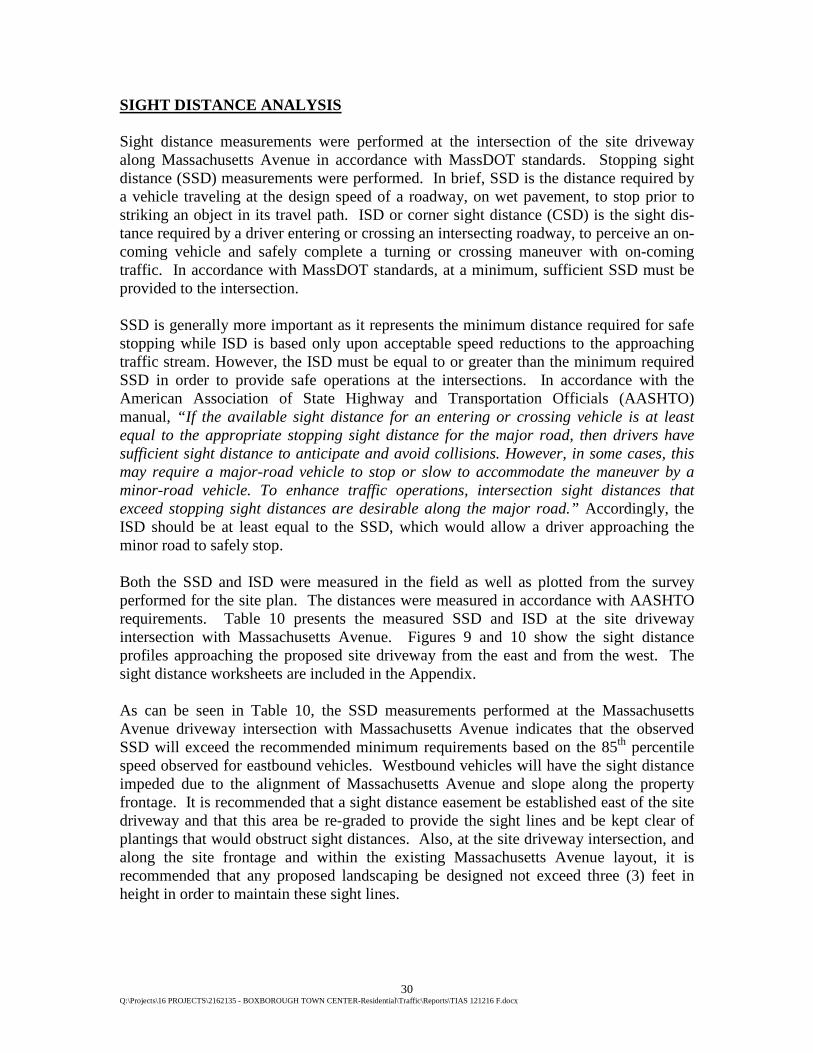
SIGHT DISTANCE ANALYSIS Sight distance measurements were performed at the intersection of the site driveway along Massachusetts Avenue in accordance with MassDOT standards. Stopping sight distance (SSD) measurements were performed. In brief, SSD is the distance required by a vehicle traveling at the design speed of a roadway, on wet pavement, to stop prior to striking an object in its travel path. ISD or corner sight distance (CSD) is the sight dis-tance required by a driver entering or crossing an intersecting roadway, to perceive an on-coming vehicle and safely complete a turning or crossing maneuver with on-coming traffic. In accordance with MassDOT standards, at a minimum, sufficient SSD must be provided to the intersection. SSD is generally more important as it represents the minimum distance required for safe stopping while ISD is based only upon acceptable speed reductions to the approaching traffic stream. However, the ISD must be equal to or greater than the minimum required SSD in order to provide safe operations at the intersections. In accordance with the American Association of State Highway and Transportation Officials (AASHTO) manual, “If the available sight distance for an entering or crossing vehicle is at least equal to the appropriate stopping sight distance for the major road, then drivers have sufficient sight distance to anticipate and avoid collisions. However, in some cases, this may require a major-road vehicle to stop or slow to accommodate the maneuver by a minor-road vehicle. To enhance traffic operations, intersection sight distances that exceed stopping sight distances are desirable along the major road.” Accordingly, the ISD should be at least equal to the SSD, which would allow a driver approaching the minor road to safely stop. Both the SSD and ISD were measured in the field as well as plotted from the survey performed for the site plan. The distances were measured in accordance with AASHTO requirements. Table 10 presents the measured SSD and ISD at the site driveway intersection with Massachusetts Avenue. Figures 9 and 10 show the sight distance profiles approaching the proposed site driveway from the east and from the west. The sight distance worksheets are included in the Appendix. As can be seen in Table 10, the SSD measurements performed at the Massachusetts Avenue driveway intersection with Massachusetts Avenue indicates that the observed SSD will exceed the recommended minimum requirements based on the 85th percentile speed observed for eastbound vehicles. Westbound vehicles will have the sight distance impeded due to the alignment of Massachusetts Avenue and slope along the property frontage. It is recommended that a sight distance easement be established east of the site driveway and that this area be re-graded to provide the sight lines and be kept clear of plantings that would obstruct sight distances. Also, at the site driveway intersection, and along the site frontage and within the existing Massachusetts Avenue layout, it is recommended that any proposed landscaping be designed not exceed three (3) feet in height in order to maintain these sight lines.
31 Q:\Projects\16 PROJECTS\2162135 - BOXBOROUGH TOWN CENTER-Residential\Traffic\Reports\TIAS 121216 F.docx
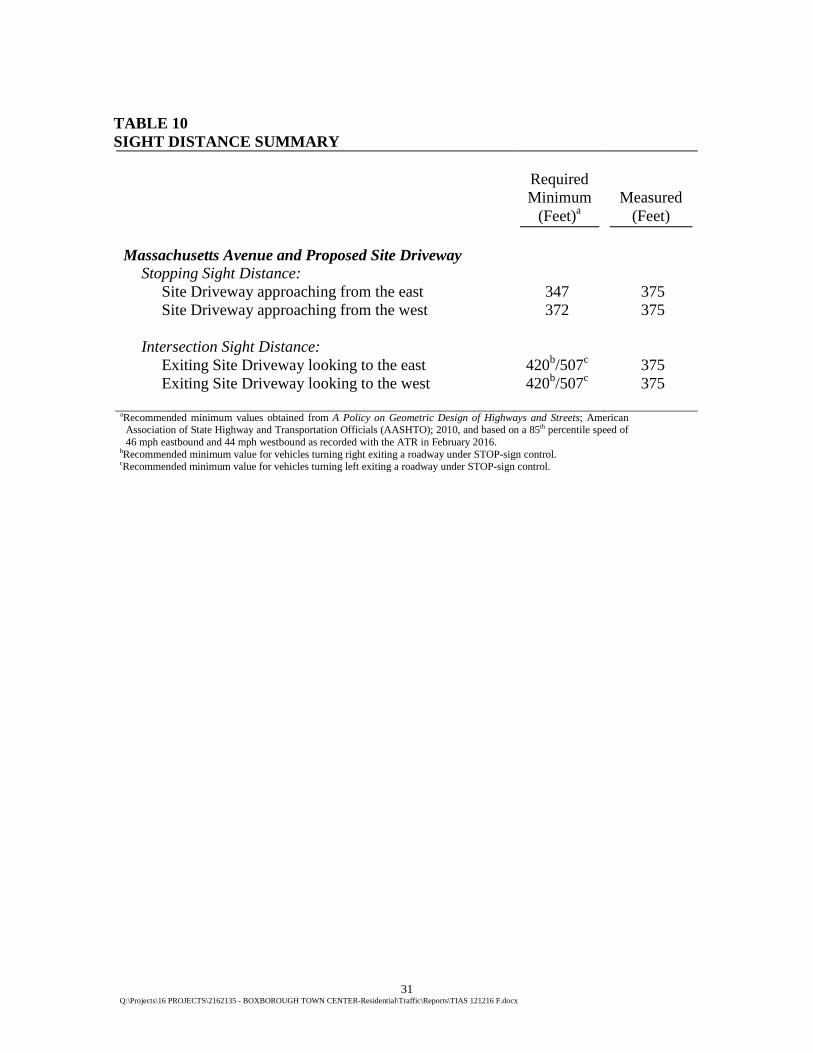
TABLE 10 SIGHT DISTANCE SUMMARY
Required Minimum
(Feet)a Measured
(Feet) Massachusetts Avenue and Proposed Site Driveway Stopping Sight Distance: Site Driveway approaching from the east Site Driveway approaching from the west
347 372
375 375
Intersection Sight Distance: Exiting Site Driveway looking to the east Exiting Site Driveway looking to the west
420b/507c 420b/507c
375 375
aRecommended minimum values obtained from A Policy on Geometric Design of Highways and Streets; American
Association of State Highway and Transportation Officials (AASHTO); 2010, and based on a 85th percentile speed of 46 mph eastbound and 44 mph westbound as recorded with the ATR in February 2016.
bRecommended minimum value for vehicles turning right exiting a roadway under STOP-sign control. cRecommended minimum value for vehicles turning left exiting a roadway under STOP-sign control.
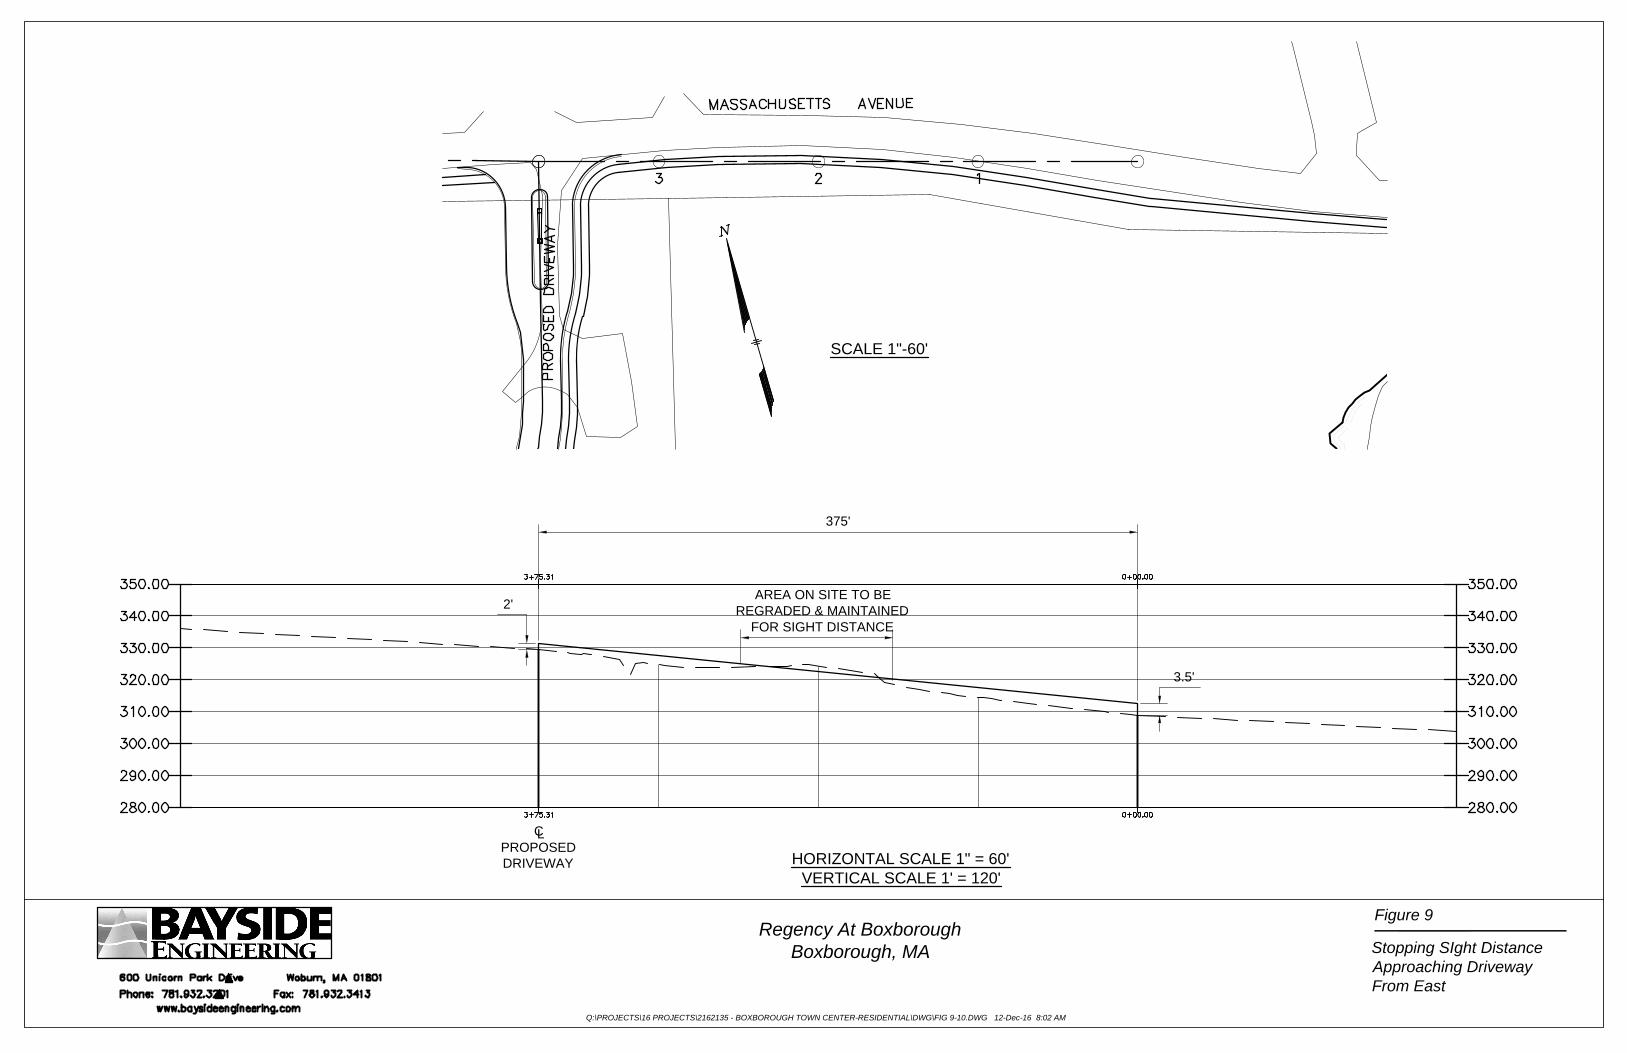
375'
3.5'
2'
C
PROPOSED
DRIVEWAY
L
AREA ON SITE TO BE
REGRADED & MAINTAINED
FOR SIGHT DISTANCE
Figure 9
Q:\PROJECTS\16 PROJECTS\2162135 - BOXBOROUGH TOWN CENTER-RESIDENTIAL\DWG\FIG 9-10.DWG 12-Dec-16 8:02 AM
Stopping SIght Distance
Approaching Driveway
From East
Regency At Boxborough
Boxborough, MA
HORIZONTAL SCALE 1" = 60'
VERTICAL SCALE 1' = 120'
SCALE 1"-60'
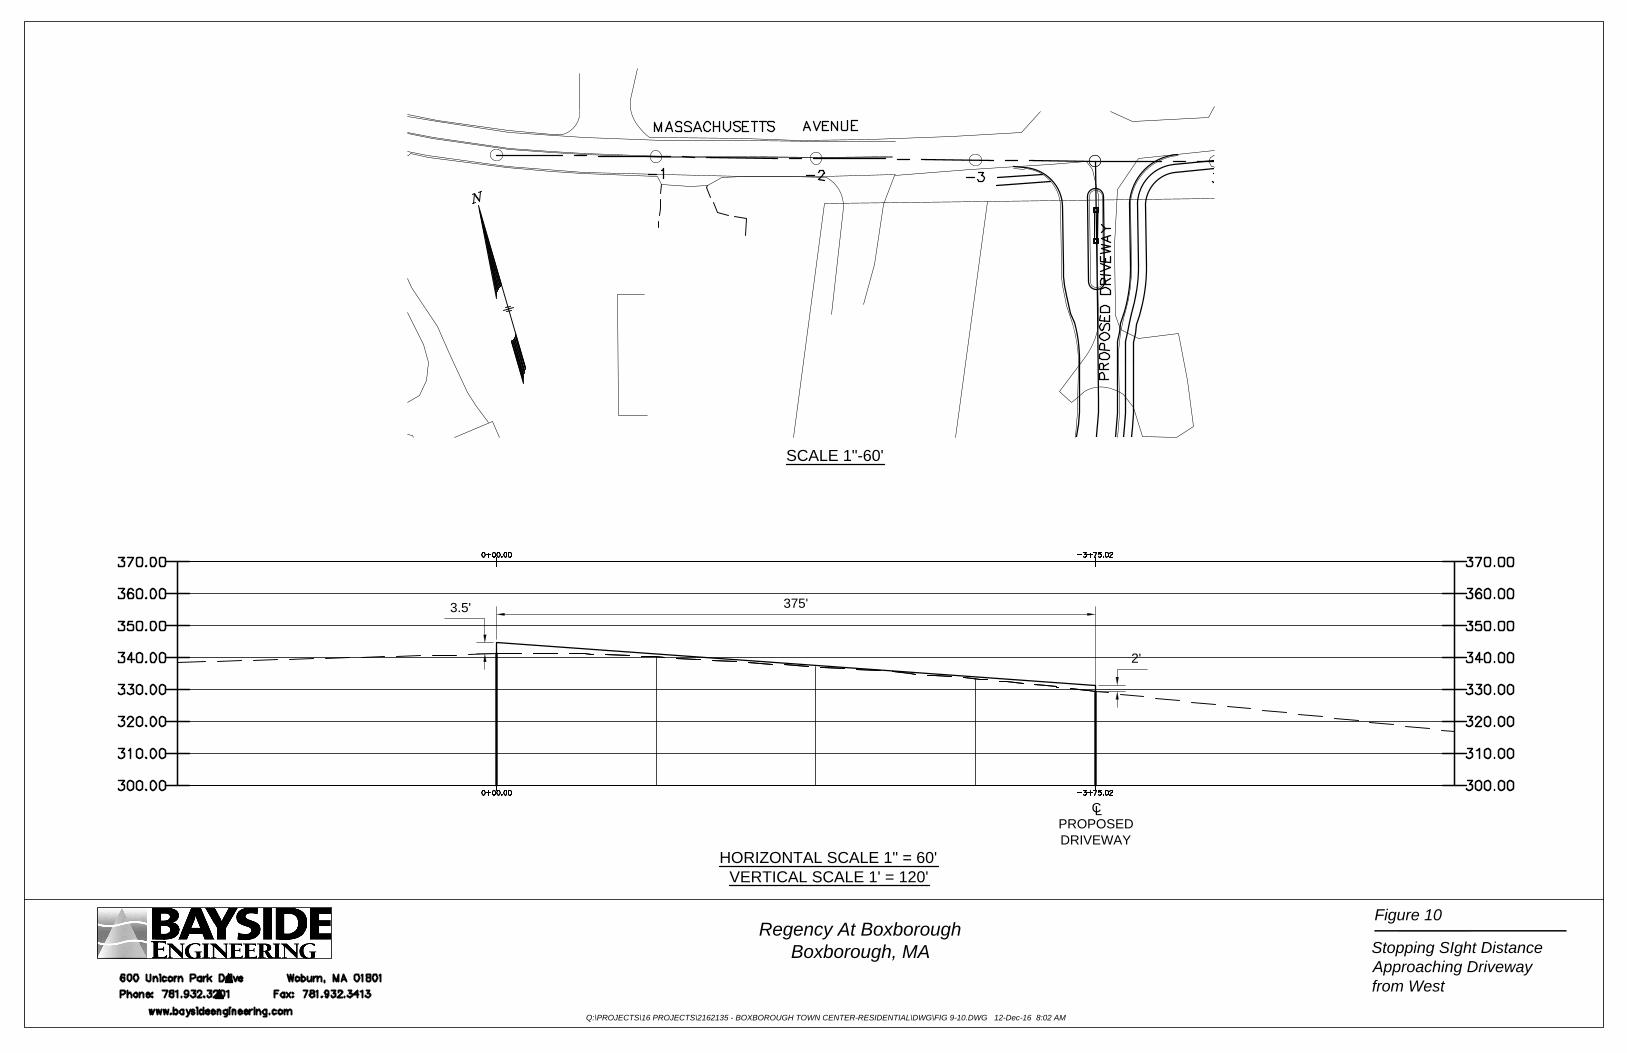
375'
C
PROPOSED
DRIVEWAY
L
3.5'
2'
Figure 10
Q:\PROJECTS\16 PROJECTS\2162135 - BOXBOROUGH TOWN CENTER-RESIDENTIAL\DWG\FIG 9-10.DWG 12-Dec-16 8:02 AM
Stopping SIght Distance
Approaching Driveway
from West
Regency At Boxborough
Boxborough, MA
SCALE 1"-60'
HORIZONTAL SCALE 1" = 60'
VERTICAL SCALE 1' = 120'

34 Q:\Projects\16 PROJECTS\2162135 - BOXBOROUGH TOWN CENTER-Residential\Traffic\Reports\TIAS 121216 F.docx
SECTION 5: RECOMMENDATIONS AND CONCLUSION
RECOMMENDATIONS The final phase of the analysis process is to identify the mitigation measures necessary to minimize the impact of the project on the transportation system. The proponent has made a commitment to implement the mitigation measures listed below. The capacity analyses performed for the unsignalized study area intersections indicate that generally, the new project trips will not significantly impact intersection operations. There is no significant reduction in levels of service at the study area intersections. The analysis shows the site driveway is projected to operate at a good level of service. As a result of the additional traffic generation being relatively low, it is expected that the project will not have a significant impact on intersection operations in the study area. The Massachusetts Avenue main site driveway should permit entering movements from both directions on Massachusetts Avenue. Exiting movements should be in a single lane under STOP-sign control. It is recommended that a sight distance easement be established east of the site driveway and that this area be re-graded to provide the sight lines and be kept clear of plantings that would obstruct sight distances. Also, at the site driveway intersection, and along the site frontage and within the existing Massachusetts Avenue layout, it is recommended that any proposed landscaping be designed not exceed three (3) feet in height in order to maintain these sight lines. CONCLUSION Review of the proposed project and the access plan shows that in relation to roadway capacity, traffic safety, and traffic impacts upon the surrounding roadway network, the proposed project will have a minimal impact on existing traffic conditions. With the proposed access, and maintaining sight distances from the driveways (clear sight lines

35 Q:\Projects\16 PROJECTS\2162135 - BOXBOROUGH TOWN CENTER-Residential\Traffic\Reports\TIAS 121216 F.docx
along frontage), safe and efficient access can be provided to the patrons of the proposed project and to the motoring public in the area.