regenexx orthopedic stem cell protocol ... & wrist arthritis demographics patient what’s...
TRANSCRIPT
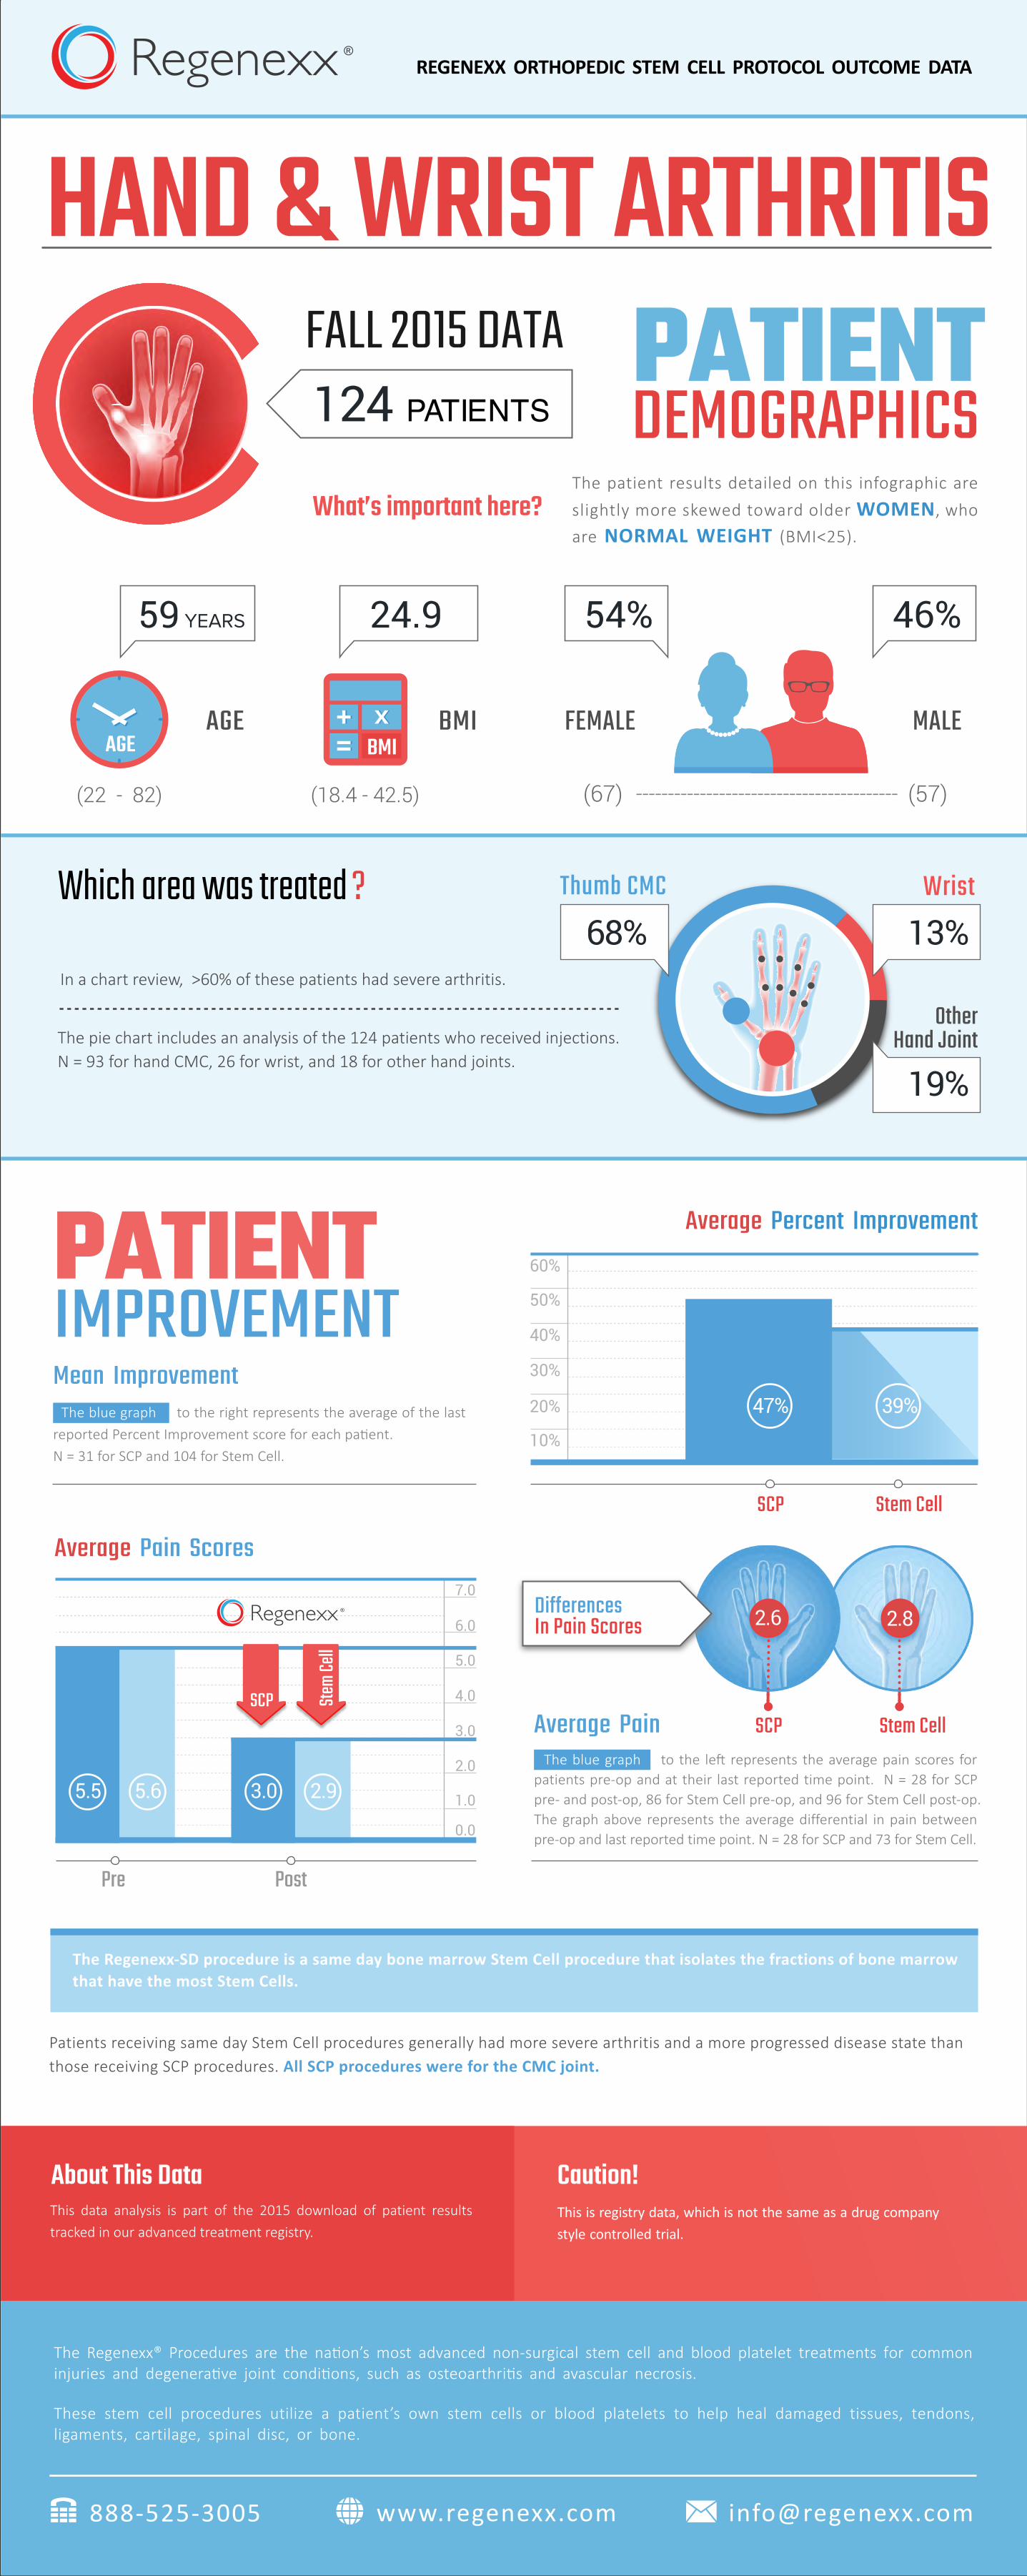
HAND & WRIST ARTHRITIS
DEMOGRAPHICSPATIENT
What’s important here?
59
AGE
(22 - 82)
AGE
24.9
BMI
(18.4 - 42.5)
BMIFEMALE MALE
(67) (57)
46%54%
REGENEXX ORTHOPEDIC STEM CELL PROTOCOL OUTCOME DATA
FALL 2015 DATA124 PATIENTS
The patient results detailed on this infographic are slightly more skewed toward older WOMEN, who are NORMAL WEIGHT (BMI<25).
PATIENTIMPROVEMENT
888-525-3005 www.regenexx.com [email protected]
The Regenexx® Procedures are the nation’s most advanced non-surgical stem cell and blood platelet treatments for common injuries and degenerative joint conditions, such as osteoarthritis and avascular necrosis.
These stem cell procedures utilize a patient’s own stem cells or blood platelets to help heal damaged tissues, tendons, ligaments, cartilage, spinal disc, or bone.
Caution! This is registry data, which is not the same as a drug company style controlled trial.
This data analysis is part of the 2015 download of patient results tracked in our advanced treatment registry.
About This Data
Average Pain Scores
PostPre
SDSCP1.0
0.0
2.0
3.0
4.0
5.0
6.0
7.0
5.5 5.6 3.0 2.9
Stem
Cell
SCP
The Regenexx-SD procedure is a same day bone marrow Stem Cell procedure that isolates the fractions of bone marrow that have the most Stem Cells.
Patients receiving same day Stem Cell procedures generally had more severe arthritis and a more progressed disease state than those receiving SCP procedures. All SCP procedures were for the CMC joint.
Average Pain The blue graph to the left represents the average pain scores for patients pre-op and at their last reported time point. N = 28 for SCP pre- and post-op, 86 for Stem Cell pre-op, and 96 for Stem Cell post-op. The graph above represents the average differential in pain between pre-op and last reported time point. N = 28 for SCP and 73 for Stem Cell.
Mean Improvement The blue graph to the right represents the average of the last reported Percent Improvement score for each patient. N = 31 for SCP and 104 for Stem Cell.
The pie chart includes an analysis of the 124 patients who received injections. N = 93 for hand CMC, 26 for wrist, and 18 for other hand joints.
Which area was treated ? Thumb CMC
OtherHand Joint
19%
Wrist
68% 13%In a chart review, >60% of these patients had severe arthritis.
Average Percent Improvement
Stem CellSCP
PATIE
NT IM
PROV
EMEN
T
10%
20%
30%
40%
50%
60%
39%47%
Stem CellSCP
2.6Differences In Pain Scores 2.8