regional analysis methods benchmarking, location quotients, shift-share
Post on 21-Dec-2015
239 views
TRANSCRIPT

Regional Analysis Methods
Benchmarking, Location Quotients, Shift-share

Agenda
• Review
• Shift-Share– What is it?– How do you do it?– What does it mean?
• Tools for interpreting
– Cautions and limits
• Multipliers
• Policy Map?

First Assignment – Q1
• What was the population of Allegheny County in 2000 and 2004 (Census or BEA)? – 2000: 1,279,817 (BEA - REIS or Census July
1est.)– or 2000: 1,281,666 (Census 2000 (SF1) -
April 1 estimate)– 2004: 1,247,512 (BEA-REIS)

First Assignment Q2-4
• How many total jobs were available in Allegheny County in 2004?– 861,868 (BEA total employment)
• How many Allegheny County residents were employed in 2004?– 604,203 (BLS, CPS/LAUS)
• What was the total "covered" employment in 2004?– 685,878 (BLS, QCEW)

Second Assignment - I
• When you are benchmarking one region against another, there are many factors to consider in the selection of an appropriate benchmark. Name two (2):
• If you are studying a region with dynamic annual changes, what is the best method to calculate the growth rates?
• You should never use a location quotient for what purpose?

Second Assignment Part 2
• There a several considerations for interpreting a location quotient. Name two (2):
• What is the difference between a firm and an establishment?

How do we interpret Pgh’s Growth?
Pittsburgh, 1969-2000
-
200,000
400,000
600,000
800,000
1,000,000
1,200,000
1,400,000
1,600,000
19
69
19
70
19
71
19
72
19
73
19
74
19
75
19
76
19
77
19
78
19
79
19
80
19
81
19
82
19
83
19
84
19
85
19
86
19
87
19
88
19
89
19
90
19
91
19
92
19
93
19
94
19
95
19
96
19
97
19
98
19
99
20
00
State and local
Military
Federal, civilian
Services
Finance, insurance, and real estate
Retail trade
Wholesale trade
Transportation and public utilities
Manufacturing
Construction
Mining
Agricultural services

Pittsburgh, 1969-2000
-
100,000
200,000
300,000
400,000
500,000
600,000
1969
1970
1971
1972
1973
1974
1975
1976
1977
1978
1979
1980
1981
1982
1983
1984
1985
1986
1987
1988
1989
1990
1991
1992
1993
1994
1995
1996
1997
1998
1999
2000
Manufacturing
Services
We can look at a basic view

Or a little more complexityPittsburgh, 1969-2000
-
100,000
200,000
300,000
400,000
500,000
600,000
700,000
800,000
900,000
1,000,000
1969
1970
1971
1972
1973
1974
1975
1976
1977
1978
1979
1980
1981
1982
1983
1984
1985
1986
1987
1988
1989
1990
1991
1992
1993
1994
1995
1996
1997
1998
1999
2000
Resource based
FederalGovernmentLocal Serving
Mfg & Trade
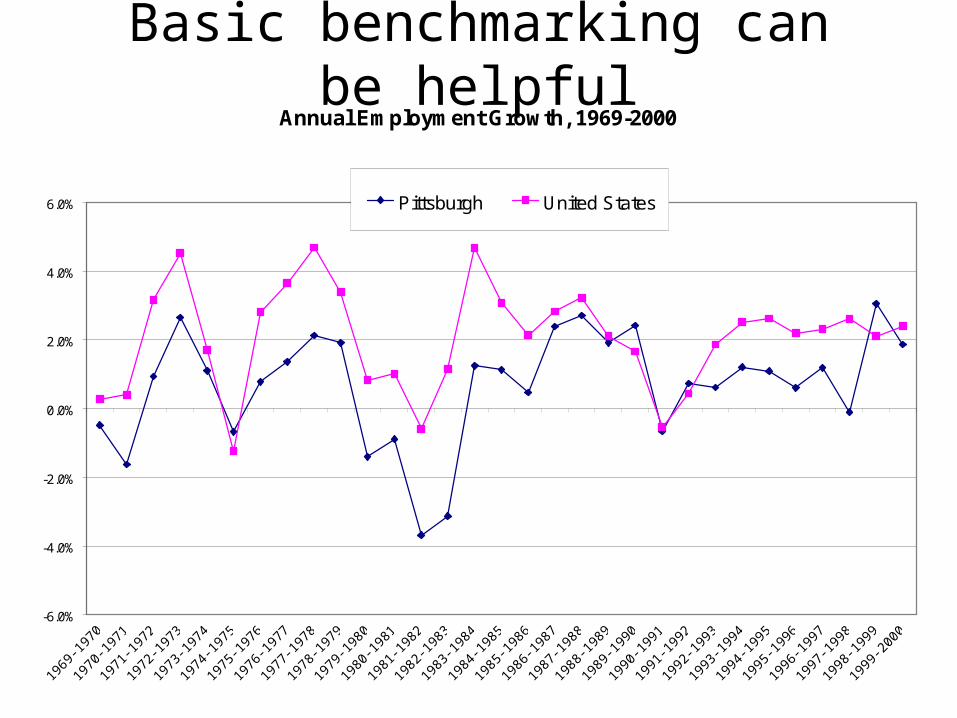
Basic benchmarking can be helpfulAnnual Employment Growth, 1969-2000
-6.0%
-4.0%
-2.0%
0.0%
2.0%
4.0%
6.0%
1969
-197
0
1970
-197
1
1971
-197
2
1972
-197
3
1973
-197
4
1974
-197
5
1975
-197
6
1976
-197
7
1977
-197
8
1978
-197
9
1979
-198
0
1980
-198
1
1981
-198
2
1982
-198
3
1983
-198
4
1984
-198
5
1985
-198
6
1986
-198
7
1987
-198
8
1988
-198
9
1989
-199
0
1990
-199
1
1991
-199
2
1992
-199
3
1993
-199
4
1994
-199
5
1995
-199
6
1996
-199
7
1997
-199
8
1998
-199
9
1999
-200
0
Pittsburgh United States

Basic benchmarking can be helpfulEmployment Change, 1970-1993
0
100,000
200,000
300,000
400,000
500,000
600,000
700,000
800,000
San Diego Boise Tucson Fresno Memphis New Orleans Toledo Pittsburgh

But these descriptions still haven’t explained much

Location Quotients
Loc
atio
n Q
uot
ien
t
Employment Growth
Important industries that may require attention
High
High
Low
Low
Important growth industries
Industries of little promise to local economy
Potential emerging industries
Total
Total
Industry
Industry
Region
Natio
n
Formula Interpretation

Shift-Share
• What are the 3 components of a shift-share analysis?
• A competitive industry is defined as WHAT?
• Explain– National share– Industry Mix– Regional Shift
• What are the limits of shift-share?

Albuquerque, 1970-1990
Albuquerque 1970 1990 Absolute
Region Total 150,901 342,529 191,628
Target Region Year 1 Year 2 Ri
AGSVC 552 2,268 1,716CON 9,028 18,634 9,606FARM 1,165 1,729 564FED 11,193 14,599 3,406FIRE 12,471 26,569 14,098MFG 10,453 26,240 15,787MIL 7,600 8,134 534MIN 1,388 1,313 -75RETAIL 25,424 59,987 34,563STLGOV 19,322 44,475 25,153SVC 36,971 107,068 70,097TRAN 8,253 14,904 6,651WHSALE 7,081 16,609 9,528
• 127 % total employment growth
• +190,000 Jobs
• What explains this growth?

Three factors…
• Growth of the national economy
• Presence of growth industries (or declining ones)
• Local competitive factors
Albuquerque 1970 1990 Absolute PercentRegion Total 150,901 342,529 191,628 127%
Projected at National Ave.
Projected Mix
Regional Shares
83,770 107,858 14,595 93,263
ChangeEmployment
Diff btw US & actual ch.

Brief Glossary
• R = actual regional change
• N = change due to national growth
• M = Industry mix effect
• S = regional shift effect

Growth of the U.S. Economy
• If Alb had grown at the U.S. rate, it would have added 83,770 jobs.
• The growth of the U.S. economy accounted for 83,770, or 44% of the actual change.
• Alb in fact added more than 191,000 jobs – so something else must explain the region’s growth

The mix of industries in the region
• The presence of growth industries were not a major factor in the region’s performance. Growth industries on the whole accounted for 8% of the actual change, which equaled 14,595 jobs.
• Must add jobs faster than the nation as a whole to have a positive Mix effect

Local competitive factors
• The shift-share analysis estimates that 49% of the growth in employment is the result of local competitive conditions.
• 93, 263 of the jobs created in Albuquerque were due to these local advantages
• These advantages were spread across every industry but one – Mining.

Albuquerque Industry Data
Target Region Year 2 Ri Ri pct Mi Si
AGSVC 2,268 1,716 311% 668 742CON 18,634 9,606 106% 504 4,090FARM 1,729 564 48% -748 665FED 14,599 3,406 30% -5,037 2,229FIRE 26,569 14,098 113% 2,548 4,627MFG 26,240 15,787 151% -6,287 16,271MIL 8,134 534 7% -5,503 1,818MIN 1,313 -75 -5% 135 -981RETAIL 59,987 34,563 136% 2,266 18,183STLGOV 44,475 25,153 130% -1,527 15,953SVC 107,068 70,097 190% 29,770 19,803TRAN 14,904 6,651 81% -1,884 3,954WHSALE 16,609 9,528 135% -312 5,909

What are the key industries?
We can combine statistics on economic growth, the shift-share, and
specialization (LQs) to highlight leading and lagging industries.

Finding Key Industries
Identify the non-competitive
factors
Fix them if possible
Sustain
Innovate
Develop the value chain - Buyers & Supplier
Prepare for transition
Manage decline
Do nothing
Watch the market
Minimize investment
Not Competitive Competitive
Lag
gin
gL
ead
ing

State and Local Gov
• It is a large industry in the region with considerable growth.
• It is not a growth industry nationally – but this industry does not move on strictly national dynamics.
• It is a desirable goal to growth this industry?

Manufacturing
• Still somewhat small – only 7% of regional employment, less then 27,000 employees.
• Potential emerging sector in the region, but the sector is declining nationally– Can Alb capture more of this industry and for
how long?– Are there subsectors in which the region has a
concentration and an advantage that are growing?

Services
• Employment in Services accounts for 25% of the region’s employment (comparable to the US share).
• The industry grew by 70,000 jobs in the region (190%), well above national and industry growth
• Local factors were positive, but contributed less to the growth than national and industry factors.

Shift-share + benchmarkingShift-Share Comparison, 1970-1993
-600,000
-400,000
-200,000
0
200,000
400,000
600,000
San Diego Boise Tucson Fresno Memphis NewOrleans
Toledo Pittsburgh
Regional Shift
Industry Mix

You may need to normalize the dataRegional Shift as a Proportion of Total Change
(3.50)
(3.00)
(2.50)
(2.00)
(1.50)
(1.00)
(0.50)
-
0.50
1.00
San Diego Boise Tucson Fresno Memphis New Orleans Toledo Pittsburgh

The level of industry detail impacts the shift-share analysis
2digit 4 digitAbsolute Change -10132 -10132National Effect -9450 -9450Industry Mix 690.71 -2759Local Shift -1373 2075.2
• More detail increases the accuracy of the industry mix effect and the local shift.

The time frame impacts the shift-share
1969 2000 R N M S1969-2000 1,128,141 1,384,664 256,523 991,947 -4,278 -731,146
1969 1988 R N M S1969-1988 1,128,141 1,205,775 77,634 571,936 -6,419 -487,883
1988 2000 R N M S1989-2000 1,205,775 1,384,664 178,889 297,892 29,909 -148,912
Aggregated 256,523 869,827 23,491 -636,795
• If the industry structure changes dramatically then a longer time frame distorts the industry mix effect.

Strategies for missing data
• Ignore it• Find an alternative source• Estimate missing midpoint data with an average or
linear projection• Use the proportion of the industry from a higher
level of geography • Project the missing data based on regional growth• Project the missing data based on national industry
growth

Comparing the 3 "Solutions" to missing data
R N M SComplete Data 106,225 67,610 5,990 32,625Incomplete Data 71,221 67,610 5,990 -2,379Partial Data 99,926 61,972 11,259 26,695
For Construction R N M SComplete Data 10,973 3,694 1,963 5,316Incomplete Data 10,973 3,694 1,963 5,316Partial Data 10,973 3,694 1,963 5,316
1 – estimate nondisclosed data
2 – ignore nondisclosed data or assume = 0
3 – exclude missing sectors entirely

Multipliers
• What is a multiplier?– Based on industry input-output
• How do you use them correctly– Change in final demand
– Substitution
– Total vs. direct vs. indirect jobs
• Sources– RIMS II
– IMPLAN
– REMI