regional climate february 2011 1 william. m. lapenta acting director environmental modeling center...
TRANSCRIPT

1Regional Climate February 2011
William. M. LapentaActing Director
Environmental Modeling Center
NOAA/NWS/NCEP
With contributions from many EMC Staff……
NCEP
Overview of the NCEP Environmental Modeling Center
with an Emphasis on Climate

2Regional Climate February 2011
The EMC Mission…..
Develop and Enhance numerical guidance– Improve NCEP’s numerical forecast model
systems via:• Scientific upgrades• Optimization• Additional observations
Transition operational numerical forecast models from research to operations
– Transform & integrate • Code• Algorithms• Techniques
– Manages and executes transition process including technical and system performance review before implementation
Maintain operational model suite– The scientific correctness and integrity of
operational forecast modeling systems– Modify current operational system to adapt to
ever-present external changes
EMC location within the funnel
In response to operational requirements:
45%
25%
30%

3Regional Climate February 2011
Forecast Forecast UncertaintyUncertaintyForecast Forecast UncertaintyUncertainty
MinutesMinutes
HoursHours
DaysDays
1 Week1 Week
2 Week2 Week
MonthsMonths
SeasonsSeasons
YearsYears
NWS Seamless Suite of ForecastProducts Spanning Weather and Climate
Fo
reca
st
Lea
d T
ime
Fo
reca
st
Lea
d T
ime
Warnings & Alert Warnings & Alert CoordinationCoordination
WatchesWatches
ForecastsForecasts
Threats Assessments
GuidanceGuidance
OutlookOutlook
Benefits
NCEP Model Perspective
Mar
itim
e
Mar
itim
e
Life
& P
rope
rty
Life
& P
rope
rty
Spa
ce O
pera
tions
Spa
ce O
pera
tions
Rec
reat
ion
Rec
reat
ion
Eco
syst
em
Eco
syst
em
Env
iron
men
t
Env
iron
men
t
Em
erge
ncy
Mgm
t
Em
erge
ncy
Mgm
t
Agr
icul
ture
Agr
icul
ture
Res
ervo
ir C
ontr
ol
Res
ervo
ir C
ontr
ol
Ene
rgy
Pla
nnin
g
Ene
rgy
Pla
nnin
g
Com
mer
ce
Com
mer
ce
Hyd
ropo
wer
Hyd
ropo
wer
Fire
Wea
ther
Fire
Wea
ther
Hea
lthH
ealth
Avi
atio
n
Avi
atio
n
•North American Ensemble Forecast System
•Climate Forecast System
•Short-Range Ensemble Forecast
•Global Forecast System
•North American Mesoscale
•Rapid Update Cycle for Aviation
•Dispersion Models for DHS
•Global Ensemble Forecast System
Hurricane WRF & GFDLWaves
Real Time Ocean Forecast System
Space Weather
Tsunami

4Regional Climate February 2011
0
10
20
30
40
50
60
70
80
90
100
110
120
130
140
0:0
0:0
0
0:4
5:0
0
1:3
0:0
0
2:1
5:0
0
3:0
0:0
0
3:4
5:0
0
4:3
0:0
0
5:1
5:0
0
6:0
0:0
0
6:4
5:0
0
7:3
0:0
0
8:1
5:0
0
9:0
0:0
0
9:4
5:0
0
10
:30
:00
11
:15
:00
12
:00
:00
12
:45
:00
13
:30
:00
14
:15
:00
15
:00
:00
15
:45
:00
16
:30
:00
17
:15
:00
18
:00
:00
18
:45
:00
19
:30
:00
20
:15
:00
21
:00
:00
21
:45
:00
22
:30
:00
23
:15
:00
Node use for 20091202
Time of the day (utc)
Nu
mb
er
of N
ode
s
STRATUS HWM
0
10
20
30
40
50
60
70
80
90
100
110
120
130
140
0:00:00 0:45:00 1:30:00 2:15:00 3:00:00 3:45:00 4:30:00 5:15:00 6:00:00 6:45:00 7:30:00 8:15:00 9:00:00 9:45:0010:30:00 11:15:00 12:00:00 12:45:00 13:30:00 14:15:00 15:00:00 15:45:00 16:30:00 17:15:00 18:00:00 18:45:00 19:30:00 20:15:00 21:00:00 21:45:00 22:30:00 23:15:00
dev
ofs_atl
test
para
multi
misc
cdc
dgex
aqm
cdas
hiresw
sref
godas
cfs
mrf
firewx
merge
ruc2
hur
wave
gefs
gdas
gfs_analysisgfs
ndas
nam
Node use for 20091202
00 06 12 18
Development Work
January 2010
High Water Mark
Fence
Production Suite on Supercomputer
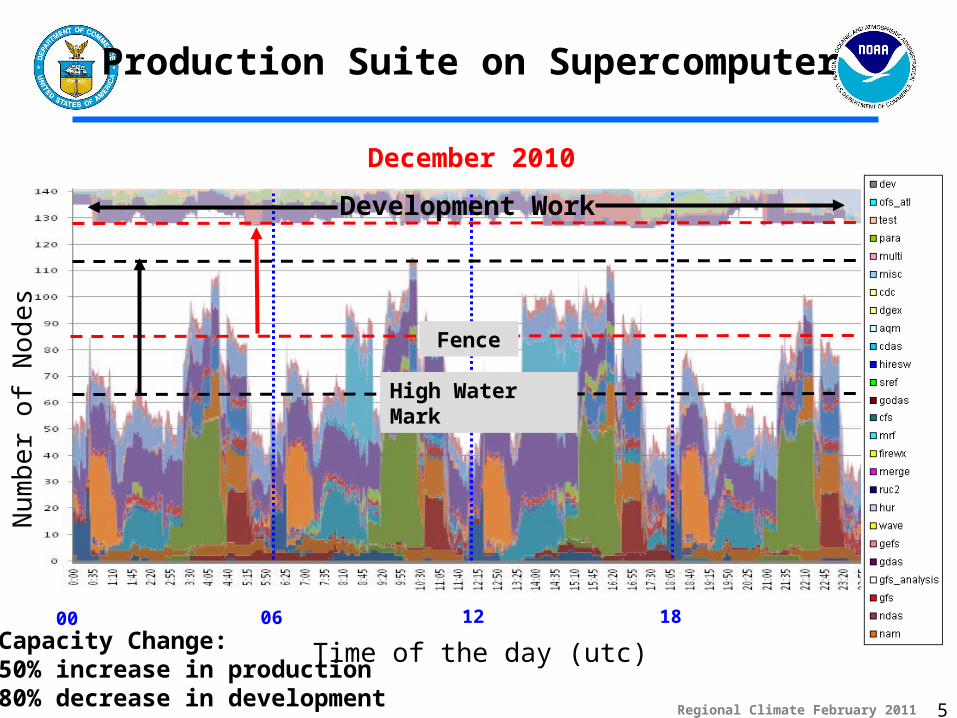
5Regional Climate February 2011
Time of the day (utc)
Nu
mb
er
of N
ode
s
00 06 12 18
Development Work
Production Suite on Supercomputer
December 2010
High Water Mark
Fence
Capacity Change:50% increase in production80% decrease in development

6Regional Climate February 2011
Time of the day (utc)
Nu
mb
er
of N
ode
s
00 06 12 18
Development Work on Supercomputer
December 2010
7Regional Climate February 2011
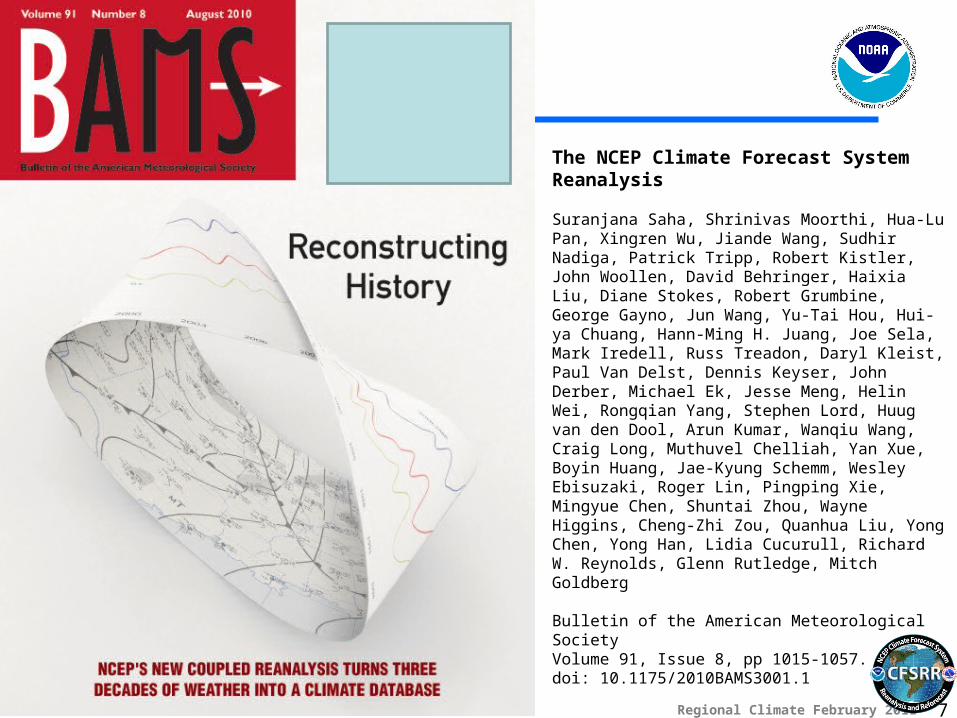
The NCEP Climate Forecast System Reanalysis
Suranjana Saha, Shrinivas Moorthi, Hua-Lu Pan, Xingren Wu, Jiande Wang, Sudhir Nadiga, Patrick Tripp, Robert Kistler, John Woollen, David Behringer, Haixia Liu, Diane Stokes, Robert Grumbine, George Gayno, Jun Wang, Yu-Tai Hou, Hui-ya Chuang, Hann-Ming H. Juang, Joe Sela, Mark Iredell, Russ Treadon, Daryl Kleist, Paul Van Delst, Dennis Keyser, John Derber, Michael Ek, Jesse Meng, Helin Wei, Rongqian Yang, Stephen Lord, Huug van den Dool, Arun Kumar, Wanqiu Wang, Craig Long, Muthuvel Chelliah, Yan Xue, Boyin Huang, Jae-Kyung Schemm, Wesley Ebisuzaki, Roger Lin, Pingping Xie, Mingyue Chen, Shuntai Zhou, Wayne Higgins, Cheng-Zhi Zou, Quanhua Liu, Yong Chen, Yong Han, Lidia Cucurull, Richard W. Reynolds, Glenn Rutledge, Mitch Goldberg
Bulletin of the American Meteorological SocietyVolume 91, Issue 8, pp 1015-1057. doi: 10.1175/2010BAMS3001.1

8Regional Climate February 2011

9Regional Climate February 2011
Attribute Operational (Since 2004) Jan 2011
Analysis Resolution 200 km 38 km
Atmosphere model 1995: 200 km/28 levels
Humidity based clouds
100 km/64 levels
Variable CO2
AER SW & LW radiation
Prognostic clouds & liquid water
Retuned mountain blocking
Convective gravity wave drag
Ocean model MOM-3: 60N-65S
1/3 x 1 deg.
Assim depth 750 m
MOM-4 fully global
¼ x ½ deg.
Assim depth 4737 m
Land surface model (LSM) and assimilation
2-level LSM
No separate land data assim
4 level Noah model
GLDAS driven by obs precip
Sea ice Climatology Daily analysis and Prognostic sea ice
Coupling Daily 30 minutes
Data assimilation Retrieved soundings, 1995 analysis, uncoupled background
Radiances assimilated, 2008 GSI, coupled background
Reforecasts 15/month seasonal output 25/month (seasonal)
124/month (week 3-6)
Advancement of Climate Forecast System (CFS) Planned for Q2FY11

10Regional Climate February 2011
9 Month
Seasonal
45 Day
Operational Configuration for the Climate Forecast System V2 (FY11)
0 UTC 6 UTC 18 UTC12 UTC
A total of 16 CFS runs every day– 4 runs @ 9 months length– 3 runs @ 1 season– 9 runs @ 45 days

11Regional Climate February 2011
22 days
25 days
3 days
7 days
WH-MJO Index 09 Feb to 13 Mar
Preliminary Analysis Shows Improved WH MJO Signal in CFSV2
WH-MJO Index 09 Nov to 13 Dec
CFS Operational
CFS Operational
CFS V2
CFS V2
WH-MJO Index 09 Feb to 13 Mar
WH-MJO Index 09 Nov to 13 Dec
Ski
llS
kill
Ski
llS
kill
Days
Days
Days
Days

12Regional Climate February 2011
Increasing Domination of Ensemble Based Model Systems
• Climate: Multi-Model Ensemble possibilities– International MME products (with EUROSIP)– NCEP Climate Forecast System + GFDL
Climate Model+NCAR CSM
• Mesoscale: Short Range Ensemble Forecasts– WRF/ARW + WRF/NMM + RSM
• Medium Range Weather: North American Ensemble Forecast System (NAEFS)
– GFS + MSC + Navy FNMOC NOGAPS
Experimental Enhanced Resolution Thunderstorm Outlooks
Forecast Nino 3.4 SST Anomalies from CFS
Probability of Temperature over 30C over 24 hour period
(7 day forecast valid Sept 3-4, 2009)

13Regional Climate February 2011
Land-Hydrology Team Mission
• Improve EMC Forecast Model performance and skill via land-surface component:– NAM/WRF, HWRF, GFS, CFS, CFSRR/GLDAS,
NARR (including NDAS and GDAS)• Land model physics (Noah LSM): surface
fluxes, soil, vegetation, snowpack, sfc-layer/PBL
• Land surface characteristics: Vegetation cover, soil type, albedo, emissivity, roughness, etc
• Land state initial conditions: soil moisture & temp, snowpack
• Climate Service Products (CPPA):– NLDAS soil moisture
analysis/monitoring/prediction for NIDIS (drought)
– NLDAS soil moisture seasonal predictions– CEOP (Global Model intercomparisons among
NWP centers; GEWEX program)11

14Regional Climate February 2011
June 1998 – drought year
Large similarity and small spread
EXTREMES: Monthly total column soil moisture anomalies and model spread (mm/month)
July 1993 – flood year
Similar characteristics and large spread

15Regional Climate February 2011
Global HYCOM (RTOFS-Global)
– Adopting Navy 1/12° global HYCOM model using
• Daily initialization from NAVO.• GFS forcing.• Daily 7-8 day run with 2 day spin-
up.
– NCO parallel started FY10Q4.• Establish reliability of NAVO data
feed.• Establish compatibility of NCEP
and Navy forcing.• Develop products with customers.
– Full data on NOMADS.
– Become operational in FY2011Q4
Example surface currents from MMAB parallel

16Regional Climate February 2011
NEMS Component Structure
2
MAIN
EARTH(1:NM)
Ocean Atm Ice
NMM GFS FIM
Dyn Phy
Domains(1:ND)
Below the dashed line the source codes are organized by the model developers.
Wrt Dyn Phy Wrt Dyn Phy Wrt
NEMS
EnsembleCoupler
Chem
All boxes represent ESMF components.
NEMSLAYER
Start timeRun lengthStart timeRun length
EnsembleComponentEnsemble
Component
Choice ofphysical domainand component
Choice ofphysical domainand component
Componentexecution
Componentexecution
Individualnests
Individualnests
NOAA Environmental Modeling System(NEMS)

17Regional Climate February 2011
Questions Welcome