regional consultation on strategies to reduce salt intake...(2) ms jacqui webster, senior project...
TRANSCRIPT
Regional Consultation on Strategies to Reduce Salt Intake
Singapore 2-3 June 2010
(8J\ World Health ~ ' il Organization ' {
Western Pacific Region

WPR/DHP/NCD(1)/2010 Report series number: RS/2010/GE/26(SIN) English only
REPORT
REGIONAL CONSULTATION ON STRATEGIES TO REDUCE SALT INTAKE
Convened by:
WORLD HEALTH ORGANIZATION
REGIONAL OFFICE FOR THE WESTERN PACIFIC
Singapore 2-3 June 2010
Not for sale
Printed and distributed by:
World Health Organization Regional Office for the Western Pacific
Manila, Philippines
October 2010

NOTE
The views expressed in this report are those of the participants in the Regional Consultation on Strategies to Reduce Salt Intake and do not necessarily reflect the policies of the Organization. This report has been prepared by the World Health Organization Regional Office for the Western Pacific for governments of Member States in the Region and for those who participated in the Regional Consultation on Strategies to Reduce Salt Intake, which was held in Singapore from 2 to 3 June 2010.

SUMMARY
The World Health Organization (WHO) Regional Office for the Western Pacific in collaboration with the Health Promotion Board (HPB), Singapore organized a Regional Consultation on Strategies to Reduce Salt Intake. The meeting was held in Singapore from 2 to 3 June 2010. Sixteen experts from 14 countries along with 12 observers and seven secretariat members attended the consultation.
The objectives of the consultation were:
(1) to review the current best practices for reducing salt intake in relation to its measurement and monitoring, governmental actions, food industry actions, and consumer awareness; and
(2) to identify strategies and approaches for reducing salt intake in the Region.
Background information was provided through five plenary papers on the following topics: evidence for action based on international experience; the situation in the Region; monitoring salt intake; delivering healthier choices; and WHO's work in the area of population salt reduction.
Three group sessions were held to address issues related to priority actions in the four domains: (1) measurement and monitoring; (2) governmental actions; (3) industry actions; and (4) consumer awareness, including specific approaches for groups of Member States and the development of a regional salt network. A number of recommendations and suggestions emerged from the discussions and group work that will guide Member States and the Regional Office for the Western Pacific in reducing salt intake and making it a priority public health intervention for noncommunicable diseases (NCD) prevention and control.

CONTENTS Page SUMMARY 1. INTRODUCTION................................................................................................................ 1
1.1 Background .................................................................................................................. 1 1.2 Objectives .................................................................................................................... 1 1.3 Participants................................................................................................................... 2
2. PROCEEDINGS................................................................................................................... 2
2.1 Agenda and programme of the meeting ........................................................................ 2 2.2 Introduction to the meeting .......................................................................................... 2 2.3 Setting the agenda ......................................................................................................... 2 2.4 Group sessions ............................................................................................................. 3
3. CONCLUSIONS AND RECOMMENDATIONS ................................................................ 7
3.1 Conclusions.................................................................................................................. 7 3.2 Recommendations........................................................................................................ 7
ANNEXES:
ANNEX 1 - LIST OF TEMPORARY ADVISERS, REPRESENTATIVES/OBSERVERS AND SECRETARIAT................... 9
ANNEX 2 - AGENDA AND PROGRAMME.............................................................. 13
ANNEX 3 - SUMMARY OF GROUP 1 WORK.......................................................... 17
ANNEX 4 - SUMMARY OF GROUP 2 WORK.......................................................... 21
ANNEX 5 - SUMMARY OF GROUP 3 WORK.......................................................... 25
ANNEX 6 - PROTOCOL FOR POPULATION-LEVEL SODIUM DETERMINATION IN 24-HOUR URINE SAMPLES (PREPARED BY WHO/PAHO) ............................................................... 29
Keywords:
Salt reduction, Noncommunicable diseases

- 1 -
1. INTRODUCTION
1.1 Background
Globally, 51% of stroke (cerebrovascular disease) and 45% of ischaemic heart disease deaths are attributable to high systolic blood pressure. At any given age, the risk of dying from high blood pressure in low- and middle-income countries is more than double than that in high-income countries. High salt intake is a major risk factor for hypertension and other related noncommunicable diseases (NCD), such as stroke and cardiovascular diseases. Recent reviews of the existing evidence have established a clear role for salt reduction as a public health intervention to prevent NCD.
The Western Pacific Regional Action Plan for Noncommunicable Diseases has identified reducing salt intake as one of the approaches for NCD prevention, and this consultation has identified the strategies for its implementation. The regional meeting on NCD prevention and control that was held in Tokyo, Japan in August 2009 urged the World Health Organization to provide guidance to Member States in the development of appropriate policies on NCD prevention and control. This issue was considered further at the Regional Consultation on Approaches to Salt Reduction held in Singapore from 2 to 3 June 2010, in collaboration with the Health Promotion Board, Singapore, a WHO Collaborating Centre for Health Promotion and Disease Prevention. The Korean Foundation for International Healthcare (KFIH) supported the regional consultation.
One of the most cost-effective measures for reducing the burden of NCD is reducing population salt intake. WHO is encouraging all countries to reduce the average salt intake per person to less than 5 g/day by designing national salt reduction strategies. National salt reduction programmes that encourage behaviour change have enormous potential to prevent chronic disease and lower blood pressure at a fraction of the cost of drug therapies for hypertension. Such programmes should be a national health priority for all countries with high incidence of cardiovascular diseases and stroke.
A review by the George Institute for International Health, Australia, showed that as in other regions, salt intake tends to be higher in men in the Western Pacific Region. In general, limited available data indicates that salt intake tends to be higher in parts of Asia, particularly China (7.4-16.9 g/day) and Mongolia (7.8-20.9 g/day) and relatively lower (4-9g/day) in the Pacific island countries and areas. However, the lower estimates tend to be based on dietary surveys and, therefore, were likely to be underestimates. There are also some indications that salt levels have been increasing in the last few years in some countries. Despite the relatively high salt intake, there are not many examples of actions to reduce salt intake in the Region, particularly in the low- and middle-income countries. The review suggested that coordination and support to facilitate monitoring and development of initiatives in the Western Pacific Region would be a useful way of ensuring that individual countries recognize and are able to reap the benefits of national salt reduction programmes.
1.2 Objectives
(1) To review the current best practices for reducing salt intake in relation to data requirements, governmental actions, and consumer awareness; and
(2) To identify strategies and approaches for salt reduction in the Region.

- 2 -
1.3 Participants
Sixteen experts from 14 countries (Australia, Brunei Darussalam, China, Fiji, Japan, Malaysia, Mongolia, New Zealand, Philippines, Republic of Korea, Samoa, Singapore, United Kingdom and Viet Nam) participated in the meeting. Representatives from the Ministry of Health (Singapore), the Secretariat of the Pacific Community (SPC), Shanghai Institute of Cardiovascular Diseases and Health Promotion Board, Singapore attended the meeting. The meeting Secretariat included members from WHO Western Pacific Regional Office, Manila and WHO Headquarters, Geneva (Annex 1).
2. PROCEEDINGS
2.1 Agenda and programme of the meeting
The two-day consultation consisted of plenary presentations and group sessions. The objectives of the plenary presentations were to share evidence and research, and to highlight ongoing activities in the different regions of the world, including the Western Pacific Region. Strategies for how to move forward with salt reduction in the Western Pacific Region were also discussed. Please see Annex 2 for the agenda.
2.2 Introduction to the meeting
Mr Lam Pin Woon, Chief Executive Officer of Health Promotion Board, Singapore, welcomed the participants. Dr Han Tieru, Director of Building Healthy Communities and Populations (DHP) from the Regional Office for the Western Pacific, provided the opening remarks, highlighting the burden of NCD in the Region, and the global and regional initiatives for NCD prevention and control. Dr Cherian Varghese, Technical Officer, NCD, presented the background and scope of the meeting and explained the agenda and programme.
2.3 Setting the agenda
Five background papers described the context of the meeting and provided guidance for the group work and discussion. The key findings of the papers were as follows.
(1) Prof Graham MacGregor, Professor of Cardiovascular Medicine at the Wolfson Institute of Preventive Medicine, London, United Kingdom, presented the evidence for action and the international experience in salt reduction.
(2) Ms Jacqui Webster, Senior Project Manager of the Australian Division of World Action on Salt and Health, The George Institute for Global Health, Australia, presented a review of the regional situation in terms of available information and ongoing approaches.
(3) Ms Alette Addison, Head of Salt Reduction Strategy, Food Standards Agency, United Kingdom, described the methods that have been used to monitor population intakes, the levels of salt in foods and the major sources of salt in the diet, and the effectiveness of initiatives to raise public awareness around salt. She also highlighted that information on the disease burden caused by high blood pressure and the cost-

- 3 -
effectiveness of interventions to reduce salt intake were useful in gaining commitment at a national level to take action on this issue.
(4) Dr Grace Soon, Acting Deputy Director of Nutrition Department, Adult Health Division, Health Promotion Board, Singapore, talked about delivering healthier food choices. She highlighted examples from Singapore.
(5) Mr Xuereb Godfrey, Team Leader, Population-based Prevention, WHO, Geneva, presented WHO's work in convening platforms to develop a toolbox for Member States to support population salt reduction strategies as part of the implementation of the WHO Global Strategy on Diet, Physical Activity and Health (DPAS) and the Noncommunicable Diseases Action Plan.
Issues and concerns identified in the discussions were further deliberated during the group sessions.
2.4 Group sessions
The group sessions were divided into three activities: identifying priority actions for the Region in relation to key themes; identifying approaches specific for groups of Member States; and developing a Regional Salt Network.
2.4.1 GROUP SESSION 1: Identifying priority actions for the Western Pacific Region in relation to key themes
The participants were organized by four themes in order to identify priority actions for the Region: (1) measurement and monitoring; (2) governmental actions; (3) actions by industry; and (4) consumer awareness. The results of the group work are detailed in Annexes 3, 4, and 5. The priority actions from each of the groups were as follows.
Group 1: Measurement and monitoring
The five priority actions were identified: (1) establish measures to monitor population levels of salt intake; (2) identify main sources of sodium in the diet; (3) establish and maintain reliable databases of sodium content of foods; (4) assess consumer awareness about the dangers of excessive salt intake; and (5) consider international actions in relation to salt trade and competition. Protocol for population-level sodium determination in 24-hour urine samples prepared by WHO/PAHO is given in Annex 6.
Group 2: Governmental actions
The five priority actions were identified: (1) establish the point persons or officers of the government who should take the lead and have the power to act; (2) agree upon the government’s role in regulating sodium and influencing salt consumption among consumers; (3) determine the minimum information required to act; (4) decide the need for policy and legislation; and (5) set realistic targets.
Group 3: Actions by industry
The third group identified four priority actions: (1) establish effective mechanisms to engage the food industry; (2) establish transparent mechanisms to identify the specific food

- 4 -
products to target and agree upon standards; (3) consider the effectiveness of voluntary approaches versus regulation; and (4) establish effective mechanisms, such as nutrient databases, for monitoring different stages.
Group 4: Consumer awareness
The fourth group identified four actions: (1) undertake preliminary research to understand consumer knowledge and behaviour; (2) identify the types of messaging and educational strategies; (3) develop health sector-led social marketing campaigns, working with mass media, industries and nongovernmental organizations; and (4) monitor consumer and industry awareness as well as behaviour and practices in relation to sodium intake as well as health outcomes.
2.4.2 GROUP SESSION 2: Specific approaches for groups of Member States
The second group session addressed the specific approaches for groups of Member States. Member States were grouped as follows: Group 1 – China, Japan, Mongolia, and Republic of Korea; Group 2 – Brunei Darussalam, Malaysia, the Philippines, Singapore, and Viet Nam; and Group 3 – Pacific island countries and areas. Results of the group work are detailed in Annexes 3, 4, and 5 and summarized below.
Group 1 – China, Japan, Mongolia and Republic of Korea
The identified next steps for this group of Member States included:(1) undertake a situational analysis, including conducting dietary surveys and where feasible 24-hour urinary sodium estimations; (2) develop a national salt reduction action plan or incorporate salt reduction into existing NCD plans with the health sector leading in partnership with nongovernmental organizations; (3) work with the food industry to target major products to reduce salt levels (e.g. instant noodles); (4) negotiate with food companies and associations to establish standards for salt levels in processed and packaged foods; (5) establish standards for school foods; and (6) raise consumer awareness through focussed messages.
Group 2 – Brunei Darussalam, Malaysia, the Philippines, Singapore and Viet Nam
Group 2 had both country-specific and common outputs. Identified next steps included: (1) establish baseline data on salt intake and health through food consumption surveys, 24-hour urine collection and blood pressure measurement; (2) consider government legislation on lowering salt intake; (3) raise awareness through integrated healthy lifestyle campaigns in collaboration with nongovernmental organizations; (4) consider mandatory labelling and healthier choice symbols on packaged products; and (5) engage with manufacturers, retailers, food service industry, fast food companies and institutions that serve food (schools, workplaces, etc.) to develop standards and guidelines on salt levels.
A number of specific barriers relating to working with industry were highlighted, including various cross-border products with high salt content in the Region, dependence on imported food products in Brunei Darussalam, and challenges of engaging industry in Viet Nam.
The group also suggested establishing a population target to reduce salt intake by 10% in five years in the Region and establishing a target to reduce sodium in key products (sauces, noodles, processed seafood and snacks) by at least 25% (depending on country-specific food consumptions patterns). It was suggested that this might be achieved through forming a network

- 5 -
in ASEAN countries and incorporating the technical working group for NCD to share experience, technical expertise and to work with the food industry within and among the countries.
Group 3 – Pacific island countries and areas
Group 3 proposed to focus on Fiji and Samoa. Specific challenges, such as small populations and large distances among and within Pacific island countries and areas, and high reliance on imported food are common. Existing data on salt intake from Pacific island countries and areas are derived from dietary recall which is less than reliable than data from urinary analysis. Potential difficulties with 24-hour urine collection in Pacific island countries and areas include cost, compliance and the perception that it may not be culturally appropriate to ask people (particularly women) to provide 24-hour urine collections. The group noted existing Australian and New Zealand food composition databases, as well as the SPC food composition database which are to be updated.
Existing surveys were identified for these countries, including the STEPS and mini-STEPS surveys, demographic health surveys, school surveys (in Fiji) and nutrition surveys. Conducting 24-hour analysis or spot urine analysis surveys as well as frequency surveys targeting specific populations were proposed, starting with one or two countries as pilots. Ideally, both 24-hour analysis and spot urine surveys should initially be conducted in order to decide if spot urine surveys could be used in the future to monitor sodium intake in populations.
The identified top food items with high salt content were canned corned beef, salted beef, tinned fish, noodles, bread, soy sauce and other sauces and biscuits, as well as foods determined in the 2008 Food Availability in stores survey (conducted in 13 Pacific countries and areas).
The group noted the low levels of public awareness about the adverse health consequences of high salt intake and suggested boosting government and stakeholder support for improving consumer awareness. There was no obvious conflict with messages about iodine deficiency and use of iodized salt.
The target is to reduce salt intake by 20% by 2020, which is about half a gram per year over ten years. They also proposed monitoring salt intake every five to ten years with the existing STEPS surveys. The group also addressed the issue of imported food in the Pacific and the need for a regional approach.
2.4.3 GROUP SESSION 3: Development of a Regional Salt Network
The third group session considered the development of regional networks. Ms Alette Addison provided an overview of the European Network and Mr Godfrey Xuereb presented the structure of a similar network under development in the Americas region. Details of the outputs are outlined in Annexes 3, 4 and 5 and are summarized below.

- 6 -
Group 1 – China, Japan, Mongolia and Republic of Korea
Group 1 identified a need for a network not only for salt reduction but also for NCD prevention. It was agreed that salt reduction initiatives, common food products and cultural aspects of the neighbouring countries needed to be taken into consideration in the sub-region. The network’s objectives could be to share information and methodology, learn from other countries, and support capacity-building (e.g. identifying priorities, communicating with food industries, and collecting data).
It was suggested that China could coordinate the network with each country reporting back to country stakeholders. Two to five people (representing different areas of expertise) from each country could be included in the sub-region network.
To sustain the network, regular meeting to discuss strategies could be organized, which could be via teleconference or face-to-face meetings. It was proposed that funds could be set up to support developing countries to implement salt reduction campaigns.
Group 2 – Brunei Darussalam, Malaysia, the Philippines, Singapore and Viet Nam
Group 2 agreed that countries should not work alone on salt issues and that a network could be useful to address common concerns. The network’s objectives could be to exchange technical information, share best practices and work together on common issues at the regional and sub-regional level. The network could help disseminate information to member countries as well as build capacity in relation to developing new technologies and implementing strategies.
The group identified the existing networks of ASEAN, East Asian countries, and Pacific Island countries and areas as well as those of the Pan American Health Organization (PAHO) and European Salt Action Network (ESAN) as part of the regional network structure, with the Regional Office of the Western Pacific as the hub.
It was noted that strong secretariat work and Member States’commitment would be needed to sustain the network, and it should be self-funded.
Group 3 – Pacific island countries and areas
Group 3 indicated that they do not need a new network for now, as this would entail an additional administrative layer and extra work. They mentioned the existing networks, such as the physical activity network and Pacific health promoting school network covering other health topics.
The group identified the following actions as necessary: tapping into existing networks; formulating salt reduction strategies as part of NCD plans; combining salt reduction strategies (with targets such as 0.5 g reduction in salt consumption per year for ten years) with Iodine Deficiency Disorder (IDD) elimination strategies (ensuring that all salt for human consumption is iodized at the appropriate level); and building up a network from the core group present in the consultation. For the network’s proposed structure, the group suggested that all stakeholders, except the industry, should be included in a controlled, open format. An industry network and advocacy network (of consumers associations and relevant nongovernmental organizations) should also be considered, if needed.

- 7 -
3. CONCLUSIONS AND RECOMMENDATIONS
3.1 General conclusions
The Regional consultation on strategies to reduce salt intake was held successfully, and the objectives were met. The discussions, observations and outcome of the group work and recommendations will be used by the WHO’s secretariat with further inputs from experts for supporting salt reduction strategies and programmes in Member States. Suggestions for developing a Regional Salt Network will also be advanced through further consultations.
3.2 Recommendations
3.2.1 Recommendations for priority actions on salt reduction in the Region at national level follow.
(1) Identify a lead organization to engage with a wide range of stakeholders (government, private sector and nongovernmental organizations) to develop and deliver a national salt reduction strategy.
(2) Establish a baseline for average population salt intake and collect information on the main sources of salt in the diet.
(3) Develop a salt reduction strategy, including: (a) measurement monitoring and evaluation; (b) reformulation (including target setting and working with local suppliers to reduce salt in foods); (c) improved nutrition labelling; and (d) consumer awareness and behaviour change.
3.2.2 Recommendations for developing salt reduction networks
(1) Existing NCD prevention and related networks should be used to regularly update and exchange information on salt reduction activities where they exist and operate effectively.
(2) Consider establishing sub-regional and regional networks which can support the development and implementation of salt reduction strategies.
3.2.3 Recommendations for WHO
(1) The Regional Office for the Western Pacific should provide guidance to Member States in planning, implementing and evaluating nationally relevant plans and programs for reducing salt consumption.
(2) The Regional Office for the Western Pacific should disseminate good practices identified within the Region and from countries outside of the Region.
(3) The Regional Office for the Western Pacific should maintain links with the PAHO Salt Expert Group and the European Salt Action Network (ESAN), and disseminate the tools and information provided by these networks to the Western Pacific Region.

- 8 -

- 9 -
ANNEX 1
LIST OF TEMPORARY ADVISERS,
REPRESENTATIVES/OBSERVERS AND SECRETARIAT
1. TEMPORARY ADVISERS Dr Alette Addison, Head of Salt Reduction Strategy, Food Standards Agency, Aviation house 125 Kingsway, London WC2B 6NH, United Kingdom, Tel. no.: 0044 0 207 276 8129 Fax no.: 0044 0 2067276 8193, E-mail: [email protected] Dr Enkhtungalag Batsaikhan, Researcher, Nutrition Research Center, Public Health Institute 13381 Peace Avenue - 17, Bayanzurkh District, Ulaanbaatar 210349, Mongolia Tel. no.: 976 11 451127, Fax no.: 976 11 451127, E-mail: [email protected], or [email protected] Ms Frances Prescilla Cuevas, Chief Health Programme Officer, Degenerative Disease Office National Center for Disease Prevention and Control, Department of Health, San Lazaro Compound, Sta. Cruz, Manila, Philippines, Tel. no.: 062 7322492, 09189018526 Fax no.: 062 7322492, E-mail: [email protected] Dr Do Thi Ngoc Diep, Deputy Director Nutrition Center of Ho Chi Minh City, 180 Le Van Sy Street, Ward 10 Phu Nhuan District, Ho Chi Minh City, Viet Nam, Tel. no.: 84 913 717610 Fax no.: 84 838 448 405, E-mail: [email protected]; [email protected] Dr Gu Dongfeng, Vice President, Fu Wai Hospital & Cardiovascular Institute, Chinese Academy of Medical Sciences, No.167 Beilishi Road, Beijing, 100037, The People's Republic of China Tel. no.: 8610 68331752, Fax no.: 8610 88363812, E-mail: [email protected] or [email protected] Ms Hjh Masni Hj Ibrahim, Head, Community Nutrition Division, Department of Health Services Ministry of Health Brunei Darussalam, Block 30, Simpang 32-37, Anggrek Desa Government Flats Commonwealth Drive, Bandar Seri Begawan BB3910, Brunei Darussalam Tel. no.: 673 2 334894, 673 2 334895, Fax no.: 673 2 334897, E-mail: [email protected] Dr Graham MacGregor, Professor of Cardiovascular Medicine, Wolfson Institute of Preventive Medicine, Charterhouse Square, London EC1M 6BQ, United Kingdom, Tel. no.: 020 7882 6217 Fax no.: 020 8725 2959, E-mail: [email protected] Dr Rachael McLean, Senior Research Fellow, Edgar National Centre for Diabetes Research University of Otago, PO Box 913, Dunedin 9054, New Zealand, Tel. no.: 64 3 470 3805 Fax no.: 64 3 474 7641, E-mail: [email protected] Dr Oh Kyungwon, Principal Researcher, Division of Chronic Disease Surveillance, Korea Centers for Disease Control and Prevention, 194, Tongilo, Nokbeon-dong, Eunpyung-gu, Seoul Republic of Korea, Tel. no.: 82 2 380 2192, Fax no.: 82 2 382 0398, E-mail: [email protected]

- 10 -
Dr Zainal Ariffin bin Omar, Deputy Director of Disease Control (NCD), Department of Public Health, Ministry of Health, Level 6, Block E10, Parcel E, Federal Government Administrative Centre 62590 Putrajaya, Malaysia, Tel. no.: 603 88834145/6019 2107286 Fax no.: 603 88886277 E-mail: [email protected]
Ms Jimaima T. Schultz, Manager, National Food and Nutrition Centre (NFNC), PO Box 2450 Government Buildings, Suva, Fiji, Tel. no.: 679 3313055, Fax no.: 679 3303921 E-mail: [email protected] Dr Grace Soon, Acting Deputy Director, Nutrition Department, Adult Health Division, Health Promotion Board, Second Hospital Avenue, Singapore 168937, Tel. no.: 65 6435 3016 Fax no.: 65 6438 3609, E-mail: [email protected] Dr Yukari Takemi, Professor, Nutrition Ecology, Department of Nutrition Sciences, Kagawa Nutrition University (Joshi Eiyo Daigaku), 3-9-21 Chiyoda, Sakado, Saitama, Japan Telefax no.: 049 282 3721, E-mail: [email protected] (office), [email protected] Dr Satupaitea Viali, Specialist Physician & Cardiologist, UN Physician, Medical Specialist Clinic P.O. Box 2122, Apia, Samoa, Tel. no.: 0685 31376, Fax no.: 0685 27563 E-mail: [email protected]; [email protected] Ms Jacqui Webster, Senior Project Manager, Australian Division of World Action on Salt and Health, The George Institute for International Health, Level 10, King George V Building, Royal Prince Alfred Hospital, PO Box M201 Missenden Road, Sydney NSW 2050, Australia Tel. no.: 61 2 9993 4520, Fax no.: 61 2 9993 4502, Web: http://www.thegeorgeinstitute.org E-mail: [email protected] Dr Zhao Wenhua, Executive Deputy Director, National Center for Chronic and Noncommunicable Disease Control and Prevention (NCNCD), Chinese Center for Disease Control and Prevention (China CDC), No. 27 Nanwei Road, Xuanwu District, Beijing 100050 The People's Republic of China, Tel. no.: 8610 83154663, Fax no.: 8610 63042350 E-mail: [email protected]
2. REPRESENTATIVES/OBSERVERS
Dr Derrick Heng, Director, Epidemiology and Disease Control Division, College of Medicine Building, Ministry of Health, Singapore, 16 College Road, Singapore 169854, Singapore Tel. no.: (65) 6325 9224 E-mail: [email protected]
Dr Si Thu Win Tin, NCD Adviser-Physical Activity, Healthy Pacific Lifestyle Section, Public Health Division, Secretariat of the Pacific Community, B.P. D5-98848, Noumea Cedex New Caledonia, Tel. no.: 687 262000 Ext 369 Fax no.: 687 263818, E-mail: [email protected]; [email protected] Dr Jun Zhou, Shanghai Institute of Cardiovascular Diseases, 180 Feng Lin Road, Shanghai 200032, The People's Republic of China, E-mail: [email protected]
- 11 -
Mr Alan Pui, Deputy Director, Strategic Planning and Collaborations Department, Research & Strategic Planning Division, Health Promotion Board, 3 Second Hospital Avenue, Singapore 168937, Tel. no.: (65) 6435 3035, Fax no.:(65) 6438 9757 E-mail: [email protected]
Dr Chan Mei Fen, Deputy Director, Research & Evaluation Department, Research and Strategic Planning Division, Health Promotion Board, 3 Second Hospital Avenue, Singapore 168937 Tel. no.: (65) 6435 3834, Fax no.:(65) 6538 9757, E-mail: [email protected]
Ms Christine Fock, Deputy Director, Integrated Screening Department, Healthy Ageing Division, Health Promotion Board, 3 Second Hospital Avenue, Singapore 168937 Tel. no.: (65) 6435 3220 Fax no.: (65) 6438 8416, E-mail: [email protected]
Mr Gary Khoo, Deputy Director, Patient Education Department, Healthy Ageing Division Health Promotion Board, 3 Second Hospital Avenue, Singapore 168937 Tel. no.: (65) 6435 3256 Fax no.: (65) 6438 8416, E-mail: [email protected]
Dr Annie Ling, Director, Adult Health Division, Health Promotion Board, 3 Second Hospital Avenue, Singapore 168937, Tel. no.: (65) 6435 3539 Fax no.: (65) 6536 6247 E-mail: [email protected] Dr Chew Ling, Director, Research and Strategic Planning Division, Health Promotion Board 3 Second Hospital Avenue Singapore 168937, Tel. no.: (65) 6435 3819 Fax no.: (65) 6536 8532 E-mail: [email protected]
Dr Shyamala Thilagaratnam, Director, Healthy Ageing Division, Health Promotion Board 3 Second Hospital Avenue, Singapore 168937, Tel. no.: (65) 6435 3914 Fax no.: (65) 6536 6247 E-mail: [email protected] Dr K Vijaya, Director, Youth Health Division, Health Promotion Board, 3 Second Hospital Avenue, Singapore 168937, Tel. no.: (65) 6435 3556 Fax no.: (65) 6536 8656 E-mail: [email protected] Dr Wong Mun Loke, Deputy Director, Youth Health Programme Development Department Youth Health Division, Health Promotion Board, 3 Second Hospital Avenue, Singapore 168937 Tel. no.: (65) 6435 3769, Fax no.: (65) 6438 8226 E-mail: [email protected]
3. SECRETARIAT
Dr Han Tieru, Director, Building Healthy Communities and Populations, WHO, United Nations Avenue, Ermita, Manila 1000, Philippines, Tel. no.: 632 5289980, Fax no.: 632 5211036 E-mail: [email protected] Dr Cherian Varghese (Responsible Officer), Technical Officer in Noncommunicable Diseases WHO, United Nations Avenue, Ermita, Manila 1000, Philippines, Tel. no.: 632 5289866 Fax no.: 632 5211036, E-mail: [email protected]

- 12 -
Dr L.T. Cavalli-Sforza, Regional Adviser in Nutrition, WHO, United Nations Avenue, Ermita Manila 1000, Philippines, Tel. no.: 632 5289864, Fax no.: 632 5211036 E-mail:[email protected] Dr Mario Villaverde, Technical Officer, Health Promotion, WHO, United Nations Avenue Ermita, Manila 1000, Philippines, Tel. no.: 632 5289884, Fax no.: 632 5211036 E-mail: [email protected] Dr Tsogzolmaa Bayandorj, National Professional Officer, Noncommunicable Diseases WHO Representative Office in Mongolia, Government Building – VIII, Olympic Street Ulaanbaatar, Mongolia, Tel. no.: 976 11 322430, 327870, Fax no: 976 11 324683 E-mail: [email protected] Dr Temo Waqanivalu, Nutrition and Physical Activity Officer, WHO Representative Office in the South Pacific, Level 4 Provident Plaza One Downtown Boulevard 33 Ellery Street, Suva Fiji, Tel. no.:679 3304600, Fax no.: 679 3300462/3311530 E-mail: [email protected]
Mr Xuereb Godfrey, Technical Officer, Surveillance and Population-based Prevention Unit Department of Chronic Diseases and Health Promotion, World Health Organization CH-1211 Geneva 27, Switzerland, Tel. no.: 41 22 7912617, Fax no.: 41 22 7911581 E-mail: [email protected]
- 13 -
ANNEX 2
AGENDA
(1) Opening
(2) Introduction of participants
(3) Salt and health: evidence for action
(4) Regional situation
(5) Monitoring salt intake in the population
(6) Identifying priority actions
(7) Approaches for salt reduction
(8) Development of a regional salt network
(9) Conclusions and recommendations
(10) Closing

- 14 -
PROGRAMME
DAY 1 Wednesday, 2 June (Lily Ballroom, Level 4) 08:00-08:30 Registration 08:30-09:15 Opening Welcome remarks Mr Lam Pin Woon Chief Executive Officer Singapore Health Promotion Board Opening address Dr Han Tieru, Director Division of Building Healthy Communities and Populations WHO Western Pacific Regional Office Background and Dr Cherian Varghese scope of the meeting Technical Officer, NCD Introduction of facilitators WHO/WPRO and participants 09:15-09:30 Official photo session 09:30-10:00 Coffee/Mobility break (Camellia Room, Level 4) SESSION 1: Setting the agenda 10:00-10:30 Salt and health: evidence for action and international experience - Professor Graham MacGregor 10:30-10:50 Regional situation - Ms Jacqui Webster 10:50-11:20 Monitoring salt intake in the population - Dr Alette Addison 11:20-11:40 Delivering healthier food choices - Dr Grace Soon 11:40-12:00 WHO's work in the area of population salt reduction - Mr Xuereb Godfrey 12:00-12:30 Discussion 12:30-13:30 Lunch break (Camellia Room, Level 4)

- 15 -
SESSION 2: Group work to identify priority actions for WPR in the 4 domains 13:30-15:00 Group 1 - Measurement and monitoring Group 2 - Governmental actions Group 3 - Actions by industry Group 4 - Consumer awareness 15:00-15:30 Coffee/Mobility break (Camellia Room, Level 4) 15:30-16:30 Group presentations and discussion 18:30 Welcome dinner (River Terrance, Level 1) DAY 2 Thursday, 3 June (Lily Ballroom, Level 4) SESSION 3: Group work on approaches, specific for groups of Member States 08:30-09:00 Recap of Day 1 09:00-10:30 Group work on approaches, specific for groups of Member States (each group to address measurement, governmental and industry actions and consumer awareness and provision of healthier options)
10:30-11:00 Coffee/Mobility break (Camellia Room, Level 4) 11:00-12:45 Group presentations and discussion
Group 1 - China, Mongolia, Republic of Korea Group 2 -Brunei Darussalam, Malaysia, Philippines, Singapore Group 3 - Cambodia, Lao People's Democratic Republic, Viet Nam Group 4 - Pacific Island countries (Fiji, Samoa)
12:45-13:45 Lunch break (Camellia Room, Level 4) SESSION 4: Group work on development of a regional salt network 13:45-15:15 Group 1 - Structure and membership Group 2 - Functions and sustainability 15:15-15:45 Group presentation and discussion on regional salt network 15:45-16:15 Coffee/Mobility break (Camellia Room, Level 4) 16:15-16:45 Closing remarks by Dr Han Tieru Director, Division of Building Healthy Communities and Populations

- 16 -

- 17 -
ANNEX 3
OUTPUT OF GROUP WORK 1 NOTES ON IDENTIFYING PRIORITY ACTIONS FOR THE REGION
IN THE FOUR DOMAINS Group 1: Measurement and monitoring
(1) Measures needed to monitor population levels of salt intake a. Establish baseline data via 24-hour(hr) urinary collection (Minimal sample size
= 100 for each sub-group) b. Use spot urine for trending purposes (monitoring of urinary sodium shouldn’t be
too frequent due to inability to show significant difference) c. Consider the possibility of using overnight urine
i. Found to correlate well with 24-hr urine based on published studies in China
ii. But no general consensus among the scientific community yet d. Collection of 24-hr urinary remains as the gold standard e. Use Na:Creatinine or PABA to correct for incompleteness of 24-hr urine
collection f. Determine response rate by the way the sodium study is being carried out. Points
to consider with method to use: i. If tagged along with other survey parameters: higher subject burden
ii. If done in isolation: less rapport building g. Ascertain via dietary surveys (24-hr recalls, weighted food records etc)
i. Monitor the sale of salt as a potential macro assessment. However need to consider the usage ( salt may be used to melt snow, etc.)
(2) Sources of sodium a. Ascertain via dietary surveys (24-hr recalls, weighted food records etc) b. Monitor the sale of salt as a potential macro assessment
i. However need to consider the usage ( salt may be used to melt snow, etc.)
(3) Maintaining a reliable database a. It is important to have good network with trade associations to find out
significant changes in the sodium content of foods; food database can then be updated accordingly
b. For restaurants, design a recipe database supplemented by analysis of most common dishes
c. Nutrition labelling will give an idea of sodium levels where provided on packaged foods
d. Use mixture of composite samples and brands with large market share. (4) Consumer awareness
a. When assessing consumer awareness with question such as “Are you making effort to reduce salt intake?”, it is important to find out what changes are made. These could include reading labels, cutting down on added salt, and may depend on culture differences.
b. It is important to educate consumers on sources of salt that they’re not aware of. (5) International action
a. Demand for Multinational Companies (MNCs) to only provide the lowest salt option to countries

- 18 -
i. Would first need to know the level of sodium in product being sold internationally
ii. Issue with WTO, competition laws iii. As an alternative, go through advocacy groups to create pressure among
the industry Group 2: Governmental actions
(1) Who should take the lead? a. Ministry of Health? Ministry of Agriculture? Ministry of Trade? b. Who has the power to act? Not necessarily the Ministry of Health c. Requires whole-of-government approach d. Also requires support of health professionals and NGOs e. Set up a national agency to look not only at the contaminants, but also at
nutritional quality (high level of transfat, salt etc.) of the food? (2) Sodium vs. salt
a. Different approaches for different stakeholders? Salt for public, sodium for manufacturers and professionals?
b. Use salt in ALL communication since food industry adds salt in food processing? i. To follow CODEX recommendations? - But the recommendation is yet
to be released. c. What should be used in nutrition labels? Salt vs. sodium?
(3) Minimum information required to act a. Current salt intake and sources of salt or just reduce salt, especially if everyone
agrees that intakes are high? b. Inconsistent result from diet recall vs. hypertension rate c. Most countries conduct nutrition survey every five years. The urine collection
can be built into this survey. (4) What is needed – policy/legislation/voluntary action?
a. Policy and legislation changes may be ideal but they involve a long process and are difficult to agree on (what to legislate and target, and they creates trade barriers.
b. It is important to communicate to politicians and convince public to switch to low salt diet. This will pressure industry to provide lower salt food.
c. Sharing success story via a ‘template’ to other countries. d. Can create a fact sheet on how to engage the industry. e. Salt tax: may be necessary to use the spectre of legislation to persuade food
industry to volunteer for salt reduction. (5) How to set targets?
a. It is important to set realistic targets, with gradual reduction over the years b. Don’t set absolute targets, i.e. 5-6g by 2015, but reduction targets, e.g. reduce by
4g over 4 years. c. The benefits depends on the amount reduced, not the absolute intake achieved. d. Ideal target is 5g-6g
Group 3: Actions by food industry
(1) How to engage food industry? a. High-level government commitment and threat of legislation b. Transparent processes to agree what foods to focus on, how to set targets, etc. c. International food and beverage alliance– translate to regional situation d. Work with importers and distributors e. Cross industry agreements for certain products

- 19 -
f. Support through education and guidance for companies like small and medium enterprises (SMEs) cottage industries to meet criteria set by agencies
g. Support for small companies and cottage industries through anti-poverty schemes, tax incentives, etc.
h. Create consumer demand through campaigns, get consumer organisations to raise awareness through media
(2) Identifying which foods to target a. Need transparent mechanisms b. Gold standard is a combination of national survey and up-to-date food
composition table to identify foods c. In absence of this information, use available knowledge from FAO food
availability data, import data, consult with stakeholder to identify top 8-10 products to target
d. Focus on key products, such as instant noodles, where both local and imported products are high in salt. Put pressure of food industry as consumer awareness increases.
(3) Do voluntary approaches work? Yes, but
a. Need high-level political support and threat of legislation and resources to support and monitor
b. Need effective mechanisms for monitoring c. Approaches need to be agreed in transparent way with key stakeholders (not self-
regulation) (4) How to monitor?
a. Monitoring criteria need to be agreed upon between government and industry b. Need different levels of monitoring (e.g. monitoring whether companies have
done what they said and monitoring whether it has made any difference) c. Nutrient databases are useful but need to consider how to adapt to where there is
no labelling information d. What happens if there is non-compliance?
Group 4: Consumer awareness
(1) Preparatory work a. Conduct situational analysis and needs assessment b. Understand major sources of sodium, target groups, current perceptions, best
medium to reach target population (engage experts) i. Suggestion: use life cycle approach, target both fathers and mothers
(2) Messaging a. Types of messaging
i. Focus on ‘salt’ not ‘sodium’ ii. Simple messaging
iii. Negative messaging (i.e. high salt intake leads to hypertension) iv. Awareness messaging needs to be complemented with capacity-building
(e.g. practical skills to prepare food lower in salt) v. Educate people on sources of high salt
b. Complementary messaging i. Have more fruits and vegetables
ii. Use fresh food and refrigeration

- 20 -
(3) Role of health sector a. Drive the public campaign
i. Increase demand for more low sodium options b. Work with mass media, industry and NGOs for integrated approach
(4) Monitoring a. Awareness of consumer and industry b. Behaviour (linked to availability of low sodium foods) c. Sodium intake and health outcomes.

- 21 -
ANNEX 4
OUTPUT OF GROUP WORK 2
NOTES ON SPECIFIC APPROACHES FOR GROUPS OF MEMBER STATES
Group 1 – The People’s Republic of China, Republic of Korea, Mongolia and Japan General agenda for the next step
• Situation analysis (where, what and how) • Regional strategy/ sub-strategy • Develop national action plan or include it as part of national NCD plan
Measurement & monitoring
• Dietary survey to identify sources of sodium in the population (source of salt) • Most countries have dietary survey results but have not conducted 24 hr urine analysis
yet – next steps for planning and conducting • Possible consideration: seek assistance from WHO through WHO collaborating centre
from the United Kingdom
Governmental actions • Develop national action plan • Health sector to take a leading role to work with other stakeholders • Work through partners and stakeholders (NGOs, professional academia and industry) • Share success stories from other countries
Actions by industry
• Work with industry to target major products to reduce salt content (e.g. instant noodles, pickled food, kim chi, fermented tofu, salted tea, chips, sausages especially with restaurants, NGOs, and e.g. culinary associations)
• Negotiate with the food societies, associations, etc. • Set standards for schools and packaged food that include portion control)
Consumer awareness
• Raise consumers' awareness about sources of sodium • Create different messages for different areas (e.g. reduce salt in cooking) • Generate community pressure based upon demand
Group 2 – Singapore, Malaysia, Viet Nam, Brunei Darussalam and the Philippines Measurement & monitoring
• Singapore: National nutrition survey, 24-hour urine collection, BP measurement • Malaysia: BP measurement, food consumption survey • Philippines: food consumption survey, BP measurement • Brunei: BP measurement, food consumption survey • Vietnam: food consumption survey (only in Ho Chi Minh City), BP measurement
Government initiatives
• No legislation on lowering salt intake • Organizing integrated Healthy Lifestyle Campaigns in collaboration with NGOs

- 22 -
Consumer awareness Singapore • Healthier Choice Symbol on packaged products • Engage retailed (e.g. supermarkets for in-store promotions) • Work with different sectors e.g. Schools, workplaces etc. Malaysia • Mandatory labelling Brunei Darussalam • Guidelines for schools and office catering • Consumer awareness focused on Halal food products. • Consumer awareness low on high-salt products which are not branded as “salty”
Industry
Regional situation • Various cross-border products. Singapore • Work with food manufacturers, food service industry to reformulate and develop
healthier prototypes Malaysia • Minister should dialogue with salt and fast food industry to lower salt. • Work with supermarket chains Viet Nam • Difficulty engaging industry The Philippines • Dialogue with fast food chains. Brunei Darussalam • Food industry highly dependent on imported food products from neighbouring countries
such as Malaysia, Singapore, and Australia Action Plan
Target: • Reduction of salt intake by 10% over 5 years.
Method
• To form an ASEAN network which includes the Technical Working Group (TWG) for NCDs to share experience and technical expertise, and to work together with the food industry within and among countries.

- 23 -
Key products identified:
1. sauces 2. noodles 3. processed seafood 4. snacks
Work to reduce sodium in key products by at least 25%. (Specifics targets for each country should be set according to individual food consumption patterns.)
Group 3 – Pacific island countries • Focus on Samoa and Fiji • Pacific - small populations, large distances, • Reliance on imported food Data
• Lack of data from urinary analysis • Issues of cost, compliance, cultural appropriateness • 24 hour vs spot urine • Sample - size, adults or children, men and women? • Frequency surveys • Start with 1 or 2 countries as pilot
Existing Surveys
• STEPS surveys • Mini-STEPS • Demographic health surveys • Schools surveys - Fiji • Nutrition survey - expensive and time-consuming
Food consumption database
• Existing database Secretariat of the Pacific Community (SPC)- due to be updated • Australian and New Zealand databases
Top food items with highest salt content
• Canned corned beef • Salt beef • Tinned fish • Noodles • Bread • Soy sauce and other sauces • Biscuits • 2008 Food Availability in Stores survey foods high in fat salt sugar in 13 Pacific
Countries Objectives / Targets
• “20% by 2020” • Half a gram per year over 10 years.

- 24 -
Working with industry • Imports from Australia, New Zealand, the Philippines, Fiji • Fiji - local food industry • Bread produced locally • Identify key foods, industries • Project to compare key foods exported to Pacific island countries • Government support and regulation may help, regional approach
Public awareness
• Currently very low • No existing campaign • Needs government support, resources, and local champions • Consider key messages and stakeholders • No obvious conflict with messages aboutiIodine deficiency
Stakeholders
• Government key stakeholder • Others include - churches, schools, households,
Monitoring
• Every 5-10 years with existing STEPs surveys
- 25 -
ANNEX 5
OUTPUT OF GROUP WORK 3 NOTES ON DEVELOPMENT OF A REGIONAL SALT NETWORK
Group 1 – The People’s Republic of China, Republic of Korea, Mongolia and Japan Is there a need for a network?
• Yes • Not only for salt reduction but also for NCD prevention networking
Salt initiative sub-region group within the Region
• Common food products and culture • Neighbouring countries
Objectives of a network
• To share information and methodology • Learn from other similar countries • Continue capacity-building
o e.g. identify priorities, how to communicate with food industries, collection of data
What should the structure be?
o Each countries will report back to their stakeholders within the countries, such as the Ministry of Health
• Tentatively China may coordinate the networking Membership
• Comprised of 2-5 people from each country o Need experts from different background, such as professionals organisations of
medical and nutrition, government, food industries, media, etc. Secretariat – To be decided Sustainability
• Regularly meet to discuss strategies o Teleconferencing o Face-to-face meeting
Funding
• Propose funds to be set up for developing countries for campaigns

- 26 -
Group 2 – Singapore, Malaysia, Viet Nam, Brunei Darussalam and the Philippines Do we need a network?
• Yes: Countries should not work alone on salt issue • Network can bring concerns together.
Objectives
• Conduit for exchange of technical information/ sharing of best practices • Working together on common issues at the regional and sub-regional level
Functions
• Support group ○ Technical ○ Collective engagement from various countries ○ Sharing methods used to initiate salt reduction (e.g. methods used to reduce salt in
sauces, (government papers, scientific literature used, and positioning) ○ Getting the agenda out to other Member Countries
• Provide leadership ○ Development of new technologies/strategies (e.g. protocol documents)
Structure
Membership
• The 10 ASEAN members but also invite different stakeholders (NGOs, academia) when needed
• Caution about membership (e.g. international food and beverage alliance) Secretariat
• WHO at the regional level • ASEAN member states by rotation at the sub-regional level
Sustainability
• Strong secretariat work and member state commitment Funding
• Self-financed

- 27 -
Group 3 – Pacific Island countries, (Fiji and Samoa) Do we need a network?
Not now, but as the situation develops on the ground, and at the appropriate time, yes (estimate in 2-3 years).
Reasons: • Need from the ground is not there • Funding is crucial • Additional administrative layer and additional work • Networks already exist, but on other health subjects
– Physical activity network – Pacific health promoting school
Steps to build a network
• Tap into existing networks – “2 – 1 – 22” WHO-SPC NCD regional framework
(2 organisations, 1 team, managing 22 countries) – Actions based on the 4 domains for each country
• Salt-reduction strategies incorporated as part of NCD plans – Reflect salt reduction targets under nutrition targets in NCD plans (e.g. 0.5g
reduction per year for 10 years) – Concerns: salt message will get lost under larger NCD framework
• Build up network from core group present at Regional Office for the Western Pacific meeting
Proposed structure and membership of network
• Controlled-open format • All members except industry • Is there a need for an industry network and advocacy network?

- 28 -

- 29 -
ANNEX 6
PROTOCOL FOR POPULATION-LEVEL SODIUM DETERMINATION IN 24-HOUR URINE SAMPLES (PREPARED BY WHO/PAHO)
PROTOCOL FOR POPULATION LEVEL SODIUM DETERMINATION IN 24‐HOUR URINE SAMPLES Prepared by: WHO/PAHO Regional Expert Group for Cardiovascular Disease Prevention through Population‐wide Dietary Salt Reduction Sub‐group for Research and Surveillance May 2010
Table of Contents
Section 1: Introduction ............................................................................................................................... 3 Overview of the WHO/PAHO Protocol for Population Level Sodium Determination in 24‐hour Urine
Samples ....................................................................................................................................... 3 Rationale for Population Level Sodium Determination in 24‐hour Urine Samples ................................ 5
Section 2: Field Protocol ............................................................................................................................. 7 Overview of the Field Protocol................................................................................................................ 7 Planning and Conducting a 24‐hour Urine Collection Study................................................................... 9 Selecting the Sample ............................................................................................................................. 10 Matrix to Determine Sample Size ......................................................................................................... 11 Implementation Plan............................................................................................................................. 12 Applying for Ethical Approval................................................................................................................ 14 Timeframes and Data Collection Considerations.................................................................................. 15 Adapting the WHO/PAHO Protocol for Sodium Determination in 24‐hour Urine Samples................. 16 Pilot Testing........................................................................................................................................... 17
Section 3: Data Collection Guide .............................................................................................................. 18 Instructions for Field Staff, Equipment and Analytic Methods............................................................. 18 Guide to Physical Measurements ......................................................................................................... 20 Measuring Blood Pressure and Heart Rate........................................................................................... 22 Measuring Height .................................................................................................................................. 26 Measuring Weight................................................................................................................................. 27 Measuring Waist Circumference........................................................................................................... 28 Measuring Hip Circumference .............................................................................................................. 29
Section 4: Questionnaire on Knowledge, Attitudes, Behavior towards Dietary Salt ............................... 30
Section 5: Detailed Instructions for Participants in 24‐hour Urine Collection ......................................... 32
Section 6: Household Salt Collection and Iodine Determination ............................................................. 35
Section 7: Use of Spot Urine to Estimate 24‐hour Excretion of Sodium, Potassium and Iodine ............. 36
Section 8: Dataset for Health Economic Analysis ..................................................................................... 37
REFERENCES .............................................................................................................................................. 38
Section 1: Introduction Overview of the WHO/PAHO Protocol for Population Level Sodium Determination in 24-hour Urine Samples
The PAHO/WHO Protocol for Population Level Sodium Determination in 24‐hour Urine Samples is a resource to countries that want to start, contribute to and share information on dietary salt reduction initiatives. It will assist with:
• Planning and preparing the scope and environment for a survey study to estimate dietary salt intake
• Recruiting and training field staff for data collection
• Reporting and disseminating the results
While the substance of concern to health is sodium, strategies to reduce its intake are aimed at its main source in the diet – salt (sodium chloride) – used in the household at the table or in cooking and as an additive in industrially‐manufactured foods.
Primary aims • Estimate the average intake of dietary salt in men and women in the Americas in the age stratum 25 to 64 through measurement of 24 hour urinary sodium excretion.
• Provide information for designing and implementing interventions aimed at reducing population level dietary salt.
• Determine subsequent estimates of salt intake in the same population in aid of monitoring intake over time.
• Provide trends in salt intake against which to monitor and evaluate the effectiveness of interventions aimed at population level dietary salt reduction.
Additional aims • Estimate the average intake of dietary potassium through joint measurement of 24‐hour urinary potassium excretion.
• Estimate the average intake of iodine through joint measurement of 24‐hour urinary iodine excretion.
• Determine creatinine excretion.
Other possible aims
• Estimate intake of sodium, potassium and iodine in populations otherwise differentiated e.g. by ethnicity, socio economic status, geographic location, other target age groups, etc.
• Support health economic analysis by estimating salt intake for specific age strata
• Estimate fluoride excretion as well.
Continued on next page.
Section 1: Introduction 3
Intended audience
The protocol is primarily intended for principle investigator(s) of studies of sodium, potassium and iodine intake. Parts of the manual are also intended for field staff who are to interact with survey participants.
Structure The protocol has seven Sections following a sequence that helps to implement population level sodium, potassium and iodine determination in 24‐hour urine samples. Section 8 shows the full dataset required for health economic analysis of sodium reduction strategies.
There is both general information and specific instructional material that can be extracted and used for:
• Training
• Data collection
Important conversions
5g salt (NaCl) = 2,000 mg sodium = 87 mmol sodium = 87 mEq sodium
23 mg sodium = 1 mmol sodium
39.1 mg potassium= 1 mmol potassium
126.9 mg iodine = 1 mmol iodine
113.12 g creatinine = 1 mol creatinine
Continued on next page.
Section 1: Introduction 4
Rationale for Population Level Sodium Determination in 24-hour Urine Samples
Background In Latin America and the Caribbean, chronic non‐communicable disease (CNCD) is the main cause of disability and premature mortality.[1] Hypertension, a principal risk factor for a number of CNCD, in particular cardiovascular (CVD) and renal diseases, affects up to a third of adults in the Pan American Region.[2]
There is compelling evidence (epidemiological, clinical and animal‐experimental) of the direct relationship between salt consumption and blood pressure (BP) and that current levels of salt intake are a major factor increasing BP.[3,4,5] If people reduce dietary salt, whether they are normotensive or hypertensive, raised blood pressure can be avoided, hypertension better controlled, thousands of deaths from stroke, heart and renal disease prevented [6]and healthcare systems spared substantial treatment and health‐related costs. [7,8,9,10,11]
PAHO is spearheading an initiative, guided by an Experts Group, to reduce dietary salt intake at the population level across the Americas. Its first product, a Policy Statement, has the goal – reduce salt intake to the internationally recommended target of <5g per adult per day by 2020.[12]
Rationale for surveillance of salt intake
Fundamental to the PAHO initiative is for Member States to estimate a baseline of population level dietary salt intake, and from there, to monitor trends in intake and the effectiveness of any interventions within and betweeen populations.
The best estimate of the population profile distribution and average level of dietary salt intake is provided by measuring 24‐hour urinary sodium excretion in a representative sample of individuals. [13]
Rationale for complementary food consumption information
To guide policy development and associated population level interventions aimed at reducing dietary salt, not only is information needed on salt intake but also on the main food sources of salt in the diet and the typical frequency of their consumption. There are several methods available to collect information on food consumption, among them 24‐hour food recall. The INTERMAP Study is an international, cross‐sectional, epidemiologic study where in‐depth 24‐hour dietary recall was used to identify foods that account for most dietary sodium intake. [14]
While the instruments that collect food consumption information are typically very detailed in terms of the food products listed in order for survey participants to be able to select the specific products they consume, it is recommended to group the products into a smaller number of broad categories. They become the basis for raising awareness among consumers as to the food categories that contribute the most salt to the diet, and are also the basis for policies and interventions with industry that include target setting per category. If a category is too wide and varied, it is difficult to set a target; if there are too many categories, target setting and monitoring can become unmanageable. There are a number of examples of food categories to consider, among them the 12 food categories used in the Salt Campaign of the European Commission [15] and the 19 basic product groups and 8 non‐basic groups in the Choices Programme [16].
Section 1: Introduction 5

Section 1: Introduction 6
Rationale for joint surveillance of potassium
Low dietary potassium is associated with hypertension [17] and stroke [18] and supplementing potassium to hypertensive individuals lowers blood pressure [19] and reduces the use of anti‐hypertensive medications [20]. Increased potassium intake also reduces the hypertensive response to high dietary sodium. Some populations are deficient in dietary potassium if they rely on processed foods, however there is a deficiency in data on intake of potassium in most populations. Estimating potassium and sodium intake at the same time can inform the design of potential population interventions to improve both sodium and potassium intakes.
Rationale for joint surveillance of iodine
To address the concern regarding the possible detrimental effect of dietary salt reduction on programs to prevent Iodine Deficiency Disorder (IDD) that rely on salt as a carrier of iodine, it is recommended that iodine intake be assessed along with salt. The inclusion of this variable in studies of salt intake that use 24‐hour urine samples would in fact benefit IDD‐prevention programs. The method provides the most accurate and appropriate indicator of whether populations, regardless of age, gender or climatic environment, are receiving the recommended amounts of this nutrient, which, judging from current salt intake and salt iodization levels, may be insufficient, sufficient and even excessive. [21]
Use of spot‐ or timed urine testing
Collecting 24‐hour urine samples has been considered difficult, and therefore the use of the spot‐urine method has been proposed as an alternative. To estimate intake of sodium, potassium and iodine, the use of spot urine is not recommended unless the following conditions are met:
• A baseline estimate of these analites has been conducted using the recommended methods for 24‐hour urine assessment.
• A calibration study for use of spot urine has been done in the specific population of interest.
Once the above conditions are met, ‘timed’ urine collections (over three or more hours with provision of water) are preferred over non‐timed (‘spot’) samples as they reduce the errors due to residual urine in the bladder.
Even if the above conditions are met, the results are likely to be unreliable especially for population subgroups or time trends. See Section 7 for further information and advice on calibration.
Continued on next page.

Section 2: Field Protocol Overview of the Field Protocol
Components The protocol for Sodium Determination in 24‐Hour Urine Samples can stand‐alone or be an additional module to an existing CNCD risk factor instrument (e.g. PanAmerican STEPS – the Pan American Version of the WHO STEPwise Approach to Risk‐Factor Surveillance [22]). If stand‐alone, the following are the required components of the protocol:
Description Purpose
1 Questionnaire on demographic and behavioral information
To obtain data on:
• Socio‐demographic information
• Tobacco and alcohol use
• Dietary habits
• Physical activity
• Knowledge, attitudes and behavior towards dietary salt
2 Questionnaire on personal medical history, including drug treatment
To determine the proportion of adults that:
• Currently suffer from CNCD, and their complications
• Are under daily long term medical treatment for any condition
3 Physical measurements with simple methods
To determine the proportion of adults who:
• Are overweight and obese, and
• Have high blood pressure
4 24‐hour urine sample collection
To determine sodium, potassium and iodine excretion.
To determine creatinine excretion.
5 A 50‐100 g sample of household salt
To determine the iodine content of household salt.
If performed as part of another risk factor study that collects the data described in components 1 to 3, only components 4 and 5 of the protocol are required. The data elements for components 1 to 3 are provided below. They were developed with reference to the framework for risk factor surveillance in PanAmerican STEPS and an instrument from the University of Warwick WHO Collaborating Centre for Nutrition. The WHO/PAHO Expert Group for Cardiovascular Disease Prevention through Population‐wide Dietary Salt Reduction developed the questions on knowledge, attitudes and behavior towards dietary salt.
Continued on next page.
Section 2: Field Protocol 7

Core and expanded data
Each of the first three components of the protocol has a minimum core of required data and a set of expanded desirable data for collection, shown below. Whether core or core plus expanded data are collected depends on what can realistically be accomplished in each country setting (financially, logistically and in terms of human and clinical resources).
Core Expanded
1 • Basic demographic information including:
o Country and region of origin (if relevant)
o Age o Sex
• Tobacco use
• Alcohol consumption
• Physical activity
• Sedentary behavior
• Fruit and vegetable consumption
• Knowledge, attitudes and behavior towards dietary salt
• Expanded demographic information including:
o Ethnicity o Highest level of
education o Employment o Household income
• History of tobacco use
• Patterns of alcohol drinking
• Oil and fat consumption
• History of raised blood pressure
• History of diabetes
2 • Current drug treatment used
• Personal medical history
• Family medical history
3 • Height (cm) and weight (kg)
• Waist circumference (cm)
• Systolic and diastolic blood pressures (mmHg) and heart rate (bpm)
• Hip circumference (cm)
Continued on next page.
Section 2: Field Protocol 8

Planning and Conducting a 24-hour Urine Collection Study
Below are the recommended tasks to plan and conduct a 24‐hour urine collection study. The timeframes will be situation specific, to be estimated to support the planning process.
Intended audience
This information is primarily intended for those fulfilling the following roles:
• Site coordinator
• Coordinating committee
Tasks and timeframes
Tasks Timeframe
Develop implementation plan
Identify scope of study
Gain ethical approval
Schedule data collection
Adapting and translating the Field Protocol Questionnaire
Pilot test
Continued on next page.
Section 2: Field Protocol 9

Section 2: Field Protocol 10
Selecting the Sample
Sample population
The sample size is determined by precision, variability within and between subjects, statistical power, play of chance, representativeness, feasibility and cost. Below is a matrix showing the relationship between sample size, precision in the difference in excreted sodium to be detected and variations in measurements. In general, to detect approximately 1 g reduction in salt intake over time using 24‐hour urinary sodium excretion, with a standard deviation of 75 mmol/day (alpha = 0.05, power = 0.80), a minimum sample of 120 individuals per age and sex stratum is recommended. To account for attrition (e.g. non participation, incomplete collection or implausible values), which may be as high as 50%, up to 240 people per age and sex stratum should be invited to participate.
Requirements for sample selection
• Random or otherwise probabilistic sample
• Sample selected using culturally appropriate methods
• Stratification by age group and sex with a minimum of four groups i.e. men and women each in two age groups 25‐44 and 45‐64 (or men and women each in four age groups 25‐34, 35‐44, 45‐54, 55‐64)
• If a sentinel site is selected, must be justifiable and feasible for long term monitoring
• Age and sex of respondents and non‐respondents are noted
• If sodium excretion data from 24‐hour urine samples are to inform health economics analysis of changes in sodium intake, see the table below for the full dataset required.
Exclusion criteria
• People unable to provide informed consent
• Those with known history of heart or kidney failure, stroke, liver disease
• Those who recently began therapy with diuretics (less than two weeks)
• Any other conditions that would make 24‐hour urine collection difficult
If pregnant women are included in the sample, their results must be analyzed separately from those of other adult participants.
Continued on next page.

Matrix to Determine Sample Size
Minimum difference in sodium excretion to be detected
δ (mmol/day)
Standard deviation s (SD)
Sample size n (for each age stratum)
10 10 16
10 15 35
10 20 63
10 25 98
10 30 141
10 35 192
10 40 251
10 45 318
10 50 392
10 55 475
10 60 565
10 65 663
10 70 769
10 75 883
10 80 1005
20 10 4
20 15 9
20 20 16
20 25 25
20 30 35
20 35 48
20 40 63
20 45 79
20 50 98
20 55 119
20 60 141
20 65 166
20 70 192
20 75 221
20 80 251
30 10 2
30 15 4
30 20 7
30 25 11
30 30 16
30 35 21
30 40 28
30 45 35
30 50 44
30 55 53
30 60 63
30 65 74
30 70 85
30 75 98
30 80 112
40 10 1
40 15 2
40 20 4
40 25 6
40 30 9
40 35 12
40 40 16
40 45 20
40 50 25
40 55 30
40 60 35
40 65 41
40 70 48
40 75 55
40 80 63
50 10 1
50 15 1
50 20 3
50 25 4
50 30 6
50 35 8
50 40 10
50 45 13
50 50 16
50 55 19
50 60 23
50 65 27
50 70 31
50 75 35
50 80 40
where α = 0.05 and (1‐β)= 0.80, 1.96 and 0.8416 respectively
Δ = δ/s
where Δ = standardized
difference i.e. (μ1 ‐ μ2) / s
δ = clinically important difference to be detected
s = standard deviation
Section 2: Field Protocol 11

Implementation Plan
A detailed implementation plan for the 24‐hour Urine Sample study is needed for all stakeholders involved in the surveillance process.
Purpose The implementation plan is to:
• Set out the scope of the surveillance and desired goals
• Identify required resources
• Lay out an action plan
• Develop a communication strategy
• Provide a budget as the basis for funding
Core parts of the implementation plan
Below are the core parts needed for the implementation plan. Some have references to Sections within this document where there is information to assist with preparation.
Core part Detail References
Executive summary High level summary of main points including:
• Current situation
• Goals and objectives
• Scope
• Resources
• Budget
Current situation Specify:
• Whether the study will determine a baseline of sodium intake or assess change in intake
o If to assess change in intake, reference the baseline study
• If a risk factor survey has already been conducted.
• If there is an existing infrastructure (human capacity, equipment, other studies) on which the 24‐hour urine sample collection could be built.
Section 1
Continued on next page.
Section 2: Field Protocol 12

Core part Detail References
Goals and objectives • Identify planned goals and use of the information collected to:
o Describe the current level of dietary salt intake in populations (if available)
o Track the direction and magnitude of trends in salt consumption
o Plan and evaluate a health promotion or preventive campaign
o Collect data from which to predict likely future demands for health services
• Specify objectives that support gathering ‘essential’ information only.
• Describe broad timeframes.
Section 1
Scope • Specify the scope of surveillance to be conducted (coverage of core and expanded data)
• Specify if future sodium determination surveillance can be assured
Section 2
Sampling method • Identify the sample size and sample frame that will be used.
• Identify geographical coverage
• Describe sample design
Section 2
Resources • Specify the resources in terms of all personnel and equipment required for sodium determination in 24‐hour urine sampling study.
• Describe resources that have been committed or expected, including support from WHO/PAHO.
• Specify resources from other organizations.
Action plan Prepare a chart of the main tasks with estimated start date and timeframe for completion of each.
Section 2
Communication strategy
Specify the methods for informing and involving all stakeholders relevant to the sodium determination project, including community leaders, members of the public, and media.
Budget Provide a detailed budget that includes:
• Total funds required for each year planned to implement all sodium determination activities as identified in the scope (including future surveys).
• Sources of funding.
• Funding gaps.
Section 2: Field Protocol 13

Applying for Ethical Approval
Studies that are to use the WHO/PAHO Protocol for Sodium Determination in 24‐hour Urine Samples must undergo technical and ethical review and approval. This is to ensure that the study:
• Is conducted in a technically and ethically sound manner;
• Recognizes and protects the rights of participants; and
• Ensures wide access to the information collected in the study.
Process Usually, ethical approval should be sought by submission of a proposal and application to a national ethics review committee or other equivalent body. However, if such a body is not institutionalized, it is recommended that an application for ethical review be prepared and submitted through an ad hoc local mechanism within the Ministry of Health.
Informed consent
The informed consent must be obtained from every survey participant before conducting any interviews or collection of any samples.
Making a submission
Use the existing templates for proposals supplied by the appropriate ethics committee or equivalent body. If such a template does not exist, identify and contact the relevant bodies, seek guidance on rules, the submission process and any procedures to follow.
Continued on next page.
Section 2: Field Protocol 14

Timeframes and Data Collection Considerations
Data collection should be carefully planned to take place over a defined period of time and during appropriate seasons.
General timeframes
The following table shows the recommended phases of a sodium determination study. Timeframes are situation specific:
Phase Timeframes
Planning and scoping
Recruiting and training
Data collection
Data analysis and reporting
Data collection Some key factors to consider when identifying an appropriate time to conduct the study:
Factors to consider Guidelines
Seasons • Confine the study period to one season to avoid dietary changes
• Avoid festive seasons (E.g. Ramadan, Christmas, Holy Week, and other national or religious holidays)
• Avoid seasons when food is in unusually short supply.
Calendar year Confine the study to one calendar year
Major events Avoid data collection during periods prior to local, regional, or national elections to avoid confusion with political campaigns.
Civil unrest, turmoil, famine, etc.
Avoid conducting a study at any time when pressing matters occupy the minds and lives of the population.
Collection timeframe Keep the timeframe as close as possible (within reason) to the recommended timeframe.
Data collection locations
It is recommended that all components of the study be conducted/administered in the household setting. Ideally participants/respondents are to collect all their urine samples at home and otherwise, they are to bring home any urine passed away from home. The total urine passed in the 24‐hour period is to be picked up at the household within one day of the 24‐hour collection period. It is recommended that if food consumption information is collected, this is done during the second visit to the household.
Continued on next page.
Section 2: Field Protocol 15
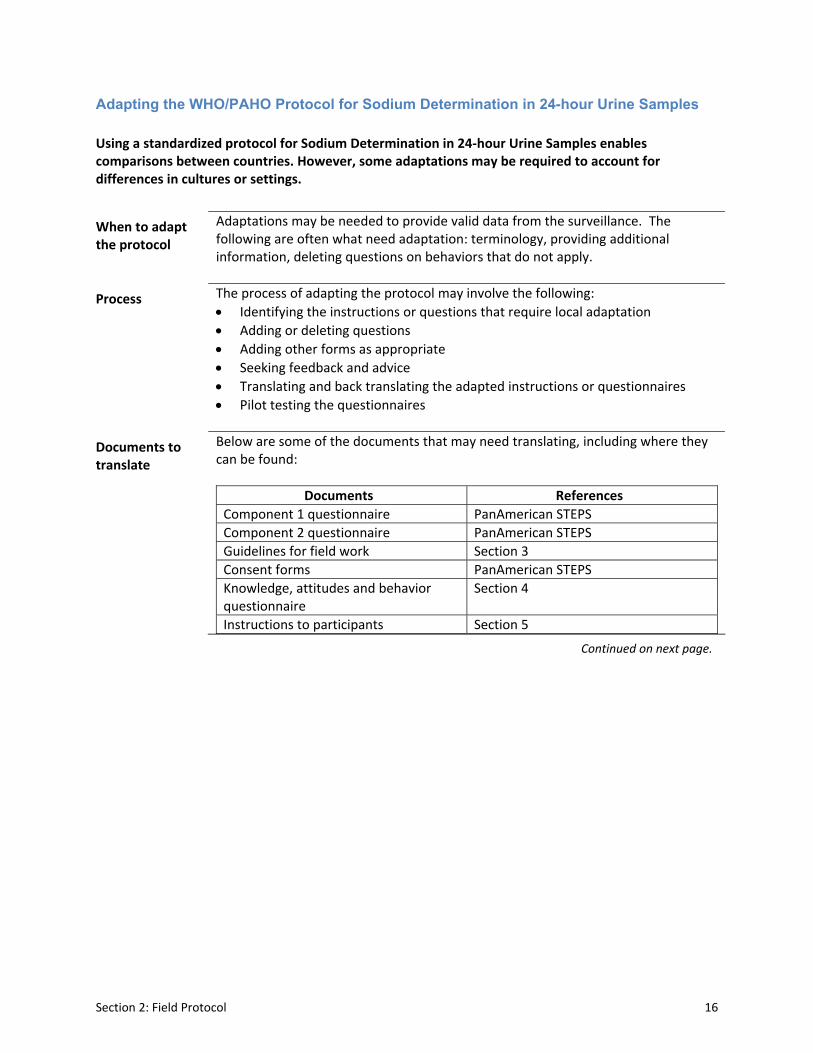
Adapting the WHO/PAHO Protocol for Sodium Determination in 24-hour Urine Samples
Using a standardized protocol for Sodium Determination in 24‐hour Urine Samples enables comparisons between countries. However, some adaptations may be required to account for differences in cultures or settings.
When to adapt the protocol
Adaptations may be needed to provide valid data from the surveillance. The following are often what need adaptation: terminology, providing additional information, deleting questions on behaviors that do not apply.
Process The process of adapting the protocol may involve the following:
• Identifying the instructions or questions that require local adaptation
• Adding or deleting questions
• Adding other forms as appropriate
• Seeking feedback and advice
• Translating and back translating the adapted instructions or questionnaires
• Pilot testing the questionnaires
Documents to translate
Below are some of the documents that may need translating, including where they can be found:
Documents References
Component 1 questionnaire PanAmerican STEPS
Component 2 questionnaire PanAmerican STEPS
Guidelines for field work Section 3
Consent forms PanAmerican STEPS
Knowledge, attitudes and behavior questionnaire
Section 4
Instructions to participants Section 5
Continued on next page.
Section 2: Field Protocol 16

Section 2: Field Protocol 17
Pilot Testing
A pilot test of the entire data collection process must be conducted among a limited number of people with a broad range of backgrounds prior to implementing the actual full study. Pilots should involve all aspects of the survey including:
• Approaching potential participants
• Seeking and obtaining informed consents
• Making arrangements/appointments for second visits after the participant‐led 24‐hour urine sample collection
• Site preparation and set‐up
• Collecting all data needed
• Identifying participants who may need a follow‐up
• Basic analysis
Test group Identify and approach willing participants to be part of the pilot test. The test group should include the following:
• Both men and women
• Cover the age range 25‐64
• More than one ethnic group (if appropriate)
• Participants with different levels of education
• Participants from a range of socio‐economic groups
• Participants from distinctly different regions in the same country
Test environment
Where possible conduct the pilot test under the field conditions expected for the final full study i.e. the household setting.
Timeframe When planning the pilot test, allow sufficient time for adjustments to be made prior to starting full data collection.
Continued on next page.

Section 3: Data Collection Guide 18
Section 3: Data Collection Guide
Guidelines for data collection for components 1 through 3 of the protocol can be obtained from the PanAmerican STEPS Manual, Part 3, Sections 1 through 4, except for the core questions on knowledge, attitudes and behavior towards dietary salt, which are in Section 4 of this manual.
The information below serves the field staff/survey team involved in components 4 and 5 of the protocol for 24‐hour urine sample collection.
Instructions for Field Staff, Equipment and Analytic Methods
Instructing participants
Field staff must explain the collection protocol, obtain informed consent and provide the record sheet on which participants note the start and finish times of their 24‐hour urine collection, any missed urine collections, and any medication taken during the collection. In the morning of the start of the 24‐hour period, the participant must void the bladder and note the time. This “first‐pass urine” is discarded. All urine passed thereafter is collected in the container provided, including the first urine of the following morning, with the final time recorded. Respondents are given detailed written instructions (see Section 5). At the time of the first visit to the household, field staff must inform the participant of the second visit. The second visit must be made within one day of the completion of the 24‐hour collection period. A sample of household salt is taken during the second visit. If food consumption information is required, it is collected during the second visit.
Equipment supplied to participants
• A 5 liter capacity screw cap container to store the collected urine
• A 1 litre container with a wide opening into which urine is voided, with or without the use of a funnel
• Optional 2 liter capacity screw cap container for temporal collections of urine made away from the home
• Funnel for women to be used during urine collection, kept inside a re‐sealable plastic bag when not used
• Plastic carrier bags for transporting the equipment away from home
• An aide‐memoire to help participants remember to collect their urine e.g. a safety pin to pin the under‐ and outer garments together during the period of the collection as a reminder that the urine about to be passed should be collected
The use of PABA to assess completeness of the urine collection is not recommended. It requires that each participant take a PABA pill three days prior to the start of collection thereby increasing the risks of non‐compliance and attrition. In addition, laboratory facilities for the testing of PABA in the urine are limited and where they exist, will increase the costs of the study.
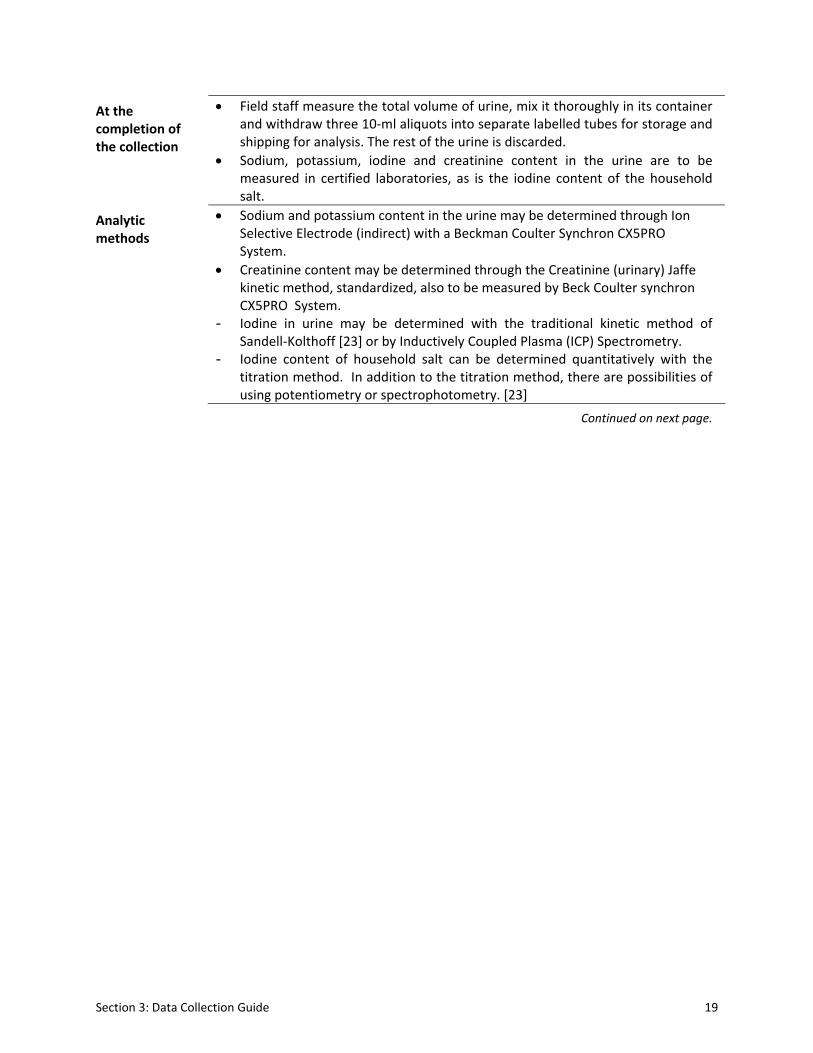
At the completion of the collection
• Field staff measure the total volume of urine, mix it thoroughly in its container and withdraw three 10‐ml aliquots into separate labelled tubes for storage and shipping for analysis. The rest of the urine is discarded.
• Sodium, potassium, iodine and creatinine content in the urine are to be measured in certified laboratories, as is the iodine content of the household salt.
Analytic methods
• Sodium and potassium content in the urine may be determined through Ion Selective Electrode (indirect) with a Beckman Coulter Synchron CX5PRO System.
• Creatinine content may be determined through the Creatinine (urinary) Jaffe kinetic method, standardized, also to be measured by Beck Coulter synchron CX5PRO System.
- Iodine in urine may be determined with the traditional kinetic method of Sandell‐Kolthoff [23] or by Inductively Coupled Plasma (ICP) Spectrometry.
- Iodine content of household salt can be determined quantitatively with the titration method. In addition to the titration method, there are possibilities of using potentiometry or spectrophotometry. [23]
Continued on next page.
Section 3: Data Collection Guide 19
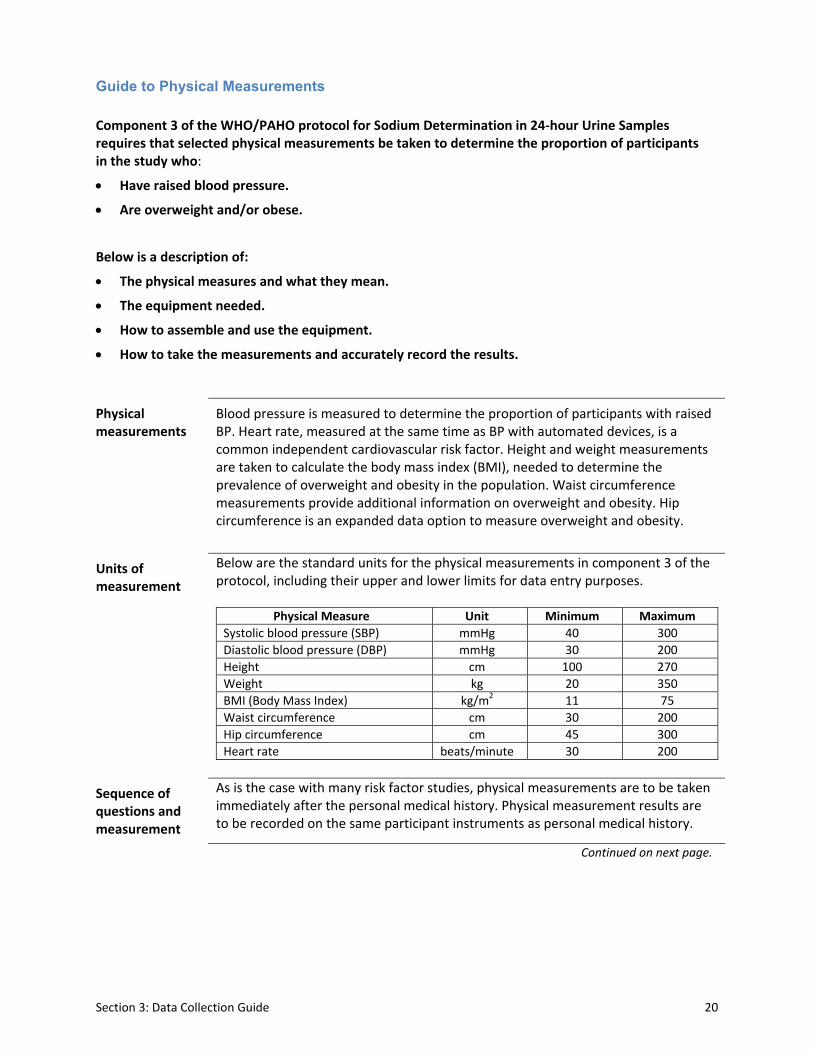
Guide to Physical Measurements
Component 3 of the WHO/PAHO protocol for Sodium Determination in 24‐hour Urine Samples requires that selected physical measurements be taken to determine the proportion of participants in the study who:
• Have raised blood pressure.
• Are overweight and/or obese.
Below is a description of:
• The physical measures and what they mean.
• The equipment needed.
• How to assemble and use the equipment.
• How to take the measurements and accurately record the results.
Physical measurements
Blood pressure is measured to determine the proportion of participants with raised BP. Heart rate, measured at the same time as BP with automated devices, is a common independent cardiovascular risk factor. Height and weight measurements are taken to calculate the body mass index (BMI), needed to determine the prevalence of overweight and obesity in the population. Waist circumference measurements provide additional information on overweight and obesity. Hip circumference is an expanded data option to measure overweight and obesity.
Units of measurement
Below are the standard units for the physical measurements in component 3 of the protocol, including their upper and lower limits for data entry purposes.
Physical Measure Unit Minimum Maximum
Systolic blood pressure (SBP) mmHg 40 300
Diastolic blood pressure (DBP) mmHg 30 200
Height cm 100 270
Weight kg 20 350
BMI (Body Mass Index) kg/m2 11 75
Waist circumference cm 30 200
Hip circumference cm 45 300
Heart rate beats/minute 30 200
Sequence of questions and measurement
As is the case with many risk factor studies, physical measurements are to be taken immediately after the personal medical history. Physical measurement results are to be recorded on the same participant instruments as personal medical history.
Continued on next page.
Section 3: Data Collection Guide 20
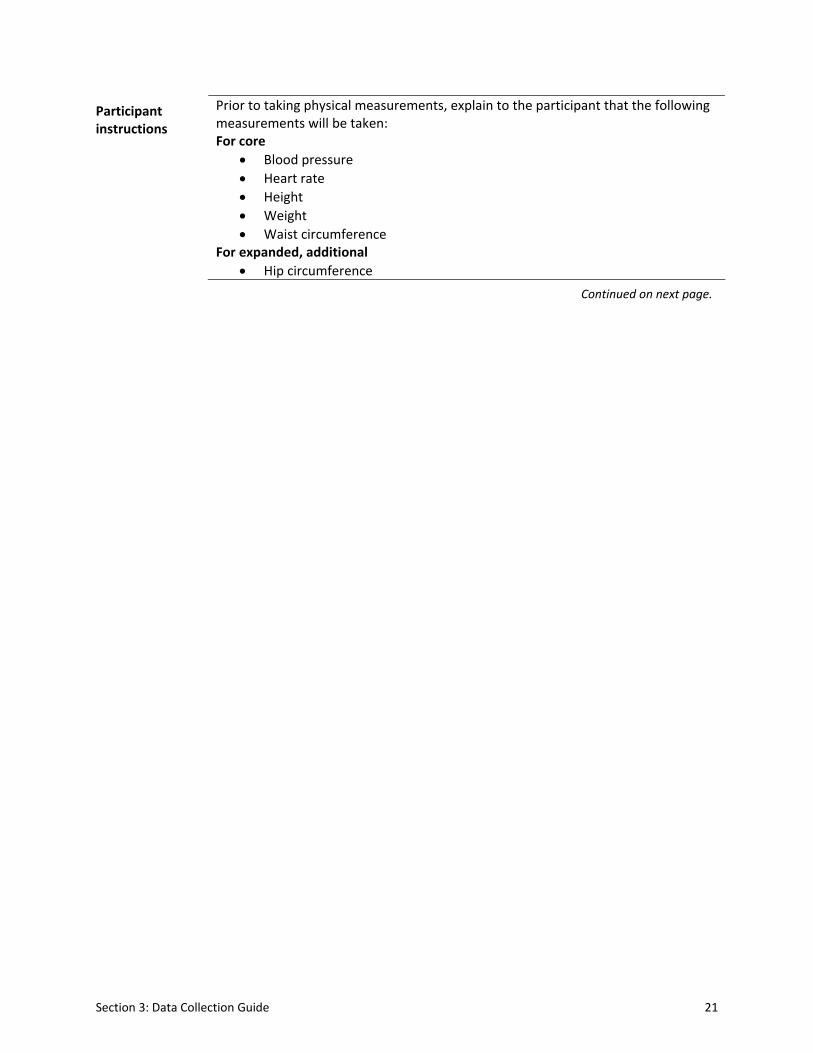
Participant instructions
Prior to taking physical measurements, explain to the participant that the following measurements will be taken: For core
• Blood pressure
• Heart rate
• Height
• Weight
• Waist circumference For expanded, additional
• Hip circumference
Continued on next page.
Section 3: Data Collection Guide 21

Measuring Blood Pressure and Heart Rate
Equipment needed
Validated digital automatic blood pressure monitor e.g. OMRON. For the choice of validated blood pressure measuring devices see http://www.bhsoc.org/bp_monitors/automatic.stm.
• Appropriate size cuffs
Preparing the participant
Prior to measuring blood pressure, ask the participant to sit in a quiet comfortable place for at least 5 minutes with back support and his/her legs uncrossed. If the questions in components 1 and 2, on behavior and personal medical history, have been asked just before the physical measurements are to be taken, the participant should rest for at least 5 minutes before blood pressure measurement is started. Do not talk to the participant whilst BP is being taken.
Three measurements
WHO recommends taking three blood pressure measurements. During the data analysis, the mean of the second and third readings is calculated. The participant must rest for one minute between each of the readings. The measurement and recording of heart rate should be done three times along with the measurement and recording of blood pressure. Heart rate and blood pressure results are displayed simultaneously with automated equipment.
Recording the blood pressure measurements
The following steps are required:
• after each of the three measurements, record the result in the participant’s instrument;
• after all three readings are taken, double‐check that all three results are correctly recorded in the instrument;
• inform the participant of their blood pressure readings only after the whole process is completed.
OMRON procedure
The instructions below apply to the use of an OMRON blood pressure monitor. However, more detailed operating instructions are included with the device and should be reviewed before taking any blood pressure measurements. Note that if a different digital automatic blood pressure monitor is used, instructions should be read carefully.
Continued on next page.
Section 3: Data Collection Guide 22

Applying the OMRON cuff
Follow the steps below to select an appropriate size of cuff and apply it:
Step Action
1 Place the left arm* of the participant on the table with the palm facing upward.
2 Remove or roll up clothing on the arm.
3 Select the appropriate cuff size for the participant using the following table:
Mid Arm Circumference (cm) Cuff Size
17‐22 Small (S)
22‐32 Medium (M)
>32 Large (L)
If the cuff is the correct size, the marker at the end of the cuff will fit between two other markers in the mid section of the cuff. The cuff is the wrong size if the end is outside the markers. It is advisable to select the larger size cuff if there is a question of which size is best. Some Omron cuffs are not marked in which case they must be labeled with markers.** Otherwise, use the mid arm circumference of each arm to select the correct cuff size.
4 Position the cuff above the elbow and aligning the mark ART on the cuff with the brachial artery.
5 Wrap the cuff snugly onto the arm and securely fasten with the Velcro. Note: The lower edge of the cuff should be placed 1.2 to 2.5 cm above the inside of the elbow joint.
6 Keep the level of the cuff at the same level as the heart during measurement.
*If the right arm is used, indicate this in the right hand side margin of the participant’s Instrument. **Even if cuffs are marked by the manufacturer to indicate the acceptable range of arm circumference for the size of cuff, the markings may not agree with the current recommended range and need to be checked and possibly remarked. [24] Marking can be performed easily using a ruler and permanent marker. The ideal arm circumference for a cuff is 2.5 times the cuff’s bladder width. Cuffs can be used on arms that have a circumference ±4 cm of ‘ideal’. To mark or remark the cuff, start the measurement at the end that contains the bladder. Permanently mark the cuff at the ideal arm circumference then draw a line across the cuff at 4 cm on either side of the ideal (ie draw two lines). The cuff is the right size if when wrapped around the mid arm, the end is between the two marked lines.
Continued on next page.
Section 3: Data Collection Guide 23

Taking the BP measurement with an OMRON
Follow the instructions below to take the blood pressure measurements:
Step Action
1 Switch the monitor on (dark purple button) and press START (light purple button).
2 The monitor will start measuring when it detects the pulse and the “heart” symbol will begin to flash. The systolic and diastolic blood pressure readings should be displayed within a few moments (systolic above and diastolic below). The heart rate will also be displayed.
3 Record the reading in the participant’s instrument.
4 Switch the monitor off, but leave the cuff in place.
5 Wait one minute, then repeat steps 1‐4 two more times.
6 Inform the participant of the blood pressure readings only after the whole process is completed.
When to use a sphygmomano‐meter
The sphygmomanometer is generally not recommended, but may be used in the following circumstances:
• the OMRON is not functioning
• the OMRON display shows multiple errors;
• to cross check OMROM blood pressure readings in various clinical states such as irregular pulse, peripheral circulatory disturbance, extreme hypotension;
• when systolic BP is >200 mmHg (appropriate measurement of systolic BP requires inflating the cuff to a pressure of 40 mmHg above the systolic BP; OMRON maximum inflation pressure seldom exceeds 240 mmHg);
• for calibration of the OMRON Monitor.
Continued on next page.
Section 3: Data Collection Guide 24
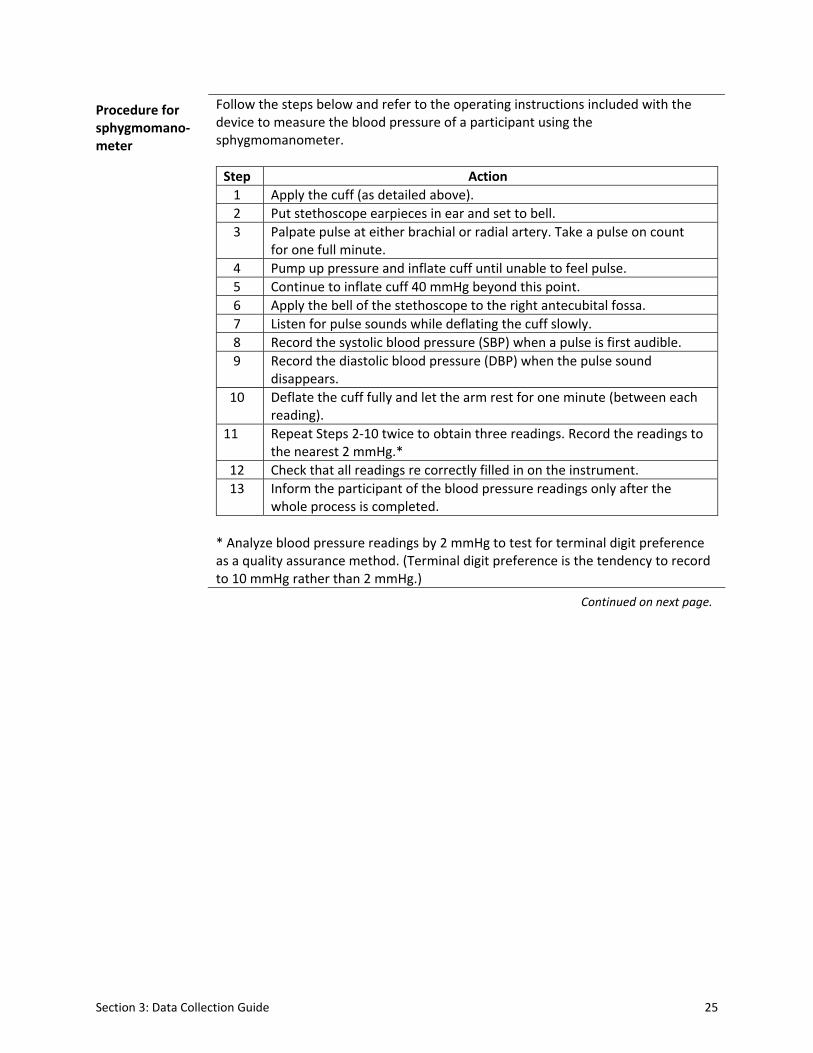
Procedure for sphygmomano‐meter
Follow the steps below and refer to the operating instructions included with the device to measure the blood pressure of a participant using the sphygmomanometer.
Step Action
1 Apply the cuff (as detailed above).
2 Put stethoscope earpieces in ear and set to bell.
3 Palpate pulse at either brachial or radial artery. Take a pulse on count for one full minute.
4 Pump up pressure and inflate cuff until unable to feel pulse.
5 Continue to inflate cuff 40 mmHg beyond this point.
6 Apply the bell of the stethoscope to the right antecubital fossa.
7 Listen for pulse sounds while deflating the cuff slowly.
8 Record the systolic blood pressure (SBP) when a pulse is first audible.
9 Record the diastolic blood pressure (DBP) when the pulse sound disappears.
10 Deflate the cuff fully and let the arm rest for one minute (between each reading).
11 Repeat Steps 2‐10 twice to obtain three readings. Record the readings to the nearest 2 mmHg.*
12 Check that all readings re correctly filled in on the instrument.
13 Inform the participant of the blood pressure readings only after the whole process is completed.
* Analyze blood pressure readings by 2 mmHg to test for terminal digit preference as a quality assurance method. (Terminal digit preference is the tendency to record to 10 mmHg rather than 2 mmHg.)
Continued on next page.
Section 3: Data Collection Guide 25

Measuring Height
Equipment needed
Portable height/length measuring board.
Assembling the measuring board
Follow the steps below to assemble the measuring board:
Step Action
1 Separate the pieces of board (usually 3 pieces) by unscrewing the knot at the back.
2 Assemble the pieces by attaching each one on top of the other in the correct order.
3 Lock the latches in the back.
4 Position the board on a firm surface against a wall.
Measuring height
Follow the steps below to measure the height of a participant:
Step Action
1 Ask the participant to remove their:
• footwear (shoes, slippers, sandals, etc)
• head gear (hat, cap, hair bows, comb, ribbons, etc.) Note: If it would be insensitive to seek removal of a scarf or veil, the measurement may be taken over light fabric.
2 Ask the participant to stand on the board facing you.
3 Ask the participant to stand with:
• feet together
• heels against the back board
• knees straight
4 Ask the participant to look straight ahead and not tilt their head up.
5 Make sure eyes are the same level as the ears.
6 Move the measuring arm gently down onto the head of the participant and ask the participant to breathe in and stand tall.
7 Read the height in centimeters at the exact point.
8 Ask the participant to step away from the measuring board.
9 Record the height measurement in centimeters in the participant’s Instrument.
Continued on next page.
Section 3: Data Collection Guide 26
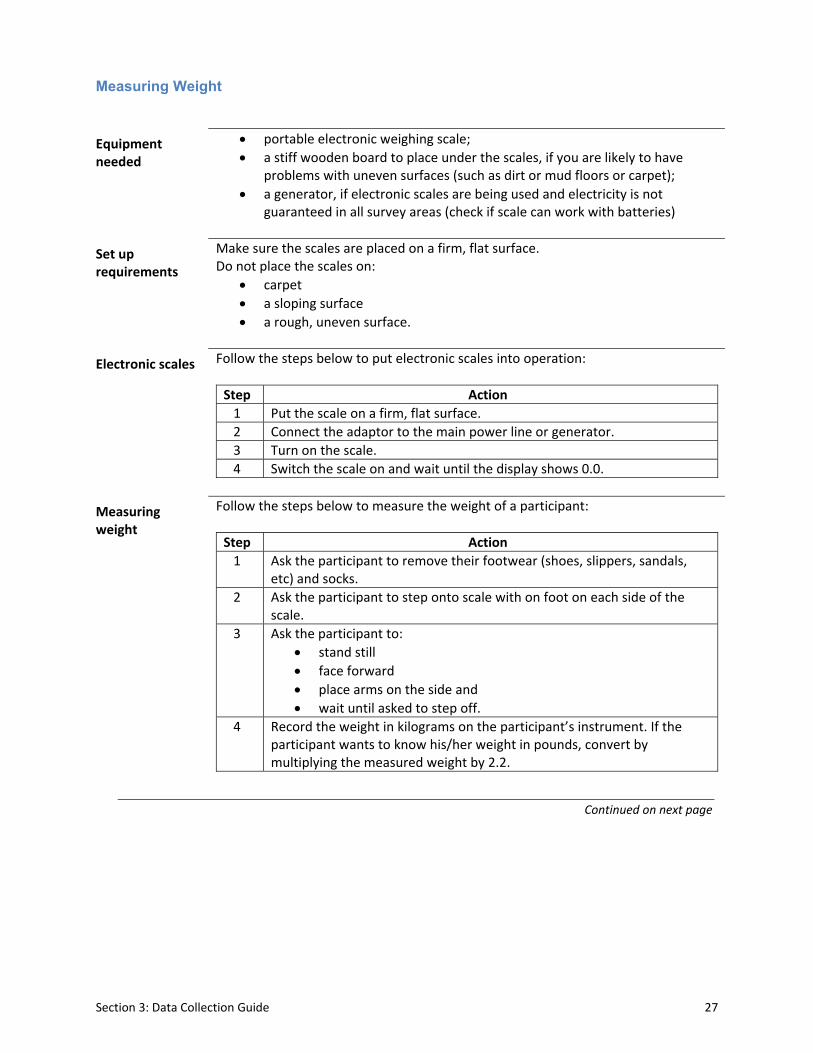
Measuring Weight
Equipment needed
• portable electronic weighing scale;
• a stiff wooden board to place under the scales, if you are likely to have problems with uneven surfaces (such as dirt or mud floors or carpet);
• a generator, if electronic scales are being used and electricity is not guaranteed in all survey areas (check if scale can work with batteries)
Set up requirements
Make sure the scales are placed on a firm, flat surface. Do not place the scales on:
• carpet
• a sloping surface
• a rough, uneven surface.
Electronic scales Follow the steps below to put electronic scales into operation:
Step Action
1 Put the scale on a firm, flat surface.
2 Connect the adaptor to the main power line or generator.
3 Turn on the scale.
4 Switch the scale on and wait until the display shows 0.0.
Measuring weight
Follow the steps below to measure the weight of a participant:
Step Action
1 Ask the participant to remove their footwear (shoes, slippers, sandals, etc) and socks.
2 Ask the participant to step onto scale with on foot on each side of the scale.
3 Ask the participant to:
• stand still
• face forward
• place arms on the side and
• wait until asked to step off.
4 Record the weight in kilograms on the participant’s instrument. If the participant wants to know his/her weight in pounds, convert by multiplying the measured weight by 2.2.
Continued on next page
Section 3: Data Collection Guide 27

Measuring Waist Circumference
Equipment needed
• constant tension tape (for example, Figure Finder Tape Measure)
• pen
• chair or coat stand on which the participant will place their clothes.
Privacy A private area is necessary for this measurement. This could be a separate room, or an area that has been screened off from other people within the household.
Preparing the participant
This measurement should be taken without clothing, that is, directly over the skin. If it is not possible, the measurement maybe taken over light clothing. It must not be taken over thick or bulky clothing. This type of clothing must be removed.
How to take the measurement
This measurement should be taken:
• at the end of a normal expiration;
• with the arms relaxed at the sides;
• at the midpoint between the lower margin of the last palpable rib and the top of the iliac crest (hip bone).
Measuring waist circumference
Follow the steps below to measure the waist circumference of a participant:
Step Action
1 Standing to the side of the participant, locate the last palpable rib and the top to the hip bone. You may ask the participant to assist you in locating these points on their body.
2 Ask the participant to wrap the tension tape around themselves and then position the tape at the midpoint of the last palpable rib and the top of the hip bone, making sure to wrap the tape over the same spot on the opposite side. Note: Check that the tape is horizontal across the back and front of the participant and as parallel with the floor as possible.
3 Ask the participant to:
• stand with their feet together with weight evenly distributed across both feet;
• hold the arms in a relaxed position at the sides;
• breathe normally for a few breaths, then make a normal expiration.
4 Measure waist circumference and read the measurement at the level of the tape to the nearest 0.1 cm, making sure to keep the measuring tape snug but not tight enough to cause compression of the skin.
5 Record the measurement on the participant’s Instrument.
Continued on next page.
Section 3: Data Collection Guide 28

Section 3: Data Collection Guide 29
Measuring Hip Circumference
Equipment needed
• constant tension tape (for example, Figure Finder Tape Measure)
• pen
• chair or coat stand on which the participant will place their clothes.
Privacy A private area is necessary for this measurement. This could be a separate room, or an area that has been screened off from other people within the household. Hip measurements are taken immediately after waist circumferences.
Preparing the participant
This measurement should be taken without clothing, that is, directly over the skin. If it is not possible, the measurement maybe taken over light clothing. It must not be taken over thick or bulky clothing. This type of clothing must be removed
How to take the measurement
This measurement should be taken:
• with the arms relaxed at the sides
• at the maximum circumference over the buttocks.
Measuring hip circumference
Follow the steps below to measure the hip circumference of a participant:
Step Action
1 Stand to the side of the participant, and ask them to help wrap the tape around themselves.
2 Position the measuring tape around the maximum circumference of the buttocks.
3 Ask the participant to:
• stand with their feet together with weight evenly distributed over both feet;
• hold their arms relaxed at the sides.
4 Check that the tape position is horizontal all around the body and snug without constricting.
5 Record the measurement on the participant’s Instrument. Note: measure only once and record.
Continued on next page.

Section 4: Questionnaire on Knowledge, Attitudes, Behavior toward Dietary Salt
1. Do you add salt to food at the table?
a) never
b) rarely
c) sometimes
d) often
e) always
2. In the food you eat at home salt is added in cooking
a) never
b) rarely
c) sometimes
d) often
e) always
3. How much salt do you think you consume? (READ LIST)
a) Far too much
b) Too much
c) Just the right amount
d) Too little
e) Far too little
f) Don’t Know
g) Refused
4. Do you think that a high salt diet could cause a serious health problem?
a) Yes
b) No
c) Don’t know
d) Refused
5. If Yes in 4 above, what sort of problem?
a) high blood pressure
b) osteoporosis
c) stomach cancer
Section 4: Questionnaire 30

Section 4: Questionnaire 31
d) kidney stones
e) none of the above
f) all of the above
g) don’t know
h) refused
6. How important to you is lowering the salt/sodium in your diet?
a) Not at all important
b) Somewhat important
c) Very important
7. Do you do anything on a regular basis to control your salt or sodium intake?
a) Yes
b) No (SKIP to QX)
c) Don’t know
d) Refused
8. If answer is Yes in 7 above, what do you do?
a) Avoid/minimize consumption of processed foods
b) Look at the salt or sodium labels on food
c) Do not add salt at the table
d) Buy low salt alternatives
e) Buy low sodium alternatives
f) Do not add salt when cooking
g) Use spices other than salt when cooking
h) Avoid eating out
i) Other (specify) ________________

Section 5: Detailed Instructions for Participants in 24-hour Urine Collection
We are interested in measuring the dietary intake of certain nutrients – sodium, potassium and iodine. The best way to get this information is by analyzing the urine sample you collect during a 24‐hour period.
We cannot get this essential information in any other way!
We are not testing for drugs or viruses.
Your co‐operation is very much appreciated.
Why 24 hours?
The content of some nutrients in urine fluctuates according to what we last ate, how much fluid we drink, how much we exercise and also on the weather. Collecting urine over 24 hours gives much more reliable information than a single sample about the typical intakes of these nutrients in a person’s diet.
Equipment provided
You have the following equipment provided for making your collections. All equipment is disposable and used only for this study.
1. A sheet to record the essential information about the collection. 2. Urine‐collecting equipment for the home:
a. 5 litre screw-capped plastic collection bottle to store the collected urine during the day. This bottle contains a preservative for keeping the urine at room temperature.
b. a 1 litre plastic jug and funnel for temporal reception of the urine samples.
c. a funnel to help women collect urine, which may also help participants in transferring urine samples from the 1-L plastic jug to the 5-L plastic bottle.
d. a safety pin (to attach to your underclothes or nightwear simply as a reminder for you to make your collection)
3. Urine‐collecting equipment for outside the home: a. a 2 liter screw‐capped plastic collection bottle (without preservative) b. two plastic bags for carrying the equipment outside the home
Don’t forget to take the jug and 2 liter bottle with you if you leave your home during the day.
Section 5: Detailed Instructions to Participants 32

Before making the urine collection
The health professional will help you choose the day on which you would like to make the 24‐hour urine collection. You may prefer to choose a day when you will be mostly at home or only going out for a short time.
If you are female, you should not make your collection during menstruation.
How to make your collection for the whole day (24 hours)
You have been asked to collect all the urine you pass in one day into the container you have been given. It is not difficult; here is how you do it.
• On the day that you start your collection, you will pass urine – DISCARD this urine, DO NOT put it into the container. Collect from the second time you pass urine. Record the date and time on the Collection Sheet as follows:
Date started Day Month Year
Minutes Time started Hour
• From then onwards until the next day, ALL urine you pass in the next 24 hours, both during the day and night, must be collected.
• The last collection is the urine you pass on the second day at approximately the same time you started the day before.
• This completes the 24‐hour collection. Record the following on the Collection Sheet:
Date finished Day Month Year
Time finished Hour Minutes
NOTE: DO NOT WORRY IF YOU HAVE NOT COLLECTED FOR ‘EXACTLY’ 24 HOURS, AS LONG AS YOU RECORD EXACT TIME OF START AND FINISH.
• You should pass all urine directly into the 1 litre plastic jug, then pour the urine into the large container, using the funnel if necessary. If you need to open your bowels, always remember to pass urine first before you pass a stool.
• Each time you add a new urine specimen to the large container, screw the lid tight and swirl the urine around a few times, to mix it with the preservative.
• Any urine collected in the small bottle must be transferred to the large bottle as soon as possible e.g. after returning home.
If you miss a sample
If during the 24‐hour collection period a sample is missed for any reason, such as because of a bowel movement, record this on the Urine Collection Sheet.
Section 5: Detailed Instructions to Participants 33

Section 5: Detailed Instructions to Participants 34
Once you have completed your collection
As soon as possible after you have completed your 24‐hour urine collection, the health professional will arrange a time for him/her to pick up the large container with the total volume of collected urine. In the meantime, store your complete collection in a cool, dark place.
If you have any other questions
We hope this leaflet answers the questions you may have. If you have any other questions, contact the health professional. You are free to withdraw from this study at any point.

Section 6: Household Salt Collection and Iodine Determination
This protocol requires assessments of the iodine content of table and cooking salt. It is therefore important to ask participants for large samples of both types of salt (50‐100 gm) where both are used in the household. Because this amount of salt might represent the whole supply in the household, field staff should bring sufficient amounts of both types of salt to replace the samples taken.
In the laboratory, both salt samples should be thoroughly mixed using the same procedure of dry samples to ensure homogeneity. Then, the presence of iodate in the salt should be first identified using a qualitative test kit. For samples that produce a positive reaction (usually a change in color), the quantity of iodine in the samples should then be determined by titration, solubilising not less than 10 gm for refined and small crystal‐size salt, and not less than 50 gm for raw or large crystal‐size salt. Samples that are negative with the test kit should be analyzed for the quantitative content of iodide using an appropriate method with the same amounts of salt as specified above for the positive samples.
Section 6: Household Salt Collection and Iodine Determination 35
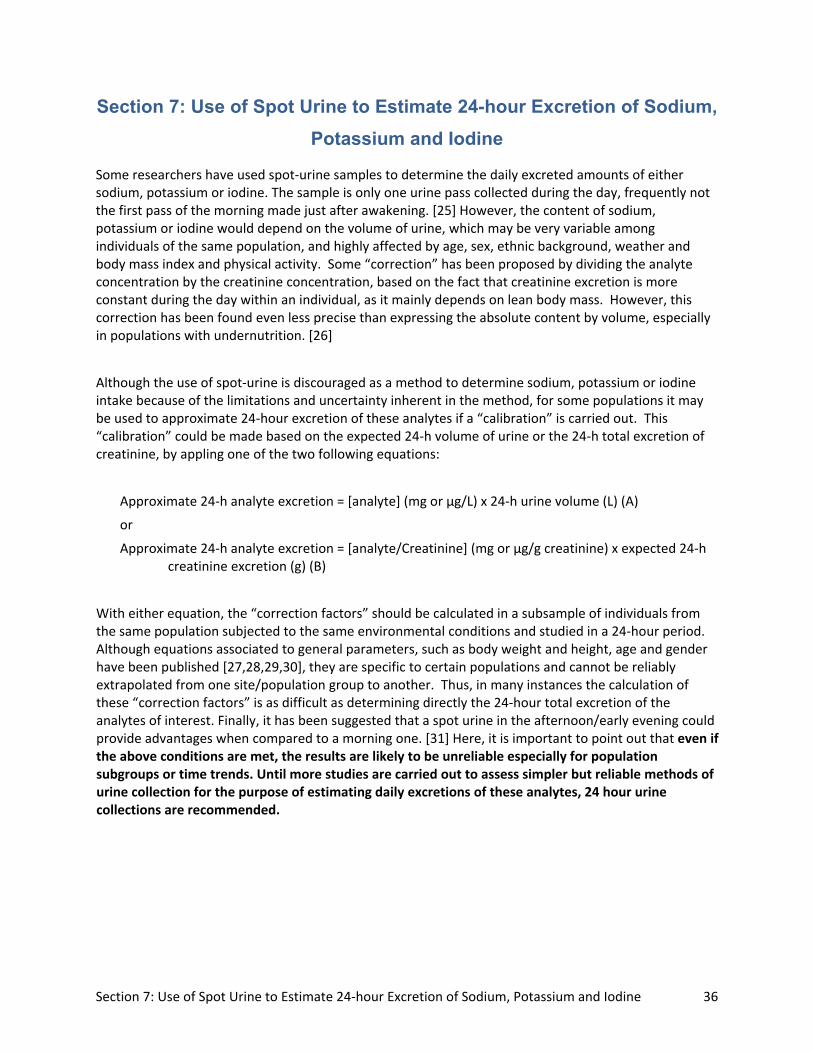
Section 7: Use of Spot Urine to Estimate 24-hour Excretion of Sodium, Potassium and Iodine
Some researchers have used spot‐urine samples to determine the daily excreted amounts of either sodium, potassium or iodine. The sample is only one urine pass collected during the day, frequently not the first pass of the morning made just after awakening. [25] However, the content of sodium, potassium or iodine would depend on the volume of urine, which may be very variable among individuals of the same population, and highly affected by age, sex, ethnic background, weather and body mass index and physical activity. Some “correction” has been proposed by dividing the analyte concentration by the creatinine concentration, based on the fact that creatinine excretion is more constant during the day within an individual, as it mainly depends on lean body mass. However, this correction has been found even less precise than expressing the absolute content by volume, especially in populations with undernutrition. [26]
Although the use of spot‐urine is discouraged as a method to determine sodium, potassium or iodine intake because of the limitations and uncertainty inherent in the method, for some populations it may be used to approximate 24‐hour excretion of these analytes if a “calibration” is carried out. This “calibration” could be made based on the expected 24‐h volume of urine or the 24‐h total excretion of creatinine, by appling one of the two following equations:
Approximate 24‐h analyte excretion = [analyte] (mg or µg/L) x 24‐h urine volume (L) (A)
or
Approximate 24‐h analyte excretion = [analyte/Creatinine] (mg or µg/g creatinine) x expected 24‐h creatinine excretion (g) (B)
With either equation, the “correction factors” should be calculated in a subsample of individuals from the same population subjected to the same environmental conditions and studied in a 24‐hour period. Although equations associated to general parameters, such as body weight and height, age and gender have been published [27,28,29,30], they are specific to certain populations and cannot be reliably extrapolated from one site/population group to another. Thus, in many instances the calculation of these “correction factors” is as difficult as determining directly the 24‐hour total excretion of the analytes of interest. Finally, it has been suggested that a spot urine in the afternoon/early evening could provide advantages when compared to a morning one. [31] Here, it is important to point out that even if the above conditions are met, the results are likely to be unreliable especially for population subgroups or time trends. Until more studies are carried out to assess simpler but reliable methods of urine collection for the purpose of estimating daily excretions of these analytes, 24 hour urine collections are recommended.
Section 7: Use of Spot Urine to Estimate 24‐hour Excretion of Sodium, Potassium and Iodine 36

Section 8: Dataset for Health Economic Analysis
Chronic disease risk factor variable Required breakdown 1 Salt intake (NaCl as g per day) 25-34 35-44 45-54 55-64 Mean By sex and (adult) age group Male Female
2 Smoking (prevalence) 25-34 35-44 45-54 55-64 Mean By sex and (adult) age group Male Female 3 Systolic blood pressure (mmHg) 25-34 35-44 45-54 55-64 Mean By sex and (adult) age group Male Female Std deviation (SD) By sex and (adult) age group Male Female
4 BMI (kg/m2) 25-34 35-44 45-54 55-64 Mean By sex and (adult) age group Male Female Std deviation (SD) By sex and (adult) age group Male Female
5 Total blood cholesterol (mmol/L) 25-34 35-44 45-54 55-64 Mean By sex and (adult) age group Male Female Std deviation (SD) By sex and (adult) age group Male Female
Section 8: Dataset for Health Economics Analysis 37

38
REFERENCES 1. Pan American Health Organization. Regional Strategy and Plan of Action on an Integrated
Approach to the Prevention and Control of Chronic Diseases. Washington, DC: PAHO; 2007. Available at: http://www.paho.org/english/ad/dpc/nc/reg‐strat‐cncds.pdf. Accessed 29 April 2010.
2. Pan American Health Organization. Health in the Americas. Volume I. 2002 ed. Washington, DC: PAHO; 2002. Available at: http://www.paho.org/English/DBI/MDS/HIA_2002.htm. Accessed 29 April 2010.
3. Law M. Salt, blood pressure and cardiovascular diseases. J Cardiovasc Risk 2000; 7:5‐8. 4. Penney S. Dropping the salt: Practical steps countries are taking to prevent chronic non‐
communicable diseases through population‐wide dietary salt reduction. Public Health Agency of Canada, Revised version: August 2009. Available at: http://www.paho.org/English/AD/dpc/nc/salt‐mtg‐phac‐paper.pdf. Accessed 29 April 2010.
5. He FJ, MacGregor GA. A comprehensive review on salt and health and current experience of worldwide salt reduction programmes. J Human Hypertension 2009; 23:363‐84.
6. Strazzullo P, D’Elia L, Kandala N‐B, Cappuccio FP. Salt intake, stroke and cardiovascular disease: a meta‐analysis of prospective studies. BMJ 2009; 339: b4567
7. Sacks FM, Svetkey LP, Vollmer WM et al. Effects on blood pressure of reduced dietary sodium and the Dietary Approaches to Stop Hypertension (DASH) diet. DASH‐Sodium Collaborative Research Group. New Engl J Med 2001; 344:3‐10.
8. Kumanyika SK, Cook NR, Cutler JA, Belden L, Brewer A, Cohen JD, Hebert PR, Lasser VI, Raines J, Raczynski J, Shepek L, Diller L, Whelton PK, Yamamoto M for the Trials of Hypertension Prevention Collaborative Research Group. Sodium reduction for hypertension prevention in overweight adults: further results from the Trials of Hypertension Prevention Phase II. J Human Hypertension 2005; 19:33‐45.
9. Asaria P, Chisholm D, Mathers C, Ezzati M, Beaglehole R. Chronic disease prevention: health effects and financial costs of strategies to reduce salt intake and control tobacco use. Lancet 2007; 370:2044–53.
10. Murray CJ, Lauer JA, Hutubessy RC, Niessen L, Tomijima N, Rodgers A, Lawes CM, Evans DB. Effectiveness and costs of interventions to lower systolic blood pressure and cholesterol: a global and regional analysis on reduction of cardiovascular disease risk. Lancet 2003; 361:717‐25.
11. Bibbins‐Domingo K, Chertow GM, Coxson PG, Moran A, Lightwood JM, Pletcher MJ, Goldman L. Projected effect of dietary salt reductions on future cardiovascular disease. N Eng J Med 2010; 362:590‐99.
12. Pan American Health Organization. Policy Statement – Reducing dietary salt in the Americas as a population‐based approach to cardiovascular disease prevention. 2009. Available at: http://new.paho.org/hq/index.php?option=com_content&task=view&id=2022&Itemid=1766
13. MRC – Human Nutrition Research, National Centre for Social Research. An assessment of dietary sodium levels among adults (aged 19‐64) in the UK general population in 2008, based on analysis of dietary sodium in 24 hour urinary sodium samples. June 2008. Available at: http://www.food.gov.uk/multimedia/pdfs/08sodiumreport.pdf. Accessed 8 April 2010.
14. Anderson CAM, Appel LJ, Okuda N, Brown IJ, Chan Q, Zhao L, Ueshima H, Kesteloot H, Miura K, Curb JD, Yoshita K, Elliott P, Yamamoto ME, Stamler J. Dietary Sources of Sodium in China, Japan, the United Kingdom, and the United States, Women and Men Aged 40 to 59 Years: The INTERMAP Study. �J Am Dietetic Association 2010; 110:736‐45.

39
15. European Commission. EU Framework for National Salt Initiatives. Available at: http://ec.europa.eu/health/nutrition_physical_activity/high_level_group/nutrition_salt_en.htm. Accessed 20 May 2010.
16. Choices International Foundation. The Choices Programme. Available at: http://choicesprogramme.org/en/about_the_choices_programme/product_criteria. Accessed 21 May 2010.
17. Elliott P, Stamler J, Nichols R, Dyer AR, Stamler R, Kesteloot H, Marmot M. Intersalt revisited: further analyses of 24 hour sodium excretion and blood pressure within and across populations. BMJ 1996; 312:1249‐53
18. Khaw K‐T, Barret‐Connor E. Dietary potassium and stroke‐associated mortality. A 12‐year prospective population study. N Engl J Med 1987; 316:235‐40
19. Cappuccio FP, MacGregor GA. Does potassium supplementation lower blood pressure? A meta‐analysis of published trials. J Hypertens 1991; 9:465‐73
20. Siani A, Strazzullo P. Giacco A, Pacioni D, Celentano E, Mancini M. Increasing the Dietary Potassium Intake Reduces the Need for Antihypertensive Medication. Ann Intern Med 1991; 115:753‐9
21. Andersson M, de Benoist B, Rogers L. Epidemiology of iodine deficiency: Salt iodisation and iodine status. Best Pract Res Clin Endocrinol Metab 2010; 24:1‐11.
22. Pan American Version of the WHO STEPSwise Approach to Chronic Disease Risk Factor Surveillance. Available at: www.paho.org/English/AD/DPC/NC/panam‐steps.htm. Accessed 20 May 2010.
23. World Health Organization. Assessment of iodine deficiency disorders and monitoring their elimination : a guide for program managers. Third edition (updated 1st September 2008). Available at: http://www.who.int/nutrition/publications/micronutrients/iodine_deficiency/9789241595827/en/index.html. Accessed 20 May 2010.
24. Campbell NRC, McKay DW, Chockalingam A, Fodor JG. Errors in Assessment of Blood Pressure: Sphygmomanometers and Blood Pressure Cuffs. Can J Public Health 1994; Supplement 2: S22‐S25.
25. Rasmussen LB, Ovesen L, Christiansen E. Day‐to‐day and within‐day variation in urinary iodine
excretion. Eur J Clin Nutr 1999; 53:401‐7.
26. Furnée CA, van der Haar F, West CE, Hautvast JGAJ. A critical appraisal of goiter assessment and
the ratio of urinary iodine to creatinine for evaluating iodine status. Am J Clin Nutr 1994;
59:1415‐17.
27. IOM, National Academy of Sciences of the USA. Dietary Referemce Intakes, Iodine. 2000:258‐89. Avaialable at: http://www.nap.edu/openbook.php?record_id=10026&page=258. Accessed 29 April 2010.
28. Tanaka T, Okamura T, Miura K et al. A simple method to estimate populational 24‐h urinary sodium and potassium excretion using a casual urine specimen. J Hum Hypertens 2002; 16:97‐103.
29. Kawano Y, Tsuchihashi T, Matsuura H, Ando K, Fujita T, Ueshima H. Report of the Working Group for dietary salt reduction of the Japanese Society of Hypertension: (2) Assessment of salt intake in the management of hypertension. Hypertens Res 2007; 30:887‐93.
30. Knudsen N, Christiansen E, Brandt‐Christensen M, Nygaard B, Perrild H. Age‐ and sex‐adjusted iodine/creatinine ratio. A new standard in epidemiological surveys? Evaluation of three different estimates of iodine excretion based on casual urine samples and comparison to 24 h values. Eur J Clin Nutr 2000; 54:361‐63.
31. Mann SJ, Gerber LM. Estimation of 24‐hour sodium excretion from spot urine samples. J Clin Hypert 2010; 12:174‐80.