regional economic growth in malaysia: does aggregate
TRANSCRIPT

http://rwe.sciedupress.com Research in World Economy Vol. 10, No. 5; Special Issue, 2019
Published by Sciedu Press 139 ISSN 1923-3981 E-ISSN 1923-399X
Regional Economic Growth in Malaysia: Does Aggregate
Overqualification Matter?
Zainizam Zakariya1, Kristinn Hermanssons
2, Kho Yin Yin
1 & Noor Fazlin Mohamed Noor
3
1 Department of Economics, Faculty of Management and Economics, Sultan Idris Education University, Tanjung
Malim, Malaysia
2 School of Education, University of Glasgow, Scotland, United Kingdom
3 Open University Malaysia, Tanjung Malim, Malaysia
Correspondence: Zainizam Zakariya, Department of Economics, Faculty of Management and Economics, Sultan
Idris Education University, 35900 Tanjung Malim, Perak, Malaysia. E-mail: [email protected]
Received: October 10, 2019 Accepted: November 5, 2019 Online Published: December 23, 2019
doi:10.5430/rwe.v10n5p139 URL: https://doi.org/10.5430/rwe.v10n5p139
Abstract
This paper explores the impact of aggregate overqualification on regional economic growth in Malaysia from 2005
to 2017 using Dynamic Panel Data (DPD) approach. The aggregate overqualification was gauged as the percentage
of workers with at least a bachelor’s degree qualification who employed in an occupation below than the professional
job level. Following the method, while the incidence stood at 1 percent, it was however higher in Kuala Lumpur (4.4
percent) and Selangor (3.9 percent) and was much lower in Perak (-0.26 percent) and Perlis (-0.12 percent).
Moreover, the incidence was higher after 2010. Empirical findings revealed strong evidence of negative impact of
the aggregate overqualification on regional economic growth. Yet, the magnitudes of the effect were smaller,
between 0.02 and 0.03. Further analysis revealed the negative impact was greater in most developed states and for
the period after 2010. The findings depict that there is a growth penalty for not being fully utilised the knowledge
and skills of highly educated workers at the regional labour market.
Keywords: aggregate overqualification, regional economic growth, Malaysia
JEL codes: I25, J24, O47
1. Introduction
In traditional labour market research, it is assumed that workers look for jobs on the global market. However,
employment opportunities are mainly determined at the regional level. Due to limited spatial flexibility, most people
only look for work on the local market rather than global labour market (Büchel & Battu, 2002; Hensen, de Vries, &
Cörvers, 2009; Cabus & Somers, 2018). Job seekers who faced mobility constraint may have at least three options in
confronting with a local labour market if no suitable jobs are found – (1) being unemployed; (2) accepting a suitable
job further away, beyond the current regional market; or (3) tolerant a local job below their own level of qualification,
resulting in overqualification (Pechancová et al., 2019).
In this paper, we focus on the last one, i.e. – overqualification at the regional level, i.e.- workers are employed in a
job for which their qualifications below than what the jobs require (Frenette, 2000; Mansor, & Ilias, 2013).
Assessments of the extent of the effect of overqualification at state level seem crucial for economic policymakers as
the incidence is typically resulting in negative rather than positive impacts at the individual and firm-level. (Note 1)
This seems to be true in the context of Malaysia as an uneven distribution of economic development across region
has led to regional income disparities and unbalanced growth (Yussof & Kasim, 2003; Ragayah, 2008; Abdullah,
Doucouliagos, & Manning, 2014; Hutchinson, 2017). Although there have many efforts been implemented, the
persistence of regional disparities still exists and it seems a global phenomenon and almost universal (Karimi, Yusop,
& Law, 2010; Malaysia, 2016). Differences in human capital endowment, especially education (Ragayah, 2008; Ali
& Ahmad, 2009; Karimi, Yusop, & Law, 2010; Kandhro, & Pathrannarakul, 2013) and labour market characteristics
such as unemployment, occupation, hours of work or education and skills utilisation (Yussof & Kasim, 2003; Saari,
Dietzenbacher, & Los, 2014) are identified as one of the reasons behind the issue.
If the supply of highly educated workers is not matched by demand, then the impact of education on economic

http://rwe.sciedupress.com Research in World Economy Vol. 10, No. 5; Special Issue, 2019
Published by Sciedu Press 140 ISSN 1923-3981 E-ISSN 1923-399X
growth, i.e. - Growth Domestic Product (GDP) at a regional level may not necessarily positive, especially if
geographical labour mobility is limited. Yet, even if highly educated workers do not find a suitable job and choose to
stay in the region for working in overqualified jobs may adversely impact on the growth than that would be the case
if the economy were make fully utilised the skills of all the mismatched workers level (McGowan and Andrews,
2017; Adrian, Desislava, Ganev, & Aleksiev, 2018). (Note 2) The incidence of overqualification, however, may in
turn to a favourable effect on regional growth as the overqualified workers tend to have accumulated more skills and
education than their well-matched counterparts (Sloane, Battu, & Seaman, 1996; Chiswick & Miller, 2010;
Sánchez-Sánchez, McGuinness, 2015; Zakariya et al., 2017), indicating that they tend to be more productive than the
non-overqualified workers.
Given these scenarios, any effect of overqualification on state growth is possible as each argument has a reasonable
theoretical foundation. Yet, the study of the impact of such incidence at the macro level has not gained much
attention in the literature. The fact that an increasing trend in the number of overqualified workers in the labour
market as mentioned in European Commission (2015) should alarm concern and without knowing the direction and
pattern of the relationship, it might impede proper policies. Up to our knowledge, there has a very limited study on
the link between mismatch and economic growth (Jaoul-Grammare & Guironnet, 2009; Ramos, Surinach, & Artís,
2012; Osman, & Sentosa, 2013).
Therefore, the main objective of this paper is to explore the impact of aggregate overqualification on regional
economic growth in Malaysia between 2005 and 2017. The rest of the paper is organised as follows. Section two
reviews the theoretical background and followed up by past studies related to the overqualification incidence and its
impact at the aggregate level (if any). The empirical method is outlined in section three and section four comprises
dataset, measurement and incidence of aggregate overqualification. Section five presents the discussion of the results
and section six reserves for discussion and conclusion of the study.
2. Theoretical Background, Overqualification and Regional Economic Growth
The importance of geographical constraint on the existence of overqualification incidence in the labour market was
firstly highlighted in “Theory of Differential Overqualification” (Frank, 1978). Frank explored the labour market
outcomes among dual-earner families of married person (husbands and wives) and the basic premise is that the wives’
job search behaviour depends on the size of the labour market size within which the husbands work. Due to the
wives are normally perceived as secondary earners and their husbands are normally breadwinners, the husbands’ jobs
then are given priority. Smaller areas or towns may not provide suitable employment opportunities for the wives and
may face a greater likelihood of unemployment or could be forced to accept a job that does not match their education,
hence, increase the likelihood of overeducation once employed. Indirectly, the theory has recognised the significance
of space and mobility constraint on the risk of overqualification among workers regardless of marital status.
Yet, there has been mixed evidence with respect to empirical findings. Mcgoldrick and Robst (1996) found no
evidence to support the theory as a large labour market increases the risk of overqualification between men and
women. Instead, Büchel and Battu (2003) found married women in small local labour markets tend to have a greater
risk of overeducation relative to unmarried women and men (married or unmarried). Meanwhile, Büchel and Ham
(2002) and Hensen et al. (2009) revealed both spatial distributions of job opportunities and individual spatial
flexibility play a major role in explaining the phenomenon of overeducation. Both studies showed job seekers have a
higher probability of finding suitable jobs regardless of the size regional labour market if they have no spatial
constraint.
The typical findings of overqualification incidence reduce workers’ own productivity via earnings penalty, job
dissatisfaction and a higher rate of job turnover. Perhaps, the overeducated workers who are dissatisfied may have a
negative influence on their co-workers at the workplace. If this were the case, one would find that such incidence
may have an adverse effect at a firm level, for example, results in lower firm productivity. Tsang (1987) found
over-education indirectly leads to lower firm productivity in 22 Bell companies via negative impact on job
satisfaction. The impact was so vibrant - a one-year increase in over-education led to a reduction in 8.4 percent firm
output. A study by Philipp (2016) revealed that undereducated workers impair firm productivity for the period 2004
– 2011 in Germany. Moreover, few studies have shown that overqualification reduces workplace average pay
(Belfield, 2010; Ali, 2013; Battu and Zakariya, 2015) and result in workplace dis-harmonization such as higher
absenteeism and quit rate (Jones, Jones, Latreille and Sloane, 2009; Belfield, 2010; Battu and Zakariya, 2015).
However, the stylized fact that the overeducated workers have accumulated more skills and schooling than their
comparable well-matched (Hartog, 1988; Sloane et al., 1996; Hartog, 2000; Zakariya, 2014). This suggests that the
overeducated might be more productive than that of the comparable group, hence might have an impact on other

http://rwe.sciedupress.com Research in World Economy Vol. 10, No. 5; Special Issue, 2019
Published by Sciedu Press 141 ISSN 1923-3981 E-ISSN 1923-399X
workers’ effort at the workplace, hence, improving establishment-level productivity. Few authors found that
overqualified workers improve firm productivity. For example, Mahy et al. (2015) found that the positive effect of
over-education on firm productivity is greater at firms with a higher share of high-skilled jobs in
high-tech/knowledge-intensive industries that evolving in a more uncertain economic environment. In fact, there
have been many studies shown that firms with greater human capital stock tend to be more productive than firms
with less human capital stocks accumulation (Acemoglu & Angrist, 2001; Moretti, 2004b, 2004c; Fu, 2007; Liu,
2007; Sand, 2013; Mohamed Noor et al., 2017; Hussain et al., 2018).
The fact that the mismatch incidence impairs negative impacts at an individual and a firm-level may suggest that
such incidence could potentially reduce national welfare than would be the case if the skills and knowledge of all
workers were fully utilised within the economy. McGowan and Andrews (2017) found the overskillling incidence
was negatively associated with labour productivity across 19 OECD countries. One percent increase in such
incidence at the workplace led to a decrease in labour productivity by between 0.7 and 2.2 percent. Likewise, Adrian
et al. (2018) revealed skill mismatch has an adverse effect on annual productivity in five European countries (Austria,
Bulgaria, Finland, Germany and Spain) with an estimated loss of on average at 2.14 percent a year.
With respect to growth, a study from Jaoul-Grammare and Guironnet (2009) showed that over-education adversely
affect growth in France. Using Vector AutoRegressive (VAR) model, the authors found negative causality between
over-education and the growth in the short run. The capability of economic to growth reduced with the higher share
of overeducated workers without any degree of higher education (SOWHE) in the workforce. however, Ramos et al.
(2012) instead revealed that over-education, over-qualification and years of over-schooling all had positive impacts
on growth, roughly between 3 and 13 percent across nine European countries. Among the three indicators, the
magnitude of the effect was much higher for overeducation (model with country and time fixed effect). Perhaps, the
inconclusive results may be partly explained by differences in the measurement of mismatch and dataset used. While
Jaoul-Grammare and Guironnet (2009) used aggregate mismatch based on aggregate data, i.e. - time-series data from
1980 - 2002, Ramos et al. (2012) instead used micro-level data survey (the NUTS ) to gauge aggregate mismatch and
its impact on growth. The NUTS data are not collected regularly as compared to time series used in Jaoul-Grammare
& Guironnet (2009) and, therefore does not allow for long-term analysis (Hilkevics and Semakina, 2019).
3. Dataset, Measurement and Incidence of Aggregate Overqualification
This paper employed panel time-series data from 2005 to 2017 across 13 states and two federal territories on GDP
per worker (Y), gross capital formation (K), stock of labour force (L). (Note 3) The data were taken from two major
sources - Department of Statistics Malaysia (DoSM) for Y and L; and Malaysia Investment Development Authority
(MIDA) for K. (Note 4) Both Y and K were measured in logarithm form based on 2010 constant price (Ringgit
Malaysia). Information on L was extracted from the Labour Force Survey (LFS) time-series statistics report by state,
1982 – 2017 which was available online via the DoSM website. At least, two main information available with
respect to employed persons in the LFS. First, educational background (educational level and highest qualification
obtained) were classified following the 1997 International Standard Classification of Education (ISCED). In this
study, L was decomposed into three groups– primary, secondary and tertiary education, and was measured in
logarithm form as well. Second, occupational levels were categorised based on the 2008 International Standard
Classification of Occupation (ISCO-08).
http://rwe.sciedupress.com Research in World Economy Vol. 10, No. 5; Special Issue, 2019
Published by Sciedu Press 142 ISSN 1923-3981 E-ISSN 1923-399X
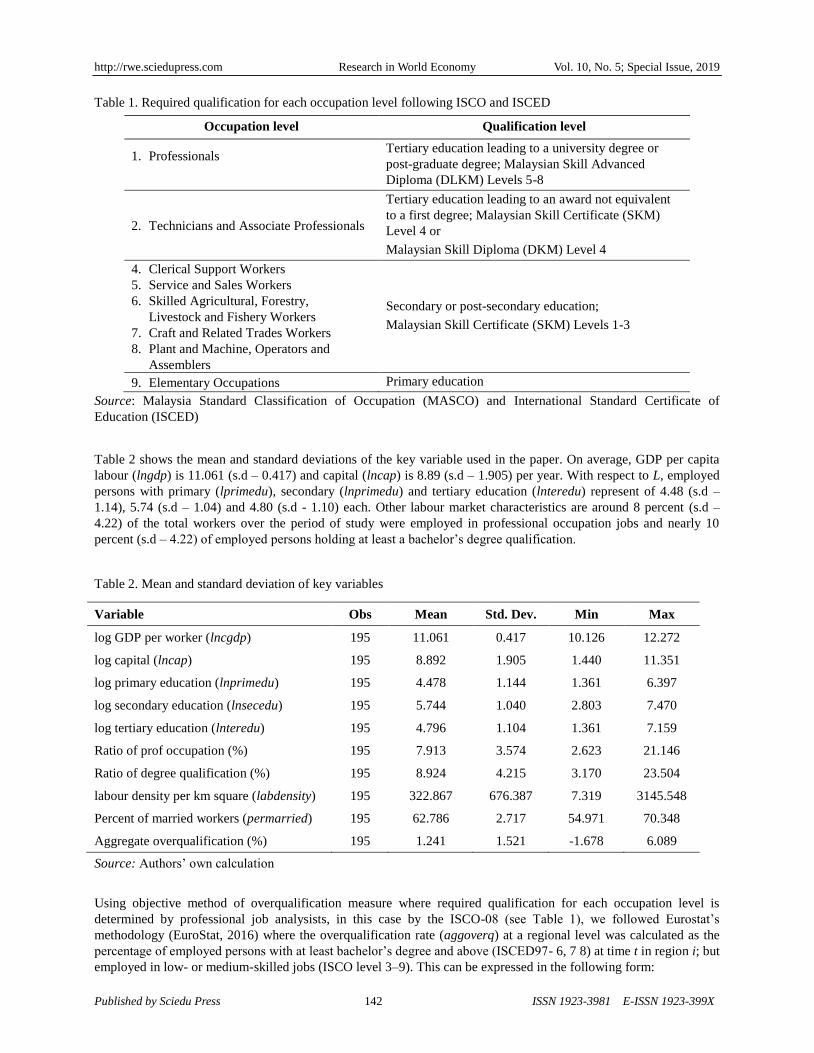
Table 1. Required qualification for each occupation level following ISCO and ISCED
Occupation level Qualification level
1. Professionals
Tertiary education leading to a university degree or
post-graduate degree; Malaysian Skill Advanced
Diploma (DLKM) Levels 5-8
2. Technicians and Associate Professionals
Tertiary education leading to an award not equivalent
to a first degree; Malaysian Skill Certificate (SKM)
Level 4 or
Malaysian Skill Diploma (DKM) Level 4
4. Clerical Support Workers
5. Service and Sales Workers
6. Skilled Agricultural, Forestry,
Livestock and Fishery Workers
7. Craft and Related Trades Workers
8. Plant and Machine, Operators and
Assemblers
Secondary or post-secondary education;
Malaysian Skill Certificate (SKM) Levels 1-3
9. Elementary Occupations Primary education
Source: Malaysia Standard Classification of Occupation (MASCO) and International Standard Certificate of
Education (ISCED)
Table 2 shows the mean and standard deviations of the key variable used in the paper. On average, GDP per capita
labour (lngdp) is 11.061 (s.d – 0.417) and capital (lncap) is 8.89 (s.d – 1.905) per year. With respect to L, employed
persons with primary (lprimedu), secondary (lnprimedu) and tertiary education (lnteredu) represent of 4.48 (s.d –
1.14), 5.74 (s.d – 1.04) and 4.80 (s.d - 1.10) each. Other labour market characteristics are around 8 percent (s.d –
4.22) of the total workers over the period of study were employed in professional occupation jobs and nearly 10
percent (s.d – 4.22) of employed persons holding at least a bachelor’s degree qualification.
Table 2. Mean and standard deviation of key variables
Variable Obs Mean Std. Dev. Min Max
log GDP per worker (lncgdp) 195 11.061 0.417 10.126 12.272
log capital (lncap) 195 8.892 1.905 1.440 11.351
log primary education (lnprimedu) 195 4.478 1.144 1.361 6.397
log secondary education (lnsecedu) 195 5.744 1.040 2.803 7.470
log tertiary education (lnteredu) 195 4.796 1.104 1.361 7.159
Ratio of prof occupation (%) 195 7.913 3.574 2.623 21.146
Ratio of degree qualification (%) 195 8.924 4.215 3.170 23.504
labour density per km square (labdensity) 195 322.867 676.387 7.319 3145.548
Percent of married workers (permarried) 195 62.786 2.717 54.971 70.348
Aggregate overqualification (%) 195 1.241 1.521 -1.678 6.089
Source: Authors’ own calculation
Using objective method of overqualification measure where required qualification for each occupation level is
determined by professional job analysists, in this case by the ISCO-08 (see Table 1), we followed Eurostat’s
methodology (EuroStat, 2016) where the overqualification rate (aggoverq) at a regional level was calculated as the
percentage of employed persons with at least bachelor’s degree and above (ISCED97- 6, 7 8) at time t in region i; but
employed in low- or medium-skilled jobs (ISCO level 3–9). This can be expressed in the following form:

http://rwe.sciedupress.com Research in World Economy Vol. 10, No. 5; Special Issue, 2019
Published by Sciedu Press 143 ISSN 1923-3981 E-ISSN 1923-399X
𝐴𝑔𝑔𝑟𝑒𝑔𝑎𝑡𝑒 𝑂𝑣𝑒𝑟 − 𝑞𝑢𝑎𝑙𝑖𝑓𝑖𝑐𝑎𝑡𝑖𝑜𝑛 (𝑎𝑔𝑔𝑜𝑣𝑒𝑟𝑞𝑡,𝑟) = |𝐸𝑡𝑒𝑟,𝑡,𝑖
𝐸𝑇,𝑡,𝑖
−𝑂𝑝𝑟𝑜𝑓,𝑡,𝑖
𝑂𝑇,𝑡,𝑖
| (1)
where 𝐸𝑇 is the total number of employed persons at year t in region i; 𝑂𝑝𝑟𝑜𝑓,𝑡 is total number of the employed
person at the professional level (ISCO08 - 2) at year t and lastly 𝑂𝑇,𝑡 denotes total number of occupations at all
levels. In shorten, 𝐸𝑡𝑒𝑟,𝑡,𝑖
𝐸𝑇,𝑡,𝑖 represents the ratio of employed person with higher education of the total employed
persons for region i whereas 𝑂𝑝𝑟𝑜𝑓,𝑡,𝑠
𝑂𝑇,𝑡 signifies the ratio of professional jobs of the total jobs in region i. (Note 5) If
𝑎𝑔𝑔𝑜𝑣𝑒𝑟𝑞𝑡,𝑖 > 0, the incidence of aggoverq exists in the labour market in year t for region i. By contrast, if
𝑎𝑔𝑔𝑜𝑣𝑒𝑟𝑞𝑡,𝑖 < 0, there is no aggoverq exist in the region i. This is the shortcoming of aggregate qualification used
in this paper as the method does not allow one to identify the categories of non-overqualified groups either they
belong to a well-matched or an underqualified group. The advantages, however, are a part of being objective, the
method is also easy to calculate and provides a milestone to track the educational and skills mismatches over time as
the LFS report becomes available every year.
Nevertheless, as shown in the bottom part of Table 2, the incidence of aggoverq stands at on average 1.24 percent a
year. Yet, the incidence seems volatile over the period of study, ranges from as low -1.68 and as high 6.09 percent.
Further analysis as illustrated in Figure 1 to Figure 3 provides some interesting points. Across year, Figure 1
demonstrates that the incidence, in general, showed a persistent phenomenon every year. Yet, there were two
different patterns could be observed over the 12 years span. The incidence was in general show an increasing trend
between 2005 and 2010, from 1.27 percent in 2005 to 3.4 percent and then sharply decreased in 2011 at 1.33 percent
and continuously declined to 0.33 in 2017. Higher incidence in the first five years looks surprisingly because the
country experienced greater economic growth in 2010 with 7.2 percent relative to 5.1 percent in 2011. Indeed, the
unemployment rate among the highly educated workforce was beyond 5 percent for both years. Plausibly, the finding
may suggest there could be a causality relationship between aggoverq and growth in the short run. When the
economy does not move with the same proportion as the growth rate of supply of skilled person, there would lead to
mismatch between the supply and the demand for highly educated person in the labour force (Jaoul-Grammare &
Guironnet, 2009; Cuadras-Morató & Mateos-Planas, 2013; Cedefop, 2015; Vlasov, & Kiseleva, 2017; International
Monetary Fund, 2018; Gil, Gabriel, & Afonso, 2019). However, examining the causality relationship between
aggoverq and lngdp is beyond our motive.
Figure 1. The incidence of aggregate overqualification across year, 2005 - 2017
1.27
1.84
1.64
1.98
2.21 2.34
1.33
0.72
0.50 0.60
0.94
0.41 0.35
1.24
0.00
0.50
1.00
1.50
2.00
2.50
2005 2006 2007 2008 2009 2010 2011 2012 2013 2014 2015 2016 2017
aggover
q (
%)
Year
http://rwe.sciedupress.com Research in World Economy Vol. 10, No. 5; Special Issue, 2019
Published by Sciedu Press 144 ISSN 1923-3981 E-ISSN 1923-399X
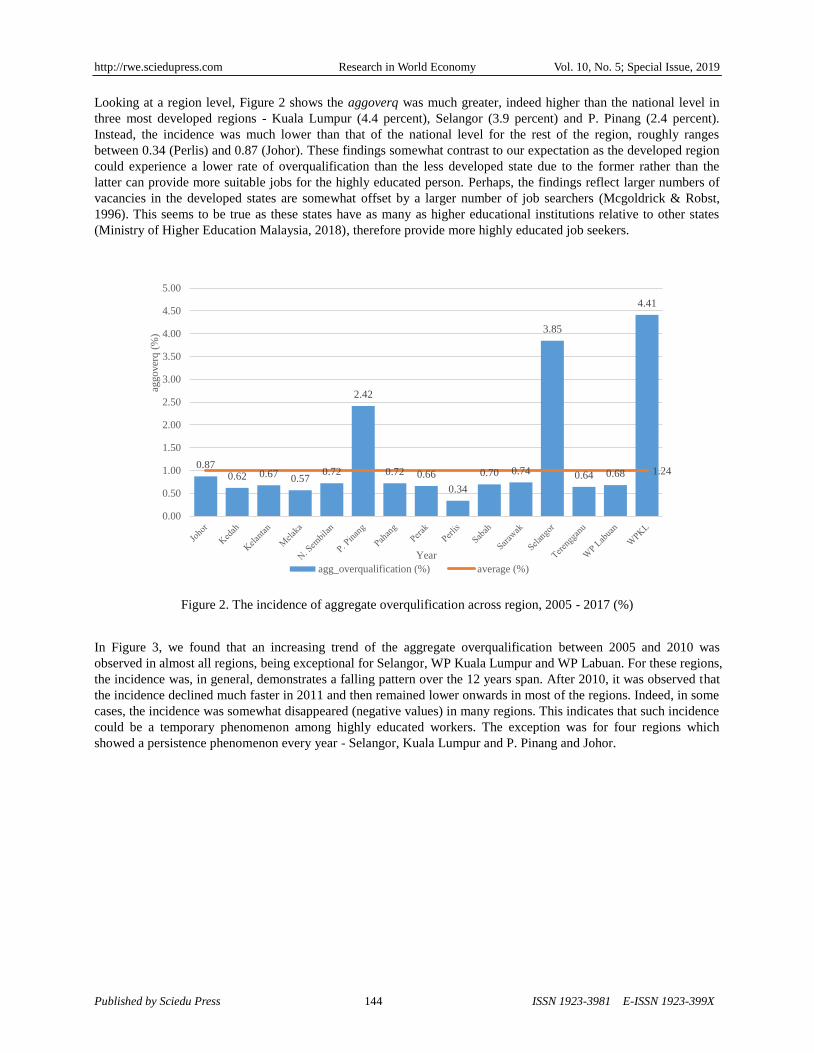
Looking at a region level, Figure 2 shows the aggoverq was much greater, indeed higher than the national level in
three most developed regions - Kuala Lumpur (4.4 percent), Selangor (3.9 percent) and P. Pinang (2.4 percent).
Instead, the incidence was much lower than that of the national level for the rest of the region, roughly ranges
between 0.34 (Perlis) and 0.87 (Johor). These findings somewhat contrast to our expectation as the developed region
could experience a lower rate of overqualification than the less developed state due to the former rather than the
latter can provide more suitable jobs for the highly educated person. Perhaps, the findings reflect larger numbers of
vacancies in the developed states are somewhat offset by a larger number of job searchers (Mcgoldrick & Robst,
1996). This seems to be true as these states have as many as higher educational institutions relative to other states
(Ministry of Higher Education Malaysia, 2018), therefore provide more highly educated job seekers.
Figure 2. The incidence of aggregate overqulification across region, 2005 - 2017 (%)
In Figure 3, we found that an increasing trend of the aggregate overqualification between 2005 and 2010 was
observed in almost all regions, being exceptional for Selangor, WP Kuala Lumpur and WP Labuan. For these regions,
the incidence was, in general, demonstrates a falling pattern over the 12 years span. After 2010, it was observed that
the incidence declined much faster in 2011 and then remained lower onwards in most of the regions. Indeed, in some
cases, the incidence was somewhat disappeared (negative values) in many regions. This indicates that such incidence
could be a temporary phenomenon among highly educated workers. The exception was for four regions which
showed a persistence phenomenon every year - Selangor, Kuala Lumpur and P. Pinang and Johor.
0.87 0.62 0.67 0.57
0.72
2.42
0.72 0.66
0.34
0.70 0.74
3.85
0.64 0.68
4.41
1.24
0.00
0.50
1.00
1.50
2.00
2.50
3.00
3.50
4.00
4.50
5.00
aggover
q (
%)
Year
agg_overqualification (%) average (%)

http://rwe.sciedupress.com Research in World Economy Vol. 10, No. 5; Special Issue, 2019
Published by Sciedu Press 145 ISSN 1923-3981 E-ISSN 1923-399X
4. Empirical Framework
Fixed effect (FE) model seems more appropriate to study the effect of aggregate overqualification on growth when
using longitudinal panel data as the model allows one to control for unobservable heterogeneity through the inclusion
of state and time fixed effects. The model can be specified as below (Ramos et al., 2012):
ln 𝑔𝑑𝑝𝑖𝑡 = 𝛽1. 𝑙𝑛𝑔𝑑𝑝𝑖,𝑡−1 + 𝛽2. 𝑎𝑔𝑔𝑜𝑣𝑒𝑟𝑞𝑖𝑡 + 𝛽3𝑋𝑡 + 𝜇𝑖𝑡 (1)
Where, 𝑢𝑖𝑡 = 𝑣𝑖 + 𝑒𝑖𝑡
where 𝑙𝑛𝑔𝑑𝑝𝑖𝑡 is log real GDP per worker for state i (i = 1, 2,….15) at time t (t = 1,2,…..13), 𝑙𝑛𝑔𝑑𝑝𝑖,𝑡−1 is real
GDP per worker at t – 1; aggoverq is percent of aggregate overqualification; X is other explanatory variables, i.e. –
log capital per worker (𝑙𝑛𝐾𝑖𝑡) and labour’s educational attainment (𝑙𝑛𝑝𝑟𝑖𝑚𝑒𝑑𝑢𝑖𝑡 , 𝑙𝑛𝑠𝑒𝑐𝑒𝑑𝑢𝑖𝑡 and 𝑙𝑛𝑡𝑒𝑟𝑒𝑑𝑢𝑖𝑡).
However, there had some econometric concerned in equation (1). First, a time-invariant regional characteristic such
as geographical areas and demographics background may be correlated with the explanatory variables. The error
0.5
11
.52
-10
12
-10
12
-10
12
-.5
0.5
11
.5
1.5
22
.53
3.5
-10
12
-10
12
-.5
0.5
1
-10
12
-10
12
23
45
6
-2-1
01
2
-10
12
23
45
6
2004 2006 2008 2010 2012 2014 2016 2018 2004 2006 2008 2010 2012 2014 2016 2018 2004 2006 2008 2010 2012 2014 2016 2018 2004 2006 2008 2010 2012 2014 2016 2018
2004 2006 2008 2010 2012 2014 2016 2018 2004 2006 2008 2010 2012 2014 2016 2018 2004 2006 2008 2010 2012 2014 2016 2018 2004 2006 2008 2010 2012 2014 2016 2018
2004 2006 2008 2010 2012 2014 2016 2018 2004 2006 2008 2010 2012 2014 2016 2018 2004 2006 2008 2010 2012 2014 2016 2018 2004 2006 2008 2010 2012 2014 2016 2018
2004 2006 2008 2010 2012 2014 2016 2018 2004 2006 2008 2010 2012 2014 2016 2018 2004 2006 2008 2010 2012 2014 2016 2018
Johor Kedah Kelantan Melaka
N. Sembilan P. Pinang Pahang Perak
Perlis Sabah Sarawak Selangor
Terengganu WP Labuan WPKL
Ag
go
ve
rq
(%
)
YearSource: Authors' own calculation
The incidence of aggregate overqualification by region across year, 2005 - 2017 (%)
Figure 3

http://rwe.sciedupress.com Research in World Economy Vol. 10, No. 5; Special Issue, 2019
Published by Sciedu Press 146 ISSN 1923-3981 E-ISSN 1923-399X
term in (1) consists of the unobserved state-specific effects, vi, and observation-specific errors, eit. To solve this
problem, one can perform the first difference transformation in (1) to remove the fixed state-specific effect and get:
ln ∆𝑔𝑝𝑑𝑖𝑡 = 𝛽1. 𝑙𝑛∆𝑔𝑑𝑝𝑖,𝑡−1 + 𝛽2. ∆𝐴𝑔𝑔𝑜𝑣𝑒𝑟𝑞𝑖𝑡 + 𝛽3∆𝑋𝑖𝑡 + ∆∈𝑖𝑡 (2)
Another problem is aggoverq would be assumed to be endogenous as there may be causality run in both directions –
running from overqualification to growth and vice versa and these regressors may be correlated with the error term
(Jaoul-Grammare & Guironnet, 2009). Endogeneity of aggoverq can also arise if overqualification is assumed
related to unobserved characteristics at the regional level, such as a lower level of ability and the motivation of the
overqualified. For instance, workers living in a region with greater labour market density may result in better
occupation outcome than workers living in a region with a smaller labour market density. What is more, the presence
of a higher rate of married employed persons in the local labour market may reflect spatial constraint mobility,
especially among dual earners family. If these workers in the region are more likely to be overqualified, this further
suggests that the disturbance of the worker’s occupational selection process at a state level could be correlated with
the error term in the growth equation.
To solve this, two-stage least squares or 2SLS such as fixed-effects instrumental variables (IV-FE) can be employed.
However, finding potential variables served as instruments for overqualification, seems trickier as the instruments
are correlated with overqualification equation but must not be correlated to growth equation. In this paper, the data
we use allows us to identify two potential instruments at a region level - percent of married workers (permarried)
and labour market density per km square (labdesity). (Note 6) These instruments can capture spatial constraint and
size of the local labour market following previous studies (Frank, 1978; Büchel & Battu, 2003; Büchel & van Ham,
2003). Yet, there was still a correlation between the differenced lagged dependent variable and the disturbance
process (which is now a first-order moving average process, or MA(1)) where the former contains 𝑙𝑛𝑔𝑑𝑝𝑖,𝑡−1 and
the latter contains ∈𝑖,𝑡−1 , and will result in autocorrelation issue. To avoid this, the first-differenced lagged
dependent variable as in (2) is also instrumented with its past level.
Lastly, due to the T in this study was less than the N, we decided to run dynamic panel data (DPD) approach of
difference Generalised Method of Moments (GMM) estimator proposed by Arellano and Bond (1991). (Note 7) The
GMM-DPD estimator is given as (Gyimah-Brempong et al., 2006):
𝑌𝑖𝑡 = 𝛽1𝑋𝑖𝑡 + 𝛽2. 𝑊𝑖𝑡 + 𝑣𝑖𝑡 where 𝑣𝑖𝑡 = 𝑒𝑖𝑡 + 𝜇𝑖𝑡 (3)
where Xit includes strictly exogenous regressors, Wit was predetermined regressors (which may include lags of Y) and
endogenous regressors, all of which may be correlated with ui , the unobserved individual effect. First-differencing
the equation removes the ui and its associated omitted-variable bias. The equation in (3) uses all lagged values of
endogenous and predetermined variables as well as the current and lagged value of exogenous regressors as
instruments in the differenced equation. Apart from that, we also include perrried and labdensity to make the
endogenous variables pre-determined and, therefore, not correlated with the error term. By doing so, the method does
allow the exploitation of all information available in the sample and construct more efficient estimates of the
dynamic panel data model.
5. Empirical Findings
Table 3 presents the results of the initial three models of the extent to which aggoverq influences growth - Fixed
Effect (FE), Instrumental Variable Fixed Effect (IV-FE) and Generalised Method of Moment Fixed Effect
(GMM-FE). Before discussing the results, it should be noted that the series used in the study are stationeries based
on a variety of unit root test such as Levin-Lin-Chu, Augmented Dickey-Fuller, Breitung and Lm-Pesaran-Shin.
Moreover, Skewness- Kurtosis normality test for each regression suggest that the residual of error term for each term
is normally distributed. All regressions employed robust standard error to control for heteroscedasticity issue. (Note
8)

http://rwe.sciedupress.com Research in World Economy Vol. 10, No. 5; Special Issue, 2019
Published by Sciedu Press 147 ISSN 1923-3981 E-ISSN 1923-399X
Table 3. The effect of aggregate overqualification on state economic growth – FE IV-FE and GMM-FE
ln GDP per worker (lngdp) Model 1
(FE)
Model 2
(IV-FE)
Model 3
(GMM-FE)
Aggoverq (%) -0.0099 ** -0.0544 *** -0.0547 ***
(0.0050)
(0.0155)
(0.0155)
lngdpt-1 -0.5715 *** 0.5355 *** 0.5363 ***
(0.0562) (0.0732) (0.0731)
lncap 0.0011
0.0014
0.0016
(0.0024)
(0.0036)
(0.0035)
lnprimedu -0.1022 *** -0.1025 ** -0.1025 **
(0.0279)
(0.0403)
(0.0403)
ln secedu 0.3744 *** 0.4252 *** 0.4287 ***
(0.0739)
(0.0765)
(0.0760)
lnteredu 0.1850 *** 0.1626 ** 0.1605 **
(0.0417)
(0.0710)
(0.0708)
Year (2005= base year)
2006 -0.2219 *** -0.1233
-0.1248
(0.0444)
(0.0806)
(0.0805)
2007 -0.1774 *** -0.0921
-0.0947
(0.0391)
(0.0732)
(0.0729)
2008 -0.2233 *** -0.1225 ** -0.1240 **
(0.0354)
(0.0619)
(0.0618)
2009 -0.2180 *** -0.1031 * -0.1050 *
(0.0332)
(0.0595)
(0.0593)
2010 -0.1581 *** -0.0244
-0.0252
(0.0310)
(0.0597)
(0.0597)
2011 -0.1592 *** -0.1869 *** -0.1891 ***
(0.0240)
(0.0434)
(0.0431)
2012 -0.1314 *** -0.1309 *** -0.1323 ***
(0.0216)
(0.0361)
(0.0359)
2013 -0.1210 *** -0.1196 *** -0.1207 ***
(0.0191)
(0.0315)
(0.0314)
2014 -0.0781 *** -0.0560 ** -0.0568 **
(0.0171)
(0.0240)
(0.0239)
2015 -0.0620 *** -0.0294
-0.0292
(0.0157)
(0.0208)
(0.0208)
2016 -0.0574 *** -0.0760 *** -0.0767 ***
(0.0144)
(0.0190)
(0.0189)
Constant term 4.6386 ***
(0.5922)
N 180 180 180
No. of group 15
15
15
R-sq 0.8727
0.8046
0.8034
Adj R-sq 0.846
0.7623
0.7609
R-sq overall 0.2941
R-sq between 0.2818
R-sq within 0.8727
Rho (ρ) 0.9520
Log-likelihood 354.52 *** 315.963 *** 315.44 ***
Hansen J-statistic (p-value)
0.6961
0.6961
Sargan test (Chi-sq)
0.1526
0.1526
Hausman test (FE vs IV-FE and GMM-FE) 16.36 *** 34.35 ***
Note: ** and *** denote significant level at 0.05 and 0.01, respectively
Robust standard error in parenthesis

http://rwe.sciedupress.com Research in World Economy Vol. 10, No. 5; Special Issue, 2019
Published by Sciedu Press 148 ISSN 1923-3981 E-ISSN 1923-399X
Looking first at our main interest variable, there was a negative sign of aggoverq and statistically significantly
different from zero at 0.01 across models. The magnitude of the effect was much higher for the IV-FE and GMM-FE
models as compared to the FE model. Our Hansen J-statistic (0.6961) tests in both IV-FE and GMM-FE models
failed to reject hypothesis null of over-identification of all instruments. Similarly, the Sargan Hansen statistic test
(0.1526) also failed to reject the hypothesis null. Both tests indicating that all the instruments, i.e. permarried and
labdensity were valid. Furthermore, the Hausman specification tests revealed that the IV-FE and GMM-FE were
more efficient and appropriate than the FE for the growth models. Nevertheless, the negative sign indicated that the
existence of aggoverq in the labour market had an adverse impact on lncgdpt over the period of study. Yet, the
impact on the GDP was very small, i.e less than 0.1 percent. Other factors being held constant, an increase of one
percent in aggoverq led to a reduction in lngdpt by approximately 0.01 (e-0.0099
-1) percent using the FE model. (Note
9) When controlling for endogeneity of aggoverq, the growth penalty for having more overqualified workers
increase to about 0.0529 (e-0.0544
-1) and 0.0532 (e-0.0547
-1) percent, respectively using IV-FE and GMM-FE
estimators. These estimations were about five times higher than the FE model. This would suggest that the FE
estimator seems downwardly biased estimation, as it tends to underestimate the true impact of such incidence on
growth than the IV-FE ad GMM-FE.
Turning to other variables, there was a positive coefficient and significant of lag lngdpt-1 on lngdpt when using the FE
estimator (Model 1) indicating that a process of state convergence had occurred during the period under review.
Holding other factors constant, an increase of last year GDP (lngdpt-1) led a decrease in current GDP (lngdpt) by
roughly 0.57 percent. However, using the IV-FE and GMM-FE estimators, the lag lngdpt-1 turned out to be a positive
sign and statistically significant from zero at 0.01. This showed that a process of region divergence had occurred
during the period under review. Other factors being constant, for every percent increase in previous GDP led to an
increase of about 0.54 percent each for both IV-FE (Model 2) and GMM-FE (Model 3) estimators.
There was no significant impact of lncap on the GDP across the three models. The impacts of human capital
depended on workers’ actual educational level. The coefficient of lnprimedu was negative across the model and
statistically significantly different from zero at 0.01. The coefficients were range between -0.1022 and -0.1025. This
suggests that having more workers with primary education impair economic growth. Other factors being equal, one
percent increase in labour with primary education, GDP will decrease by an approximately 0.1 percent regardless of
model specification. By contrast, the coefficients of lnsecedu and lnteredu showed a positive sign and statistically
significant at the 1% level for each model. The magnitude of the impacts was much higher for the lnsecedu than for
the lnteredu. For example, under the GMM-FE, for every percent increase in the former, lngdpt will increase by
approximately 0.43 percent with the corresponding figure of 0.16 percent for the latter, ceteris paribus.
Lastly, the coefficients on all-time dummies were negative and statistically significant at a 0.01. Wald statistic to test
the null hypothesis that all-time dummy coefficients are jointly equal to zero rejects the null at a 0.01. The estimated
coefficients on the year dummies are consistent with the observation that GDP growth rates in Malaysia had declined
during the sample period relative to the reference year (2005).
We now turn to GMM-DPD results as presented in Table 4. There were two specifications examined in the first two
columns - basic model (Model 4) as outlined in equation (3) and the extended model, i.e. IV-DPD (Model 5) as we
expected the possibility of endogeneity of overqualification. Examining first the model fits, the Arellano-Bond test
for AR(1) and AR(2) following Arellano and Bond (1991) in both specifications were not statistically significant.
This indicated that both models were free from serial correlation in the first-differenced errors at order 1 and 2.
Sargan test statistics also failed to reject the null hypothesis, indicating that the overidentifying restrictions were
valid. Indeed, the Hausman test statistic rejects the null hypothesis that all regressors were exogenous at any
reasonable degree of confidence; therefore, the aggregate overqualification should be treated as endogenous rather
than exogenous.
Looking at to our main variable, both Model 4 and 5 showed the coefficients of aggoverq were still negative and
statistically significantly from zero at 0.01. This means that the negative impact of aggoverq on growth was still
there even after controlling for relevance instrument vectors. All in, the DPD regressions suggest both models were
well specified with the appropriate instrument vector. The magnitude of the effect was however smaller than the
Model 3. In particular, one percentage point increase in aggover, lngdpt will decrease by roughly 0.0338 (e-0.0344
-1)
for Model 4, all things equal. Controlling for extra instrumental variables for endogeneity of aggoverq, the growth
penalty as shown in Model 5 was further down to 0.0219 (e-0.022
-1). Our Hausman specification tests seem rejected
the null hypothesis, which suggested that the IV-DPP was the appropriate or more preferable estimator for the
growth equation than the previous model (Model 4).

http://rwe.sciedupress.com Research in World Economy Vol. 10, No. 5; Special Issue, 2019
Published by Sciedu Press 149 ISSN 1923-3981 E-ISSN 1923-399X
Moving to other variables, firstly, the impact of lncgdpt-1 on current GDP had turned out to be a negative sign but
significant for both models. Again, this means that that a process of state convergence had occurred during the period
under review. Meanwhile, the impact of lncap, lnprimedu, lnprimedu, and lnprimedu on growth did not change in
terms of sign. The coefficient of each educational level i.e.- lnprimedu, lnsecedu and lnteredu was a bit higher than in
Model 3 and this was noticeably for lnprimedu.
As described in Figure 1, the incidence of aggoverq was much higher even greater than the national level prior to
2010 whereas, after 2010, the incidence was much lower than the overall rate. Figure 2 and 3 furthermore showed
that the incidence was persistence in three developed states (Selangor, Kuala Lumpur and P. Pinang) throughout the
period of the study. Using two-sample t-test, we found the differences in aggoverq between the two periods and
between the groups of region were statistically significant at 0.01. (Note 10) Therefore, we might expect that the
negative impact of aggoverq on growth could be apparently prior to 2010 period and among states with a higher
proportion of overqualification. Model 6 (2005 – 2010) and Model 7 (2011 – 2017) in Table 4 presents the results of
IV-DPD. We should acknowledge that the Chow test for structural break analysis was carried out and the result (not
shown here but available upon request) rejected the null hypothesis of no structural break in the dataset at 0.05,
hence, quantified our approach. In line with Arellano and Bond (1991), both models failed to reject the null
hypothesis of serial correlation for AR(1) but not AR(2). This shows that error of second-order serial correlation is
stationary and the models do not have omitted variables (Andres & Vallelado, 2008) or the second lags of
endogenous variables were served as appropriate instruments for their current values (Baum, 2013). (Note 11)
Table 4. GMM Dynamic Panel (GMM DPD) Model of the effect of aggregate overqualification on state economic
growth
ln GDP per worker (lngdp) Model 4
(DPD)
Model 5
(IV-DPD)
Model 6
(IV-DPD)
Model 7
(IV-DPD)
Model 8
(IV-DPD)
Model 9
(IV-DPD)
Aggoverq (%) -0.0344 *** -0.0221 *** -0.0198 *** -0.0042 *** -0.0054
-0.0162 ***
(0.0051) (0.0051) (0.0072) (0.0016) (0.0034) (0.0047)
lngdpt-1 -0.1290 * -0.1231 ** -0. 2055
0.0874 *** 0. 1359 *** 0.4727 ***
(0.0676) (0. 0606) (0. 1609) (0. 0052) (0. 0258) (0.1147)
lncap -0.0011
-0.0009
0.0009
0.0013
0.0019
-0.0077
(0.0021) (0.0021) (0.0058) (0.0018) (0.0027) (0.0060)
lnprimedu -0.1620 *** -0.1578 *** -0.1274
-0.1566 *** -0.1921 *** -0.1146
(0.0340) (0.0339) (0.1193) (0.0238) (0.0395) (0.0674)
ln secedu 0.5501 *** 0.5528 *** -0.3351
0.6177 *** 0.4092 *** 0.4517 ***
(0.0726) (0.0726) (0.2136) (0.0609) (0.1014) (0.1405)
lnteredu 0.1940 *** 0.1982 *** -0.1293
0.2776 *** 0.2395 *** 0.2086 *
(0.0434) (0.0434) (0.1280) (0.0420) (0.0445) (0.1142)
Controlling for year Yes Yes -
-
Yes Yes
N 165 165 90 105 132 33
No. of group 15
15
15
15
12
3
Arellano-Bond test for AR(1) 0.7930
1.1523
-2.3522 ** -2.9712 ** -2.8148 *** -2.7157 ***
Arellano-Bond test for AR(2) 0.2645
0.297
-0.3290
0.8294
-1.0914
-0.9865
Hansen J-statistic (p-value) 0.4181
0.3496
0.796
0.674
0.425
0.286
Sargan test (Chi-sq) 9.2098
12.189
3.86
3.17
4.79
6.21
Hausman test (Chi-sq) 85.27 *** 43.39 *** 17.42 *** 6.48 27.75 ***
Note: ** and *** denote significant level at 0.05 and 0.01, respectively
Robust standard error in parenthesis

http://rwe.sciedupress.com Research in World Economy Vol. 10, No. 5; Special Issue, 2019
Published by Sciedu Press 150 ISSN 1923-3981 E-ISSN 1923-399X
In line with our prior expectation, the coefficient of aggoverq was again all negatives and statistically significantly
different from zero at 0.01 across both models. Yet, the magnitude of the effect was much larger for the Model 6
than for the Model 7. An increase of 1 percent of aggoverq, the current GDP will decline to roughly 0.02 percent for
Model 6 and much further down to 0.004 percent for Model 7, all things equal. This means that the negative impact
of aggoverq before 2010 was five times higher than that of 2010. To see whether there was a significant in the
coefficient between the two groups, we did run a joint Wald test of the equality of coefficient of aggoverq across
model following Clogg, Petkova, & Haritou (1995) and Paternoster, Profile, & Piquero (1998). The test rejected the
null hypothesis of equality, indicating the effect of aggoverq on lngdpt does not equal between the two groups.
Perhaps, lower proportion of aggoverq after 2010 play a role in reducing its negative impact on growth. Meanwhile,
the effect of workers’ actual educational attainment also varied between the two models as there was no significant
evidence of each level of education on growth observed in Model 6 as compared to Model 7 (all significant).
Model 8 and 9, respectively present the results for the low and high overqualification region groups. Again, it should
be noted that the Arellano-Bond test for AR(1) and AR(2), and both Sargan and Hausman tests were similar to the
previous two models, hence, the conclusion remains unchanged. With respect to our main variable, the coefficient of
aggoverq still negative in both models but the significant impact was observed only for the developed region (Model
9). Other factors being equal, a 10 percent increase in the aggoverq, the GDP will decrease by approximately 0.2
percent. This was an expected finding since the aggoverq was more persistent in those regions throughout the period
of study as compared to other regions (see Figure 3). Meanwhile, the coefficient of lngdpt-1 was positive and
significant, again for Model 9, indicating that there had a process of convergence occurred during the 13 periods
span in the region with higher proportion of aggoverq. Other results showed that the negative impact of lnprimedu
was evident for the region with lower proportion of aggoverq while the positive and significant impact of lnsecedu
and lnteredu were observed on both models.
6. Discussion and Conclusion
This study explored the incidence and the outcome of aggoverq among employed persons with at least a bachelor’s
degree qualification on economic growth across the region in Malaysia over the period 13 years horizon, from 2005
to 2017. Using the information available from the time-series labour force survey, the aggoverq was measured based
upon the difference between the share of aggregate professional occupation (level 2 ISCO-08) and the share of
workers with at least a bachelor’s degree qualification (level 6, 7 and 8 ISCED-97) in employment. Around 1.24
percent of workers were deemed overqualified every year. Although the incidence showed a persistence phenomenon
across state, the incidence was much higher Kuala Lumpur, Selangor and P. Pinang and much lower even negative in
Perak and Perlis. Indeed, the aggoverq seems a persistence phenomenon every year in these states as compared to
other states.
With respect to growth outcome, we carried out four model specifications to guarantee the robustness of the results,
i.e. – FE, IV-FE, GMM-FE and DPD. Regardless of any model employed, there was strong evidence of the negative
impact of aggoverq at local labour market on economic growth. As such, our results seem in line with findings from
Jaoul-Grammare & Guironnet (2009) and Sam (2018). The magnitudes of the effect were somewhat lower for the
GMM-DPD than other models. After a range of statistical tests performed, the DPD estimator seems more
appropriate than the IV-FE or GMM-FE estimators the growth equation.
Nonetheless, the negative impact of the overqualification on growth could be due to by the fact that such incidence
resulted in lower productivity at an individual level via lowering earnings (Hartog, 2000; McGuinness, 2006;
Leuven & Oosterbeek, 2011) and job satisfaction (Fleming & Kler, 2008; Sanchez-Sancheza, & McGuinness, 2015;
Di Paolo & Mañé, 2016). This might distract or demoralise other workers at the workplace, hence, may lead to lower
productivity at the firm level (Tsang, 1987; Battu & Zakariya, 2015). Furthermore, skill mismatch might be able to
lead to depreciation of skills along with rigidness among the mismatched in adapting to new technologies in the long
run (OECD, 2012; Keese, M., & Tan, 2013). These can adversely affect labour productivity at the aggregate level
(Quinn & Rubb, 2006; Guironnet and Peypoch, 2007; McGowan and Andrews, 2017; Adrian, Desislava, Ganev, &
Aleksiev, 2018). This productivity detrimental could be contagious at the macroeconomic level, hence lowering
economic growth.
As a robustness check, we run separately another two regressions by dividing the sample into two groups as we did
expect the effects of aggoverq could be visible prior to 2011 and in a state with a higher rate of aggregate
overqualification. The findings confirmed our expectation as we found the negative outcome of aggoverq on growth
was much higher prior 2011 period than the period of 2011 onwards. Moreover, we also found that the negative
impact of aggoverq was only evident in states with high overqualification rate (Kuala Lumpur, Selangor and P.

http://rwe.sciedupress.com Research in World Economy Vol. 10, No. 5; Special Issue, 2019
Published by Sciedu Press 151 ISSN 1923-3981 E-ISSN 1923-399X
Pinang). Indeed, the Hausman tests of the equality of the coefficients in the full and the truncated equation rejected
the null hypothesis of equality between the two sets of estimates which may indicate splitting the sample into two
different groups did not qualitatively alter our result that the present of overqualification in the labour market
significantly reduced the GDP growth (albeit for states with a lower proportion of aggoverq). Perhaps, lower growth
penalty prior to 2011 could be due to the volatility of the overqualification rate after 2010 than before the 2011
period. Nonetheless, a persistent phenomenon of aggregate overqualification observed for the entire sample in the
developed than less developed states may explain why such incidence had a negative and significant impact on
growth in the former than in the latter group.
Does the negative outcome of overqualification on growth reflect a waste of investment in higher education in
Malaysia? The answer could be “No” since the coefficient of lnteredu is always positively associated with growth
regardless of the method even controlling for aggoverq. This indicates that such incidence does not reflect wasteful
public investments and resources allocated to education, especially higher education sector. This is because of the
positive impacts of tertiary education always outnumber the negative impact of aggoverq. (Note 12) Moreover,
countries with higher levels of human capital tend to have greater economic growth than countries with lower levels
due to higher labour productivity (Mankiw, Romer, & Weil, 1992; Hanushek, Jamison, Jamison, & Woessman, 2008;
Breton, 2011; Hanushek & Wößmann, 2010; Hanushek, 2013), increase the innovative capacity of the economy
(Lucas, 1988; Romer, 1990, 1994) and transmission of knowledge and new technologies (Nelson & Phelps, 1966;
Benhabib & Spiegel, 1994; Hanushek et al., 2015). The findings from this paper may suggest that the growth may no
longer a function solely of the supply side (educational attainment of workers) as done in many studies (Yussof &
Zakariya, 2009; Hanushek, 2013; Amir, Khan, & Bilal, 2015; Dissou, Didic, & Yakautsava, 2016). Instead, the
growth might be treated as a function of both the demand, i.e.- job characteristics in which how workers are assigned
in their jobs and supply-side (attained education).
In summarising, the present of aggregate overqualification at local labour market may slow down the economy to
growth optimally as the state fails to make fully utilise the skills and knowledge among talented workers available in
the local labour market compared to if all the resources are fully exploited. Further research should be carried out to
examine the causality relationship between such variable and growth.
References
Abdullah, A.J., Doucouliagos, H., & Manning, E. (2014). Are regional incomes in Malaysia converging?. Papers in
Regional Science, 94, S69-S94. https://doi.org/10.1111/pirs.12105
Acemoglu, D., & Angrist, J. (2001). How large are human-capital externalities? Evidence from
compulsory-schooling laws. In NBER Macroeconomics Annual 2000, Volume 15 (pp. 9-74). MIT Press.
Adrian, N., Desislava, N., Ganev, P., & Aleksiev, Y. (2018). European Economic and Social Committee Skills
Mismatches-An Impediment to the Competitiveness of EU Businesses. https://doi.org/10.2864/448258
Ali, H., & Ahmad, S. (2009). Why poor regions remain poor? Evidence from Malaysia. International Review of
Business, 5(1), 340-351. Retrieved from
https://pdfs.semanticscholar.org/a4e5/b29d232bda0385d9f45956c59e79178bb04d.pdf
Ali, A. (2013). How to Differentiate between ‘Leadership’and ‘Management’Function in Organization: A Review of
Scholarly Thoughts. International Journal of Economics Business and Management Studies, 2(1), 38-44.
Amir, H., Khan, M., & Bilal, K. (2015). Impact of educated labor force on Economic growth of Pakistan: A human
capital perspective. European Online Journal of Natural and Social Sciences, 4(4), 814-831.
Andres, P. de, & Vallelado, E. (2008). Corporate governance in banking: The role of the board of directors. Journal
of Banking & Finance, 32(12), 2570-2580. https://doi.org/10.1016/J.JBANKFIN.2008.05.008
Anwar, S.M. (2016). Credit rating for small and medium enterprises: problems and prospects in Bangladesh. Journal
of Asian Business Strategy, 6(11), 234-245.
Arellano, M., & Bond, S. (1991). Some Tests of Specification for Panel Carlo Application to Data. Review of
Economic Studies, 58, 277-297.
Arts, M., Surinach, J., & Ramos, R. (2009). Regional Economic Growth and Human Capital: The Role of
Overeducation. IZA Discussion Paper.
Athukorala, P.C., & Narayanan, S. (2018). Economic corridors and regional development: The Malaysian experience.
World Development, 106, 1-14. https://doi.org/10.1016/j.worlddev.2018.01.009

http://rwe.sciedupress.com Research in World Economy Vol. 10, No. 5; Special Issue, 2019
Published by Sciedu Press 152 ISSN 1923-3981 E-ISSN 1923-399X
Battu, H., Belfield, C.R., & Sloane, P.J. (2004). Human capital spillovers in the workplace: evidence for the service
sector in Britain. International Journal of Manpower, 25(1), 123-138.
https://doi.org/10.1108/01437720410525036
Battu, H., & Zakariya, Z. (2015). Economics Overskilling and Overeducation. Discussion Paper in Economics No
15-20.
Baum, C.F. (2013). Dynamic Panel Data estimators. EC 823: Applied Econometrics. Boston College, Spring 2013.
Retrieved from http://fmwww.bc.edu/EC-C/S2013/823/EC823.S2013.nn05.slides.pdf
Belfield, C. (2010). Over-education: What influence does the workplace have?. Economics of Education Review,
29(2), 236-245. https://doi.org/10.1016/j.econedurev.2009.08.001
Benhabib, J., & Spiegel, M. (1994). The role of human capital in economic development evidence from aggregate
cross-country data. Journal of Monetary Economics, 34, 143-173.
Breton, T.R. (2011). The quality vs. the quantity of schooling: What drives economic growth?. Economics of
Education Review, 30(4), 765-773. https://doi.org/10.1016/j.econedurev.2011.01.005
Büchel, F. (2002). The effects of overeducation on productivity in Germany - The firms’ viewpoint. Economics of
Education Review, 21(3), 263-275. https://doi.org/10.1016/S0272-7757(01)00020-6
Büchel, F., & Battu, H. (2003). The Theory of Differential Overqualification: The Theory of Differential
Overqualification : Does it Work ?. Scottish Journal of Political Economy, 50(511), 1-16.
Büchel, F., & Ham, M. Van. (2002). Overeducation, Regional Labour Markets and Spatial Flexibility, (424).
Büchel, F., & van Ham, M. (2003). Overeducation, regional labor markets, and spatial flexibility. Journal of Urban
Economics, 53(3), 482-493. https://doi.org/10.1016/S0094-1190(03)00008-1
Cabus, S.J., & Somers, M.A. (2018). Mismatch between education and the labour market in the Netherlands: is it a
reality or a myth? The employers’ perspective. Studies in Higher Education, 43(11), 1854-1867.
https://doi.org/10.1080/03075079.2017.1284195
Cedefop. (2015). Skills, qualifications and jobs in the EU: the making of a perfect match?. Luxembourg:
Publications Office of the European Union. https://doi.org/10.1039/C6GC02270G
Chiswick, B.R., & Miller, P.W. (2010). Economics of Education Review Does the choice of reference levels of
education matter in the ORU earnings equation ?. Economics of Education Review, 29(6), 1076-1085.
https://doi.org/10.1016/j.econedurev.2010.06.001
Clogg, C.C., Petkova, E., & Haritou, A. (1995). Statistical Methods for Comparing Regression Coefficients Between
Models. American Journal of Sociology, 100(5), 1261-1293. https://doi.org/10.1086/230638
Cuadras-Morató, X., & Mateos-Planas, X. (2013). Overeducation and skill-biased technical change. B.E. Journal of
Macroeconomics, 13(1), 105-122. https://doi.org/10.1515/bejm-2013-0020
Di Paolo, A., & Mañé, F. (2016). Misusing our talent? Overeducation, overskilling and skill underutilisation among
Spanish PhD graduates. Economic and Labour Relations Review, 27(4), 432-452.
https://doi.org/10.1177/1035304616657479
Dissou, Y., Didic, S., & Yakautsava, T. (2016). Government spending on education, human capital accumulation,
and growth. Economic Modelling, 58, 9-21. https://doi.org/10.1016/j.econmod.2016.04.015
European Commission. (2015). Measuring Skill Mismatch. Analytical web note 7/2015 (Analytical). European
Comission. https://doi.org/10.2767/620480
EuroStat. (2016). Statistical approaches to the measurement of skills 2016 edition. Luxembourg.
Fleming, C.M., & Kler, P. (2008). I’m too clever for this job: a bivariate probit analysis on overeducation and job
satisfaction in Australia. Applied Economics, 40(9), 1123-1138. https://doi.org/10.1080/00036840600771254
Frank, R.H. (1978). American Economic Association Why Women Earn Less: The Theory and Estimation of
Differential Overqualification. The American Economic Review, 68(3), 360-373.
Frenette, M. (2000). Overqualified? Recent graduates and the needs of their employers. Education Quarterly Review,
7(1), 6.
Fu, S. (2007). Smart Café Cities: Testing human capital externalities in the Boston metropolitan area. Journal of
Urban Economics, 61(1), 86-111. https://doi.org/10.1016/j.jue.2006.06.002
http://rwe.sciedupress.com Research in World Economy Vol. 10, No. 5; Special Issue, 2019
Published by Sciedu Press 153 ISSN 1923-3981 E-ISSN 1923-399X
Groot, W., & van den Brink, H.M. (2007). Overeducation in the labour market. In Human Capital: Advances in
Theory and Evidence (Vol. 20, pp. 101-112). https://doi.org/10.1017/CBO9780511493416.008
Guironnet, J.-P., & Peypoch, N. (2007). Human capital allocation and overeducation: A measure of French
productivity (1987, 1999). Economic Modelling, 24(3), 398-410.
https://doi.org/10.1016/j.econmod.2006.09.003
Guironnet, J-P., & Jaoul-Grammare, M. (2007). Educational Mismatches , Wages and Economic Growth: A Causal
Analysis for the French Case since 1980. LAMETA Document de Recherche, 07-03.
Gyimah-Brempong, K., Paddison, O., & Mitiku, W. (2006). Higher education and economic growth in Africa.
Journal of Development Studies, 42(3), 509-529. https://doi.org/10.1080/00220380600576490
Hanushek, E.A. (2013). Economic growth in developing countries: The role of human capital. Economics of
Education Review, 37, 204-212. https://doi.org/10.1016/j.econedurev.2013.04.005
Hanushek, E.A., Jamison, D.T., Jamison, E.A., & Woessman, L. (2008). Education and Economic Growth: It’s not
just going to school, but learning there while there that matters. Education Next, 8(2), 62-71.
Hanushek, E.A., Schwerdt, G., Wiederhold, S., & Woessmann, L. (2015). Returns to skills around the world:
Evidence from PIAAC. European Economic Review, 73, 103-130.
https://doi.org/10.1016/j.euroecorev.2014.10.006
Hartog, J. (1988). Education, Allocation and Earnings in the Netherlands. Overschooling, 7(2).
Hartog, J. (2000). Over-education and earnings: Where are we, where should we go?. Economics of Education
Review, 19(2), 131-147. https://doi.org/10.1016/S0272-7757(99)00050-3
Hensen, M.M., de Vries, M.R., & Cörvers, F. (2009). The role of geographic mobility in reducing education-job
mismatches in the Netherlands. Papers in Regional Science, 88(3), 667-682.
https://doi.org/10.1111/j.1435-5957.2008.00189.x
Hilkevics, S., & Semakina, V. (2019). The classification and comparison of business ratios analysis methods.
Insights into Regional Development, 1(1), 48-57.
Hutchinson, F.E. (2017). Evolving Paradigms in Malaysia’s Regional Development Policy. Journal of Southeast
Asian Economies, 34(3), 462-487. https://doi.org/10.1355/ae34-3c
Hussain, H.I., Abidin, I.S.Z., Ali., A., & Kamarudin, F. (2018). Debt Maturity and Family Related Directors:
Evidence from a Developing Market. Polish Journal of Management Studies, 18(2), 118-134.
International Monetary Fund. (2018). Malaysia: Selected Issues, Country Report No. 18/62, March 2018, 18/62(18),
0-26. Retrieved from file:///C:/Users/Lenovo/Downloads/cr1862.pdf
Jaoul-Grammare, M., & Guironnet, J.P. (2009). Does over-education influence French economic growth?.
Economics Bulletin, 29(2), 1190-1200.
Jones, M.K., Jones, R.J., Latreille, P.L., & Sloane, P.J. (2009). Training, Job Satisfaction, and Workplace
Performance in Britain: Evidence from WERS 2004. Labour, 23(2009), 139-175.
https://doi.org/10.1111/j.1467-9914.2008.00434.x
Kampelmann, S., & Rycx, F. (2012). The impact of educational mismatch on firm productivity: Evidence from
linked panel data. Economics of Education Review, 31(6), 918-931.
Kandhro, D., & Pathrannarakul, P. (2013). The role of technology in enhancing transparency and accountability in
public sector organizations of Pakistan. International Journal of Economics Business and Management Studies,
2(1), 20-24.
Karimi, M.S., Yusop, Z., & Law, S.H. (2010). Regional development disparities in Malaysia. Journal of American
Science, 6(3), 70-78. Retrieved from
http://www.sciencepub.net/american/am0603/10_2063_Regional_am0603_70_78.pdf
Keese, M., & Tan, J.P. (2013). Indicators of Skills for Employment and Productivity: A Conceptual Framework and
Approach for Low-Income Countries.
Kim, H.K., & Park, S.J. (2016). Do Skill Mismatches Create a Wage Penalty ? Alternative Estimates for Korea.
Asian Economic Journal, 30(3), 295-316. https://doi.org/10.1111/asej.12093
Lee, H., Lee, J.W., & Song, E. (2016). Effects of Educational Mistmatch on Wages in the Korean Labor Market.

http://rwe.sciedupress.com Research in World Economy Vol. 10, No. 5; Special Issue, 2019
Published by Sciedu Press 154 ISSN 1923-3981 E-ISSN 1923-399X
Asian Economic Journal, 30(4), 375-400. https://doi.org/10.1111/asej.12105
Leuven, E., & Oosterbeek, H. (2011). Overeducation and mismatch in the labor market. Handbook of the Economics
of Education Review, (5523), 1-56. https://doi.org/http://dx.doi.org/10.1016/B978-0-444-53444-6.00003-1
Liu, Z. (2007). The external returns to education: Evidence from Chinese cities. Journal of Urban Economics, 61(3),
542-564. https://doi.org/10.1016/j.jue.2006.08.007
Lucas, R.E. (1988, February). On the mechanics of econ dev. Journal of Monetary Economics, 22, 3-42.
https://doi.org/10.1016/0304-3932(88)90168-7
Mahy, B., Rycx, F., & Vermeylen, G. (2015). Educational Mismatch and Firm Productivity : Do Skills , Technology
and Uncertainty Matter ?. De Economist, 163(2), 233-262. https://doi.org/10.1007/s10645-015-9251-2
Mansor, N.H., & Ilias, A. (2013). Goods and services tax (GST): A new tax reform in Malaysia. International
Journal of Economics Business and Management Studies, 2(1), 12-19.
Malaysia. (2016). Eleven Malaysia Plan. Kuala Lumpur: Percetakan Nasional berhad.
Mcgoldrick, K., & Robst, J. (1996). Gender differences in overeducation: a test of the theory of differential
overqualification. The American Economic Review, 86(2), 280-284.
McGowan, M.A., & Andrews, D. (2017). Labor Market Mismatch and Labor Productivity: Evidence from PIAAC
Data. Research in Labour Economics. In Skill Mismatch in Labor Markets, (Vol. 45, pp. 199-241). Emerald
Publishing Ltd.
McGuinness, S., & Sloane, P.J. (2011). Labour market mismatch among UK graduates: An analysis using REFLEX
data. Economics of Education Review, 30(1), 130-145. https://doi.org/10.1016/j.econedurev.2010.07.006
Ministry of Higher Education Malaysia. (2018). Higher Education Statistics 2017. Putrahaya.
Mohamed Noor, N.F., Zakariya, Z., Rambeli, N., & Razak, A.A. (2017). Externalities of Colleagues’ Human Capital
Accumulation and Individual Wages: Empirical Evidence from the Malaysian Service Sector. International
Journal of Human Resource Studies, 7(1), 192-212. https://doi.org/10.5296/ijhrs.v7i1.10789
Moretti, E. (2004a, April). Human capital externalities in cities. Handbook of Regional and Urban Economics, 4,
2243-2291. Retrieved from http://www.sciencedirect.com/science/article/pii/S1574008004800087
Moretti, E. (2004b). Workers’ education, spillovers, and productivity: evidence from plant-level production functions.
American Economic Review, 94(3), 656-690. Retrieved from http://www.jstor.org/stable/3592947
Nelson, R.R., & Phelps, E.S. (1966). Investment in humans, technological diffusion, and economic growth. The
American Economic Review, 69-75.
OECD. (2012). Better Skills, Better Jobs, Better Lives: A Strategic Approach to Skills Policies. OECD Publishing.
https://doi.org/10.1787/9789264177338-en
Osman, Z., & Sentosa, I. (2013). Mediating effect of customer satisfaction on service quality and customer loyalty
relationship in Malaysian rural tourism. International Journal of Economics Business and Management Studies,
2(1), 25-37.
Paternoster, R., Profile, S., & Piquero, A.R. (1998). Using the Correct Statistical Test for Equality of Regression
Coefficients. Criminology, 36(4), 859-866. https://doi.org/10.1111/j.1745-9125.1998.tb01268.x
Pechancová, V., Hrbáčková, L., Dvorský, J., Chromjaková, F., & Stojanovic, A. (2019). Environmental management
systems: an effective tool of corporate sustainability. Entrepreneurship and Sustainability Issues, 7(2), 825-841.
Philipp, G. (2016). The impact of overeducated and undereducated workers on establishment-level productivity: First
evidence for Germany. International Journal of Manpower, 37(2), 372-392.
Quinn, M.A., & Rubb, S. (2006). Mexico’s labor market: The importance of education-occupation matching on
wages and productivity in developing countries. Economics of Education Review, 25(2), 147-156.
https://doi.org/10.1016/j.econedurev.2005.01.003
Ragayah, H.M.Z. (2008). Income Inequality in Malaysia. Asian Economic Policy Review, 3(1), 114-132.
https://doi.org/10.1111/j.1748-3131.2008.00096.x
Ramos, R., Surinach, J., & Artís, M. (2012). Regional Economic Growth and Human Capital: The Role of
Over-education. Regional Studies, 46(10), 1389-1400. https://doi.org/10.1080/00343404.2012.675140

http://rwe.sciedupress.com Research in World Economy Vol. 10, No. 5; Special Issue, 2019
Published by Sciedu Press 155 ISSN 1923-3981 E-ISSN 1923-399X
Romer, P.M. (1990). Endogenous Technological Change. Journal of Political Econom, 98(5), 71-102.
https://doi.org/10.1093/acprof:osobl/9780199663897.003.0004
Romer, P.M. (1994). The Origins of Endogenous Growth. Journal of Economic Perspectives, 8(1), 3-22.
https://doi.org/10.1257/jep.8.1.3
Roodman, D. (2006). How to do xtabond2: An introduction to difference and system GMM in Stata. The Stata
Journal, 6(1), 86-136. Retrieved from http://www.stata-journal.com/article.html?article=st0159
Saari, M.Y., Dietzenbacher, E., & Los, B. (2014). Income Distribution across Ethnic Groups in Malaysia: Results
from a New Social Accounting Matrix. Asian Economic Journal, 28(3), 259-278.
https://doi.org/10.1111/asej.12036
Sam, V. (2018). Overeducation among graduates in developing countries: What impact on economic growth?. MPRA
Paper No. 87674. https://doi.org/10.3109/15368378209040332
Sambo, A.S., & Lucky, A.O. (2016). Undergraduates Perception and Utilization of Serial Materials in Federal
University of Petroleum Resources Library. American Journal of Social Sciences and Humanities, 1(1), 1-9.
Sánchez-Sánchez, N., & Mcguinness, S. (2013). Decomposing the impacts of overeducation and overskilling on
earnings and job satisfaction: An analysis using REFLEX data. Education Economics, 23(4), 419-432.
https://doi.org/10.1080/09645292.2013.846297
Sand, B.M. (2013). A re-examination of the social returns to education: Evidence from U.S. cities. Labour
Economics, 24, 97-106. https://doi.org/10.1016/j.labeco.2013.07.001
Sloane, P. (2003). Much ado about nothing? What does the overeducation literature really tell us?. In F. Buchel, A.
de Grip, & A. Mertens (Eds.), Overeducation in Europe: Current Issues in Theory and Policy (pp. 11-49).
Cheltenham: Edward Elgar.
Sloane, P.J., Battu, H., & Seaman, P.T. (1996). Overeducation and the formal education/experience and training
trade-off. Applied Economics Letters, 3(8), 511-515. https://doi.org/10.1080/135048596356131
Tsang, M.C. (1987). The impact of underutilization of education on productivity: A case study of the US Bell
companies. Economics of Education Review, 6(3), 239-254.
Verhaest, D., & Omey, E. (2006). The Impact of Overeducation and its Measurement. Social Indicators Research,
77(3), 419-448. https://doi.org/10.1007/s11205-005-4276-6
Verhaest, D., & Verhofstadt, E. (2016). Overeducation and job satisfaction : the role of job demands and control.
International Journal of Manpower, 37(3), 456-473. https://doi.org/10.1108/IJM-04-2014-0106
Vlasov, P., & Kiseleva, A. (2017). Ideology and Distortions of the Entrepreneurial Concept. The Results of Conflict
in Organizational Culture. International Journal of Emerging Trends in Social Sciences, 1(2), 90-96.
Yussof, I., & Kasim, M.Y. (2003). Human Resource Development and Regional Cooperation Within Bimp-Eaga:
Issues and future directions. Asia-Pacific Development Journal, 10(2), 41-56.
Yussof, I., & Zakariya, Z. (2009). Economic growth and higher education demand in Malaysia. Jurnal Ekonomi
Malaysia, 43(1).
Zakariya, Z. (2014). The Effects of Over, Required and Under-Education on Earnings in Manufacturing Sector in
Malaysia. International Journal of Management Studies, 21(1), 83-109.
Zakariya, Z. (2017). Job Mismatch and On-the-job Search Behavior Among University Graduates in Malaysia. Asian
Economic Journal, 31(4), 355-379. https://doi.org/10.1111/asej.12135
Zakariya, Z., Abdul, N., Khoo, J., Yin, Y., Fazlin, N., & Noor, M. (2017). The Incidence and the Effect of
Overskilling on Individuals’ Wages in Malaysia: A Quantile Regression Approach (Insiden dan Kesan Terlebih
Kemahiran ke atas Upah Individu di Malaysia: Satu Pendekatan Regresi Kuantil). Jurnal Ekonomi Malaysia,
51(1), 39-54. https://doi.org/10.17576/JEM-2017-5001-4
Zakariya, Z., & Battu, H. (2013). The Effects of Overeducation on Multiple Job Satisfaction Towards Enhancing
Individuals' Well-Being in Malaysia. Business and Management Quarterly Review, 4, 38-51.
http://rwe.sciedupress.com Research in World Economy Vol. 10, No. 5; Special Issue, 2019
Published by Sciedu Press 156 ISSN 1923-3981 E-ISSN 1923-399X
Notes
Note 1. At individual level, overeducation and over-skilling tend to reduce workers’ own earnings (Kim & Park,
2016; Lee, Lee, & Song, 2016), decreasing in job satisfaction level (Verhaest & Omey, 2006; Fleming & Kler, 2008;
Di Paolo & Mañé, 2016; Verhaest & Verhofstadt, 2016) and higher job turnover (Zakariya, 2017). For positive
impacts, overeducation is found to improve firm level productivity (Jones, Jones, Latreille, & Sloane, 2009;
Kampelmann & Rycx, 2012; Mahy, Rycx, & Vermeylen, 2015; Philipp Grunau, 2016).
Note 2. Wald (2004) for example, estimated that the incidence of over-qualification in the labour market could cost
by approximately 2 percent or $20 billion reduction in the Canadian Gross Domestic Product (GDP) due to lower
earnings outcomes among the mismatched workers, hence, lower tax revenues.
Note 3. It should be acknowledged that the choice of 2005 as a starting period because both Y and K variables were
not available online prior to 2005.
Note 4. It should be noted that data on capital formation was not available across state, hence, the variable K was
measured using capital investment received by state following Gyimah-Brempong, Paddison and Mitiku (2006)
Note 5. Since 𝐸𝑇,𝑡 = 𝑂𝑇,𝑡, equation in (2a) can be simplified as below:
𝐴𝑔𝑔𝑟𝑒𝑔𝑎𝑡𝑒 𝑂𝑣𝑒𝑟 − 𝑞𝑢𝑎𝑙𝑖𝑓𝑖𝑐𝑎𝑡𝑖𝑜𝑛 (𝐴𝑂𝑄𝑡,𝑠) = |𝐸𝑡𝑒𝑟,𝑡,𝑠 − 𝑂𝑝𝑟𝑜𝑓,𝑡,𝑠
𝐸𝑇,𝑡,𝑠
|
Note 6. As noted earlier, if local labour market has greater married employed person, this may suggest that married
workers could face a mobility constraint, particularly among the dual income earners, hence, greater risk of being
overqualified. Labour market density refers to number of workers per km square for each state and it is calculated as
number of workers for each state divided by state’s size (in km square). State with greater density may increase the
workers’ probability of being in well-matched job due to greater number of job available as compared to low-density
state.
Note 7. Arellano and Bond (1991) argue that in large-T panels a shock to the country’s fixed effect (the error term)
will decline with time. Similarly, the correlation of the lagged dependent variable with the error term will be
insignificant (Roodman, 2006).
Note 8. Results for unit-root tests and a series of diagnostic test are available upon request.
Note 9. Since the aggoverq is not in logarithmic form, the percentage point effect (PE) is obtained using the
following formula:
PE = (eβ – 1) x 100, where β is the coefficient estimate.
The percentage point effect will be used throughout the discussion in this study. Instead, the coefficients of other
variables represent the elasticity values.
Note 10. Results for t-test are available upon request.
Note 11. Sargan and Hausman test statistics respectively also failed to reject the null hypothesis, indicating that the
overidentifying restrictions were valid and all regressors were exogenous at any reasonable degree of confidence.
Note 12. This is the conclusion after we run a Wald-test of whether coefficient of lnteredu and aggover are
simultaneously equal to zero across model. The test tends to reject the null hypothesis, indicating that the including
these variables create a statistically significant improvement in the fit of the model.