regional economic impact of philadelphia … · final final report – march 2017 final report...
TRANSCRIPT
FINAL REPORT – March 2017
FINAL REPORT SUBMITTED TO: Philadelphia International Airport
FINAL REPORT SUBMITTED BY: Econsult Solutions, Inc.
1435 Walnut Street, 4th Floor
Philadelphia, PA 19102
REGIONAL ECONOMIC
IMPACT OF PHILADELPHIA
INTERNATIONAL AIRPORT
Econsult Solutions | 1435 Walnut Street, Ste. 400 | Philadelphia, PA 19102 | 215.717.2777 | econsultsolutions.com
ii REGIONAL ECONOMIC IMPACT OF PHILADELPHIA INTERNATIONAL AIRPORT | FINAL
TABLE OF CONTENTS Table of Contents............................................................................................................................. ii
Executive Summary ........................................................................................................................ iv
1.0 Introduction and Methodology ........................................................................................ 12
About Philadelphia International Airport (PHL) ..................................................... 12 1.1
1.1.1 Airport Service Area .................................................................................................. 12
1.1.2 Airport Facilities .......................................................................................................... 14
1.1.3 Flight Activity .............................................................................................................. 17
The Economic Importance of the Airport to the Region ..................................... 19 1.2
Economic and Fiscal Impact Methodology .......................................................... 20 1.3
1.3.1 Data and Methods for Estimating Direct Economic Activity ............................... 20
1.3.2 Input-Output Modeling ............................................................................................. 21
1.3.3 Fiscal Impacts ............................................................................................................. 23
1.3.4 Comparability with Previous Analysis ...................................................................... 23
1.3.5 About Econsult Solutions, Inc. .................................................................................. 26
2.0 Capital Investments ............................................................................................................ 27
Direct Capital Investments ....................................................................................... 27 2.1
Regional Economic Impact from Capital Investments ........................................ 30 2.2
Implications of Onsite Capital Investments ............................................................ 31 2.3
3.0 Aviation Division Operations.............................................................................................. 33
Direct Aviation Division Operating Expenditures ................................................... 33 3.1
Economic Impact from Aviation Division Operations .......................................... 34 3.2
Implications of Aviation Division Operating Impact ............................................. 35 3.3
4.0 Airline Operations ................................................................................................................ 37
Direct Airline Operating Expenditures ..................................................................... 39 4.1
Economic Impact from Airline Operations ............................................................ 41 4.2
Implications of Airline Operations ............................................................................ 42 4.3
5.0 Airport-Related Operations ............................................................................................... 44
Direct Airport-Related Operating Expenditures .................................................... 44 5.1
5.1.1 Government ............................................................................................................... 45
5.1.2 Onsite Retail ................................................................................................................ 46
5.1.3 Parking ......................................................................................................................... 46
5.1.4 Ground Transportation .............................................................................................. 47
5.1.5 Hospitality .................................................................................................................... 47
5.1.6 General Aviation ........................................................................................................ 48
5.1.7 Cargo, Freight and Mail ............................................................................................ 48
5.1.8 Office and Commercial ........................................................................................... 49
5.1.9 Aviation Manufacturing ............................................................................................ 50
Economic Impact from Airport-Related Operations ............................................ 51 5.2
Implications of Airport-Related Operatng Activity ............................................... 52 5.3
Econsult Solutions | 1435 Walnut Street, Ste. 400 | Philadelphia, PA 19102 | 215.717.2777 | econsultsolutions.com
iii REGIONAL ECONOMIC IMPACT OF PHILADELPHIA INTERNATIONAL AIRPORT | FINAL
6.0 Regional Tourism ................................................................................................................. 53
Direct Regional Tourism Expenditures Attributable to the Airport ....................... 53 6.1
6.1.1 Visitor Spending .......................................................................................................... 53
6.1.2 Travel Arrangement Industry .................................................................................... 55
Economic Impact from Regional Tourism .............................................................. 56 6.2
Implications of Regional Tourism Activity ............................................................... 57 6.3
7.0 Resident Travel Benefits ...................................................................................................... 58
Resident Travel Time and Cost Savings ................................................................... 58 7.1
Economic Impact from Resident Travel Benefits ................................................... 61 7.2
Implications from Resident Travel Benefits ............................................................. 62 7.3
8.0 Catalytic Economic Growth Effects ................................................................................. 63
Trade Activity and Connections .............................................................................. 63 8.1
Business Location and Investment .......................................................................... 64 8.2
Business Efficiency and Productivity ........................................................................ 65 8.3
Empirical Connection Between Air Service and Economic Growth .................. 66 8.4
Implications of Catalyic Effects ............................................................................... 67 8.5
9.0 Aggregate Economic and Fiscal Impact........................................................................ 68
Aggregate Economic Impact ................................................................................. 68 9.1
Economic Impact by Geography ........................................................................... 69 9.2
Industry Distribution of Aggregate Employment Impact ..................................... 70 9.3
Aggregate Fiscal Impact.......................................................................................... 71 9.4
Conclusion .................................................................................................................. 72 9.5
Appendix A – Detailed Economic and Fiscal Impact Methodology ........................................ i
Appendix B – Additional Detail on Airport-Related Operations Calculations ....................... iv
Appendix C – Additional Detail on Regional Tourism Expenditure Calculations ................. xiii
Appendix D – Additional Detail on Resident Travel Time and cost Savings Calculation .. xxii
Appendix E – Additional Detail on Modeling the Distribution of Economic Activity by
County .......................................................................................................................................... xxvi
Appendix F – Economic Impact Results by County and State ............................................. xxx
Econsult Solutions | 1435 Walnut Street, Ste. 400 | Philadelphia, PA 19102 | 215.717.2777 | econsultsolutions.com
iv REGIONAL ECONOMIC IMPACT OF PHILADELPHIA INTERNATIONAL AIRPORT | FINAL
EXECUTIVE SUMMARY
This report describes and quantifies multiple dimensions of economic and fiscal impact from the
Airport System consisting of Philadelphia International Airport (“PHL”) and the Northeast
Philadelphia Airport (“PNE”) on the Philadelphia region. PHL and PNE are owned by the City of
Philadelphia and operated by the City’s Division of Aviation on a self-sustaining basis without any
local tax dollars. PHL serves more than 30 million commercial passengers annually, and offers
approximately 500 daily flights to more than 120 national and international non-stop destinations.
The economic benefits enabled by PHL can be conceptualized as starting with direct onsite
activity and radiating outwards to the entire Greater Philadelphia region:
Narrowly, PHL is a center of significant direct economic activity and employment as
initiators of capital investments and as transportation service providers.
More broadly, a number of supporting and related industries (including logistics, personal
transportation, hospitality and retail) are located in close proximity to the airport and
themselves generate significant economic activity that would not occur but for the airport.
Broader still, the entire regional population and regional economy benefits from the
transportation connections facilitated by the airport, which enables people and dollars to
flow into the region and serves a crucial role in the economic competitiveness of the
metropolitan area.
PHL is thus both an essential quality of life amenity and a vital economic driver for the
Philadelphia region.
Aggregate Economic Impact
This report quantifies the direct and indirect economic activity attributable to PHL on an annual
basis within the 11-county Philadelphia Metropolitan Statistical Area (MSA). This direct activity
includes not only operations and capital investments of the airport and its tenants (notably
airlines, retailers, freight forwarders, etc.) but also portions of related activity utilizing the airport
as part of its business platform (including tourism, aviation manufacturing, ground transportation,
etc.). Standard input-output modeling techniques are then used to estimate the indirect (supply
chain) and induced (labor income) impacts of this direct activity.
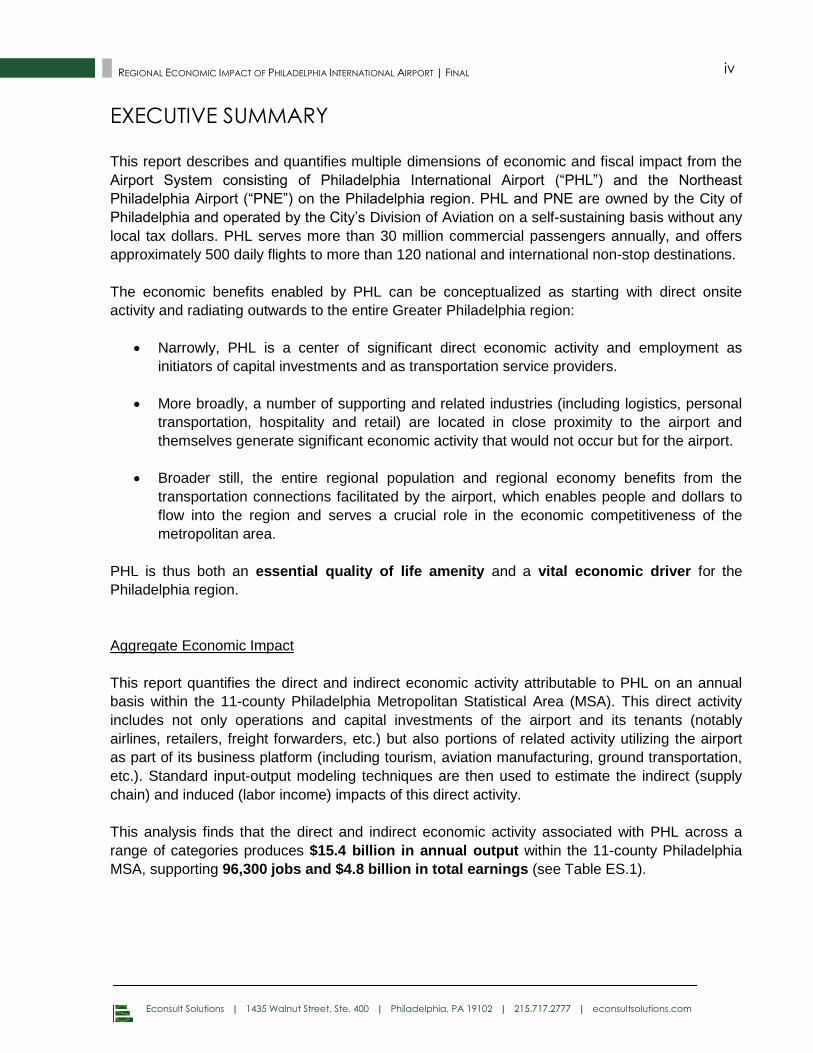
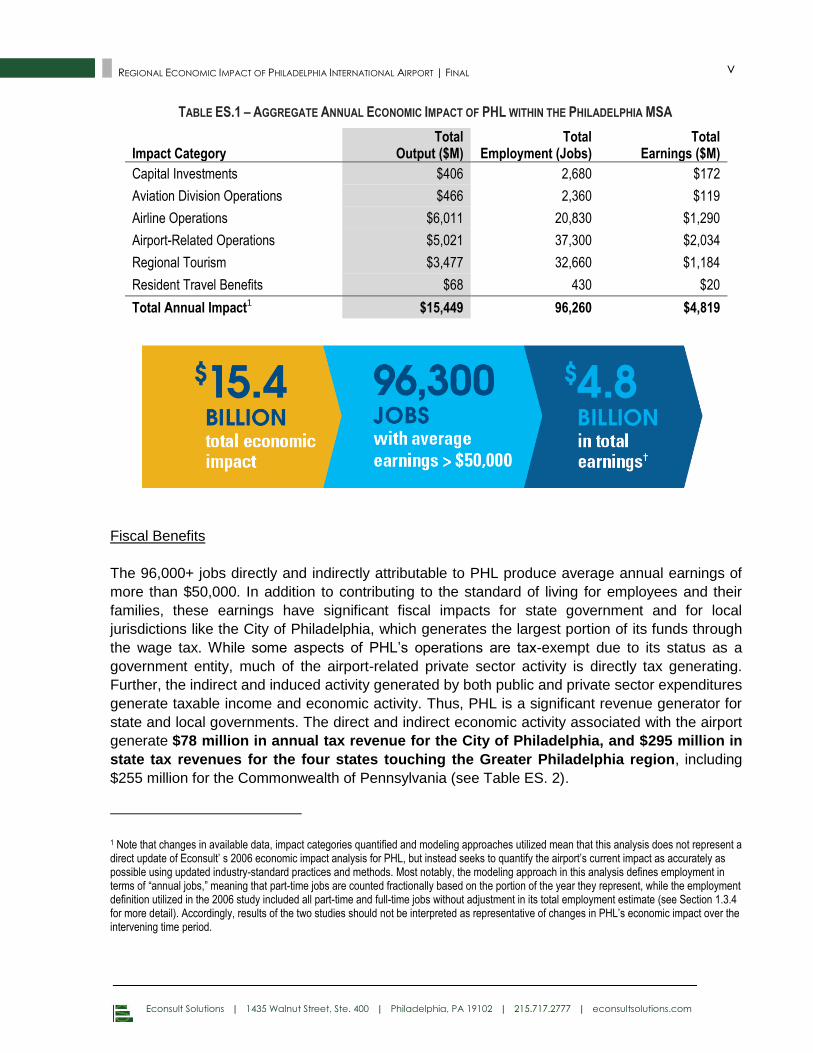
This analysis finds that the direct and indirect economic activity associated with PHL across a
range of categories produces $15.4 billion in annual output within the 11-county Philadelphia
MSA, supporting 96,300 jobs and $4.8 billion in total earnings (see Table ES.1).
Econsult Solutions | 1435 Walnut Street, Ste. 400 | Philadelphia, PA 19102 | 215.717.2777 | econsultsolutions.com
v REGIONAL ECONOMIC IMPACT OF PHILADELPHIA INTERNATIONAL AIRPORT | FINAL
TABLE ES.1 – AGGREGATE ANNUAL ECONOMIC IMPACT OF PHL WITHIN THE PHILADELPHIA MSA
Impact Category Total
Output ($M) Total
Employment (Jobs) Total
Earnings ($M)
Capital Investments $406 2,680 $172
Aviation Division Operations $466 2,360 $119
Airline Operations $6,011 20,830 $1,290
Airport-Related Operations $5,021 37,300 $2,034
Regional Tourism $3,477 32,660 $1,184
Resident Travel Benefits $68 430 $20
Total Annual Impact1 $15,449 96,260 $4,819
Fiscal Benefits
The 96,000+ jobs directly and indirectly attributable to PHL produce average annual earnings of
more than $50,000. In addition to contributing to the standard of living for employees and their
families, these earnings have significant fiscal impacts for state government and for local
jurisdictions like the City of Philadelphia, which generates the largest portion of its funds through
the wage tax. While some aspects of PHL’s operations are tax-exempt due to its status as a
government entity, much of the airport-related private sector activity is directly tax generating.
Further, the indirect and induced activity generated by both public and private sector expenditures
generate taxable income and economic activity. Thus, PHL is a significant revenue generator for
state and local governments. The direct and indirect economic activity associated with the airport
generate $78 million in annual tax revenue for the City of Philadelphia, and $295 million in
state tax revenues for the four states touching the Greater Philadelphia region, including
$255 million for the Commonwealth of Pennsylvania (see Table ES. 2).
1 Note that changes in available data, impact categories quantified and modeling approaches utilized mean that this analysis does not represent a direct update of Econsult’ s 2006 economic impact analysis for PHL, but instead seeks to quantify the airport’s current impact as accurately as possible using updated industry-standard practices and methods. Most notably, the modeling approach in this analysis defines employment in terms of “annual jobs,” meaning that part-time jobs are counted fractionally based on the portion of the year they represent, while the employment definition utilized in the 2006 study included all part-time and full-time jobs without adjustment in its total employment estimate (see Section 1.3.4 for more detail). Accordingly, results of the two studies should not be interpreted as representative of changes in PHL’s economic impact over the intervening time period.
Econsult Solutions | 1435 Walnut Street, Ste. 400 | Philadelphia, PA 19102 | 215.717.2777 | econsultsolutions.com
vi REGIONAL ECONOMIC IMPACT OF PHILADELPHIA INTERNATIONAL AIRPORT | FINAL
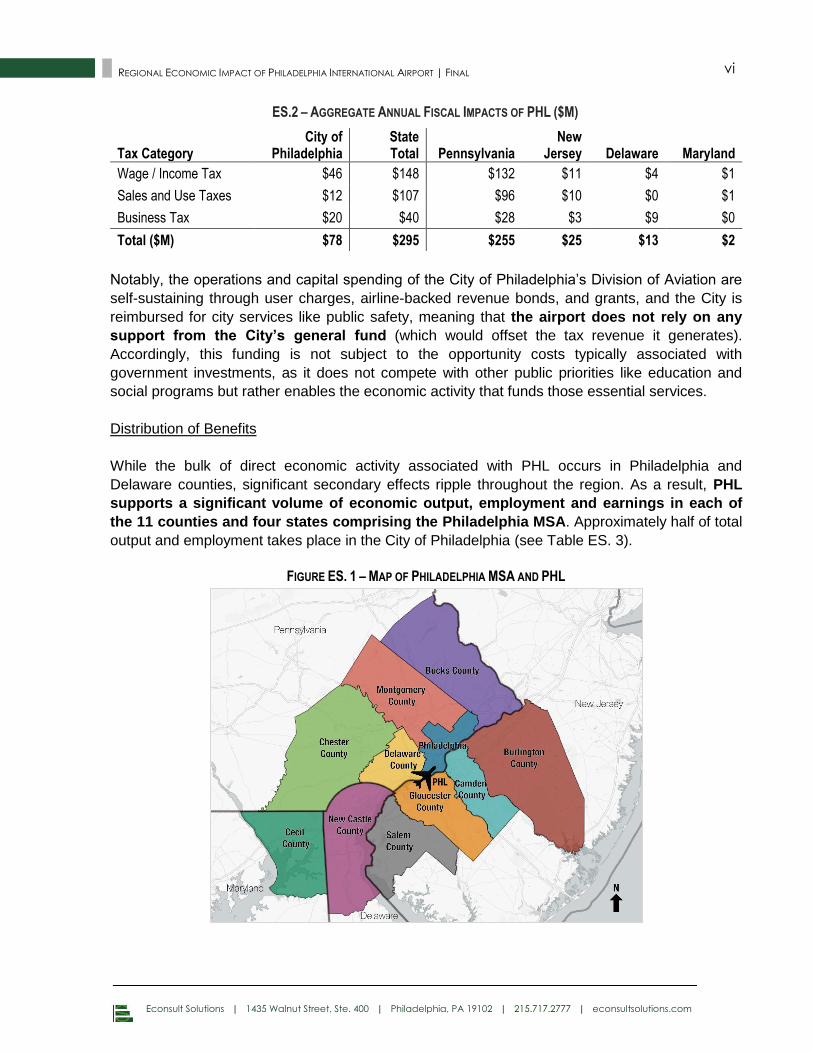
ES.2 – AGGREGATE ANNUAL FISCAL IMPACTS OF PHL ($M)
Tax Category City of
Philadelphia State Total Pennsylvania
New Jersey Delaware Maryland
Wage / Income Tax $46 $148 $132 $11 $4 $1
Sales and Use Taxes $12 $107 $96 $10 $0 $1
Business Tax $20 $40 $28 $3 $9 $0
Total ($M) $78 $295 $255 $25 $13 $2
Notably, the operations and capital spending of the City of Philadelphia’s Division of Aviation are
self-sustaining through user charges, airline-backed revenue bonds, and grants, and the City is
reimbursed for city services like public safety, meaning that the airport does not rely on any
support from the City’s general fund (which would offset the tax revenue it generates).
Accordingly, this funding is not subject to the opportunity costs typically associated with
government investments, as it does not compete with other public priorities like education and
social programs but rather enables the economic activity that funds those essential services.
Distribution of Benefits
While the bulk of direct economic activity associated with PHL occurs in Philadelphia and
Delaware counties, significant secondary effects ripple throughout the region. As a result, PHL
supports a significant volume of economic output, employment and earnings in each of
the 11 counties and four states comprising the Philadelphia MSA. Approximately half of total
output and employment takes place in the City of Philadelphia (see Table ES. 3).
FIGURE ES. 1 – MAP OF PHILADELPHIA MSA AND PHL
Econsult Solutions | 1435 Walnut Street, Ste. 400 | Philadelphia, PA 19102 | 215.717.2777 | econsultsolutions.com
vii REGIONAL ECONOMIC IMPACT OF PHILADELPHIA INTERNATIONAL AIRPORT | FINAL
TABLE ES.3 – AGGREGATE ANNUAL ECONOMIC IMPACT OF PHL BY COUNTY AND STATE
County
Total Output
($M)
Total Employment
(Jobs)
Total Earnings
($M)
Bucks County, PA $593 4,480 $175
Chester County, PA $558 3,940 $160
Delaware County, PA $3,656 23,750 $1,308
Montgomery County, PA $1,097 7,780 $316
Philadelphia County, PA $7,721 42,940 $2,328
Burlington County, NJ $459 3,340 $133
Camden County, NJ $452 3,390 $133
Gloucester County, NJ $222 1,690 $66
Salem County, NJ $35 260 $10
New Castle County, DE $578 4,090 $165
Cecil County, MD $77 610 $23
11 County Total $15,449 96,260 $4,819
Pennsylvania $13,625 82,890 $4,287
New Jersey $1,168 8,680 $342
Delaware $578 4,090 $165
Maryland $77 610 $23
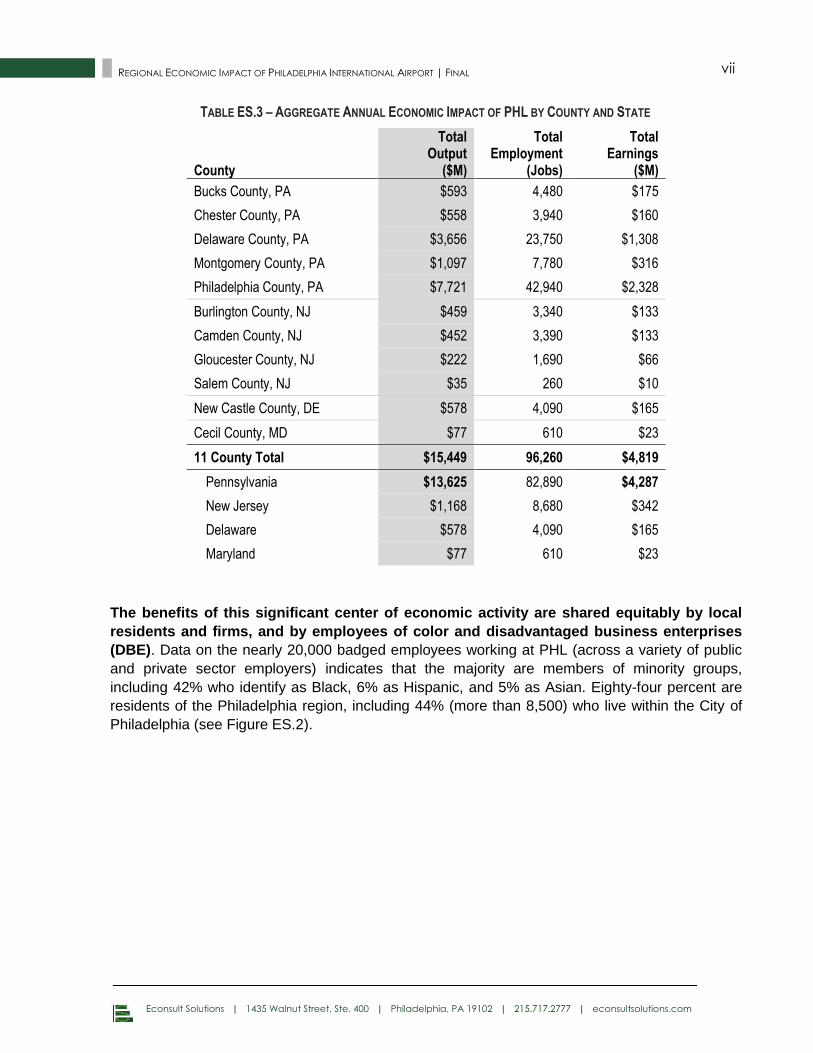
The benefits of this significant center of economic activity are shared equitably by local
residents and firms, and by employees of color and disadvantaged business enterprises
(DBE). Data on the nearly 20,000 badged employees working at PHL (across a variety of public
and private sector employers) indicates that the majority are members of minority groups,
including 42% who identify as Black, 6% as Hispanic, and 5% as Asian. Eighty-four percent are
residents of the Philadelphia region, including 44% (more than 8,500) who live within the City of
Philadelphia (see Figure ES.2).
Econsult Solutions | 1435 Walnut Street, Ste. 400 | Philadelphia, PA 19102 | 215.717.2777 | econsultsolutions.com
viii REGIONAL ECONOMIC IMPACT OF PHILADELPHIA INTERNATIONAL AIRPORT | FINAL
FIGURE ES.2 – BADGED EMPLOYEES BY ZIP CODE OF RESIDENCE
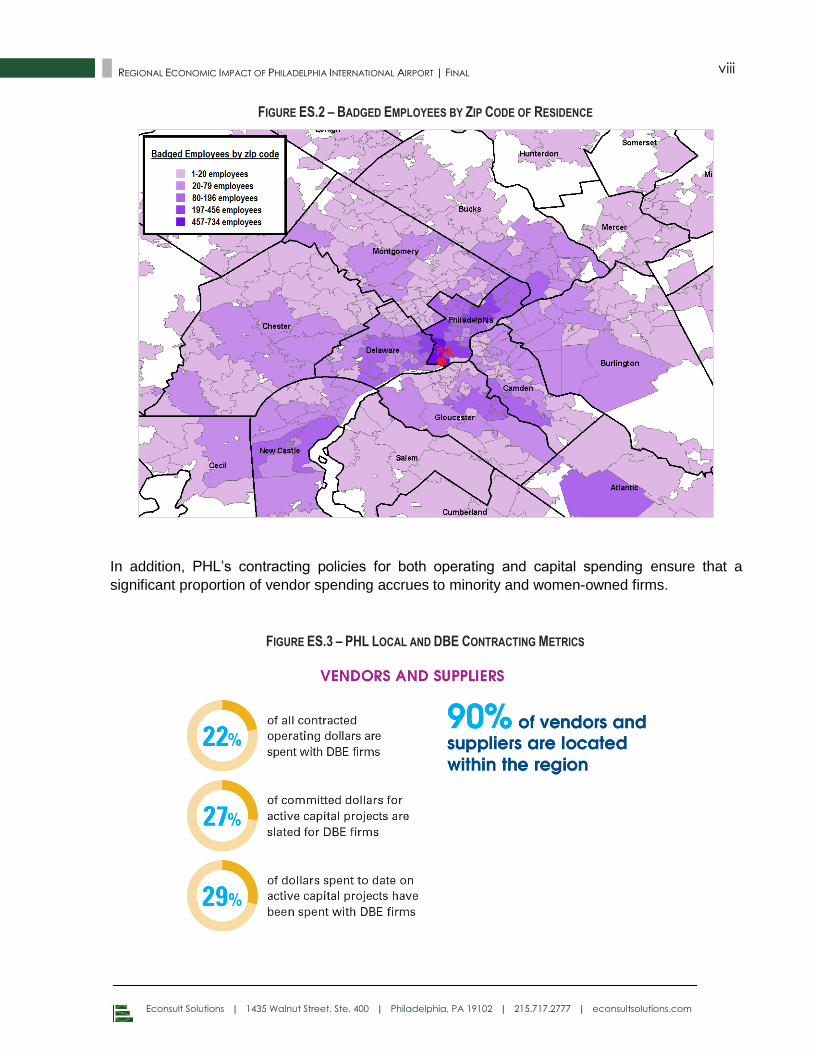
In addition, PHL’s contracting policies for both operating and capital spending ensure that a
significant proportion of vendor spending accrues to minority and women-owned firms.
FIGURE ES.3 – PHL LOCAL AND DBE CONTRACTING METRICS
Econsult Solutions | 1435 Walnut Street, Ste. 400 | Philadelphia, PA 19102 | 215.717.2777 | econsultsolutions.com
ix REGIONAL ECONOMIC IMPACT OF PHILADELPHIA INTERNATIONAL AIRPORT | FINAL
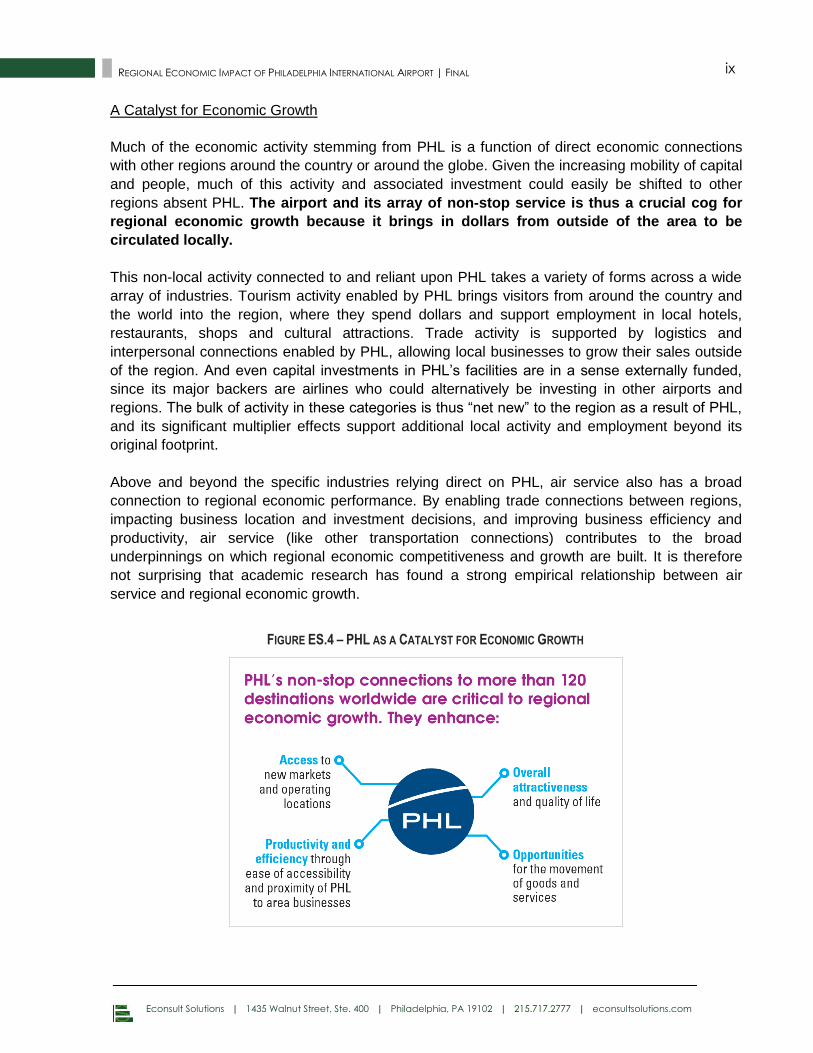
A Catalyst for Economic Growth
Much of the economic activity stemming from PHL is a function of direct economic connections
with other regions around the country or around the globe. Given the increasing mobility of capital
and people, much of this activity and associated investment could easily be shifted to other
regions absent PHL. The airport and its array of non-stop service is thus a crucial cog for
regional economic growth because it brings in dollars from outside of the area to be
circulated locally.
This non-local activity connected to and reliant upon PHL takes a variety of forms across a wide
array of industries. Tourism activity enabled by PHL brings visitors from around the country and
the world into the region, where they spend dollars and support employment in local hotels,
restaurants, shops and cultural attractions. Trade activity is supported by logistics and
interpersonal connections enabled by PHL, allowing local businesses to grow their sales outside
of the region. And even capital investments in PHL’s facilities are in a sense externally funded,
since its major backers are airlines who could alternatively be investing in other airports and
regions. The bulk of activity in these categories is thus “net new” to the region as a result of PHL,
and its significant multiplier effects support additional local activity and employment beyond its
original footprint.
Above and beyond the specific industries relying direct on PHL, air service also has a broad
connection to regional economic performance. By enabling trade connections between regions,
impacting business location and investment decisions, and improving business efficiency and
productivity, air service (like other transportation connections) contributes to the broad
underpinnings on which regional economic competitiveness and growth are built. It is therefore
not surprising that academic research has found a strong empirical relationship between air
service and regional economic growth.
FIGURE ES.4 – PHL AS A CATALYST FOR ECONOMIC GROWTH
Econsult Solutions | 1435 Walnut Street, Ste. 400 | Philadelphia, PA 19102 | 215.717.2777 | econsultsolutions.com
x REGIONAL ECONOMIC IMPACT OF PHILADELPHIA INTERNATIONAL AIRPORT | FINAL
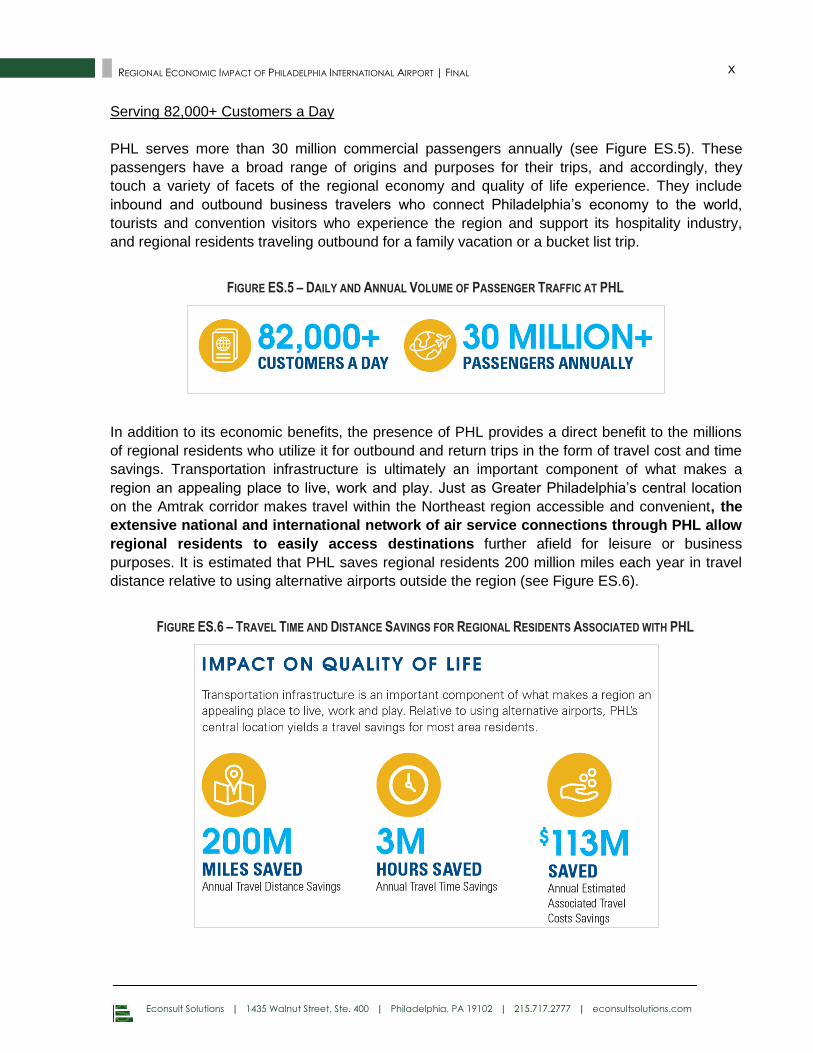
Serving 82,000+ Customers a Day
PHL serves more than 30 million commercial passengers annually (see Figure ES.5). These
passengers have a broad range of origins and purposes for their trips, and accordingly, they
touch a variety of facets of the regional economy and quality of life experience. They include
inbound and outbound business travelers who connect Philadelphia’s economy to the world,
tourists and convention visitors who experience the region and support its hospitality industry,
and regional residents traveling outbound for a family vacation or a bucket list trip.
FIGURE ES.5 – DAILY AND ANNUAL VOLUME OF PASSENGER TRAFFIC AT PHL
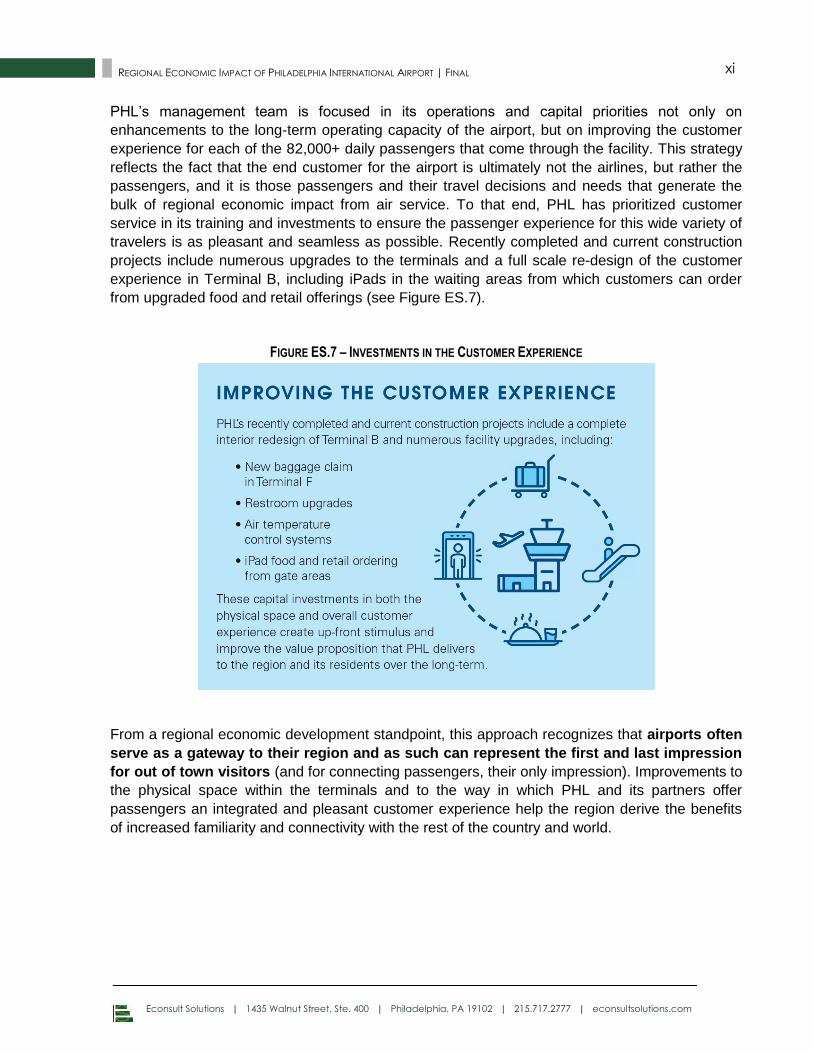
In addition to its economic benefits, the presence of PHL provides a direct benefit to the millions
of regional residents who utilize it for outbound and return trips in the form of travel cost and time
savings. Transportation infrastructure is ultimately an important component of what makes a
region an appealing place to live, work and play. Just as Greater Philadelphia’s central location
on the Amtrak corridor makes travel within the Northeast region accessible and convenient, the
extensive national and international network of air service connections through PHL allow
regional residents to easily access destinations further afield for leisure or business
purposes. It is estimated that PHL saves regional residents 200 million miles each year in travel
distance relative to using alternative airports outside the region (see Figure ES.6).
FIGURE ES.6 – TRAVEL TIME AND DISTANCE SAVINGS FOR REGIONAL RESIDENTS ASSOCIATED WITH PHL
Econsult Solutions | 1435 Walnut Street, Ste. 400 | Philadelphia, PA 19102 | 215.717.2777 | econsultsolutions.com
xi REGIONAL ECONOMIC IMPACT OF PHILADELPHIA INTERNATIONAL AIRPORT | FINAL
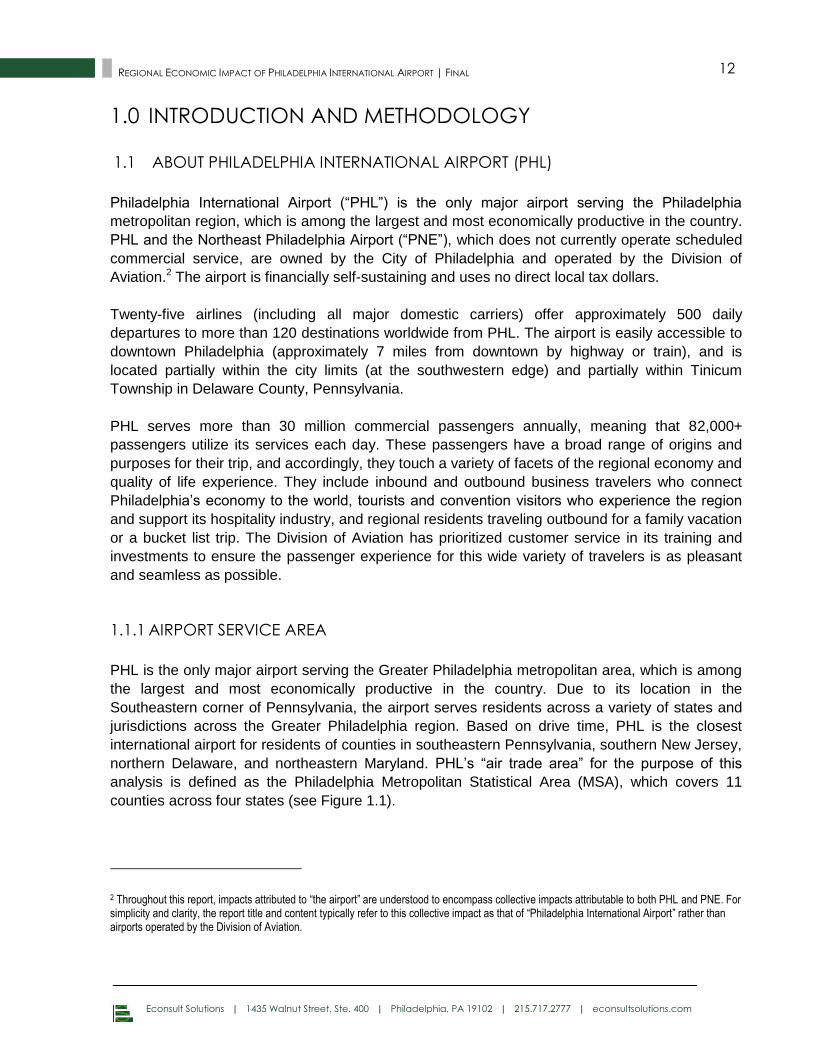
PHL’s management team is focused in its operations and capital priorities not only on
enhancements to the long-term operating capacity of the airport, but on improving the customer
experience for each of the 82,000+ daily passengers that come through the facility. This strategy
reflects the fact that the end customer for the airport is ultimately not the airlines, but rather the
passengers, and it is those passengers and their travel decisions and needs that generate the
bulk of regional economic impact from air service. To that end, PHL has prioritized customer
service in its training and investments to ensure the passenger experience for this wide variety of
travelers is as pleasant and seamless as possible. Recently completed and current construction
projects include numerous upgrades to the terminals and a full scale re-design of the customer
experience in Terminal B, including iPads in the waiting areas from which customers can order
from upgraded food and retail offerings (see Figure ES.7).
FIGURE ES.7 – INVESTMENTS IN THE CUSTOMER EXPERIENCE
From a regional economic development standpoint, this approach recognizes that airports often
serve as a gateway to their region and as such can represent the first and last impression
for out of town visitors (and for connecting passengers, their only impression). Improvements to
the physical space within the terminals and to the way in which PHL and its partners offer
passengers an integrated and pleasant customer experience help the region derive the benefits
of increased familiarity and connectivity with the rest of the country and world.
Econsult Solutions | 1435 Walnut Street, Ste. 400 | Philadelphia, PA 19102 | 215.717.2777 | econsultsolutions.com
12 REGIONAL ECONOMIC IMPACT OF PHILADELPHIA INTERNATIONAL AIRPORT | FINAL
1.0 INTRODUCTION AND METHODOLOGY
ABOUT PHILADELPHIA INTERNATIONAL AIRPORT (PHL) 1.1
Philadelphia International Airport (“PHL”) is the only major airport serving the Philadelphia
metropolitan region, which is among the largest and most economically productive in the country.
PHL and the Northeast Philadelphia Airport (“PNE”), which does not currently operate scheduled
commercial service, are owned by the City of Philadelphia and operated by the Division of
Aviation.2 The airport is financially self-sustaining and uses no direct local tax dollars.
Twenty-five airlines (including all major domestic carriers) offer approximately 500 daily
departures to more than 120 destinations worldwide from PHL. The airport is easily accessible to
downtown Philadelphia (approximately 7 miles from downtown by highway or train), and is
located partially within the city limits (at the southwestern edge) and partially within Tinicum
Township in Delaware County, Pennsylvania.
PHL serves more than 30 million commercial passengers annually, meaning that 82,000+
passengers utilize its services each day. These passengers have a broad range of origins and
purposes for their trip, and accordingly, they touch a variety of facets of the regional economy and
quality of life experience. They include inbound and outbound business travelers who connect
Philadelphia’s economy to the world, tourists and convention visitors who experience the region
and support its hospitality industry, and regional residents traveling outbound for a family vacation
or a bucket list trip. The Division of Aviation has prioritized customer service in its training and
investments to ensure the passenger experience for this wide variety of travelers is as pleasant
and seamless as possible.
1.1.1 AIRPORT SERVICE AREA
PHL is the only major airport serving the Greater Philadelphia metropolitan area, which is among
the largest and most economically productive in the country. Due to its location in the
Southeastern corner of Pennsylvania, the airport serves residents across a variety of states and
jurisdictions across the Greater Philadelphia region. Based on drive time, PHL is the closest
international airport for residents of counties in southeastern Pennsylvania, southern New Jersey,
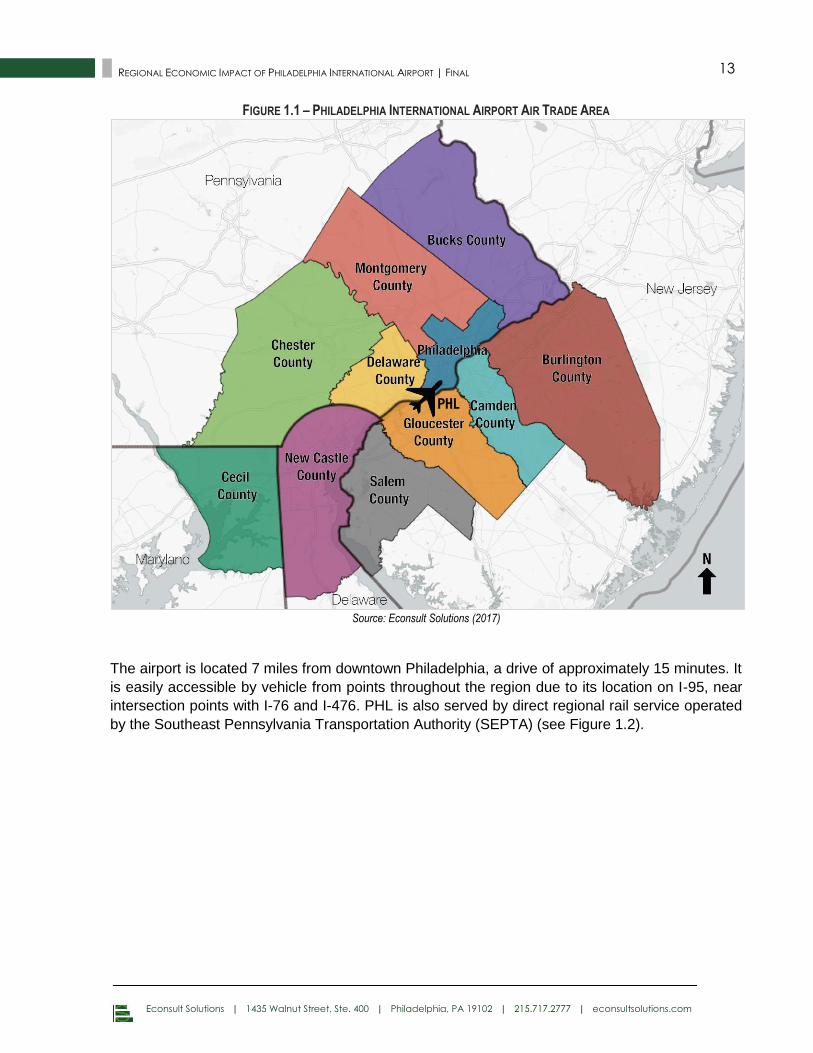
northern Delaware, and northeastern Maryland. PHL’s “air trade area” for the purpose of this
analysis is defined as the Philadelphia Metropolitan Statistical Area (MSA), which covers 11
counties across four states (see Figure 1.1).
2 Throughout this report, impacts attributed to “the airport” are understood to encompass collective impacts attributable to both PHL and PNE. For simplicity and clarity, the report title and content typically refer to this collective impact as that of “Philadelphia International Airport” rather than airports operated by the Division of Aviation.
Econsult Solutions | 1435 Walnut Street, Ste. 400 | Philadelphia, PA 19102 | 215.717.2777 | econsultsolutions.com
13 REGIONAL ECONOMIC IMPACT OF PHILADELPHIA INTERNATIONAL AIRPORT | FINAL
FIGURE 1.1 – PHILADELPHIA INTERNATIONAL AIRPORT AIR TRADE AREA
Source: Econsult Solutions (2017)
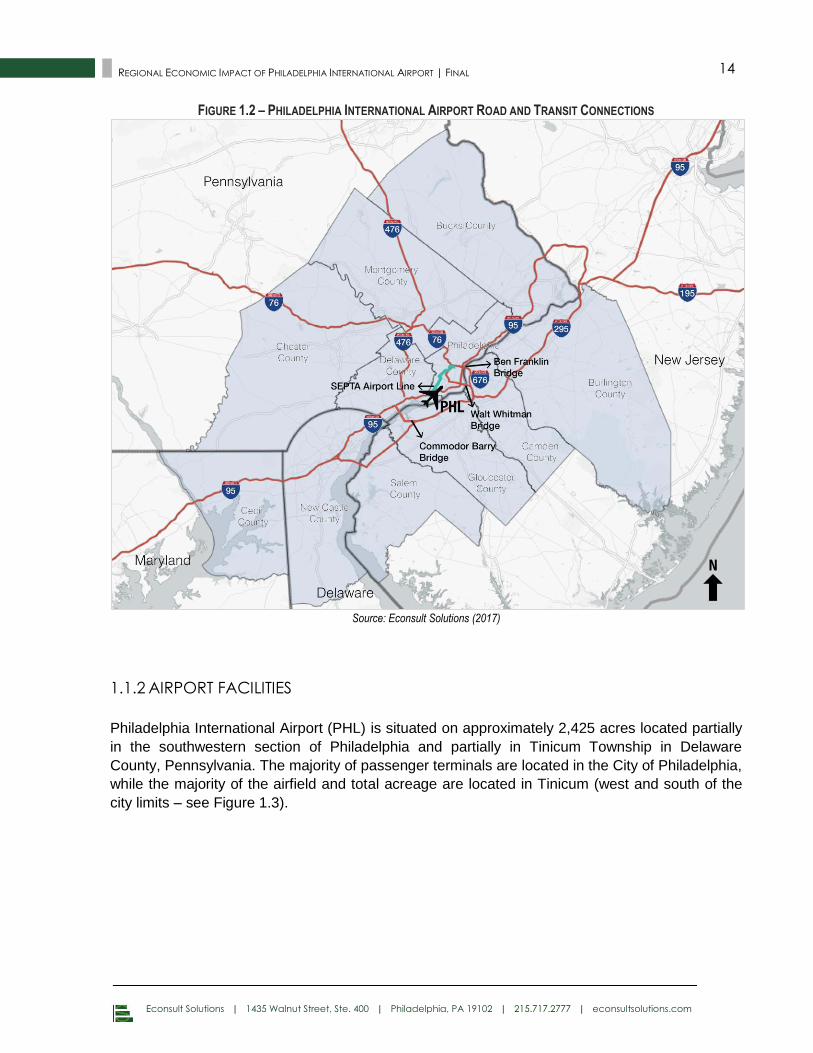
The airport is located 7 miles from downtown Philadelphia, a drive of approximately 15 minutes. It
is easily accessible by vehicle from points throughout the region due to its location on I-95, near
intersection points with I-76 and I-476. PHL is also served by direct regional rail service operated
by the Southeast Pennsylvania Transportation Authority (SEPTA) (see Figure 1.2).
Econsult Solutions | 1435 Walnut Street, Ste. 400 | Philadelphia, PA 19102 | 215.717.2777 | econsultsolutions.com
14 REGIONAL ECONOMIC IMPACT OF PHILADELPHIA INTERNATIONAL AIRPORT | FINAL
FIGURE 1.2 – PHILADELPHIA INTERNATIONAL AIRPORT ROAD AND TRANSIT CONNECTIONS
Source: Econsult Solutions (2017)
1.1.2 AIRPORT FACILITIES
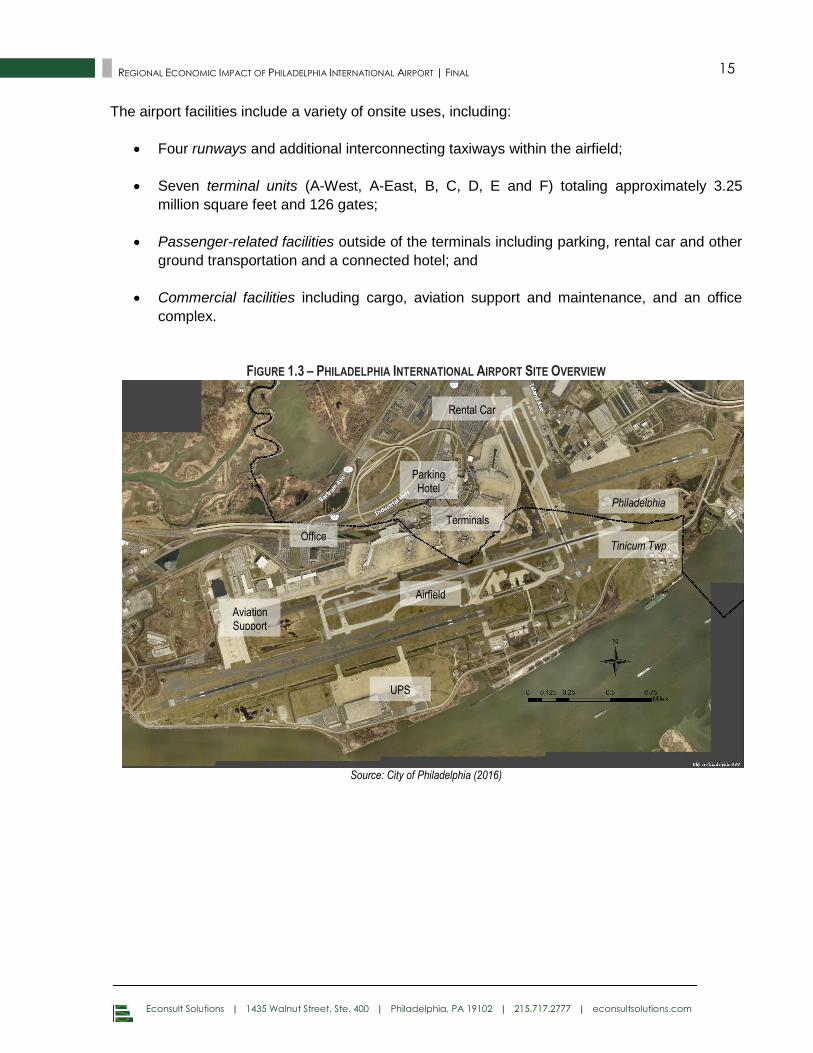
Philadelphia International Airport (PHL) is situated on approximately 2,425 acres located partially
in the southwestern section of Philadelphia and partially in Tinicum Township in Delaware
County, Pennsylvania. The majority of passenger terminals are located in the City of Philadelphia,
while the majority of the airfield and total acreage are located in Tinicum (west and south of the
city limits – see Figure 1.3).
Econsult Solutions | 1435 Walnut Street, Ste. 400 | Philadelphia, PA 19102 | 215.717.2777 | econsultsolutions.com
15 REGIONAL ECONOMIC IMPACT OF PHILADELPHIA INTERNATIONAL AIRPORT | FINAL
The airport facilities include a variety of onsite uses, including:
Four runways and additional interconnecting taxiways within the airfield;
Seven terminal units (A-West, A-East, B, C, D, E and F) totaling approximately 3.25
million square feet and 126 gates;
Passenger-related facilities outside of the terminals including parking, rental car and other
ground transportation and a connected hotel; and
Commercial facilities including cargo, aviation support and maintenance, and an office
complex.
FIGURE 1.3 – PHILADELPHIA INTERNATIONAL AIRPORT SITE OVERVIEW
Source: City of Philadelphia (2016)
Philadelphia
Tinicum Twp
Terminals
Parking Hotel
Office
Rental Car
Aviation Support
UPS
Airfield
Econsult Solutions | 1435 Walnut Street, Ste. 400 | Philadelphia, PA 19102 | 215.717.2777 | econsultsolutions.com
16 REGIONAL ECONOMIC IMPACT OF PHILADELPHIA INTERNATIONAL AIRPORT | FINAL
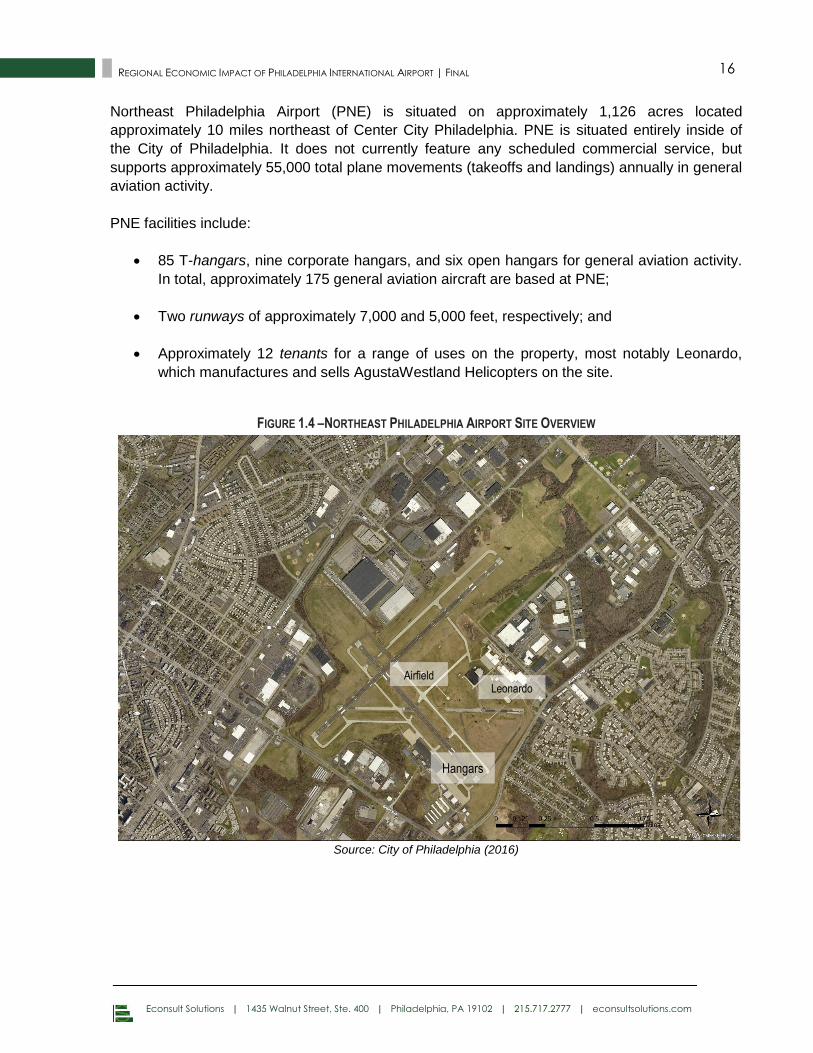
Northeast Philadelphia Airport (PNE) is situated on approximately 1,126 acres located
approximately 10 miles northeast of Center City Philadelphia. PNE is situated entirely inside of
the City of Philadelphia. It does not currently feature any scheduled commercial service, but
supports approximately 55,000 total plane movements (takeoffs and landings) annually in general
aviation activity.
PNE facilities include:
85 T-hangars, nine corporate hangars, and six open hangars for general aviation activity.
In total, approximately 175 general aviation aircraft are based at PNE;
Two runways of approximately 7,000 and 5,000 feet, respectively; and
Approximately 12 tenants for a range of uses on the property, most notably Leonardo,
which manufactures and sells AgustaWestland Helicopters on the site.
FIGURE 1.4 –NORTHEAST PHILADELPHIA AIRPORT SITE OVERVIEW
Source: City of Philadelphia (2016)
Leonardo Airfield
Hangars
Econsult Solutions | 1435 Walnut Street, Ste. 400 | Philadelphia, PA 19102 | 215.717.2777 | econsultsolutions.com
17 REGIONAL ECONOMIC IMPACT OF PHILADELPHIA INTERNATIONAL AIRPORT | FINAL
1.1.3 FLIGHT ACTIVITY
PHL is served by twenty-five different airlines, including the major domestic carriers. Plane
movements (takeoffs and landings) totaled more than 411,000 in calendar year 2015, making
PHL the 14th busiest airport in the United States by this metric. Passenger volume (including
enplaning and deplaning) totaled 31.4 million in 2015, making PHL the 19th busiest in the country
in passenger volume.3
Largest among carriers is American Airlines, which utilizes Philadelphia as one of nine primary
U.S. hub locations and its largest on the East Coast.4 American and its partners accounted for
approximately 73% of total passenger volume at PHL in FY 2016, and its hub status provides
direct access from PHL to a variety of destinations nationally and internationally.
Recently, PHL has seen growth in route connections flown by low cost carriers, including Jet
Blue, Spirit, Southwest, and Frontier Airlines. Frontier alone added new flights to eight cities in
2015, another ten cities in January 2016, and has announced new flights to Houston and West
Palm Beach starting in spring 2017. These low-cost carriers expand the options for consumers,
either increasing competition along existing routes or in many cases initiating new direct point to
point connections.
Internationally, PHL serves as the primary European and Transatlantic gateway for American
Airlines, with direct connections to a range of major European cities. In addition, PHL has an
extensive international network to the Caribbean and Latin America. Summer 2017 will include
the addition of direct service to Iceland with Icelandair. In total, PHL offers approximately 500
daily flights to more than 120 national and international non-stop destinations.
This flight volume enables PHL to serve more than 30 million total inbound and outbound
passengers on an annual basis, or 82,000+ per day. 62% of these passengers have their origin
or destination at PHL, while 38% are connecting through to other destinations. As described
throughout this report, these passengers have a range of purposes for their trips, which combine
to drive the volume of economic activity and regional benefit quantified in this report. PHL serves
out-of-towners visiting the region to conduct business, international travelers sightseeing in the
region, locals heading outbound for a vacation, etc. All told, about half of PHL passengers are
traveling for business and about half for leisure, and inbound and outbound traffic are roughly
equal.
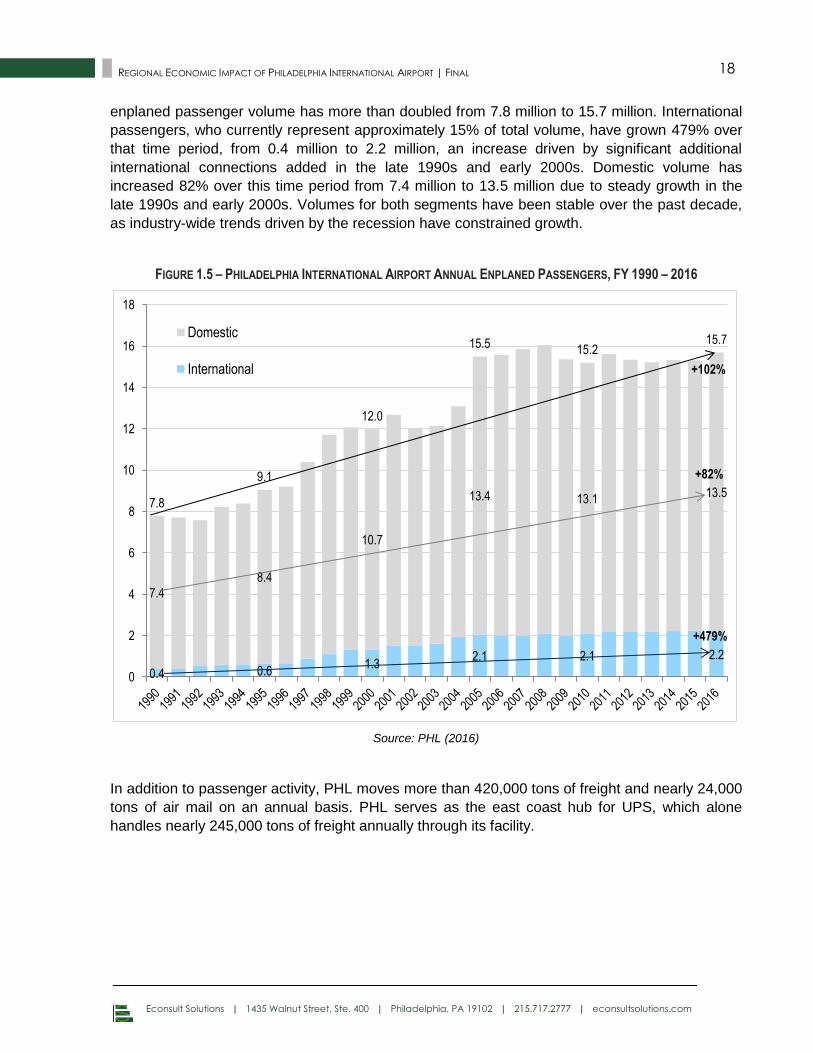
Both the volume and composition of passenger activity at PHL have been relatively stable over
the past decade, with significant growth occurring over a longer time frame. Figure 1.5 below
shows annual enplaned (i.e. outbound) passengers at PHL from FY 1990 to FY 2016, with
passengers broken down into international (in blue) and domestic (in gray). Over that period, total
3 Note that calendar year 2015 is the latest year for which national rankings are available.
4 Note that this hub is a legacy from US Airways, which acquired American Airlines and recently merged its operating certificate and fleet under the American Airlines brand name.
Econsult Solutions | 1435 Walnut Street, Ste. 400 | Philadelphia, PA 19102 | 215.717.2777 | econsultsolutions.com
18 REGIONAL ECONOMIC IMPACT OF PHILADELPHIA INTERNATIONAL AIRPORT | FINAL
enplaned passenger volume has more than doubled from 7.8 million to 15.7 million. International
passengers, who currently represent approximately 15% of total volume, have grown 479% over
that time period, from 0.4 million to 2.2 million, an increase driven by significant additional
international connections added in the late 1990s and early 2000s. Domestic volume has
increased 82% over this time period from 7.4 million to 13.5 million due to steady growth in the
late 1990s and early 2000s. Volumes for both segments have been stable over the past decade,
as industry-wide trends driven by the recession have constrained growth.
FIGURE 1.5 – PHILADELPHIA INTERNATIONAL AIRPORT ANNUAL ENPLANED PASSENGERS, FY 1990 – 2016
Source: PHL (2016)
In addition to passenger activity, PHL moves more than 420,000 tons of freight and nearly 24,000
tons of air mail on an annual basis. PHL serves as the east coast hub for UPS, which alone
handles nearly 245,000 tons of freight annually through its facility.
0.4 0.6 1.3
2.1 2.1 2.2
7.4
8.4
10.7
13.4 13.1 13.5
7.8
9.1
12.0
15.5 15.2 15.7
0
2
4
6
8
10
12
14
16
18
+82%
+479%
+102%
Domestic
International
Econsult Solutions | 1435 Walnut Street, Ste. 400 | Philadelphia, PA 19102 | 215.717.2777 | econsultsolutions.com
19 REGIONAL ECONOMIC IMPACT OF PHILADELPHIA INTERNATIONAL AIRPORT | FINAL
THE ECONOMIC IMPORTANCE OF THE AIRPORT TO THE REGION 1.2
Airports, and in particular large hub airports in major metropolitan regions, are drivers of
economic activity in a number of ways. Narrowly, airports are centers of significant direct
economic activity and employment as initiators of capital investments and as transportation
service providers. More broadly, a number of supporting and related industries (including
logistics, personal transportation, hospitality and retail) are located in close proximity to the airport
and themselves generate significant economic activity that would not occur but for the airport.
Broader still, the entire regional population and regional economy benefits from the transportation
connections enabled by the airport, which enables people and dollars to flow into the region and
serves a crucial role in the economic competitiveness of the metropolitan area.
While many airport economic impact studies focus primarily on the direct onsite footprint of the
airport and related activities, an increasing body of research demonstrates that the “catalytic”
impacts of air service are worthy of substantial consideration, and may generate an equal or
greater total impact on the regional economy. This analysis shares that view and its methodology
recognizes that the loss of air service would have far ranging consequences for the region and its
residents.
This report calculates annual economic impacts attributable to the airport in six distinct chapters
and then summarizes those impacts in the final chapter. The report proceeds as follows:
Chapter 2: Capital Investments quantifies impacts from physical investments in
construction and renovation of facilities undertaken by the airport and its tenants.
Chapter 3: Aviation Division Operations quantifies impacts directly related to the
annual operations of the airport (employment, procurement, etc.) through the Division of
Aviation within the City of Philadelphia’s Commerce Department.
Chapter 4: Airline Operations quantifies impacts from the annual activities of PHL’s
chief tenants, its private airline operators, who represent a significant hub of employment
within the terminals and airfields to support their commercial aviation activity.
Chapter 5: Airport-Related Operations quantifies impacts from business and
government activities located at or near PHL that are directly attributable to the existence
of the airport. This includes a variety of industries that support air transport-related
activities and use the airport as their business platform. Many of these industries serve the
needs of airport passengers (including retail, ground transportation, parking, hotels,
general aviation, and government services) while others capitalize on its location and
transportation connections (including cargo and freight, office, and aviation
manufacturing).
Chapter 6: Regional Tourism quantifies impacts from the volume of tourism activity
enabled by and attributable to the airport on an annual basis. This includes a significant
Econsult Solutions | 1435 Walnut Street, Ste. 400 | Philadelphia, PA 19102 | 215.717.2777 | econsultsolutions.com
20 REGIONAL ECONOMIC IMPACT OF PHILADELPHIA INTERNATIONAL AIRPORT | FINAL
portion of incoming visitor spending within the region, as well as a portion of the business
activity from travel arrangement providers within the region, who often serve regional
residents using the airport for outbound trips.
Chapter 7: Resident Benefits describes and quantifies the travel time and cost savings
enjoyed by residents due to the existence of PHL and its proximity for regional residents
relative to alternative airports.
Chapter 8: Catalytic Economic Growth Effects describes the broad role of the airport in
stimulating economic activity and growth for the regional economy. Above and beyond
businesses that rely explicitly on the airport within their business model (those quantified
in the sections above), air service has broad implications for all regional firms in fostering
trade activity and connections, determining business investment and location decisions,
and enhancing productivity and efficiency, all of which are crucial components of regional
economic output and growth.
Chapter 9: Aggregate Economic and Fiscal Impact concludes the report, reviewing the
main themes and summarizing the aggregate economic and fiscal impact associated with
PHL at various geographic levels.
ECONOMIC AND FISCAL IMPACT METHODOLOGY 1.3
The purpose of this report is to describe and quantify the annual regional economic and fiscal
impact attributable to Philadelphia International Airport. The magnitude of these impacts is
estimated through a three-step process. First, the magnitude of direct regional economic activity
attributable to the airport is estimated across the range of categories described in the previous
section. Next, standard input-output modeling techniques are used to translate an initial amount
of direct economic activity into the total amount of economic activity that it supports. Finally, a
fiscal model is developed to translate these increases in economic activity to their attendant
increases in relevant state and local tax bases, and then to the annual tax revenue they yield for
those jurisdictions. This section reviews the data sources and methods used for each of these
steps at a high level, and the appendices to this report describe the calculations in greater detail.
1.3.1 DATA AND METHODS FOR ESTIMATING DIRECT ECONOMIC ACTIVITY
Direct economic activity attributable to PHL is estimated for a wide variety of categories within this
analysis, reflecting the range of ways that the airport contributes to the regional economy. These
impacts differ not only in scale but in type and in some cases in beneficiaries, and thus required a
mix of analytical approaches and data sources.
Direct expenditures on operating and capital activities through the City of Philadelphia Aviation
Division are drawn from detailed financial statements provided by PHL. In addition, data is
Econsult Solutions | 1435 Walnut Street, Ste. 400 | Philadelphia, PA 19102 | 215.717.2777 | econsultsolutions.com
21 REGIONAL ECONOMIC IMPACT OF PHILADELPHIA INTERNATIONAL AIRPORT | FINAL
available from PHL on activity levels in a variety of additional categories, including retail activity
within the terminals, ground transportation activity to and from the airport, and in-airport
employment, which is tracked through a security badge tracking system. These data points are
extrapolated as needed to estimate direct expenditures and employment in the relevant
categories. Interviews were also conducted with representatives of the largest private sector
activity drivers associated with the airport (including American Airlines, UPS, AgustaWestland,
Atlantic Aviation, and Marriott) in order to understand in greater detail the scale and range of their
activities.
In other instances, total regional activity is known for a given industry (with varying degrees of
precision), and the analytical challenge is to determine the extent to which that activity is
attributable to the existence of the airport. Available data from PHL on proxy measures (including
the number of establishments, square footage and direct employment) are used in combination
with government data sources like Bureau of Labor Statistics employment and establishment data
by industry to estimate the proportion and thus the volume of regional activity attributable to PHL
in various categories. These approaches are necessarily based in part on assumptions anchored
by research. Where possible, a conservative approach was taken to arrive at these estimates, in
order to avoid overstating these amounts. The appendices to this report provide detail on the data
inputs and assumptions utilized to derive each of the direct visitor expenditure calculations shown
within the body of this report.
Care is given within this analysis to ensure that all impacts are discrete and non-overlapping, and
therefore sum to the aggregate economic impact of PHL. For example, Section 5.1.5 estimates
direct economic activity from the airport-serving hotels, while Section 6.1.1 estimates regional
visitor spending attributable to the airport. To avoid double counting, visitor spending captured by
the airport-serving hotels is deducted from the estimate of total regional visitor spending. Similar
adjustments are made in other instances to ensure that estimates by category can be
appropriately summed in Chapter 9 of this report to represent the aggregate annual economic
impact.
All impacts within this report are quantified on an annualized basis in order to represent the
current annual level of economic activity associated with PHL. To do so, it seeks to use the most
appropriate and recent data available for each component of the calculation. Where available,
data from FY 2016 or from calendar year 2015 is utilized. In some cases, the most appropriate
data may only be available for a prior fiscal or calendar year, for a partial year, or for multiple
years. These data sources are utilized and annualized as they constitute the most representative
available inputs for the current annual activity level.
1.3.2 INPUT-OUTPUT MODELING
To model the impacts resulting from the direct expenditures generated by PHL, ESI developed a
customized economic impact model using the IMPLAN input/output modeling system. IMPLAN
Econsult Solutions | 1435 Walnut Street, Ste. 400 | Philadelphia, PA 19102 | 215.717.2777 | econsultsolutions.com
22 REGIONAL ECONOMIC IMPACT OF PHILADELPHIA INTERNATIONAL AIRPORT | FINAL
represents an industry standard approach to assess the economic and job creation impacts of
economic development projects, the creation of new businesses, and public policy changes.5
In an inter-connected economy, every dollar spent generates two spillover impacts:
First, some amount of the proportion of that expenditure that goes to the purchase of
goods and services gets circulated back into an economy when those goods and services
are purchased from local vendors. This represents what is called the “indirect effect,” and
reflects the fact that local purchases of goods and services support local vendors, who in
turn require additional purchasing with their own set of vendors.
Second, some amount of the proportion of that expenditure that goes to labor income gets
circulated back into an economy when those employees spend some of their earnings on
various goods and services. This represents what is called the “induced effect,” and
reflects the fact that some of those goods and services will be purchased from local
vendors, further stimulating a local economy.
The role of input-output models is to determine the linkages across industries in order to model
out the magnitude and composition of the spillover impacts to all industries of a dollar spent in
any one industry. Thus, the total economic impact of the airport is the sum of:
Direct economic activity attributable the airport;
The indirect and induced effects generated by that direct footprint; and
Additional regional economic output attributable to the existence of the airport.
Economic impacts within this report are presented for the 11 counties in the airport’s catchment
area, which are also the counties represented in the Philadelphia Metropolitan Statistical Area
(MSA) as defined by the Census Bureau, both individually and collectively.6 Results are also
presented for the four states within the region (Pennsylvania, New Jersey, Delaware and
Maryland), reflecting aggregations of the County-level results within those states. For further
detail on the method used to share economic impact down to the counties, see Appendix E. The
full results are presented by county in Appendix F.
5 IMPLAN is one of several popular choices for regional input-output modeling. Each system has its own nuances in establishing proper location coefficients. IMPLAN uses a location quotient to determine its regional purchase coefficient (RPC). This represents the proportion of demand for a good that is filled locally; this assessment helps determine the multiplier for the localized region. Additionally, IMPLAN also accounts for inter-institutional transfers (e.g. firms to households, households to the government) through its Social Account Matrix (SAM) multipliers. IMPLAN takes the multipliers and divides them into 440 industry categories in accordance to the North American Industrial Classification System (NAICS) codes. ESI has developed a customized economic impact model for this analysis utilizing the IMPLAN input/output modeling system. See Appendix A for a more detailed description of input/output models and their application in this analysis
6 As shown in Figure 1.1, these counties are: Bucks, Chester, Delaware, Montgomery and Philadelphia Counties (Pennsylvania); Burlington, Camden, Gloucester and Salem Counties (New Jersey), New Castle County (Delaware); and Cecil County (Maryland).
Econsult Solutions | 1435 Walnut Street, Ste. 400 | Philadelphia, PA 19102 | 215.717.2777 | econsultsolutions.com
23 REGIONAL ECONOMIC IMPACT OF PHILADELPHIA INTERNATIONAL AIRPORT | FINAL
1.3.3 FISCAL IMPACTS
These economic impacts in turn produce increases in various state and local tax bases, which
yield increases in various tax revenues. While some aspects of PHL’s operations are tax-exempt
due to its status as a government entity, much of the airport-related private sector activity is
directly tax generating. Further, the indirect and induced activity stemming from by both public
and private sector expenditures generate taxable income and economic activity. Thus, PHL is a
significant revenue generator for state and local governments.
To estimate these impacts, ESI has created a custom fiscal impact model to translate total
economic impacts into their commensurate tax revenue gains for state and local jurisdictions.7
Output from the IMPLAN model determines its impact on the relevant tax types and tax bases
associated with the jurisdictions in which revenue impacts reside. These include income, sales,
and business taxes at both the city and state levels.
Fiscal impacts are calculated for the City of Philadelphia, suburban Pennsylvania jurisdictions,
and the states of Pennsylvania, New Jersey, Delaware and Maryland. Local tax revenue for
Philadelphia is based upon economic impacts occurring in Philadelphia County (which is co-
terminus with the city), while suburban Pennsylvania revenues are based on impacts occurring in
the suburban Pennsylvania counties. Statewide fiscal impacts are based on the sum of economic
impacts occurring within the composite counties of the 11-county region within those states.
Notably, while the economy of each county is wholly contained within the state in which they are
situated (and county economic impacts are therefore contained within state economic impacts),
local and state governments are separate and distinct entities with distinct tax bases. Therefore,
for example, fiscal impacts for the City of Philadelphia and the Commonwealth of Pennsylvania
are all distinct and additive.
1.3.4 COMPARABILITY WITH PREVIOUS ANALYSIS
PHL’s most recent comprehensive economic impact analysis was conducted by Econsult and
released in March 2006. While this study shares the same broad purpose (i.e. to define the
annual aggregate economic impact of the airport on the Philadelphia region), it does not
represent a direct update of the 2006 study. The current study utilizes data inputs not available in
2006, and an updated modeling approach reflective of changing industry standards, rather than
confining itself to data and methods available for the prior study more than a decade ago, in
service of representing the most accurate current quantification of PHL’s impact. Accordingly,
7 ESI’s customized fiscal model uses output from IMPLAN to determine the impact on the tax types and tax bases relevant to each jurisdiction in which impacts reside, and then utilizes a combination of economic and administrative data to determine the associated effective tax rates. See Appendix A for a more detailed description of ESI’s fiscal methodology.
Econsult Solutions | 1435 Walnut Street, Ste. 400 | Philadelphia, PA 19102 | 215.717.2777 | econsultsolutions.com
24 REGIONAL ECONOMIC IMPACT OF PHILADELPHIA INTERNATIONAL AIRPORT | FINAL
results from the current analysis cannot be compared to 2006 results to establish a “growth rate”
for intervening time period, because these impacts were not computed in a parallel manner.
Three updates are most notable in distinguishing the current analysis from the 2006 study: the
refinement of data inputs, the removal of a regional business efficiency calculation, and a switch
in the input-output modeling software utilized.
Data Inputs
The vast majority of direct expenditure impacts estimated within the analysis originate not from
the budget of the City’s Division of Aviation, but from other onsite and offsite activity directly
attributable to, but not directly undertaken by, the airport. Therefore, the availability and quality of
data inputs beyond budgetary information on PHL’s direct spending has a significant influence on
impact results.
On the whole, available data sources and quality for the current analysis far exceeds the data
available for the 2006 study. As described in Section 1.3.1, PHL provided specific data from this
analysis on activity level across a number of additional categories, including retail activity within
the terminals and ground transportation activity to and from the terminals that was not available in
its present form in 2006. With respect to visitor spending and nearby hospitality activity and
regional visitor spending, ESI has recently completed an economic impact analysis of the regional
tourism industry for Visit Philadelphia, and accordingly was able to access visitation information
and spending models to better define impacts in these categories. Finally, interviews conducted
with large drivers of private sector activity associated with the airport yielded data that is not
publicly available.
These improvements in data availability and quality represent a clear improvement in the
accuracy of the economic impact analysis. These improvements do not uniformly increase or
decrease the estimated impact by category, as they may bear on the methodology by which
these estimates are arrived at. Indeed, in some cases newly available data leads to refinements
in which direct expenditures categories are quantified. Accordingly, results represent the best
available estimates based on current data, and changes in results for a given category or in
aggregate are not necessarily reflective of a change in PHL’s impact over the intervening time
period.
Business Efficiency Calculation
The 2006 report contains among its impact categories a calculation of the portion of regional
Gross Metropolitan Product (GMP) attributable to the airport due to its impact on regional
business efficiency. As reviewed in Section 8 of the current report, there is considerable literature
that supports the link between regional GMP and air service, and intuitively, it is clear that if the
Econsult Solutions | 1435 Walnut Street, Ste. 400 | Philadelphia, PA 19102 | 215.717.2777 | econsultsolutions.com
25 REGIONAL ECONOMIC IMPACT OF PHILADELPHIA INTERNATIONAL AIRPORT | FINAL
airport were to disappear, the regional economy would be negatively affected above and beyond
the categories calculated in this analysis.
However, in reviewing a number of airport economic impact studies in preparation for this
analysis, most do not include among the impact categories a calculation of a proportion of
economic growth attributable to air service. In keeping with this industry-standard approach, the
current analysis discusses this connection in Section 8 but does not calculate a value for this
category as part of the total impact. A parallel calculation to that undertaken in the 2006 would
thus yielded a much higher impact figure (in part because the regional GDP has grown
considerably in the intervening time).
Input-Output Modeling Software
This analysis uses the IMPLAN input-output model (produced by the private sector Minnesota
IMPLAN group), while the 2006 studied utilized, the RIMS model produced by the U.S.
Department of Commerce’s Bureau of Economic Analysis (BEA). RIMS was relied upon as an
industry-standard tool for many years due in part to its open source nature and wide availability.
In recent years, budget cuts due to sequestration caused BEA to cease updating the data in the
RIMS model for several years. During this time, many economic analysts (including ESI) began to
rely on IMPLAN software. Today, IMPLAN is generally considered to yield more accurate results,
due to its more frequent updates, larger volume of industries, and greater flexibility in creating
customized models.
One major difference between the IMPLAN and RIMS are the differing definitions of
“employment” embedded within each model. IMPLAN generates employment results in terms of
“annual jobs”, meaning that 12 months of employment equates to one job. Seasonal employees
are counted fractionally, meaning that three months of employment would equate to one-quarter
of a job.8 The BEA approach embedded in RIMS, by contrast, does not distinguish between full-
time and part-time jobs in its employment count. Therefore, the total employment figure reported
in the 2006 figure includes a mix of full-time and part-time jobs without any adjustment, while the
total employment reported in this analysis adjusts jobs to an annualized basis.
These differing definitions are evident when comparing the ratio between total employment and
total earnings, i.e. the average employee compensation per job, between the two studies. In the
current analysis, employee compensate per job exceeds $50,000, while in 2006, employee
compensation per job was approximately $21,000, reflecting the fact that a mix of full-time and
part-time jobs were included. Differences in employment results between the two studies are thus
not reflective of changes in employment impact attributable to PHL over the intervening years.
8 This approach is conceptually similar to a Full-Time Equivalent (FTE) calculation, although not identical since it normalized employment to a 12 month year but not to a standard 40 hour work week.
Econsult Solutions | 1435 Walnut Street, Ste. 400 | Philadelphia, PA 19102 | 215.717.2777 | econsultsolutions.com
26 REGIONAL ECONOMIC IMPACT OF PHILADELPHIA INTERNATIONAL AIRPORT | FINAL
1.3.5 ABOUT ECONSULT SOLUTIONS, INC.
This report was produced by Econsult Solutions, Inc. (“ESI”). ESI is a
Philadelphia-based economic consulting firm that provides
businesses and public policy makers with economic consulting
services in urban economics, real estate economics, transportation,
public infrastructure, development, public policy and finance,
community and neighborhood development, planning, as well as expert witness services for
litigation support. Its principals are nationally recognized experts in urban development, real
estate, government and public policy, planning, transportation, non-profit management, business
strategy and administration, as well as litigation and commercial damages. Staff members have
outstanding professional and academic credentials, including active positions at the university
level, wide experience at the highest levels of the public policy process and extensive consulting
experience.
Econsult Solutions | 1435 Walnut Street, Ste. 400 | Philadelphia, PA 19102 | 215.717.2777 | econsultsolutions.com
27 REGIONAL ECONOMIC IMPACT OF PHILADELPHIA INTERNATIONAL AIRPORT | FINAL
2.0 CAPITAL INVESTMENTS
PHL and its principal tenants are major initiators of capital projects to expand, refresh and
renovate the airport and related facilities. These projects represent a significant stimulus to the
local construction industry, which also benefits from their long-term and consistent nature.
Further, while capital investments themselves may be one-time, the benefits of major projects
such as runway extensions and terminal improvements accrue over the long-term by enhancing
the operating capacity and passenger experience at PHL. Importantly, these projects are funded
through airline-backed debt, user charges and federal and state grants, without any contribution
from the City of Philadelphia general fund.
DIRECT CAPITAL INVESTMENTS 2.1
The airport’s vision for capital projects includes the long-range Capacity Enhancement Program
(CEP) and a near-term, on-going Capital Improvement Program (CIP). Together, these programs
provide a long-term vision for the airport’s growth and a short-term plan for implementing the
priorities. PHL invests in a range of capital improvements on an annual basis, including major
projects, maintenance and repair activity, as well as land acquisition for current and future
expansions of activity. As of November 2016, recently completed projects and land acquisition
totaled $300 million, projects currently underway totaled $331 million, and total approved funding
for recent, current and future projects was more than $1.68 billion.
Major Projects
The majority of approved funding ($986 million, or 58 percent) is dedicated to major projects, with
20 percent ($334 million) slated for maintenance and repair activity and the remaining 22 percent
($365 million) to land acquisition. These major projects ultimately impact the customer experience
for PHL’s passengers, whether by enhancing the capacity and efficiency of the airfield or air
service or through improvements to the terminal and associated passenger amenities and
comforts. Table 2.1 below illustrates some of the major projects that have been recently
completed or are currently underway, most notably including a $203 million extension of Runway
9R-27L and a $161 million renovation of Terminal F featuring a new baggage claim building.
Econsult Solutions | 1435 Walnut Street, Ste. 400 | Philadelphia, PA 19102 | 215.717.2777 | econsultsolutions.com
28 REGIONAL ECONOMIC IMPACT OF PHILADELPHIA INTERNATIONAL AIRPORT | FINAL
TABLE 2.1 – MAJOR RECENT AND CURRENT PHL CAPITAL PROJECTS
Project Description Status Cost ($M)
Runway Extension Extension of Runway 9R-27L by nearly 1,500 feet and associated taxiway work
Current $202.8
Aircraft Deicing New aircraft deicing facility and state of the art trucking operation
Current $43.2
Terminal B ATC Replacement of outdated Air Temperature Control system
Current $21.0
Loading Bridges Replacement of loading bridges Current $20.0
Restrooms – Phase II Upgrades to Terminal D and E Current $10.0
Terminal F Expansion New baggage claim facility, expanded security, concourse and concessions
Completed $160.6
Terminal A Roof Replacement of 38,500 square foot roof Completed $8.0
Land Acquisition Acquisition of International Plaza and other parcels Completed $122.6
Source: PHL (2016)
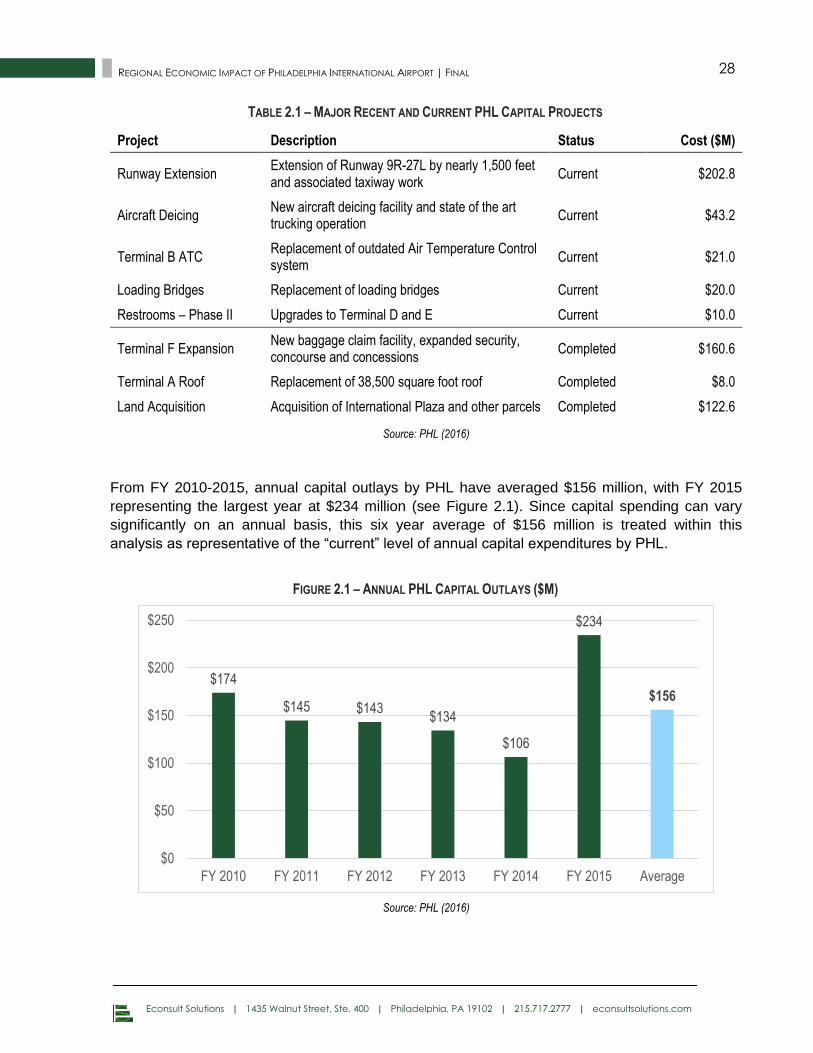
From FY 2010-2015, annual capital outlays by PHL have averaged $156 million, with FY 2015
representing the largest year at $234 million (see Figure 2.1). Since capital spending can vary
significantly on an annual basis, this six year average of $156 million is treated within this
analysis as representative of the “current” level of annual capital expenditures by PHL.
FIGURE 2.1 – ANNUAL PHL CAPITAL OUTLAYS ($M)
Source: PHL (2016)
$174
$145 $143 $134
$106
$234
$156
$0
$50
$100
$150
$200
$250
FY 2010 FY 2011 FY 2012 FY 2013 FY 2014 FY 2015 Average
Econsult Solutions | 1435 Walnut Street, Ste. 400 | Philadelphia, PA 19102 | 215.717.2777 | econsultsolutions.com
29 REGIONAL ECONOMIC IMPACT OF PHILADELPHIA INTERNATIONAL AIRPORT | FINAL
Data from PHL indicates that nearly 90% of contractors for current capital projects are located in
the Philadelphia region, including more than 25% in the City of Philadelphia. Further, 27% of
committed contract dollars for professional services on active projects (and 29% of dollars spent
to date) were with minority-owned or women-owned firms. Thus, these dollars brought into the
region contribute equitably across the regional economy.
Capital Funding Sources
The capital projects that PHL undertakes are funded by airport revenue bonds issued by the City,
commercial paper, federal and state grants, Passenger Facility Charges, and Customer Facility
Charges. Importantly, no funding is provided by the City’s general fund.
The largest funding source for capital projects is airline backed debt or charges, which
includes airport revenue bonds and commercial paper. For the approved capital projects,
over $1 billion, or 63%, of funding is from airline backed debt.
User fees, paid by airport customers, provide additional funding. Passenger Facility
Charges (PFC) are based on passenger ticket sales for flights boarding at PHL. The fees
are reserved for funding FAA-approved capital projects and debt service payments.
Customer Facility Charges (CFC) are fees collected by rental car operators for customers
renting vehicles at PHL. These proceeds will be used to construct a consolidated rental
car facility. Together, these charges make up 34% of funding for approved capital
projects.
The FAA has made a long-term commitment to PHL, issuing a Letter of Intent to
contribute funding towards the CEP. Since 2013, the agency has awarded PHL $85.9
million in grants for the runway extension project and land acquisition. The airport also
receives grant money for capital projects from a variety of other state and federal
agencies, like the Pennsylvania Department of Transportation’s Bureau of Aviation.
Finally, the airport’s operating revenue comes from rents and fees paid to PHL. Two-thirds
come from airlines, which pay landing fees, rent for terminal and ramp area space, and
fees to use international common use areas. The airport also gets revenue from nonairline
tenants, including those operating in and around the terminals and on the airfield. In FY
2015, the airport collected more than $310 million in revenue, which primarily funds day-
to-day operations but also finances short and long term capital projects as airline backed
debt.
Econsult Solutions | 1435 Walnut Street, Ste. 400 | Philadelphia, PA 19102 | 215.717.2777 | econsultsolutions.com
30 REGIONAL ECONOMIC IMPACT OF PHILADELPHIA INTERNATIONAL AIRPORT | FINAL
Third-Party Investments
Importantly, as explored throughout this report, PHL is not only itself a source of direct economic
activity, but enables the activity of a number of third-party (largely private sector operators). While
the Division of Aviation is the primary initiator of capital investments, major operators based at the
airport also make significant investments to improve the physical space and infrastructure that
they utilize. Notable among these are American Airlines and UPS, who by virtue of their hub
activities at PHL have significant facilities for their employees and activity which periodically
require repairs, upgrades and expansions.
American Airlines, in addition to being a significant contributor to the airport’s CEP, through fees
and charges, has made considerable capital investments in its airport facilities. Over the past
three years, American reports that it has invested approximately $100 million in improvements to
benefit employees and enhance the customer experience. Projects include the renovation of the
arrivals lounge, updated technology, and new break rooms for airport employees and flight crews.
American also invested in a new cold storage warehouse facility at the airport to meet the rising
demand for temperature-controlled transportation, particularly in the pharmaceuticals industry.
These investments attract customers, help retain employees, and cater to regional businesses,
benefitting both the airport and the residents and businesses of the area.
UPS operates its east coast region air hub out of its facilities at PHL. The Philadelphia location is
the company’s second busiest in the United States, based on daily flights. With a sorting facility of
681,000 square feet and a 66,000 square foot freight facility, UPS has a large footprint at PHL
and has invested a considerable amount in maintaining and improving its operations. UPS has
plans for a $13 million investment in expanding its ramp, which will increase the number of
aircraft able to park at the facility, increasing its capacity. The annual operations of UPS, which
are also an important driver of economic impact, will be discussed in section 5.1.7.
REGIONAL ECONOMIC IMPACT FROM CAPITAL INVESTMENTS 2.2
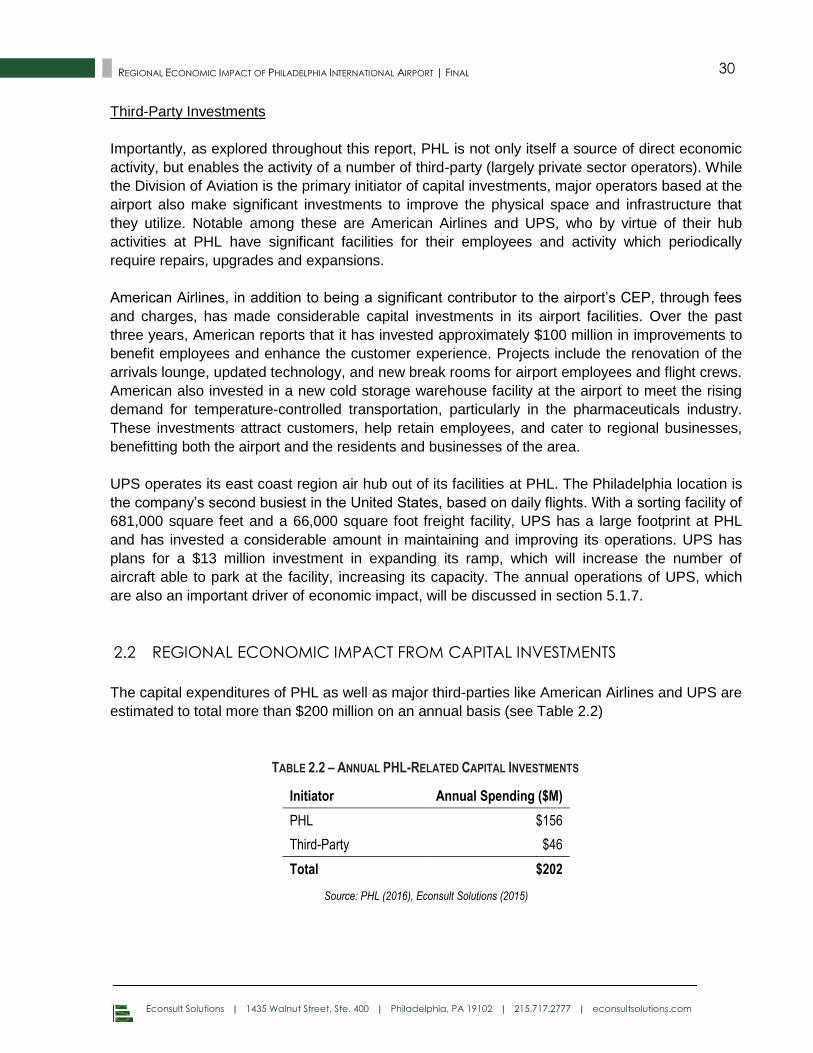
The capital expenditures of PHL as well as major third-parties like American Airlines and UPS are
estimated to total more than $200 million on an annual basis (see Table 2.2)
TABLE 2.2 – ANNUAL PHL-RELATED CAPITAL INVESTMENTS
Initiator Annual Spending ($M)
PHL $156
Third-Party $46
Total $202
Source: PHL (2016), Econsult Solutions (2015)
Econsult Solutions | 1435 Walnut Street, Ste. 400 | Philadelphia, PA 19102 | 215.717.2777 | econsultsolutions.com
31 REGIONAL ECONOMIC IMPACT OF PHILADELPHIA INTERNATIONAL AIRPORT | FINAL
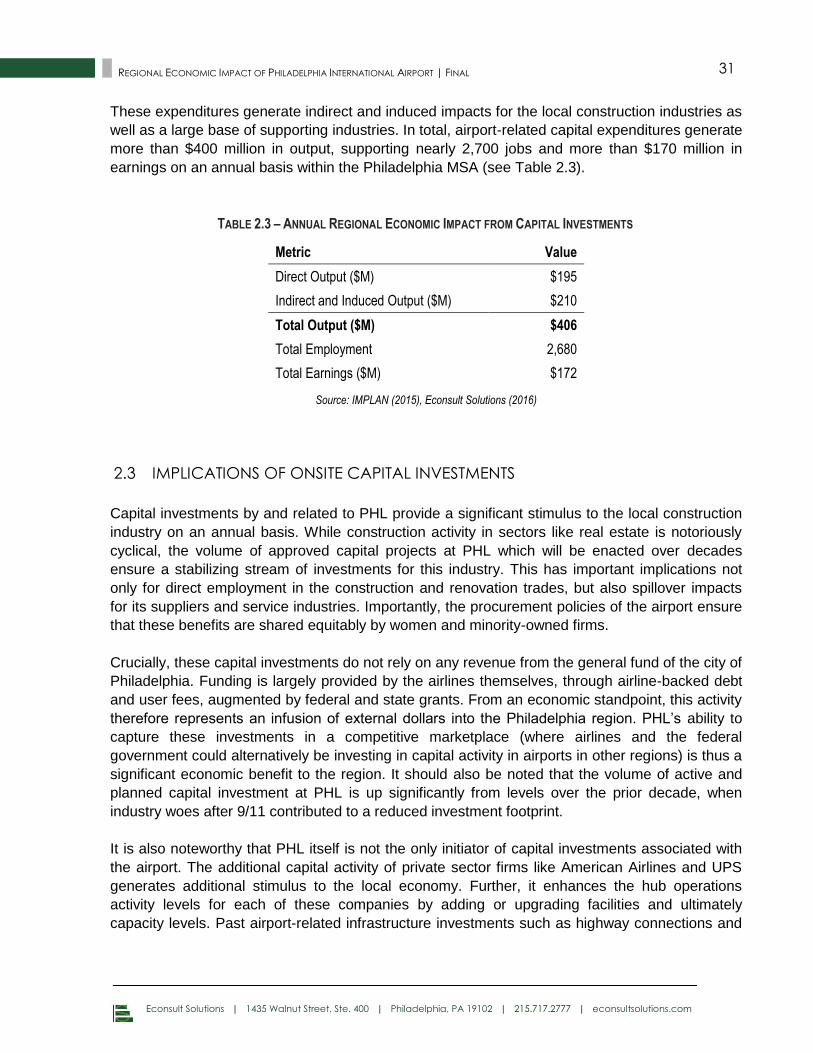
These expenditures generate indirect and induced impacts for the local construction industries as
well as a large base of supporting industries. In total, airport-related capital expenditures generate
more than $400 million in output, supporting nearly 2,700 jobs and more than $170 million in
earnings on an annual basis within the Philadelphia MSA (see Table 2.3).
TABLE 2.3 – ANNUAL REGIONAL ECONOMIC IMPACT FROM CAPITAL INVESTMENTS
Metric Value
Direct Output ($M) $195
Indirect and Induced Output ($M) $210
Total Output ($M) $406
Total Employment 2,680
Total Earnings ($M) $172
Source: IMPLAN (2015), Econsult Solutions (2016)
IMPLICATIONS OF ONSITE CAPITAL INVESTMENTS 2.3
Capital investments by and related to PHL provide a significant stimulus to the local construction
industry on an annual basis. While construction activity in sectors like real estate is notoriously
cyclical, the volume of approved capital projects at PHL which will be enacted over decades
ensure a stabilizing stream of investments for this industry. This has important implications not
only for direct employment in the construction and renovation trades, but also spillover impacts
for its suppliers and service industries. Importantly, the procurement policies of the airport ensure
that these benefits are shared equitably by women and minority-owned firms.
Crucially, these capital investments do not rely on any revenue from the general fund of the city of
Philadelphia. Funding is largely provided by the airlines themselves, through airline-backed debt
and user fees, augmented by federal and state grants. From an economic standpoint, this activity
therefore represents an infusion of external dollars into the Philadelphia region. PHL’s ability to
capture these investments in a competitive marketplace (where airlines and the federal
government could alternatively be investing in capital activity in airports in other regions) is thus a
significant economic benefit to the region. It should also be noted that the volume of active and
planned capital investment at PHL is up significantly from levels over the prior decade, when
industry woes after 9/11 contributed to a reduced investment footprint.
It is also noteworthy that PHL itself is not the only initiator of capital investments associated with
the airport. The additional capital activity of private sector firms like American Airlines and UPS
generates additional stimulus to the local economy. Further, it enhances the hub operations
activity levels for each of these companies by adding or upgrading facilities and ultimately
capacity levels. Past airport-related infrastructure investments such as highway connections and
Econsult Solutions | 1435 Walnut Street, Ste. 400 | Philadelphia, PA 19102 | 215.717.2777 | econsultsolutions.com
32 REGIONAL ECONOMIC IMPACT OF PHILADELPHIA INTERNATIONAL AIRPORT | FINAL
the SEPTA regional rail connection similarly enhance regional infrastructure over the long term in
addition to yielding a short-term stimulus.
This interplay between capital and operating activity also applies to the capital investments
undertaken by PHL. While this section focuses on the upfront economic impacts of construction
and renovation activity occurring each year, the creation, upgrading or expanding of facilities is
often undertaken to achieve an improved operating level on an ongoing basis after completion.
PHL’s CEP envisions a number of long-term investments that will ultimately support an increase
in the volume and size of aircraft coming in and out of the airport on a daily basis, a capacity
increase that would grow the airport’s economic impacts across many of the categories
calculated in this analysis. The $203 million extension of Runway 9R-27L and associated taxi
work is currently underway, allowing the airport to more successfully accommodate the latest
generation of larger long-distance aircraft.
Importantly, however, PHL’s capital investments and vision are focused not simply on capacity
enhancements but on improvements to the customer experience. This strategy reflects the fact
that the end customer for the airport is not the airlines, but rather the passengers, and it is those
passengers and their travel decisions and needs that ultimately generate the bulk of regional
economic impact from air service. To that end, recently completed and current construction
projects include numerous terminal upgrades, including a new baggage claim facility in Terminal
F, upgrades to key terminal infrastructure like restrooms and air temperature control systems, and
a full scale re-design of the customer experience in Terminal B, which will include iPads in the
waiting areas from which customers can not only surf the web and check emails but also order
from upgraded food and retail offerings. In 2017, American Express will open a 6,300-square-foot
“Centurion Lounge” at PHL. Catering to its credit card customers, the lounge will be American
Express’s eight in the U.S., and provide travelers with additional amenities, like private showers
and quiet work areas. These capital investments in the customer experience not only result in
upfront stimulus, but improve the value proposition that PHL delivers to the region and its
residents over the long-term.
Econsult Solutions | 1435 Walnut Street, Ste. 400 | Philadelphia, PA 19102 | 215.717.2777 | econsultsolutions.com
33 REGIONAL ECONOMIC IMPACT OF PHILADELPHIA INTERNATIONAL AIRPORT | FINAL
3.0 AVIATION DIVISION OPERATIONS
PHL and PNE are owned by the City of Philadelphia and operated by the City’s Division of
Aviation (DOA). In addition to the capital investments described in Section 2, the ongoing
operations of the airports facilitated by DOA entail a significant volume of employment and
procurement activities on an annual basis. Funding for these operating activities is generated
through a combination of fees, bonds and grants that are routed through the city’s Aviation Fund
and receive no contribution from the City’s general fund, meaning that airport operations are
completely self-sustaining. Most importantly, the operating activity of the DOA ultimately enables
the full range of air service connections that generate the range of economic impacts described
throughout this report.
DIRECT AVIATION DIVISION OPERATING EXPENDITURES 3.1
PHL’s operating expenditures totaled nearly $330 million in FY 2015 across three primary
categories:
Direct expenditures by DOA on personnel, contracted services, materials, supplies and
equipment in support of airport management and operations ($121 million in FY 2015);
Interfund transfers to compensate the City of Philadelphia for services such as police, fire
and utilities, as well as employee benefits for DOA employees ($114 million in FY 2015);
Debt service payments on historical borrowing for capital projects, net of new
contributions by the airlines ($94 million in FY 2015).
As discussed in Section 2.1, the airport’s operating revenue comes primarily from rents and fees,
with the airlines representing the largest contributors. This structure, along with the interfund
transfers to compensate the City of Philadelphia for services it contributes, ensures that the
airport is self-funding, and does not rely on any local tax dollars to support its operations.
PHL’s procurement policies promote diversity in its suppliers, ensuring that spending provides
opportunities for disadvantaged business enterprises. Data provided by PHL indicates that over
$25 million in current operating contracts, or 22%, are held by minority- and woman-owned
businesses.
Division of Aviation employees are subject to residency requirements within the city of
Philadelphia. In addition, PHL prioritizes inclusionary practices in its hiring, resulting in a diverse
workforce. Among the DOA’s workforce, 60% of employees identify as Black, 5% as Hispanic,
and 5% as Asian (see Figure 3.1).
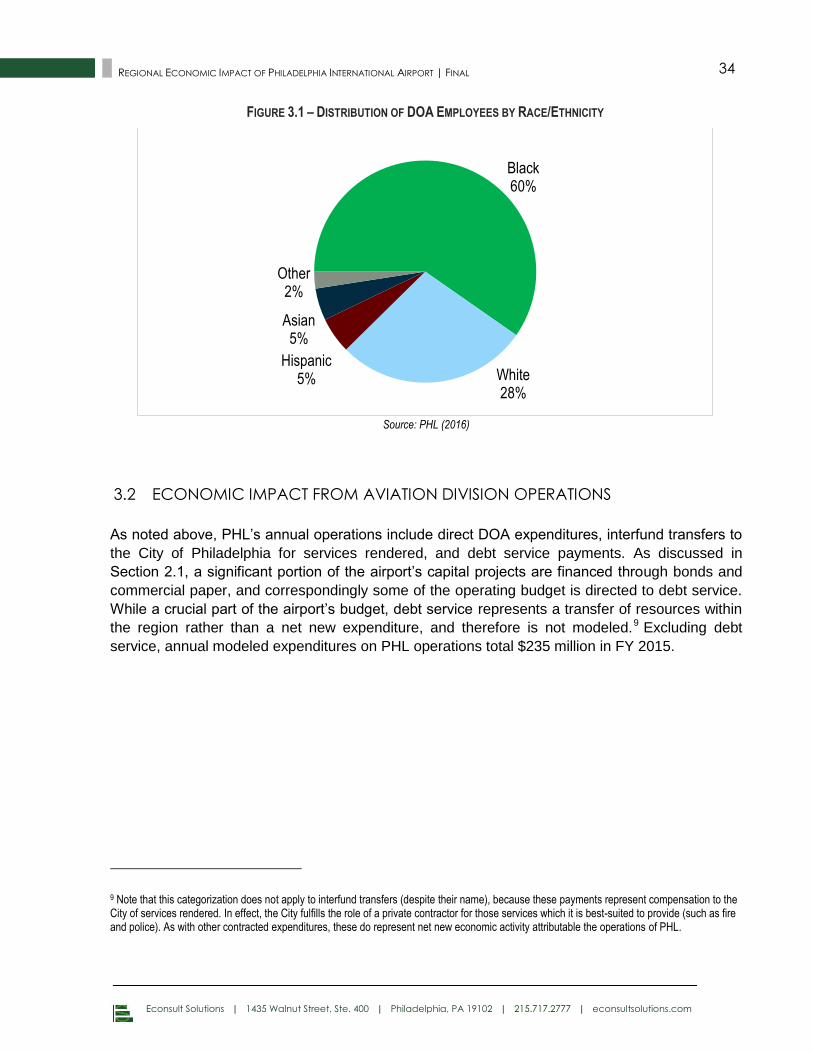
Econsult Solutions | 1435 Walnut Street, Ste. 400 | Philadelphia, PA 19102 | 215.717.2777 | econsultsolutions.com
34 REGIONAL ECONOMIC IMPACT OF PHILADELPHIA INTERNATIONAL AIRPORT | FINAL
FIGURE 3.1 – DISTRIBUTION OF DOA EMPLOYEES BY RACE/ETHNICITY
Source: PHL (2016)
ECONOMIC IMPACT FROM AVIATION DIVISION OPERATIONS 3.2
As noted above, PHL’s annual operations include direct DOA expenditures, interfund transfers to
the City of Philadelphia for services rendered, and debt service payments. As discussed in
Section 2.1, a significant portion of the airport’s capital projects are financed through bonds and
commercial paper, and correspondingly some of the operating budget is directed to debt service.
While a crucial part of the airport’s budget, debt service represents a transfer of resources within
the region rather than a net new expenditure, and therefore is not modeled.9 Excluding debt
service, annual modeled expenditures on PHL operations total $235 million in FY 2015.
9 Note that this categorization does not apply to interfund transfers (despite their name), because these payments represent compensation to the City of services rendered. In effect, the City fulfills the role of a private contractor for those services which it is best-suited to provide (such as fire and police). As with other contracted expenditures, these do represent net new economic activity attributable the operations of PHL.
Black 60%
White 28%
Hispanic 5%
Asian 5%
Other 2%
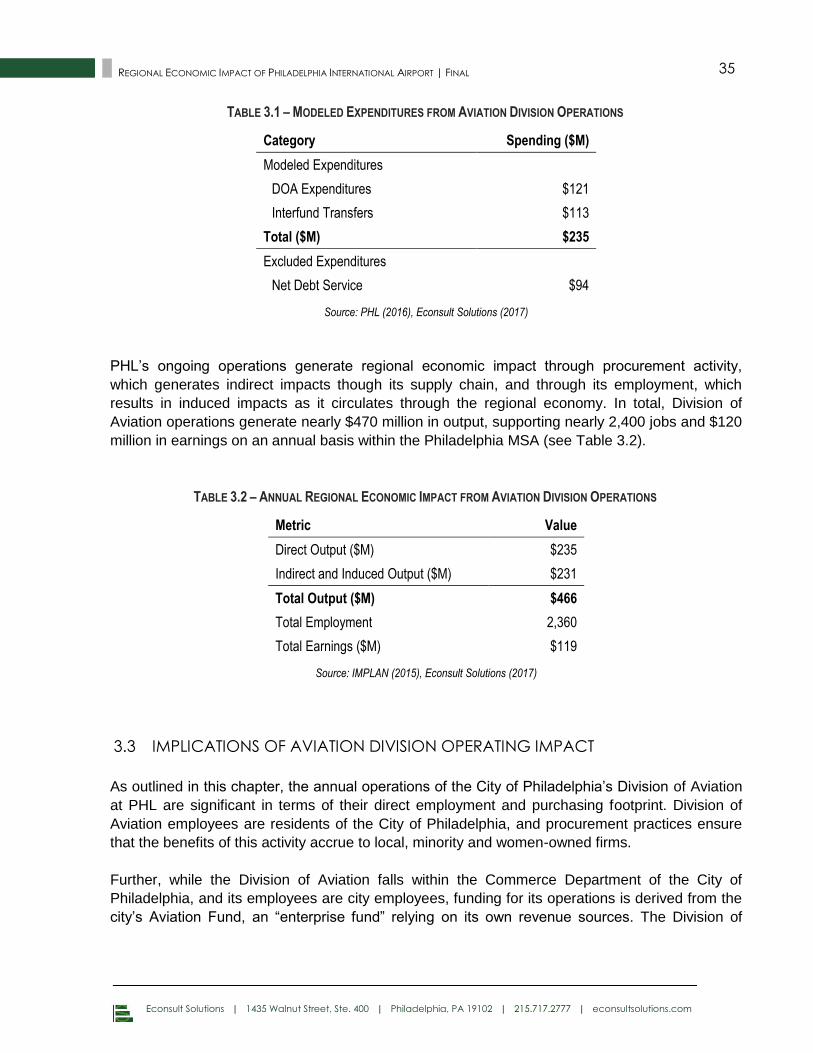
Econsult Solutions | 1435 Walnut Street, Ste. 400 | Philadelphia, PA 19102 | 215.717.2777 | econsultsolutions.com
35 REGIONAL ECONOMIC IMPACT OF PHILADELPHIA INTERNATIONAL AIRPORT | FINAL
TABLE 3.1 – MODELED EXPENDITURES FROM AVIATION DIVISION OPERATIONS
Category Spending ($M)
Modeled Expenditures
DOA Expenditures $121
Interfund Transfers $113
Total ($M) $235
Excluded Expenditures
Net Debt Service $94
Source: PHL (2016), Econsult Solutions (2017)
PHL’s ongoing operations generate regional economic impact through procurement activity,
which generates indirect impacts though its supply chain, and through its employment, which
results in induced impacts as it circulates through the regional economy. In total, Division of
Aviation operations generate nearly $470 million in output, supporting nearly 2,400 jobs and $120
million in earnings on an annual basis within the Philadelphia MSA (see Table 3.2).
TABLE 3.2 – ANNUAL REGIONAL ECONOMIC IMPACT FROM AVIATION DIVISION OPERATIONS
Metric Value
Direct Output ($M) $235
Indirect and Induced Output ($M) $231
Total Output ($M) $466
Total Employment 2,360
Total Earnings ($M) $119
Source: IMPLAN (2015), Econsult Solutions (2017)
IMPLICATIONS OF AVIATION DIVISION OPERATING IMPACT 3.3
As outlined in this chapter, the annual operations of the City of Philadelphia’s Division of Aviation
at PHL are significant in terms of their direct employment and purchasing footprint. Division of
Aviation employees are residents of the City of Philadelphia, and procurement practices ensure
that the benefits of this activity accrue to local, minority and women-owned firms.
Further, while the Division of Aviation falls within the Commerce Department of the City of
Philadelphia, and its employees are city employees, funding for its operations is derived from the
city’s Aviation Fund, an “enterprise fund” relying on its own revenue sources. The Division of
Econsult Solutions | 1435 Walnut Street, Ste. 400 | Philadelphia, PA 19102 | 215.717.2777 | econsultsolutions.com
36 REGIONAL ECONOMIC IMPACT OF PHILADELPHIA INTERNATIONAL AIRPORT | FINAL
Aviation also reimburses the city for all public services it provides (such as police and fire)
through an interfund transfer. These practices ensure that airport operations produce no liability
for City of Philadelphia taxpayers or the City’s general fund, but rather are entirely self-supporting.
Accordingly, this funding is not subject to the opportunity costs typically associated with
government investments, as it does not compete with other public priorities like city infrastructure,
education and social programs but rather enables the economic activity that funds those essential
services.
The economic value of airport operations, however, is not captured in its expenditure and
employment footprint, but in its central role in the regional transportation network. The operations
of the airport form a crucial link connecting the region to the rest of the country and rest of the
world, which in turn enables all of the business and leisure activity that these connections entail.
The chapters that follow will lay out the broad range of private business activity, tourism, and
residential benefit attributable to the existence and operations of PHL.
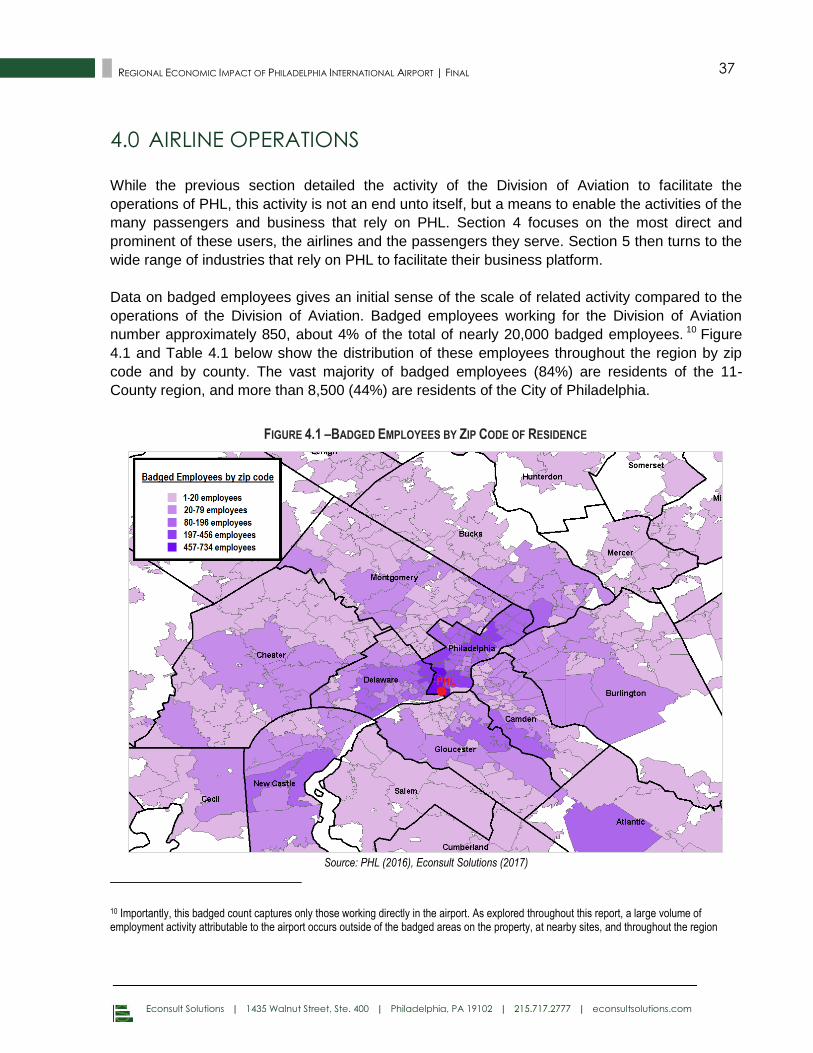
Econsult Solutions | 1435 Walnut Street, Ste. 400 | Philadelphia, PA 19102 | 215.717.2777 | econsultsolutions.com
37 REGIONAL ECONOMIC IMPACT OF PHILADELPHIA INTERNATIONAL AIRPORT | FINAL
4.0 AIRLINE OPERATIONS
While the previous section detailed the activity of the Division of Aviation to facilitate the
operations of PHL, this activity is not an end unto itself, but a means to enable the activities of the
many passengers and business that rely on PHL. Section 4 focuses on the most direct and
prominent of these users, the airlines and the passengers they serve. Section 5 then turns to the
wide range of industries that rely on PHL to facilitate their business platform.
Data on badged employees gives an initial sense of the scale of related activity compared to the
operations of the Division of Aviation. Badged employees working for the Division of Aviation
number approximately 850, about 4% of the total of nearly 20,000 badged employees. 10 Figure
4.1 and Table 4.1 below show the distribution of these employees throughout the region by zip
code and by county. The vast majority of badged employees (84%) are residents of the 11-
County region, and more than 8,500 (44%) are residents of the City of Philadelphia.
FIGURE 4.1 –BADGED EMPLOYEES BY ZIP CODE OF RESIDENCE
Source: PHL (2016), Econsult Solutions (2017)
10 Importantly, this badged count captures only those working directly in the airport. As explored throughout this report, a large volume of employment activity attributable to the airport occurs outside of the badged areas on the property, at nearby sites, and throughout the region
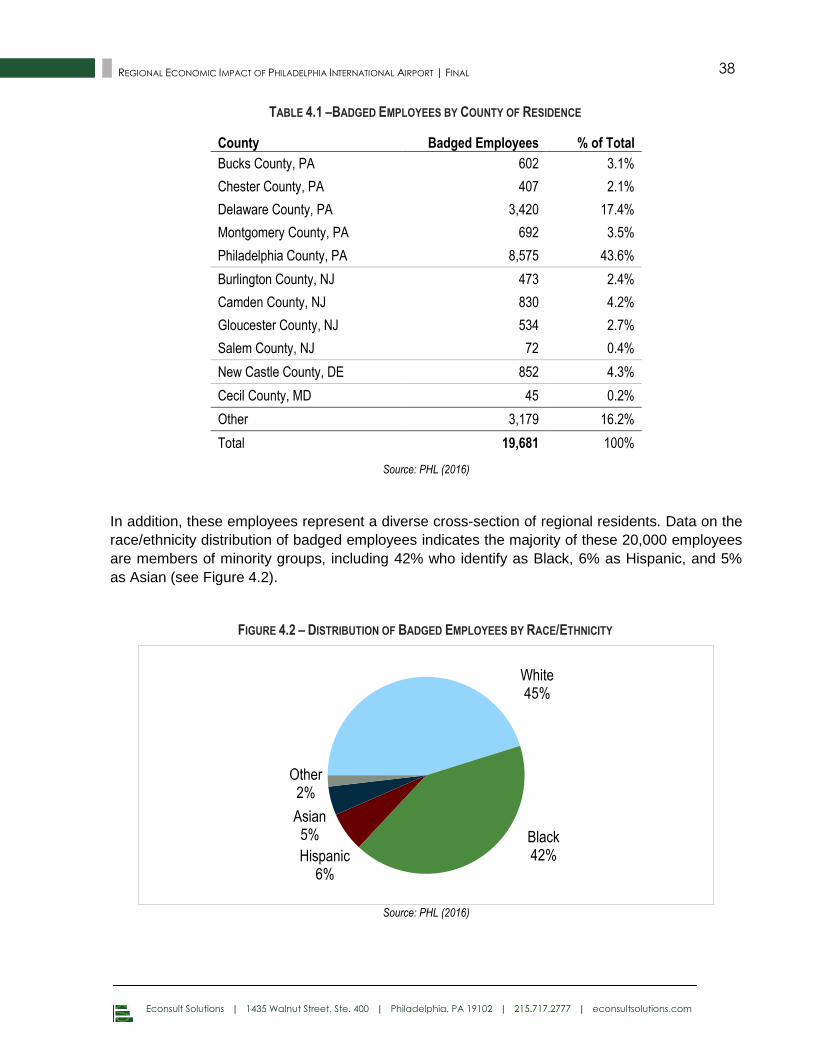
Econsult Solutions | 1435 Walnut Street, Ste. 400 | Philadelphia, PA 19102 | 215.717.2777 | econsultsolutions.com
38 REGIONAL ECONOMIC IMPACT OF PHILADELPHIA INTERNATIONAL AIRPORT | FINAL
TABLE 4.1 –BADGED EMPLOYEES BY COUNTY OF RESIDENCE
County Badged Employees % of Total
Bucks County, PA 602 3.1%
Chester County, PA 407 2.1%
Delaware County, PA 3,420 17.4%
Montgomery County, PA 692 3.5%
Philadelphia County, PA 8,575 43.6%
Burlington County, NJ 473 2.4%
Camden County, NJ 830 4.2%
Gloucester County, NJ 534 2.7%
Salem County, NJ 72 0.4%
New Castle County, DE 852 4.3%
Cecil County, MD 45 0.2%
Other 3,179 16.2%
Total 19,681 100%
Source: PHL (2016)
In addition, these employees represent a diverse cross-section of regional residents. Data on the
race/ethnicity distribution of badged employees indicates the majority of these 20,000 employees
are members of minority groups, including 42% who identify as Black, 6% as Hispanic, and 5%
as Asian (see Figure 4.2).
FIGURE 4.2 – DISTRIBUTION OF BADGED EMPLOYEES BY RACE/ETHNICITY
Source: PHL (2016)
White 45%
Black 42% Hispanic
6%
Asian 5%
Other 2%
Econsult Solutions | 1435 Walnut Street, Ste. 400 | Philadelphia, PA 19102 | 215.717.2777 | econsultsolutions.com
39 REGIONAL ECONOMIC IMPACT OF PHILADELPHIA INTERNATIONAL AIRPORT | FINAL
This section focuses on the largest category operators at PHL, the airlines that are its main
tenants and provide the core service to its passengers. In addition to enabling a wide range of
economic activity through the air service they provide, the airlines operating at PHL are major
employers and purchasers of goods and services within the Philadelphia region. Further, the
improved financial performance of the airline industry in recent years has allowed carriers,
including PHL’s major hub carrier American Airlines, to increase pay and benefits for their
employees, and to invest in their facilities within the airport.
DIRECT AIRLINE OPERATING EXPENDITURES 4.1
PHL is served by 25 different airline carriers, including major domestic carriers and their
subsidiaries. The airport was long the major East Coast hub for US Airways, which accounted for
a majority of total passenger traffic. US Airways merged in 2013 with American Airlines, and the
combined entity now operates as the world’s largest airline (by passenger traffic and revenue)
under the American Airlines brand. Table 4.2 below shows the distribution of PHL passenger
volume by airline in 2016:
American and its American Eagle partners carried 21.4 million passengers to and from
PHL, accounting for 71% of the 30.2 million total passengers.
Delta Airlines and United Airlines operate both directly and through partners (Delta
Connection and United Express, respectively) and served a combined 3.4 million
passengers in FY 2016, 11% of total passenger volume.
Low-cost and ultra low-cost carriers Southwest Airlines, Frontier Airlines, Spirit Airlines,
JetBlue Airways and Alaska Airlines combined to carry nearly 4.7 million passengers in
2016, 16% of total passenger volume, and continue to expand their footprint at PHL into
2017.
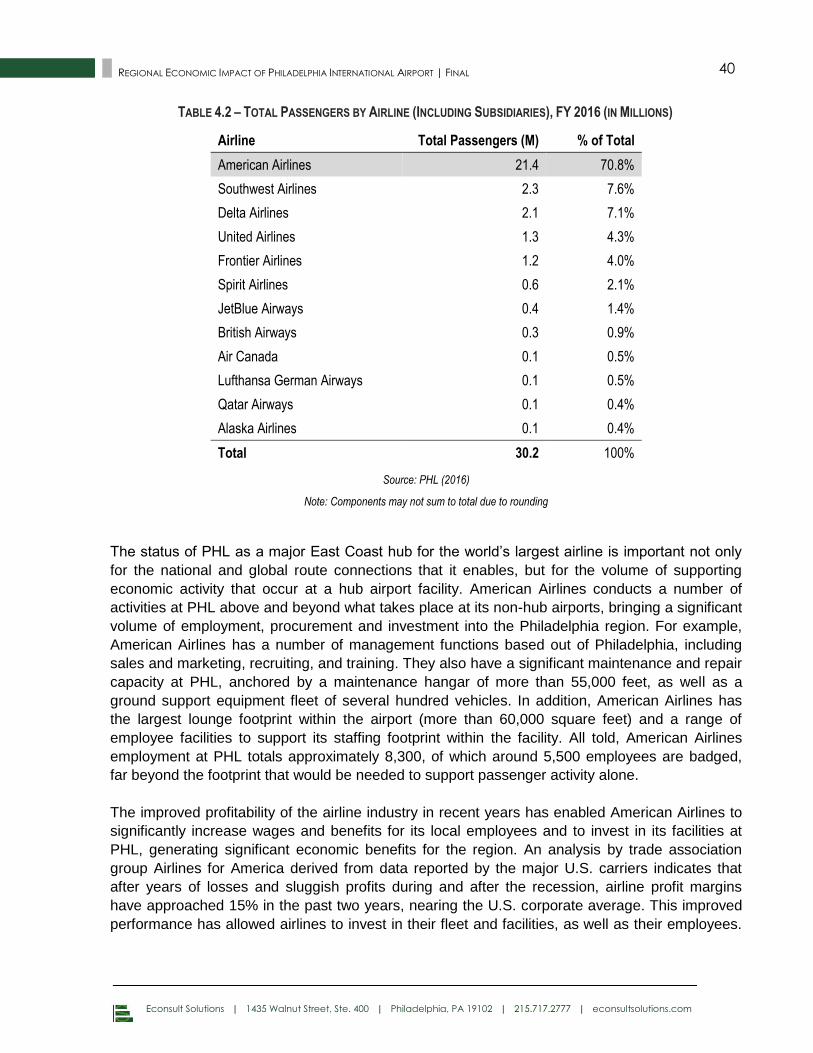
Econsult Solutions | 1435 Walnut Street, Ste. 400 | Philadelphia, PA 19102 | 215.717.2777 | econsultsolutions.com
40 REGIONAL ECONOMIC IMPACT OF PHILADELPHIA INTERNATIONAL AIRPORT | FINAL
TABLE 4.2 – TOTAL PASSENGERS BY AIRLINE (INCLUDING SUBSIDIARIES), FY 2016 (IN MILLIONS)
Airline Total Passengers (M) % of Total
American Airlines 21.4 70.8%
Southwest Airlines 2.3 7.6%
Delta Airlines 2.1 7.1%
United Airlines 1.3 4.3%
Frontier Airlines 1.2 4.0%
Spirit Airlines 0.6 2.1%
JetBlue Airways 0.4 1.4%
British Airways 0.3 0.9%
Air Canada 0.1 0.5%
Lufthansa German Airways 0.1 0.5%
Qatar Airways 0.1 0.4%
Alaska Airlines 0.1 0.4%
Total 30.2 100%
Source: PHL (2016)
Note: Components may not sum to total due to rounding
The status of PHL as a major East Coast hub for the world’s largest airline is important not only
for the national and global route connections that it enables, but for the volume of supporting
economic activity that occur at a hub airport facility. American Airlines conducts a number of
activities at PHL above and beyond what takes place at its non-hub airports, bringing a significant
volume of employment, procurement and investment into the Philadelphia region. For example,
American Airlines has a number of management functions based out of Philadelphia, including
sales and marketing, recruiting, and training. They also have a significant maintenance and repair
capacity at PHL, anchored by a maintenance hangar of more than 55,000 feet, as well as a
ground support equipment fleet of several hundred vehicles. In addition, American Airlines has
the largest lounge footprint within the airport (more than 60,000 square feet) and a range of
employee facilities to support its staffing footprint within the facility. All told, American Airlines
employment at PHL totals approximately 8,300, of which around 5,500 employees are badged,
far beyond the footprint that would be needed to support passenger activity alone.
The improved profitability of the airline industry in recent years has enabled American Airlines to
significantly increase wages and benefits for its local employees and to invest in its facilities at
PHL, generating significant economic benefits for the region. An analysis by trade association
group Airlines for America derived from data reported by the major U.S. carriers indicates that
after years of losses and sluggish profits during and after the recession, airline profit margins
have approached 15% in the past two years, nearing the U.S. corporate average. This improved
performance has allowed airlines to invest in their fleet and facilities, as well as their employees.
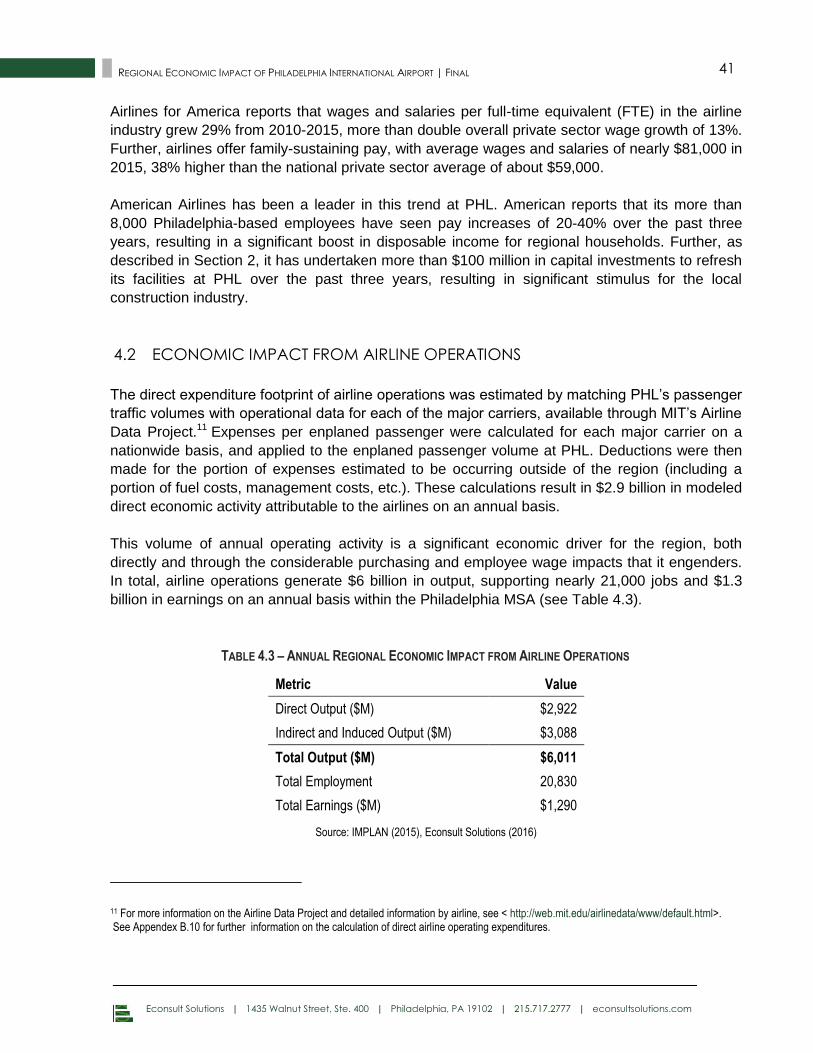
Econsult Solutions | 1435 Walnut Street, Ste. 400 | Philadelphia, PA 19102 | 215.717.2777 | econsultsolutions.com
41 REGIONAL ECONOMIC IMPACT OF PHILADELPHIA INTERNATIONAL AIRPORT | FINAL
Airlines for America reports that wages and salaries per full-time equivalent (FTE) in the airline
industry grew 29% from 2010-2015, more than double overall private sector wage growth of 13%.
Further, airlines offer family-sustaining pay, with average wages and salaries of nearly $81,000 in
2015, 38% higher than the national private sector average of about $59,000.
American Airlines has been a leader in this trend at PHL. American reports that its more than
8,000 Philadelphia-based employees have seen pay increases of 20-40% over the past three
years, resulting in a significant boost in disposable income for regional households. Further, as
described in Section 2, it has undertaken more than $100 million in capital investments to refresh
its facilities at PHL over the past three years, resulting in significant stimulus for the local
construction industry.
ECONOMIC IMPACT FROM AIRLINE OPERATIONS 4.2
The direct expenditure footprint of airline operations was estimated by matching PHL’s passenger
traffic volumes with operational data for each of the major carriers, available through MIT’s Airline
Data Project.11 Expenses per enplaned passenger were calculated for each major carrier on a
nationwide basis, and applied to the enplaned passenger volume at PHL. Deductions were then
made for the portion of expenses estimated to be occurring outside of the region (including a
portion of fuel costs, management costs, etc.). These calculations result in $2.9 billion in modeled
direct economic activity attributable to the airlines on an annual basis.
This volume of annual operating activity is a significant economic driver for the region, both
directly and through the considerable purchasing and employee wage impacts that it engenders.
In total, airline operations generate $6 billion in output, supporting nearly 21,000 jobs and $1.3
billion in earnings on an annual basis within the Philadelphia MSA (see Table 4.3).
TABLE 4.3 – ANNUAL REGIONAL ECONOMIC IMPACT FROM AIRLINE OPERATIONS
Metric Value
Direct Output ($M) $2,922
Indirect and Induced Output ($M) $3,088
Total Output ($M) $6,011
Total Employment 20,830
Total Earnings ($M) $1,290
Source: IMPLAN (2015), Econsult Solutions (2016) 11 For more information on the Airline Data Project and detailed information by airline, see < http://web.mit.edu/airlinedata/www/default.html>. See Appendex B.10 for further information on the calculation of direct airline operating expenditures.
Econsult Solutions | 1435 Walnut Street, Ste. 400 | Philadelphia, PA 19102 | 215.717.2777 | econsultsolutions.com
42 REGIONAL ECONOMIC IMPACT OF PHILADELPHIA INTERNATIONAL AIRPORT | FINAL
IMPLICATIONS OF AIRLINE OPERATIONS 4.3
As outlined in this chapter, the airlines operating out of PHL serve as major economic engines
through their employment, purchasing and physical investments within the region. The additional
hub-related activity of American Airlines enhances this footprint through additional management,
maintenance, and physical improvement activity in Philadelphia that could otherwise be taking
place in other regions. And the improved profitability of the airline industry has allowed American
and other carriers to raise wages in an industry that already featured above average salaries,
increasing disposable income that will circulate through the region.
The recent announcement by Frontier that the airline would not only be expanding routes into
Philadelphia, but would build a crew room and expand its flight attendant base in Philadelphia
serves as a smaller-scale example of the interrelationship between flight volume and supporting
economic activity.12 This announcement builds on a trend of increasing air service from low cost
carriers at PHL in recent years, with Alaska, Southwest, Frontier, Spirit and JetBlue offering no-
frills service appealing largely to the leisure market or to price-conscious business travelers. This
differentiation within the market allows PHL to cater to the wide variety of travelers in the region,
and increases the airports value to residents, businesses, and visitors.
Another addition to PHL air service is direct flights to Iceland on Icelandair. Philadelphia will be
Icelandair’s 17th city in North America, with nonstop flights to Reykjavik beginning in May 2017.
The introduction of Icelandair also benefits travelers by providing another connection point to
Europe. With 54 destinations from Reykjavik, travelers using PHL will have more options for
flights to destinations throughout Europe.
American Airlines, in addition to the considerable offering of domestic routes, connects
Philadelphia globally through its Oneworld alliance. As one of 12 member airlines, American
connects PHL travelers with destinations around the world, greatly enhancing the regions
connectivity. These added international routes follow the significant increase PHL saw in
transatlantic connections in the late 1990s and early 2000s. Promoting route growth benefits the
region’s residents by offering greater travel options. Businesses and the tourism industry also
benefit from the larger pool of potential trade partners and visitors. The economic impact from
new routes can be considerable. For example, 2014 studies of new routes initiated by British
Airways (from London to Austin) and Qatar Airways (from Doha to Miami) concluded that the
routes would generate $74 million13 and $78 million,14 respectively, in economic impact for the
U.S. cities.
12 Sasko, Claire, Frontier Adds Routes to Philadelphia International Airport. Philadelphia Magazine Online, December 15, 2016.
13 Phua, Rachel, New Austin-London Nonstop Paves the Way for More International Flights. Reporting Texas, November 25, 2014.
14 Simpson, Hannah, New Qatar Airways Flight Connects Miami, Middle East. Miami Herald, June 9, 2014.

Econsult Solutions | 1435 Walnut Street, Ste. 400 | Philadelphia, PA 19102 | 215.717.2777 | econsultsolutions.com
43 REGIONAL ECONOMIC IMPACT OF PHILADELPHIA INTERNATIONAL AIRPORT | FINAL
The airlines operating out of PHL are themselves an economic engine as a source of living-wage
jobs, procurement dollars, and investment. But beyond that considerable contribution, the airlines
are a catalyst to business growth more broadly. As is discussed further in Section 8, air service
influences a variety of business sectors, and these economic benefits ripple out to expand the
region’s entire economy.
Econsult Solutions | 1435 Walnut Street, Ste. 400 | Philadelphia, PA 19102 | 215.717.2777 | econsultsolutions.com
44 REGIONAL ECONOMIC IMPACT OF PHILADELPHIA INTERNATIONAL AIRPORT | FINAL
5.0 AIRPORT-RELATED OPERATIONS
The airport facility and its passenger activity facilitated by the Aviation Division and the airlines
support a range of related activity across a variety of industries. This section describes and
quantifies the economic impact from the annual operations of this related onsite and nearby
activity. Several industries are designed to serve passengers (ranging from retail, ground
transportation, parking, hotels, general aviation, and government services that ensure passenger
safety), while others capitalize on its location and transportation connections (including cargo and
freight, office, and aviation manufacturing). These related industries, rather than the direct
activities of the Aviation Division and the airlines, represent the majority of badged employees at
PHL, and they combine to represent billions of dollars in economic activity, with attendant
employment and purchasing impacts throughout the region.
DIRECT AIRPORT-RELATED OPERATING EXPENDITURES 5.1
Operating expenditures are estimated for nine industries located in and around PHL that rely on
the airport directly as their operating platform. In each instance, this activity is appropriate to
include as part of PHL’s total economic footprint because this activity would not be taking place in
its current form but for the existence of the airport. These include a mix of industries that directly
serve airport passengers, and those that capitalize on the location and logistics connections of
PHL. The industries quantified in this section are as follows:
Government captures the activity of federal and local government (beyond the Division of
Aviation) at PHL, primarily to ensure the safety and security of passengers (Section
5.1.1.);
Onsite Retail captures in-terminal shops and services, including food and beverage and
retailers (Section 5.1.2);
Parking captures both the onsite parking garages operated by the Philadelphia Parking
Authority and the nearby privately operated parking facilities (Section 5.1.3);
Ground Transportation captures activity from the variety of transportation modes that
take passengers to and from the airport, including rental cars, taxis and limousines, a
variety of shuttles, SEPTA, and most recently ridesharing operators (Section 5.1.4);
Hospitality captures activity at hotels in direct proximity to the airport (Section 5.1.5);
General Aviation captures activity associated with private and corporate flights into both
PHL and PNE (Section 5.1.6);
Econsult Solutions | 1435 Walnut Street, Ste. 400 | Philadelphia, PA 19102 | 215.717.2777 | econsultsolutions.com
45 REGIONAL ECONOMIC IMPACT OF PHILADELPHIA INTERNATIONAL AIRPORT | FINAL
Cargo, Freight and Mail captures activity related to the movement of goods through PHL
(Section 5.1.7);
Office and Commercial captures activity from tenants located in airport-owned facilities,
most notably International Plaza, and benefiting from the proximity to air service (Section
5.1.8); and
Aviation Manufacturing captures activity from large scale producers strategically located
to capitalize on airport facilities (Section 5.1.9).
Given the varying nature of these industries, a mix of analytical approaches is used to estimate
annual regional expenditures attributable to PHL in each category. A significant volume of data on
this activity is tracked by PHL, and this information has been supplemented with industry sources,
government data sets, and interviews with representatives of major firms. The body of this section
briefly reviews the data sources utilized in each category and presents estimated annual
operating activity. Appendix B provides a more detailed review of inputs and calculations utilized
in each category.
5.1.1 GOVERNMENT
Beyond the management and operations team at the Division of Aviation, a number of
government agencies operate at PHL to ensure the safety and security of the facility and its
passengers. Most notably, these include a variety of federal agencies, including:
Transportation Security Administration (TSA)
US Customs and Border Protection
US Immigration and Customs Enforcement
Federal Aviation Administration (FAA)
Federal Bureau of Investigation (FBI)
Alcohol, Tobacco and Firearms (ATF)
Drug Enforcement Administration (DEA)
These and other federal agencies perform essential functions like screening passengers,
directing air traffic, and addressing border-related issues for international passengers. This
activity requires a significant footprint of federal employees who work in Philadelphia on a daily
basis, as well as various purchasing needs like equipment. Accordingly, it brings a significant
volume of economic activity into the region (which due to its federal nature could easily be
transferred elsewhere absent PHL). This activity is supplemented by local government services
from the City of Philadelphia and Tinicum Township like police and fire safety.
Econsult Solutions | 1435 Walnut Street, Ste. 400 | Philadelphia, PA 19102 | 215.717.2777 | econsultsolutions.com
46 REGIONAL ECONOMIC IMPACT OF PHILADELPHIA INTERNATIONAL AIRPORT | FINAL
Security badge data provides the number of employees associated with each agency that
working within PHL. In total, nearly 1,800 government employees work at PHL, including
approximately 1,500 federal employees. Ratio analysis was then performed using publicly
available budget documents to determine the relationship between employment and expenditures
for each relevant agency, which yielded an estimated spending footprint in the Philadelphia
region. In aggregate, government expenditures are estimated to total $271 million per year.
5.1.2 ONSITE RETAIL
PHL’s seven terminal facilities feature approximately 180 concessions locations, which are filled
by a variety of tenants providing passengers with options such as food and beverage, specialty
retail, news and gifts, duty free, and services. These in-terminal options capture spending within
the Philadelphia region from both origin/destination and connecting passengers, and accordingly
support local employment. PHL’s current focus on the customer experience within the facility has
already begun to yield upgrades to these facilities, most notably a full scale revamp of offerings in
Terminal B, which will include iPads in the waiting areas from which customers can order from
upgraded food and retail offerings.
PHL’s in-terminal tenants report a variety of metrics through which their activity level can be
determined, including sales and employment. In-terminal sales total $219 million annually.
Accounting for the margin on retail items $161 million in estimated to stay within the region,15 with
the majority in food and beverage ($117 million) retail ($21 million), and services ($21 million).
5.1.3 PARKING
PHL features nearly 19,000 onsite public parking spots, including an 11,000 space garage, 7,100
space surface lot, and short-term parking of more than 800 spaces. These spaces are operated
and staffed by the Philadelphia Parking Authority, which shares a portion of the proceeds with
PHL. In addition, there are more than ten privately operated parking lots in close proximity to
PHL, including one which is a direct tenant of the airport. These facilities typically cater to long-
term parking needs, and offer shuttle service from their facilities into the airport. Spatial analysis
of these lots based on satellite imagery was performed to develop an estimate of 9,000 total
parking spaces available at these lots.
Financial statements from the Philadelphia Parking Authority isolate their revenues and
expenditures at from the PHL facility, which totaled $69 million in FY 2016. This operating
information is utilized to extrapolate operating costs for the private parking operators based on
the ratio of available spaces, yielding an estimate of $101 million in total operating costs for public
and private parking on and near the facility.
15 See Appendix B.2 for further info on the portion of retail sales modelable within the regional economy.
Econsult Solutions | 1435 Walnut Street, Ste. 400 | Philadelphia, PA 19102 | 215.717.2777 | econsultsolutions.com
47 REGIONAL ECONOMIC IMPACT OF PHILADELPHIA INTERNATIONAL AIRPORT | FINAL
5.1.4 GROUND TRANSPORTATION
Ground transportation encompasses a variety of vehicles used to get passengers to and from the
airport. PHL is situated approximately 15 minutes from downtown Philadelphia by car, and
passengers have a variety of transportation options to get to and from their destination, including
taxis, limousines, public transit, and most recently ridesharing providers Uber and Lyft. In
addition, PHL features 12 rental car providers with facilities on or near the airport, offering airline
passengers access to a vehicle during their trip. All of these modes support significant economic
activity and employment in the transportation sector.
PHL collects detailed information on the activities of these transportation providers in part through
a variety of fees that providers pay to access the airport facilities. This volume and revenue
information can be extrapolated to represent the annual operating activity associated with each
form of transportation. The largest of these categories in terms of revenue is rental cars, which
generated $194 million in gross revenue over the trailing twelve month period through October
2016. Total taxi trips exceeded 750,000 in calendar year 2015, generating an estimated $25
million in revenues, while total limousine activity generates an estimated $33 million in revenues
(due to its higher per trip price point). Ridesharing providers Uber and Lyft have only been able to
operate legally at PHL for a limited number of months to date, but have reached a new
agreement to operate and pay a fee per ride to PHL. Extrapolating from available data, Uber and
Lyft are estimated to generate $24 million in annual revenue from airport trips (a portion of which
accrues to PHL), a figure which has the potential to grow rapidly over time based on the explosive
growth rate of these services. Finally, fare revenue for the SEPTA airport line totals an estimated
$6 million annually. In the aggregate, ground transportation providers account for an estimated
$270 million in spending within the region on an annual basis.
5.1.5 HOSPITALITY
The airport area is also home to a significant stock of hotel supply, which largely serves passengers
utilizing the airport. Hotel analytics firm Smith Travel Research defines the Philadelphia
“Airport/Stadium market” as encompassing 33 properties with a total availability of nearly 5,300 hotel
rooms (as of October 2016). The largest of these hotels is the 419 room Airport Marriott, which is a
tenant of the airport and connected directly to the terminals. The remainder of rooms are located
offsite but proximate to the airport, with approximately 3,500 rooms located within the City of
Philadelphia and the remaining 1,800 in Tinicum Township in Delaware County.
Demand from the airport supports healthy performance metrics for the airport hotel market. Hotel
occupancy for these hotels was 71.4% in 2015, and in 2016 occupancy has increased by nearly 2%
through October. Rooms rented at an average daily rate of $118 in 2015, with healthy growth of
more than 5% year to date in 2016. Room revenue for these hotels totals $175 million on an annual
basis.
Econsult Solutions | 1435 Walnut Street, Ste. 400 | Philadelphia, PA 19102 | 215.717.2777 | econsultsolutions.com
48 REGIONAL ECONOMIC IMPACT OF PHILADELPHIA INTERNATIONAL AIRPORT | FINAL
In addition to room sales, hotels derive a portion of their revenue (and associated employment) from
services like food and beverage and space rentals for events. While these services can represent a
large proportion of revenue for downtown hotels, most airport hotels are limited service, and tend to
serve price sensitive consumers most concerned with easy access to PHL. One exception is the
Marriott Airport Hotel, which is categorized as full-service and features amenities like a fitness
center, restaurant, and in-room food delivery. Further, the Airport Marriott features 15,000 square
feet of meeting space, which is often booked for corporate events bringing together employees from
various locations due to its convenience and accessibility to the airport. Extrapolating from room
revenue, total revenue for airport hotels is estimated at $206 million annually.
5.1.6 GENERAL AVIATION
General Aviation covers a range of aviation activity outside of scheduled commercial air service,
including chartered flights, corporate aircraft, and recreational flying. PNE, which does not feature
scheduled commercial service, has 55,000 plane movements annually. There are approximately
175 general aviation aircraft based at PNE, including a mix of corporate and privately owned
aircraft.
In addition, PHL serves approximately 15,000 general aviation plane movement annually. While
small in volume, general aviation activity at PHL enables a high volume of cultural activity in the
region by serving visiting politicians and dignitaries, entertainers and sports teams, as well as
major corporations. Accordingly, it has a hand in enabling the significant economic activity
associated with these high-profile visitors.16
Atlantic Aviation is the chief general aviation operator at both PHL and PNE. Its onsite staff
handles services and ground transportation connections for chartered and corporate aircraft, from
aircraft maintenance to concierge services. In addition, major regional corporations like Comcast
and Aramark feature their own corporate aircraft and associated crew.
Data from the Bureau of Labor Statistics identifies more than 260 employees in the “non-
scheduled chartered passenger air transportation” sector within the Philadelphia MSA. Based on
industry data on payroll and expenditures as a portion of sales, general aviation activity is
estimated to represent $97 million in regional expenditures on an annual basis.
5.1.7 CARGO, FREIGHT AND MAIL
Logistics industries like cargo, mail and freight forwarding have a synergistic relationship with the
passenger movement activities of the airport. Many private operators use PHL’s air access and
facility as the basis for their business platform facilitating the movement of goods. Together, the
16 These broader catalytic effects are not quantified within this analysis, but are discussed at greater length in Section 8 of this report.
Econsult Solutions | 1435 Walnut Street, Ste. 400 | Philadelphia, PA 19102 | 215.717.2777 | econsultsolutions.com
49 REGIONAL ECONOMIC IMPACT OF PHILADELPHIA INTERNATIONAL AIRPORT | FINAL
cargo, freight and mail carriers at PHL combine to move more than 420,000 tons of freight and
24,000 tons of air mail on an annual basis. This has considerable implications for the regional
economy and its ability to move goods and establish trade relationships around the world (as
discussed in more detail in Section 8). More narrowly, it supports considerable activity and
employment in the logistics industry centered on PHL.
Most prominently, the East Coast regional hub for UPS is located on a privately owned parcel at
the south end of the airport property, abutting the Delaware River. This hub is a major cog in
UPS’s overnight delivery system, with packages to and from destinations up and down the East
Coast flown into Philadelphia, sorted at the onsite facility, and then routed to their destination.
PHL also serves a key connection point with UPS’s main European hub in Koln, Germany.
The UPS facility at PHL is 681,000 square feet, with the capability to sort nearly 100,000
packages or documents per hour. The range of operations supports year-round employment of
around 3,000 at the facility, ramping up to around 5,000 for the holiday rush. The size and scope
of this operation means that UPS’s footprint at PHL includes a range of jobs from pilots and
aircraft support to sorting and loading functions within the facilities to management. This figure
does not include the array of UPS drivers and related facilities around the region that help to carry
locally based packages to and from PHL and to their destinations around the region. In addition,
as discussed in Section 2, UPS undertakes capital investments at PHL in support of its facilities
and operations.
According to airport data, UPS accounts for approximately 2/3 of the more than 420,000 tons of
freight that moves through PHL annually. FedEx also has a sizeable operating footprint at the
airport, and a number of smaller logistics specialists are located in close proximity to the airport to
take advantage of its transportation connections. Airlines are also major cargo carriers, utilizing
the bellies of passenger aircraft for cargo delivery. American Airlines represents the third largest
cargo carrier at PHL, behind only UPS and FedEx.
Total expenditures within the Philadelphia region in these categories are extrapolated based on
publicly available financial information from UPS, and known activity levels of UPS in the
Philadelphia region relative to other carriers and forwarders. In total, it is estimated that the cargo,
freight forwarder and mail activities result in total expenditures of $420 million in the Philadelphia
region on an annual basis.17
5.1.8 OFFICE AND COMMERCIAL
In addition the logistics industry, which derives obvious benefits from airport access, commercial
and office activity can also benefit from proximity to the airport. The area surrounding the airport
17 Note that this estimate does not capture the value of the cargo itself, which is likely to be several billion due to the high value nature of many items like pharmaceuticals, but instead only captures the activity of logistics intermediaries related to the movement of these goods.
Econsult Solutions | 1435 Walnut Street, Ste. 400 | Philadelphia, PA 19102 | 215.717.2777 | econsultsolutions.com
50 REGIONAL ECONOMIC IMPACT OF PHILADELPHIA INTERNATIONAL AIRPORT | FINAL
features a range of corporate uses, with tenants able to easily access PHL to visit other locations
or clients.
In July 2015, PHL purchased International Plaza, a two-building, 500,000 square foot office
complex immediately adjacent to the airport terminals. This facility hosts a range of tenants,
mixing airport related companies and government agencies with other firms attracted to its
logistical advantages. This acquisition greatly increases the scale of commercial tenants on
airport property, which also include commercial and office buildings at PNE.
Based on company information provided by PHL, including square footage and rental rates, it is
possible to develop an estimate of revenues and expenditures associated with the commercial
and office activities in these facilities rented directly by PHL. Firm expenditures associated with
these facilities are estimated at $193 million on an annual basis.18
5.1.9 AVIATION MANUFACTURING
Finally, the airport and its physical assets are a platform for high value aviation manufacturing
that takes place on or adjacent to airport facilities. Leonardo, which manufactures and sells
AgustaWestland helicopters, is the largest tenant within PNE, and uses its airspace for testing
and training flights. In addition, Boeing has a major manufacturing plant producing military-grade
helicopters located in Ridley Township, along the Delaware River in close proximity to PHL.
These advanced manufacturing activities benefit from the physical capacity and connections of
the airport, and bring high value economic activity into the Philadelphia region.
Leonardo is the Italy-based parent company of the AgustaWestland helicopter production facility
at PNE. The site not only features production and assembly of aircraft but is the corporate
headquarters and key connection point for the company to the valuable U.S. market. Accordingly,
the site features a fleet operations center, including training, sales and repairs, as well as
management activities like corporate communications and human resources. Sales visits and
training often bring wealthy individuals to PNE and the region to experience AgustaWestland
helicopters for themselves. Total employment at the site is more then 500, and the site is
responsible for approximately one-quarter of the helicopters delivered by Leonardo on an annual
basis.
Boeing’s Ridley operation produces Chinook and Osprey helicopters for the U.S military and
international purchasers. The plant was the site of a $130 million investment to expand
production capacity in 2011, and currently employs approximately 4,700 people to support its
advanced manufacturing activity. Another nearby firm capitalizing on airport proximity is Sky
Chefs, which offers catering, onboard retail, equipment and logistics solutions to its airline
partners from its location directly east of the airport property.
18 Note that this approach conservatively includes only commercial and office tenants in property directly held by PHL, and not those at nearby locations like the AmeriHealth Caritas headquarters.
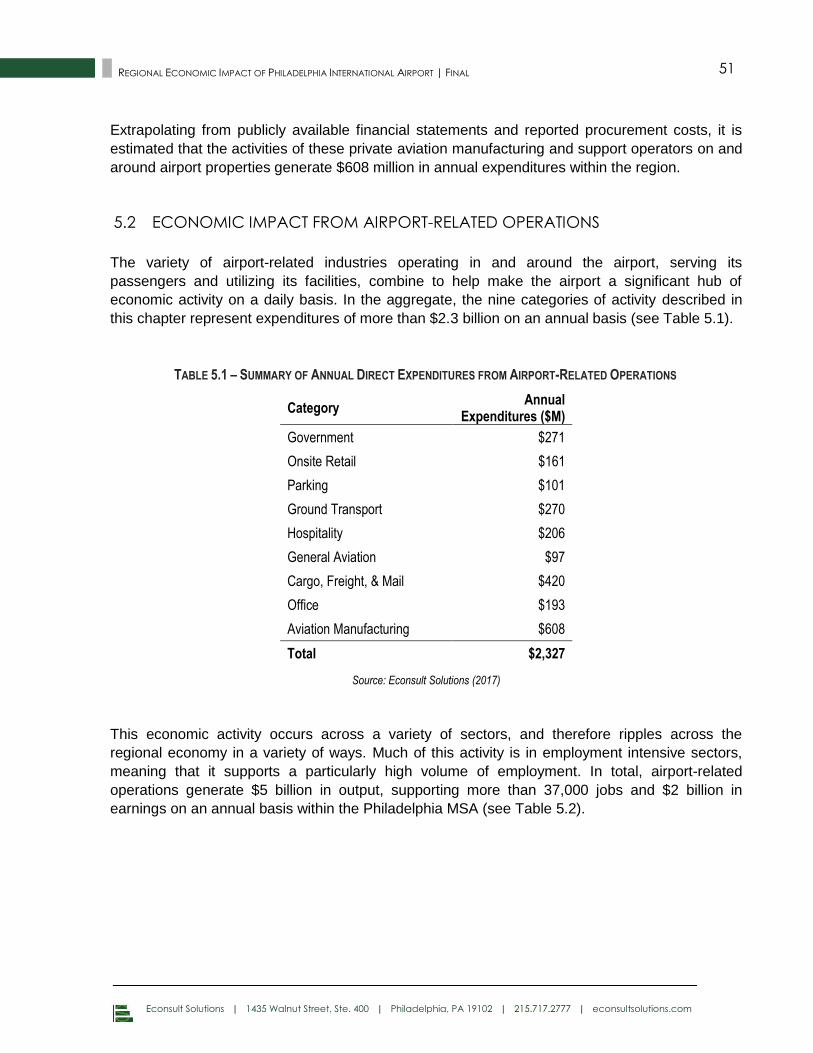
Econsult Solutions | 1435 Walnut Street, Ste. 400 | Philadelphia, PA 19102 | 215.717.2777 | econsultsolutions.com
51 REGIONAL ECONOMIC IMPACT OF PHILADELPHIA INTERNATIONAL AIRPORT | FINAL
Extrapolating from publicly available financial statements and reported procurement costs, it is
estimated that the activities of these private aviation manufacturing and support operators on and
around airport properties generate $608 million in annual expenditures within the region.
ECONOMIC IMPACT FROM AIRPORT-RELATED OPERATIONS 5.2
The variety of airport-related industries operating in and around the airport, serving its
passengers and utilizing its facilities, combine to help make the airport a significant hub of
economic activity on a daily basis. In the aggregate, the nine categories of activity described in
this chapter represent expenditures of more than $2.3 billion on an annual basis (see Table 5.1).
TABLE 5.1 – SUMMARY OF ANNUAL DIRECT EXPENDITURES FROM AIRPORT-RELATED OPERATIONS
Category Annual
Expenditures ($M)
Government $271
Onsite Retail $161
Parking $101
Ground Transport $270
Hospitality $206
General Aviation $97
Cargo, Freight, & Mail $420
Office $193
Aviation Manufacturing $608
Total $2,327
Source: Econsult Solutions (2017)
This economic activity occurs across a variety of sectors, and therefore ripples across the
regional economy in a variety of ways. Much of this activity is in employment intensive sectors,
meaning that it supports a particularly high volume of employment. In total, airport-related
operations generate $5 billion in output, supporting more than 37,000 jobs and $2 billion in
earnings on an annual basis within the Philadelphia MSA (see Table 5.2).
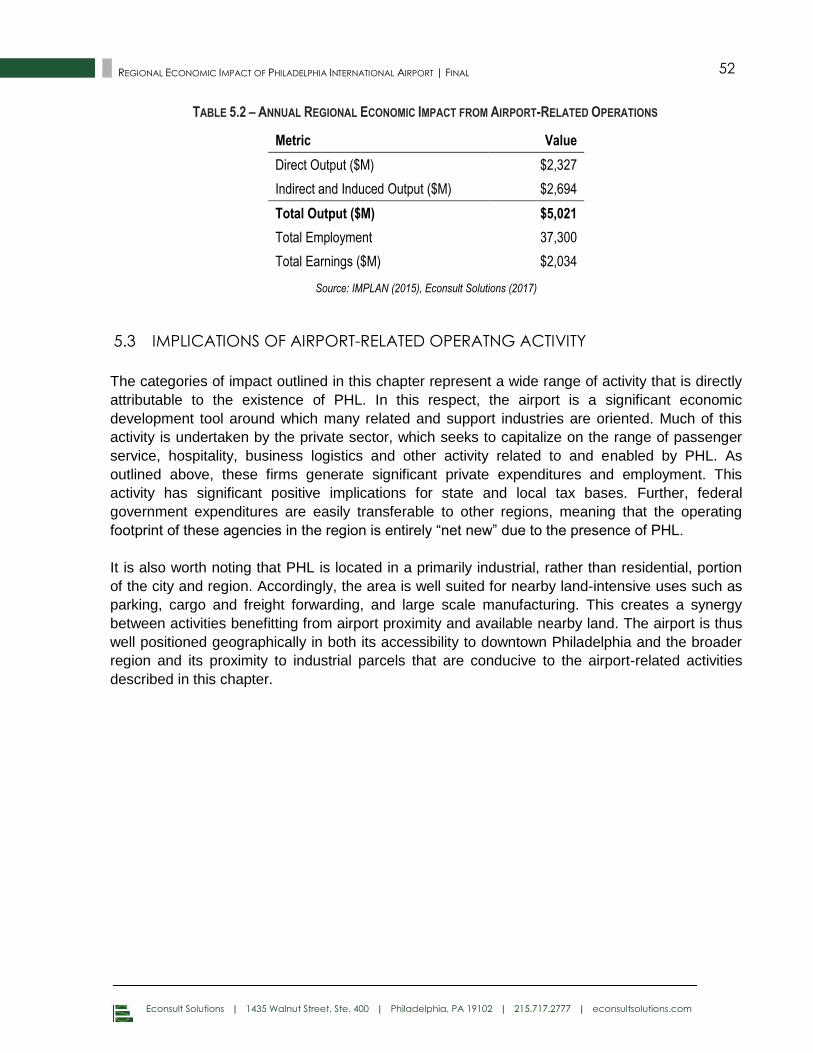
Econsult Solutions | 1435 Walnut Street, Ste. 400 | Philadelphia, PA 19102 | 215.717.2777 | econsultsolutions.com
52 REGIONAL ECONOMIC IMPACT OF PHILADELPHIA INTERNATIONAL AIRPORT | FINAL
TABLE 5.2 – ANNUAL REGIONAL ECONOMIC IMPACT FROM AIRPORT-RELATED OPERATIONS
Metric Value
Direct Output ($M) $2,327
Indirect and Induced Output ($M) $2,694
Total Output ($M) $5,021
Total Employment 37,300
Total Earnings ($M) $2,034
Source: IMPLAN (2015), Econsult Solutions (2017)
IMPLICATIONS OF AIRPORT-RELATED OPERATNG ACTIVITY 5.3
The categories of impact outlined in this chapter represent a wide range of activity that is directly
attributable to the existence of PHL. In this respect, the airport is a significant economic
development tool around which many related and support industries are oriented. Much of this
activity is undertaken by the private sector, which seeks to capitalize on the range of passenger
service, hospitality, business logistics and other activity related to and enabled by PHL. As
outlined above, these firms generate significant private expenditures and employment. This
activity has significant positive implications for state and local tax bases. Further, federal
government expenditures are easily transferable to other regions, meaning that the operating
footprint of these agencies in the region is entirely “net new” due to the presence of PHL.
It is also worth noting that PHL is located in a primarily industrial, rather than residential, portion
of the city and region. Accordingly, the area is well suited for nearby land-intensive uses such as
parking, cargo and freight forwarding, and large scale manufacturing. This creates a synergy
between activities benefitting from airport proximity and available nearby land. The airport is thus
well positioned geographically in both its accessibility to downtown Philadelphia and the broader
region and its proximity to industrial parcels that are conducive to the airport-related activities
described in this chapter.
Econsult Solutions | 1435 Walnut Street, Ste. 400 | Philadelphia, PA 19102 | 215.717.2777 | econsultsolutions.com
53 REGIONAL ECONOMIC IMPACT OF PHILADELPHIA INTERNATIONAL AIRPORT | FINAL
6.0 REGIONAL TOURISM
An additional industry that relies heavily on transportation connections such as the airport is
tourism and hospitality. Tourism activity is highly valuable from an economic development
standpoint, because it (by definition) involves an infusion of spending from outside of the region
that circulates and supports employment locally. Further, leisure and business visitation facilitate
both a familiarity of place and business connections that ultimately enhance business and
residential attraction efforts. Notably, air access facilitates tourism activity from far away points
nationally and internationally, which tend to be associated with longer stays and a higher
spending footprint. The airport also facilitates outbound travel by regional residents. In addition to
the benefits this provides to residents (discussed in Section 7), this enables the activity of the
local travel arrangement industry, which relies to a large extent on booking air travel.
DIRECT REGIONAL TOURISM EXPENDITURES ATTRIBUTABLE TO THE AIRPORT 6.1
Two categories of economic activity attributable to the airport fall under the broad heading of
regional tourism. The first (and largest) is visitor spending, meaning the dollars that airport
passengers from outside the area bring into the region and spend locally during their trip. The
second is the portion of spending from the local travel arrangement industry (i.e. travel agents
based in the region and serving regional residents booking flights through PHL).19 This section
discusses the methods and results for estimating the magnitude of airport-attributable direct
expenditures within the region in each of these categories on an annual basis.
6.1.1 VISITOR SPENDING
Visitor spending serves as a major economic engine for the Greater Philadelphia region, with
tourism and hospitality representing one of the major job growth sectors in the city and regional
economy over the past two decades. Spending by out of towners ripples through sectors like
lodging, food and beverage, and retail, and arts and culture, supporting many of the quality of life
amenities that locals also enjoy.
ESI was commissioned by regional tourism promotion agency Visit Philadelphia to produce an
economic impact analysis of visitor spending in the 5-County Greater Philadelphia region
covering Bucks, Chester, Delaware and Montgomery County. That analysis concluded that
visitors directly spent more than $6.6 billion within the 5-County region in 2015, and that this
spending generated a total economic impact of more than $10.7 billion each year. That analysis
19 Note that the spending of regional residents on airfare itself is already reflected elsewhere in this report (most notably in Section 4, which details airline operations). This category addresses only the additional revenues (and resulting operations) captured by the travel operations industry above and beyond the base travel-related fares.
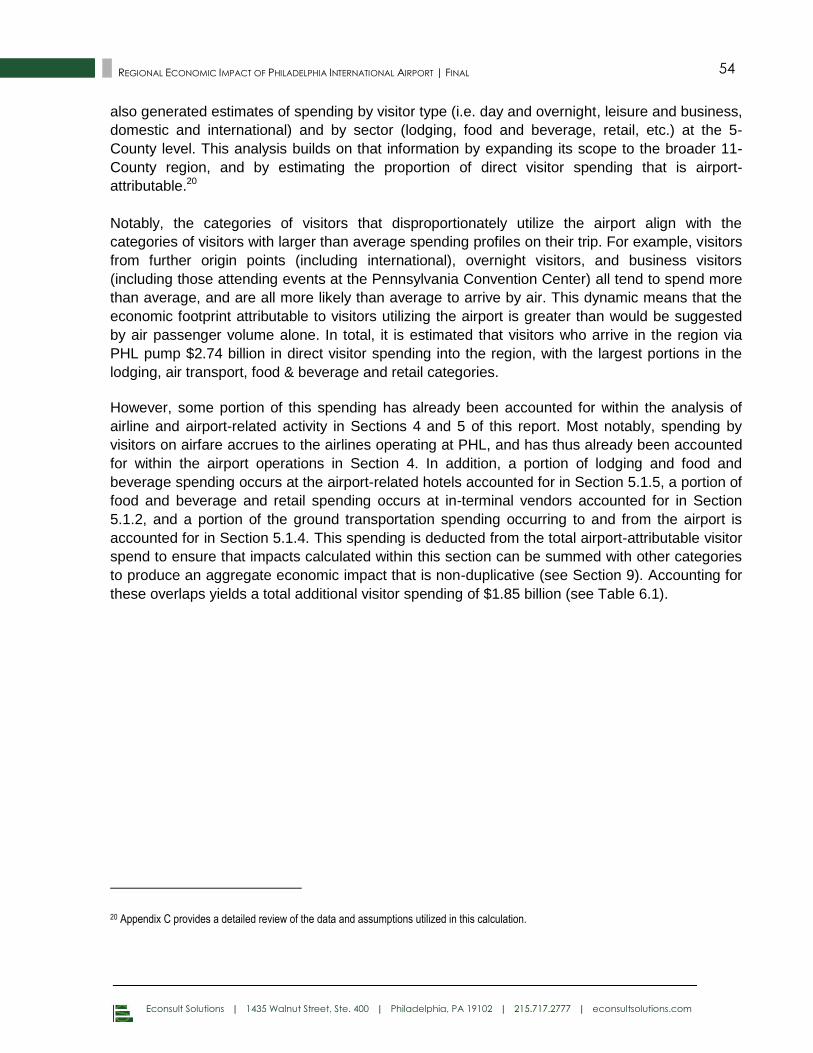
Econsult Solutions | 1435 Walnut Street, Ste. 400 | Philadelphia, PA 19102 | 215.717.2777 | econsultsolutions.com
54 REGIONAL ECONOMIC IMPACT OF PHILADELPHIA INTERNATIONAL AIRPORT | FINAL
also generated estimates of spending by visitor type (i.e. day and overnight, leisure and business,
domestic and international) and by sector (lodging, food and beverage, retail, etc.) at the 5-
County level. This analysis builds on that information by expanding its scope to the broader 11-
County region, and by estimating the proportion of direct visitor spending that is airport-
attributable.20
Notably, the categories of visitors that disproportionately utilize the airport align with the
categories of visitors with larger than average spending profiles on their trip. For example, visitors
from further origin points (including international), overnight visitors, and business visitors
(including those attending events at the Pennsylvania Convention Center) all tend to spend more
than average, and are all more likely than average to arrive by air. This dynamic means that the
economic footprint attributable to visitors utilizing the airport is greater than would be suggested
by air passenger volume alone. In total, it is estimated that visitors who arrive in the region via
PHL pump $2.74 billion in direct visitor spending into the region, with the largest portions in the
lodging, air transport, food & beverage and retail categories.
However, some portion of this spending has already been accounted for within the analysis of
airline and airport-related activity in Sections 4 and 5 of this report. Most notably, spending by
visitors on airfare accrues to the airlines operating at PHL, and has thus already been accounted
for within the airport operations in Section 4. In addition, a portion of lodging and food and
beverage spending occurs at the airport-related hotels accounted for in Section 5.1.5, a portion of
food and beverage and retail spending occurs at in-terminal vendors accounted for in Section
5.1.2, and a portion of the ground transportation spending occurring to and from the airport is
accounted for in Section 5.1.4. This spending is deducted from the total airport-attributable visitor
spend to ensure that impacts calculated within this section can be summed with other categories
to produce an aggregate economic impact that is non-duplicative (see Section 9). Accounting for
these overlaps yields a total additional visitor spending of $1.85 billion (see Table 6.1).
20 Appendix C provides a detailed review of the data and assumptions utilized in this calculation.
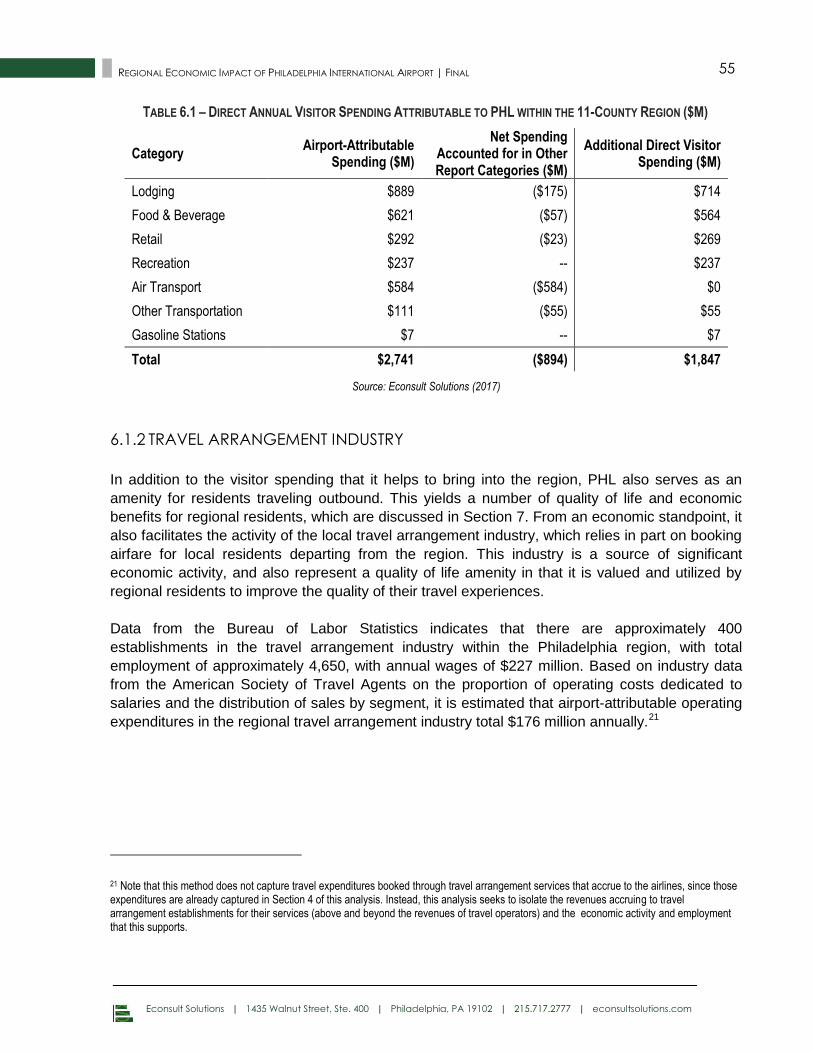
Econsult Solutions | 1435 Walnut Street, Ste. 400 | Philadelphia, PA 19102 | 215.717.2777 | econsultsolutions.com
55 REGIONAL ECONOMIC IMPACT OF PHILADELPHIA INTERNATIONAL AIRPORT | FINAL
TABLE 6.1 – DIRECT ANNUAL VISITOR SPENDING ATTRIBUTABLE TO PHL WITHIN THE 11-COUNTY REGION ($M)
Category Airport-Attributable
Spending ($M)
Net Spending Accounted for in Other Report Categories ($M)
Additional Direct Visitor Spending ($M)
Lodging $889 ($175) $714
Food & Beverage $621 ($57) $564
Retail $292 ($23) $269
Recreation $237 -- $237
Air Transport $584 ($584) $0
Other Transportation $111 ($55) $55
Gasoline Stations $7 -- $7
Total $2,741 ($894) $1,847
Source: Econsult Solutions (2017)
6.1.2 TRAVEL ARRANGEMENT INDUSTRY
In addition to the visitor spending that it helps to bring into the region, PHL also serves as an
amenity for residents traveling outbound. This yields a number of quality of life and economic
benefits for regional residents, which are discussed in Section 7. From an economic standpoint, it
also facilitates the activity of the local travel arrangement industry, which relies in part on booking
airfare for local residents departing from the region. This industry is a source of significant
economic activity, and also represent a quality of life amenity in that it is valued and utilized by
regional residents to improve the quality of their travel experiences.
Data from the Bureau of Labor Statistics indicates that there are approximately 400
establishments in the travel arrangement industry within the Philadelphia region, with total
employment of approximately 4,650, with annual wages of $227 million. Based on industry data
from the American Society of Travel Agents on the proportion of operating costs dedicated to
salaries and the distribution of sales by segment, it is estimated that airport-attributable operating
expenditures in the regional travel arrangement industry total $176 million annually.21
21 Note that this method does not capture travel expenditures booked through travel arrangement services that accrue to the airlines, since those expenditures are already captured in Section 4 of this analysis. Instead, this analysis seeks to isolate the revenues accruing to travel arrangement establishments for their services (above and beyond the revenues of travel operators) and the economic activity and employment that this supports.
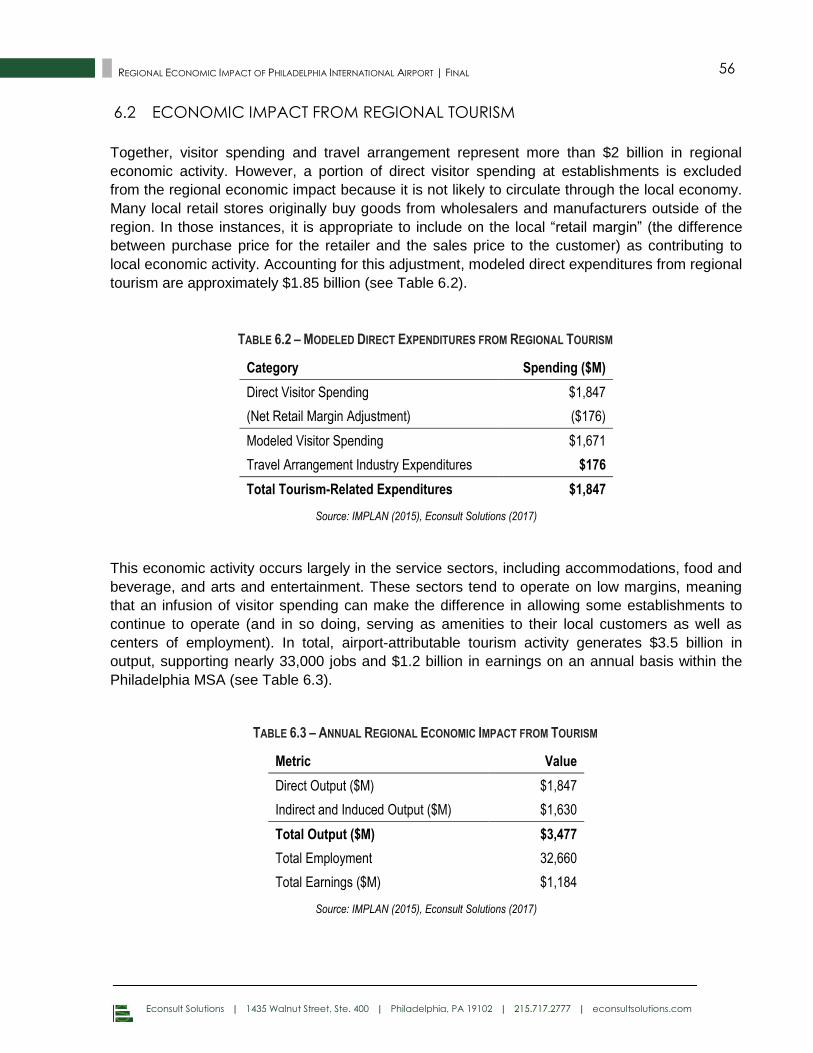
Econsult Solutions | 1435 Walnut Street, Ste. 400 | Philadelphia, PA 19102 | 215.717.2777 | econsultsolutions.com
56 REGIONAL ECONOMIC IMPACT OF PHILADELPHIA INTERNATIONAL AIRPORT | FINAL
ECONOMIC IMPACT FROM REGIONAL TOURISM 6.2
Together, visitor spending and travel arrangement represent more than $2 billion in regional
economic activity. However, a portion of direct visitor spending at establishments is excluded
from the regional economic impact because it is not likely to circulate through the local economy.
Many local retail stores originally buy goods from wholesalers and manufacturers outside of the
region. In those instances, it is appropriate to include on the local “retail margin” (the difference
between purchase price for the retailer and the sales price to the customer) as contributing to
local economic activity. Accounting for this adjustment, modeled direct expenditures from regional
tourism are approximately $1.85 billion (see Table 6.2).
TABLE 6.2 – MODELED DIRECT EXPENDITURES FROM REGIONAL TOURISM
Category Spending ($M)
Direct Visitor Spending $1,847
(Net Retail Margin Adjustment) ($176)
Modeled Visitor Spending $1,671
Travel Arrangement Industry Expenditures $176
Total Tourism-Related Expenditures $1,847
Source: IMPLAN (2015), Econsult Solutions (2017)
This economic activity occurs largely in the service sectors, including accommodations, food and
beverage, and arts and entertainment. These sectors tend to operate on low margins, meaning
that an infusion of visitor spending can make the difference in allowing some establishments to
continue to operate (and in so doing, serving as amenities to their local customers as well as
centers of employment). In total, airport-attributable tourism activity generates $3.5 billion in
output, supporting nearly 33,000 jobs and $1.2 billion in earnings on an annual basis within the
Philadelphia MSA (see Table 6.3).
TABLE 6.3 – ANNUAL REGIONAL ECONOMIC IMPACT FROM TOURISM
Metric Value
Direct Output ($M) $1,847
Indirect and Induced Output ($M) $1,630
Total Output ($M) $3,477
Total Employment 32,660
Total Earnings ($M) $1,184
Source: IMPLAN (2015), Econsult Solutions (2017)
Econsult Solutions | 1435 Walnut Street, Ste. 400 | Philadelphia, PA 19102 | 215.717.2777 | econsultsolutions.com
57 REGIONAL ECONOMIC IMPACT OF PHILADELPHIA INTERNATIONAL AIRPORT | FINAL
IMPLICATIONS OF REGIONAL TOURISM ACTIVITY 6.3
Tourism serves as a key engine of economic growth for the Philadelphia region in the modern,
integrated economy. Where Philadelphia was once a manufacturing power, producing goods here
and selling them to the rest of the world, tourism serves as a key modern export, with visitors
from far and wide purchasing a visitor experience and in so doing transferring outside dollars into
the region. Further, this industry is able to capitalize on many of the key assets of the region,
including its burgeoning dining scene, its arts and culture offerings, and the many historic assets
that triggered Philadelphia’s recent designation as America’s first UNESCO World Heritage City.
Importantly, the types of visitors utilizing air service tend to be those that are most impactful from
an economic impact standpoint. Relative to the average visitor to the region, air visitors are more
likely to come from further away, to stay overnight, and to conduct business on their trip. All of
these traits are markers of visitors with a greater than average spending profile, and accordingly,
a greater economic impact within the region. Further, air service growth and tourism activity
growth have a demonstrated connection to economic development over the long-term. Tourism
activity often serves as a prelude to resident and business attractions, since familiarity with a
place increases the likelihood of moving or doing business there.
Thus, airport access and connections serve as an essential component of the tourism
infrastructure of any region seeking to compete nationally and globally for visitor dollars. Leisure
travelers in particular are highly price sensitive, and the ease and cost of travel can be the
determining factor in travel decisions. The Philadelphia region operates in a highly competitive
environment for tourism dollars, with alternative destinations up and down the east coast seeking
out a similar pool of travelers. Increasingly, as Philadelphia becomes ever more an international
tourist draw, the region competes for travelers with the set of the greatest cities and regions
globally. Within this competitive environment, increases in air service connections and capacity,
as well as the planned enhancements to the customer experience within PHL, enhances the
region’s competitiveness and ultimately helps it to claim a greater share of this valuable activity.
Econsult Solutions | 1435 Walnut Street, Ste. 400 | Philadelphia, PA 19102 | 215.717.2777 | econsultsolutions.com
58 REGIONAL ECONOMIC IMPACT OF PHILADELPHIA INTERNATIONAL AIRPORT | FINAL
7.0 RESIDENT TRAVEL BENEFITS
As described throughout this report, the millions of residents of the Greater Philadelphia region
benefit in a broad sense from the regional economic activity enabled by the airport. More directly,
residents from throughout the 11 counties are also primary users of the airport, its facilities, and
the connections it enables. Indeed, around 18,000 of the 82,000 passengers that pass through
the airport each day (6.4 million per year) are regional residents on outbound trips.
The presence of PHL provides a direct benefit to the millions of regional residents who utilize it for
outbound and return trips in the form of travel cost and time savings. In the absence of PHL,
regional residents would have to utilize an alternative airport that is less convenient in travel time
and attendant cost than PHL (or cancel their trip entirely). This chapter introduces a mathematical
model for estimating the distance and time savings that regional residents gain from the location
of PHL relative to their next best alternative, and translates those benefits into monetary terms.
Travel cost and time savings benefits both accrue directly to regional households, and travel cost
savings also increase the level of spending in the regional economy by putting more disposable
dollars into the pockets of regional residents, which in turn has indirect and induced impacts when
those dollars are circulated locally. All of these benefits emanate from the fact that PHL’s location
and connections make it a significant amenity for the region by enabling outbound travel.
RESIDENT TRAVEL TIME AND COST SAVINGS 7.1
Each year, millions of regional residents utilize PHL for their outbound and return travel needs.
Data provided by the Airline Reporting Corporation and Campbell Hill Aviation indicates that
approximately 6.4 million domestic passengers within the airport catchment fly out of PHL on an
annual basis. This represents a market share of approximately 85% of total domestic passengers
originate from the catchment area, meaning that the vast majority of households in the region are
utilizing PHL as their primary airport. This large capture percentage speaks to both the central
location of PHL, and the breadth and quality of air service that it features.
While PHL is the primary airport for the region, there are a number of alternative airports of
varying size and scale that are accessible from different parts of the region.
Newark Liberty International Airport (EWR) and Baltimore-Washington International
Airport (BWI) are alternative airports which offer a similar passenger and flight volume to
PHL.
o EWR, which serves approximately 37 million passengers a year, is located
approximately 85 miles (or 1.5 hours) northeast of downtown Philadelphia.
o BWI, which serves approximately 24 million passengers a year, is located
approximately 105 miles (or 2 hours) southwest of downtown Philadelphia.
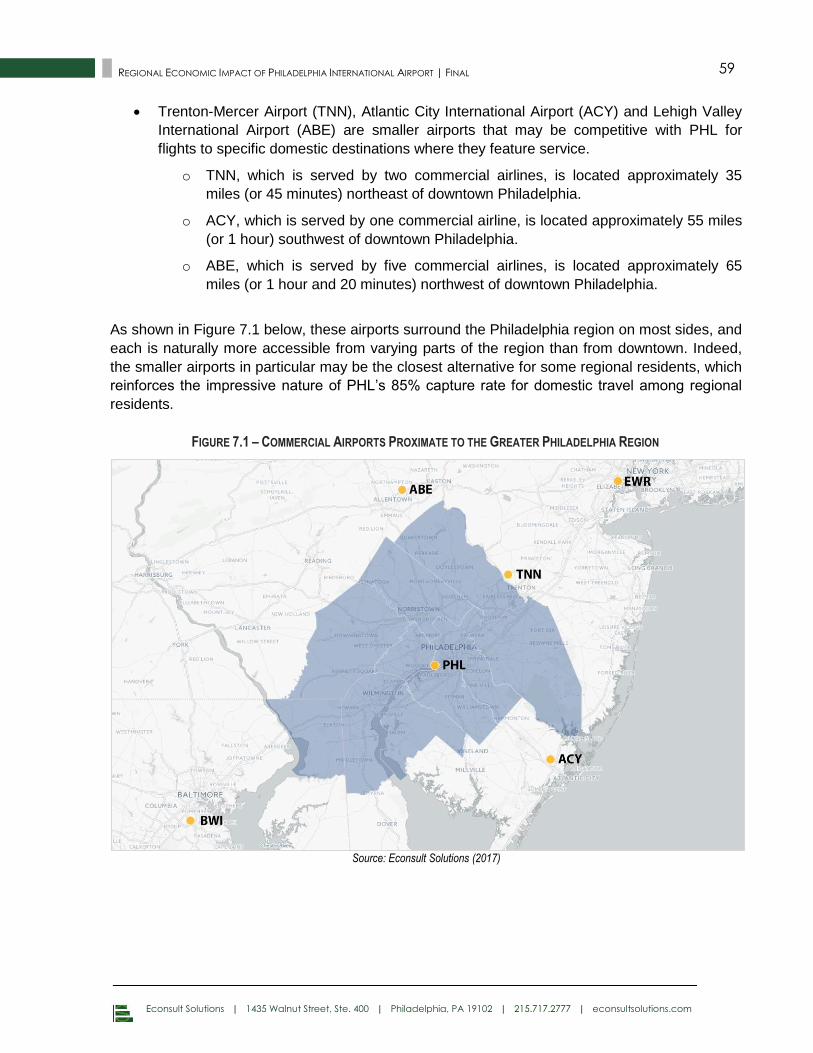
Econsult Solutions | 1435 Walnut Street, Ste. 400 | Philadelphia, PA 19102 | 215.717.2777 | econsultsolutions.com
59 REGIONAL ECONOMIC IMPACT OF PHILADELPHIA INTERNATIONAL AIRPORT | FINAL
Trenton-Mercer Airport (TNN), Atlantic City International Airport (ACY) and Lehigh Valley
International Airport (ABE) are smaller airports that may be competitive with PHL for
flights to specific domestic destinations where they feature service.
o TNN, which is served by two commercial airlines, is located approximately 35
miles (or 45 minutes) northeast of downtown Philadelphia.
o ACY, which is served by one commercial airline, is located approximately 55 miles
(or 1 hour) southwest of downtown Philadelphia.
o ABE, which is served by five commercial airlines, is located approximately 65
miles (or 1 hour and 20 minutes) northwest of downtown Philadelphia.
As shown in Figure 7.1 below, these airports surround the Philadelphia region on most sides, and
each is naturally more accessible from varying parts of the region than from downtown. Indeed,
the smaller airports in particular may be the closest alternative for some regional residents, which
reinforces the impressive nature of PHL’s 85% capture rate for domestic travel among regional
residents.
FIGURE 7.1 – COMMERCIAL AIRPORTS PROXIMATE TO THE GREATER PHILADELPHIA REGION
Source: Econsult Solutions (2017)
Econsult Solutions | 1435 Walnut Street, Ste. 400 | Philadelphia, PA 19102 | 215.717.2777 | econsultsolutions.com
60 REGIONAL ECONOMIC IMPACT OF PHILADELPHIA INTERNATIONAL AIRPORT | FINAL
PHL’s central location in the Philadelphia region means that it yields a travel savings for most
regional residents relative to their next best alternative airport. The magnitude of this savings can
be estimated using an economic modeling technique known as “gravity modeling.”22 Building on
empirical research which identifies distance and the volume of air service23 as key predictive
variables in consumer airport choice, a model was constructed comparing airport alternatives for
residents of each zip code within the Philadelphia region.24 PHL is then removed from the model,
and alternative airport probabilities are assigned to the residents of each zip code based on the
distance and air service relationships embedded in the model. The outputs of the two models can
then be compared to isolate the net change in airport usage by regional residents that would take
place absent PHL, applied to the number of domestic trips originating from the region. This output
is translated into two key metrics: travel distance saved, and travel time saved. Each of these
metrics is then translated into dollar terms based on widely-used industry standards.
Travel distance saved due to the presence of PHL (on both outbound and return trips) is
estimated at nearly 200 million miles. Average car operating costs per mile (including gasoline,
tire wear, and general maintenance) is estimated by AAA to be $0.57 per mile for 2015.25
Applying this cost savings to the estimated reduction in miles yields a travel cost savings of
approximately $113 million per year (see Table 7.1).
Travel time saved due to the presence of PHL is estimated at approximately 3 million hours
annually.26 Federal Department of Transportation guidance on the value of travel time for the
purpose of economic analysis27 suggests a valuation of $24.10 per hour for business travel, and a
valuation of $17.20 per hour for intercity personal travel. Given the approximately 50/50
distribution of business and leisure passenger traffic at PHL, averaging these two values yields a
blended rate of $20.65 per hour, which is applied to the 3 million hours saved to yield a time
benefit to residents of approximately $61 million (see Table 7.1).
22 Appendix D of this report contains a more detailed description of the principles, methodologies and calculations within this analysis.
23 See Basar and Bhat (2004), Hess and Polak (2005), Ishii, Jun and Dender (2009) and Pels, Nijkamp and Rietveld (2001). Appendox D includes a discussion of this research.
24 Note that this model was calibrated to the known share of domestic originating passenger volume captured by PHL.
25 Your Driving Costs. AAA NewsRoom, April 7, 2016.
Note that this model assumes that all trips to and from the airport are completed by personal car. In practice, PHL and alternative airports are also accessible by train and by taxi. In general, personal car travel is the lowest cost alternative on a per mile basis, so this modeling assumption, in addition to simplifying the approach, is conservative with respect to the total travel cost savings realized.
26 Both travel time and travel distance were estimated using Google Maps API, with distance and time calculated from the center point of each zip code with the 11 county region, with results weighted by the population of each zip code.
27 Rogoff, Peter, Revised Departmental Guidance on Valuation of Travel Time in Economic Analysis. U.S. Department of Transportation memorandum, July 9, 2014.
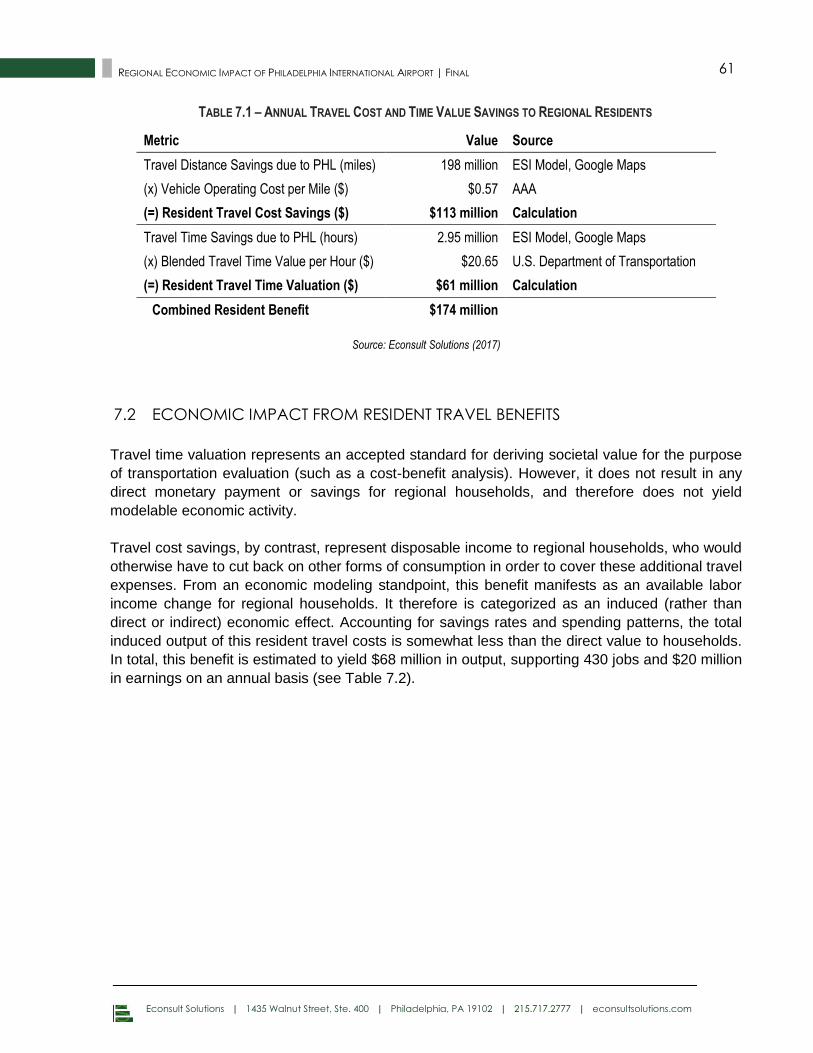
Econsult Solutions | 1435 Walnut Street, Ste. 400 | Philadelphia, PA 19102 | 215.717.2777 | econsultsolutions.com
61 REGIONAL ECONOMIC IMPACT OF PHILADELPHIA INTERNATIONAL AIRPORT | FINAL
TABLE 7.1 – ANNUAL TRAVEL COST AND TIME VALUE SAVINGS TO REGIONAL RESIDENTS
Metric Value Source
Travel Distance Savings due to PHL (miles) 198 million ESI Model, Google Maps
(x) Vehicle Operating Cost per Mile ($) $0.57 AAA
(=) Resident Travel Cost Savings ($) $113 million Calculation
Travel Time Savings due to PHL (hours) 2.95 million ESI Model, Google Maps
(x) Blended Travel Time Value per Hour ($) $20.65 U.S. Department of Transportation
(=) Resident Travel Time Valuation ($) $61 million Calculation
Combined Resident Benefit $174 million
Source: Econsult Solutions (2017)
ECONOMIC IMPACT FROM RESIDENT TRAVEL BENEFITS 7.2
Travel time valuation represents an accepted standard for deriving societal value for the purpose
of transportation evaluation (such as a cost-benefit analysis). However, it does not result in any
direct monetary payment or savings for regional households, and therefore does not yield
modelable economic activity.
Travel cost savings, by contrast, represent disposable income to regional households, who would
otherwise have to cut back on other forms of consumption in order to cover these additional travel
expenses. From an economic modeling standpoint, this benefit manifests as an available labor
income change for regional households. It therefore is categorized as an induced (rather than
direct or indirect) economic effect. Accounting for savings rates and spending patterns, the total
induced output of this resident travel costs is somewhat less than the direct value to households.
In total, this benefit is estimated to yield $68 million in output, supporting 430 jobs and $20 million
in earnings on an annual basis (see Table 7.2).
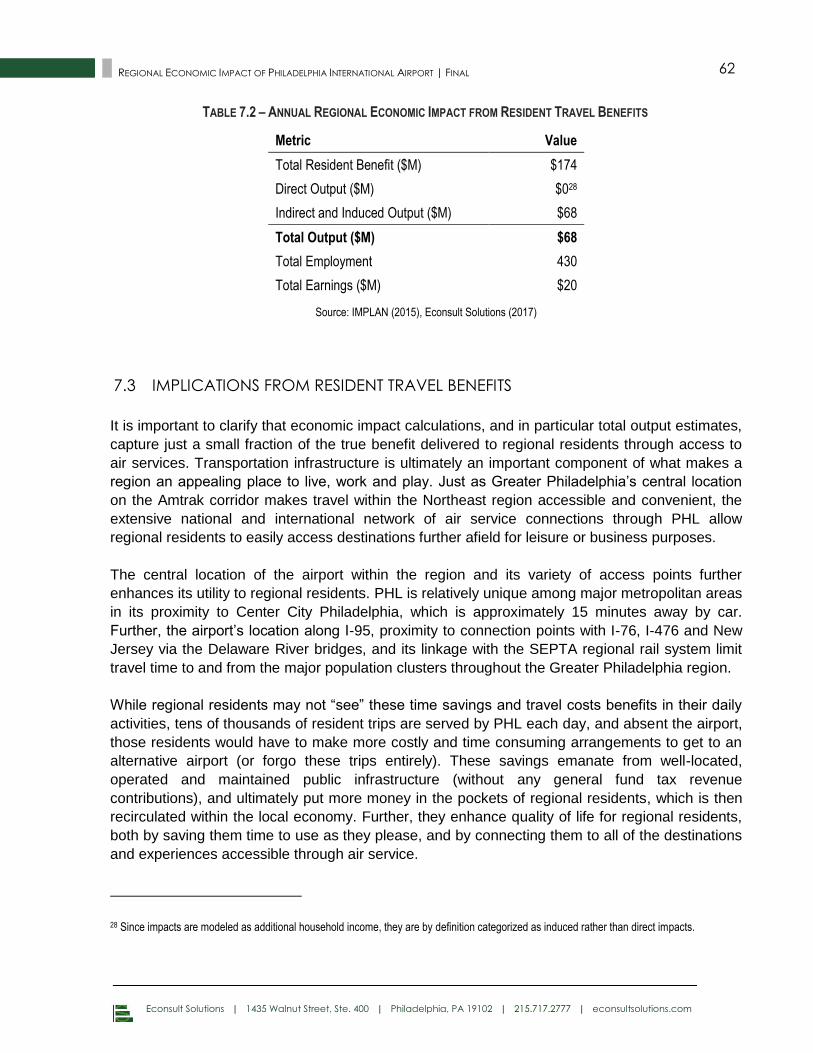
Econsult Solutions | 1435 Walnut Street, Ste. 400 | Philadelphia, PA 19102 | 215.717.2777 | econsultsolutions.com
62 REGIONAL ECONOMIC IMPACT OF PHILADELPHIA INTERNATIONAL AIRPORT | FINAL
TABLE 7.2 – ANNUAL REGIONAL ECONOMIC IMPACT FROM RESIDENT TRAVEL BENEFITS
Metric Value
Total Resident Benefit ($M) $174
Direct Output ($M) $028
Indirect and Induced Output ($M) $68
Total Output ($M) $68
Total Employment 430
Total Earnings ($M) $20
Source: IMPLAN (2015), Econsult Solutions (2017)
IMPLICATIONS FROM RESIDENT TRAVEL BENEFITS 7.3
It is important to clarify that economic impact calculations, and in particular total output estimates,
capture just a small fraction of the true benefit delivered to regional residents through access to
air services. Transportation infrastructure is ultimately an important component of what makes a
region an appealing place to live, work and play. Just as Greater Philadelphia’s central location
on the Amtrak corridor makes travel within the Northeast region accessible and convenient, the
extensive national and international network of air service connections through PHL allow
regional residents to easily access destinations further afield for leisure or business purposes.
The central location of the airport within the region and its variety of access points further
enhances its utility to regional residents. PHL is relatively unique among major metropolitan areas
in its proximity to Center City Philadelphia, which is approximately 15 minutes away by car.
Further, the airport’s location along I-95, proximity to connection points with I-76, I-476 and New
Jersey via the Delaware River bridges, and its linkage with the SEPTA regional rail system limit
travel time to and from the major population clusters throughout the Greater Philadelphia region.
While regional residents may not “see” these time savings and travel costs benefits in their daily
activities, tens of thousands of resident trips are served by PHL each day, and absent the airport,
those residents would have to make more costly and time consuming arrangements to get to an
alternative airport (or forgo these trips entirely). These savings emanate from well-located,
operated and maintained public infrastructure (without any general fund tax revenue
contributions), and ultimately put more money in the pockets of regional residents, which is then
recirculated within the local economy. Further, they enhance quality of life for regional residents,
both by saving them time to use as they please, and by connecting them to all of the destinations
and experiences accessible through air service.
28 Since impacts are modeled as additional household income, they are by definition categorized as induced rather than direct impacts.
Econsult Solutions | 1435 Walnut Street, Ste. 400 | Philadelphia, PA 19102 | 215.717.2777 | econsultsolutions.com
63 REGIONAL ECONOMIC IMPACT OF PHILADELPHIA INTERNATIONAL AIRPORT | FINAL
8.0 CATALYTIC ECONOMIC GROWTH EFFECTS
Each of the sections above has defined and quantified economic activity occurring directly at the
airport, or directly enabled by air service. The sum of the economic impacts from each of these
categories represents the annual aggregate economic activity attributable to PHL presented in
this report (as shown in Section 9).
This approach is conservative, however, with respect to the impact of airports and air service on
the economic growth potential of a region. Beyond those businesses who directly serve airport
passengers or utilize the airport in their business platform, a range of business activities that
occur throughout the region are to some extent dependent on the national and international
connections enabled by air service. PHL connects Philadelphia directly to other regions and
countries, increasing the volume of goods and ideas that regional business can export. Its
accessible location and air service connections also help to drive business location and
investment decisions, allowing national and international firms to locate headquarters and
regional hubs in the Philadelphia region. It also improves business efficiency and productivity,
both by reducing transportation costs and by serving as a quality of life amenity that helps to
attract and retain and talented and productive workforce. These various economic benefits are
supported by academic research showing a strong empirical connection between air service and
regional economic growth over time.
While these benefits fall outside of the “headline” impact number presented in this report, their
implications on the $416 billion regional economy 29 may match or exceed the measurable
increase in directly attributable economic activity discussed throughout the report. Said another
way, in a highly competitive environment, the Philadelphia region could not support the broad
base of business activity critical to economic growth without the contributions of PHL.
TRADE ACTIVITY AND CONNECTIONS 8.1
Transportation and cargo linkages are crucial for firms that operate on a national and international
level. Firms that produce their products within the region and sell it outside of the region are
ultimately dependent on their ability to move goods and people between locations. In the modern
economy, this includes not only physical goods, but knowledge and innovation activity, such as
the region’s higher education sector, which relies on gathering students, academics and visitors
from around the world.
At the intersection of the physical and knowledge activities are the region’s powerhouse medical
and pharmaceutical industries, which rely on the movement of both goods and people on a global
scale. One prominent example is Teva Pharmaceutical Industries, an Israeli multinational firm
29 This metropolitan gross domestic product (GDP) estimate is drawn from the 2016 U.S. Metro Economies report prepared by IHS Global Insight for the United States Conference of Mayors and the Council of Metro Economies and the New American City.
Econsult Solutions | 1435 Walnut Street, Ste. 400 | Philadelphia, PA 19102 | 215.717.2777 | econsultsolutions.com
64 REGIONAL ECONOMIC IMPACT OF PHILADELPHIA INTERNATIONAL AIRPORT | FINAL
that is the largest generic drug manufacturer in the world. Teva’s Americas headquarters is
located in North Wales (in Montgomery County, PA), and Teva serves as one of the primary
users of American Airlines new cold storage facility at PHL.
Sales activity is another one of the major facets for which businesses rely on air access. For
example, a 2008 survey of UK businesses found that more than a third of businesses who use air
travel do so “mainly in order to meet clients or potential clients for the purposes of negotiating
sales.”30 Air access also enables businesses to attend conference, network and make new
contacts, all of which are crucial to building export relationships.
Broadly, this “traded sector” activity is crucial to fostering regional economic growth over the long-
term because of its export nature. While the majority of total employment is typically in the service
sectors, these sectors by nature involve the exchange of resources (i.e. goods and services) that
are already in the region. By contrast, traded sector activity brings in new dollars from outside the
region, which in turn have a multiplier effect within the economy when they are re-spent on the
supporting activities in the service sector. Regional growth is thus largely reliant on its ability to
sell more of its product (physical, knowledge, and in the case of tourism, experiential) to those
outside of the region. Accordingly, the air connections that foster this activity are crucial to
regional economic competitiveness and growth.
BUSINESS LOCATION AND INVESTMENT 8.2
Decisions about the locations of firms (including headquarters, branches, production facilities,
hubs, etc.) must account for many factors, including but not limited to tax structure, labor
availability and quality, long-term regional trajectory, etc. For many firms, transportation and
logistics connections are crucial variables in these business location and investment decisions.
For firms that operate on a national and international basis, air service connections are essential
not only for the movement of goods and services but in facilitating connections between different
operating locations. For example, when Philadelphia-based Comcast acquired NBC Universal, it
inherited a vast network of operations, including NBC headquarters in New York. Rather than
moving Comcast operations to New York City, Comcast maintained their headquarters in
Philadelphia (and initiated the construction of a second skyscraper bearing its name in Center
City). While this location decision necessarily involved a number of factors, it clearly would not
have been possible without a well-connected international airport serving the Philadelphia region
and connecting employees at Comcast headquarters with the company’s network of locations
and business interests.
More broadly, given the fluidity of capital for large firms, location and investment decisions are
continuous and the environment is extremely competitive. For this reason, economic
development agencies frequently offer large incentives to firms to locate in a particular region or
30 UK Institute of Directors (2008), High Fliers: Business Leaders’ View of Air Travel
Econsult Solutions | 1435 Walnut Street, Ste. 400 | Philadelphia, PA 19102 | 215.717.2777 | econsultsolutions.com
65 REGIONAL ECONOMIC IMPACT OF PHILADELPHIA INTERNATIONAL AIRPORT | FINAL
jurisdiction. This willingness demonstrates that major regional infrastructure like airports that
enhance the competitiveness of a region deliver significant economic and fiscal value (and may in
fact reduce the level of public expenditures on economic development incentives needed to
attract firms). Further, the importance of air service to firm decision-making has been confirmed
both by surveys of businesses about their location decisions and through empirical analyses of
the statistical relationship between air service and business investment results for regions over
time.31
BUSINESS EFFICIENCY AND PRODUCTIVITY 8.3
The same transportation connection benefits that entice businesses to locate and invest in a
region yield productivity and efficiency gains for firms once they are located here. Broadly,
transportation and logistics connections within and between regions are one of the crucial
determinants of costs for business, and are therefore crucial to their ability to operate profitably
and to grow.
Air service and access is more relevant to two important components of this equation. First, it
offers access to new markets, whether through direct movement of goods, or by enabling
personal and sales relationships. Access to new markets (domestic and international) not only
increases revenue opportunities for local firms, but often allows businesses to achieve greater
economies of scale, and therefore operate more productively. This is particularly true for
knowledge and innovation driven products, where the firm investment may be largely in the
research and development of intellectual property, and the marginal costs of the physical
production of a greater quantity of goods may be low. For example, GlaxoSmithKline is one of the
world’s largest pharmaceutical firms and has major research and development operations in
Collegeville (in Montgomery County, PA) as well as management and sales operations from its
U.S. Headquarters at the Navy Yard, proximate to PHL in South Philadelphia. The easy access of
GSK sales and management team to air service translates into new markets for its products,
which leverage the firm’s considerable R&D investments more effectively.
Secondly, as previously discussed, air service contributes to the overall attractiveness and quality
of life for residents. This in turn means that the region can sustain and compete with other regions
to attract a highly skilled and productive workforce. From transplants moving to the region for
career-related reasons to natives of the region seeking a metropolitan area that can connect them
to new experiences, the ability to easily travel and connect with other locations globally and
internationally can be a quality of life issue for many households. When PHL delivers these
31 See for example: Wilbur Smith Associates for the Pennsylvania Department of Transportation (2011), The Economic Impact of Aviation in Pennsylvania Study, p. 41 which reports that 56 percent of surveyed Pennsylvania businesses reported that the elimination of aviation within the Commonwealth would have some effect on their business. Impacts included scaling back operations (24%), relocating operations outside of PA (16%) or ceasing all operations in the Commonwealth (5%). For a summary of research on this topic, see: Intervistas for ACI Europe (2015), Economic Impact of European Airports: A Critical Catalyst to Economic Growth, p. 45-47.
Econsult Solutions | 1435 Walnut Street, Ste. 400 | Philadelphia, PA 19102 | 215.717.2777 | econsultsolutions.com
66 REGIONAL ECONOMIC IMPACT OF PHILADELPHIA INTERNATIONAL AIRPORT | FINAL
benefits to regional residents, it enhances the quality of the local workforce that the region can
maintain, and thereby not only makes it more attractive to new businesses, but allows existing
businesses to capture the benefits of a more skilled and productive workforce that draws from a
broader pool of talented employees.
EMPIRICAL CONNECTION BETWEEN AIR SERVICE AND ECONOMIC GROWTH 8.4
Each of the categories above illustrates specific linkages between air connections and factors
crucial to economic competitiveness and growth. These linkages and benefits should ultimately
manifest in improved economic performance over time for regions with superior air service
connections. Several longitudinal academic studies have looked for such a statistical relationship,
and have found an empirical link between air service and regional economic and job growth.
Most notably, economists Bruce Blonigen and Andrea Cristea of the University of Oregon
published an analysis for the National Bureau of Economic Research (NBER) in 2012 that
exploited sudden changes in air services for major U.S. Metropolitan areas brought about by the
1978 Airline Deregulation Act.32 The rapid changes in air service connections due to the sudden
restructuring of the industry brought about a quasi-natural policy experiment, allowing the authors
to track 300 metropolitan areas over a two decade period before and after this change and
establish the impact of air services changes on economic performance. Their results “suggest
that air service has a significant positive effect on regional growth,” with statistically significant
positive effects on regional population, income and employment. These results track with prior
research by Bruckner and Green, among others, who demonstrated empirical relationships
between air service and regional employment growth in the United States.33
These empirical studies confirm at a broad level that the impacts of air service on trade activity,
business location and investment decisions, and business efficiency and productivity translate
into economic and employment growth. Further, this relationship is self-reinforcing, as air
connections deepen economic and personal linkages between regions, allowing for further
business and residential attraction and growth over time.
32 Blonigen and Cristea, University of Oregon, Airports and Urban Growth: Evidence From a Quasi-Natural Policy Experiment. National Bureau of Economc Research (NBER), July 2012.
33 Brueckner, Airline Traffic and Urban Economic Development, Urban Studies (2003) Green, Airports and Economic Development, Real Estate Economics (2007)
Econsult Solutions | 1435 Walnut Street, Ste. 400 | Philadelphia, PA 19102 | 215.717.2777 | econsultsolutions.com
67 REGIONAL ECONOMIC IMPACT OF PHILADELPHIA INTERNATIONAL AIRPORT | FINAL
IMPLICATIONS OF CATALYIC EFFECTS 8.5
This chapter has detailed a number of ways that air access plays a vital role in regional economic
growth, above and beyond the specific businesses and sectors that rely on the airport as part of
their business platform. By enabling trade connections between regions, impacting business
location and investment decisions, and improving business efficiency and productivity, air service
(like other transportation connections) contributes to the broad underpinnings on which regional
economic competitiveness and growth are built. It is therefore not surprising that academic
research has found a strong empirical relationship between air service and regional economic
growth.
This contribution to economic growth also manifests itself as an improvement in the quality of life
for residents throughout the region. Economic growth is of course connected to raising incomes
and ultimately the standard of living throughout the region, and to enhancing tax bases that
enable state and local governments to provide essential public services to their citizens.
While the economic benefits from air service derive from concrete examples (sales people who
can reach clients, corporate headquarters that can connect with their satellite locations, facilities
that are constructed in the region due to its logistics advantages), air service can also contribute
to the “softer” economic development benefits that yield results in the long run. Impressions that
potential visitors, business partners and residents have of a region are often driven less by
statistics than by collective perceptions of a place and its core attributes. The rise of
Philadelphia’s air service connections over the past two decades has coincided with an
improvement in its national and international brand, as the region has grown its reputation as a
premier destination for arts and culture, food and educational and health activity while continuing
to stay tethered to its blue collar roots. The more national and international visitors that have the
opportunity to experience this new Philadelphia for themselves, the more the region’s brand
continues to grow, enhancing its attractiveness to businesses, residents and tourists alike.
PHL’s current focus on customer service and the passenger experience is also important in this
context. Airports serve as a gateway to their region and as such can represent the first and last
impression for out of town visitors (and for connecting passengers, their only impression).
Improvements to the physical space within the terminals and to the way in which PHL and its
partners offer passengers an integrated and pleasant customer experience help the region derive
the benefits of increased familiarity and connectively with the rest of the country and world.
Econsult Solutions | 1435 Walnut Street, Ste. 400 | Philadelphia, PA 19102 | 215.717.2777 | econsultsolutions.com
68 REGIONAL ECONOMIC IMPACT OF PHILADELPHIA INTERNATIONAL AIRPORT | FINAL
9.0 AGGREGATE ECONOMIC AND FISCAL IMPACT
This report has described and quantified multiple dimensions of economic and fiscal impact from
the Airport System consisting of Philadelphia International Airport (“PHL”) and the Northeast
Philadelphia Airport (“PNE”) on the Philadelphia region. PHL and PNE are owned by the City of
Philadelphia and operated by the City’s Department of Aviation on a self-sustaining basis without
any local tax dollars. PHL serves more than 30 million commercial passengers annually, and
offers approximately 500 daily flights to more than 120 destinations.
The airport serves as a core component of the regional transportation infrastructure essential to
the competitiveness of the regional economy and to the quality of life for regional residents. The
benefits described in this analysis accrue in a variety of ways and to a variety of beneficiaries
across the Philadelphia region:
The airport, its tenants, and related businesses represent a major center of economic
activity within the region through their employment, purchasing and capital investment
activity.
Air connections catalyze economic activity through the broader Philadelphia region,
facilitating business and leisure travel that stimulates the local economy and makes the
region a more efficient and attractive place to locate a business.
Beyond these implications for local economic activity and employment, regional residents
benefit from accessibility of PHL and the air access it provides, which reduces travel time
and costs and contributes to the quality of life within the region.
This section consolidates the disparate economic impact calculations presented throughout this
report into an aggregate annual economic impact attributable to PHL (Section 9.1). Next, it
analyzes that impact at various geographic levels (9.2), and for various industries (Section 9.3).
Then, it analyzes the impact of these increases in economic activity on tax revenue generation for
state and local jurisdictions (Section 9.4) before concluding with additional commentary on the
importance and scale of this activity (Section 9.5).
AGGREGATE ECONOMIC IMPACT 9.1
The sections throughout this analysis present aggregate economic output, employment and
earnings attributable to each category of economic activity quantified within this report. As noted
throughout, categories have been carefully segmented to be mutually exclusive, meaning that
their sum represents the aggregate economic impact of the airport on an annual basis.
Table 9.1 below presents a summary of impacts by category and in total. Aggregate economic
impact of Philadelphia International Airport within the Philadelphia MSA totals $15.4 billion
annually. This activity supports more than 96,300 jobs and $4.8 billion in earnings.
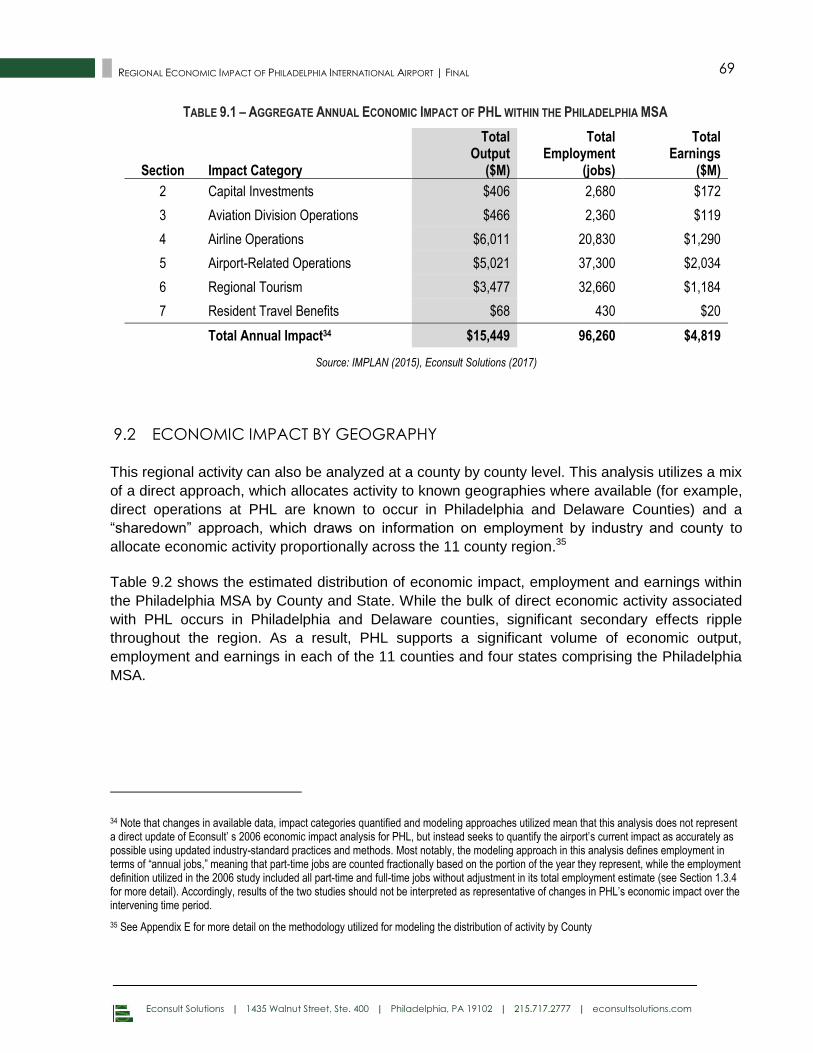
Econsult Solutions | 1435 Walnut Street, Ste. 400 | Philadelphia, PA 19102 | 215.717.2777 | econsultsolutions.com
69 REGIONAL ECONOMIC IMPACT OF PHILADELPHIA INTERNATIONAL AIRPORT | FINAL
TABLE 9.1 – AGGREGATE ANNUAL ECONOMIC IMPACT OF PHL WITHIN THE PHILADELPHIA MSA
Section Impact Category
Total Output
($M)
Total Employment
(jobs)
Total Earnings
($M)
2 Capital Investments $406 2,680 $172
3 Aviation Division Operations $466 2,360 $119
4 Airline Operations $6,011 20,830 $1,290
5 Airport-Related Operations $5,021 37,300 $2,034
6 Regional Tourism $3,477 32,660 $1,184
7 Resident Travel Benefits $68 430 $20
Total Annual Impact34 $15,449 96,260 $4,819
Source: IMPLAN (2015), Econsult Solutions (2017)
ECONOMIC IMPACT BY GEOGRAPHY 9.2
This regional activity can also be analyzed at a county by county level. This analysis utilizes a mix
of a direct approach, which allocates activity to known geographies where available (for example,
direct operations at PHL are known to occur in Philadelphia and Delaware Counties) and a
“sharedown” approach, which draws on information on employment by industry and county to
allocate economic activity proportionally across the 11 county region.35
Table 9.2 shows the estimated distribution of economic impact, employment and earnings within
the Philadelphia MSA by County and State. While the bulk of direct economic activity associated
with PHL occurs in Philadelphia and Delaware counties, significant secondary effects ripple
throughout the region. As a result, PHL supports a significant volume of economic output,
employment and earnings in each of the 11 counties and four states comprising the Philadelphia
MSA.
34 Note that changes in available data, impact categories quantified and modeling approaches utilized mean that this analysis does not represent a direct update of Econsult’ s 2006 economic impact analysis for PHL, but instead seeks to quantify the airport’s current impact as accurately as possible using updated industry-standard practices and methods. Most notably, the modeling approach in this analysis defines employment in terms of “annual jobs,” meaning that part-time jobs are counted fractionally based on the portion of the year they represent, while the employment definition utilized in the 2006 study included all part-time and full-time jobs without adjustment in its total employment estimate (see Section 1.3.4 for more detail). Accordingly, results of the two studies should not be interpreted as representative of changes in PHL’s economic impact over the intervening time period.
35 See Appendix E for more detail on the methodology utilized for modeling the distribution of activity by County
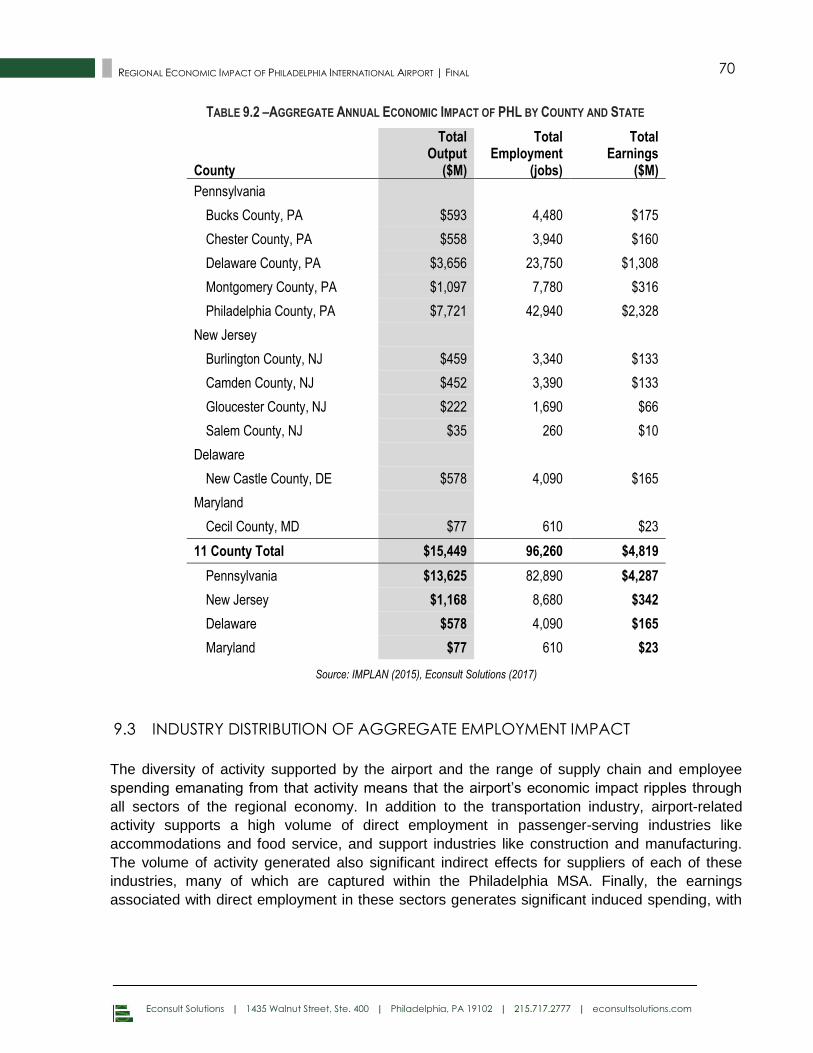
Econsult Solutions | 1435 Walnut Street, Ste. 400 | Philadelphia, PA 19102 | 215.717.2777 | econsultsolutions.com
70 REGIONAL ECONOMIC IMPACT OF PHILADELPHIA INTERNATIONAL AIRPORT | FINAL
TABLE 9.2 –AGGREGATE ANNUAL ECONOMIC IMPACT OF PHL BY COUNTY AND STATE
County
Total Output
($M)
Total Employment
(jobs)
Total Earnings
($M)
Pennsylvania
Bucks County, PA $593 4,480 $175
Chester County, PA $558 3,940 $160
Delaware County, PA $3,656 23,750 $1,308
Montgomery County, PA $1,097 7,780 $316
Philadelphia County, PA $7,721 42,940 $2,328
New Jersey
Burlington County, NJ $459 3,340 $133
Camden County, NJ $452 3,390 $133
Gloucester County, NJ $222 1,690 $66
Salem County, NJ $35 260 $10
Delaware
New Castle County, DE $578 4,090 $165
Maryland
Cecil County, MD $77 610 $23
11 County Total $15,449 96,260 $4,819
Pennsylvania $13,625 82,890 $4,287
New Jersey $1,168 8,680 $342
Delaware $578 4,090 $165
Maryland $77 610 $23
Source: IMPLAN (2015), Econsult Solutions (2017)
INDUSTRY DISTRIBUTION OF AGGREGATE EMPLOYMENT IMPACT 9.3
The diversity of activity supported by the airport and the range of supply chain and employee
spending emanating from that activity means that the airport’s economic impact ripples through
all sectors of the regional economy. In addition to the transportation industry, airport-related
activity supports a high volume of direct employment in passenger-serving industries like
accommodations and food service, and support industries like construction and manufacturing.
The volume of activity generated also significant indirect effects for suppliers of each of these
industries, many of which are captured within the Philadelphia MSA. Finally, the earnings
associated with direct employment in these sectors generates significant induced spending, with
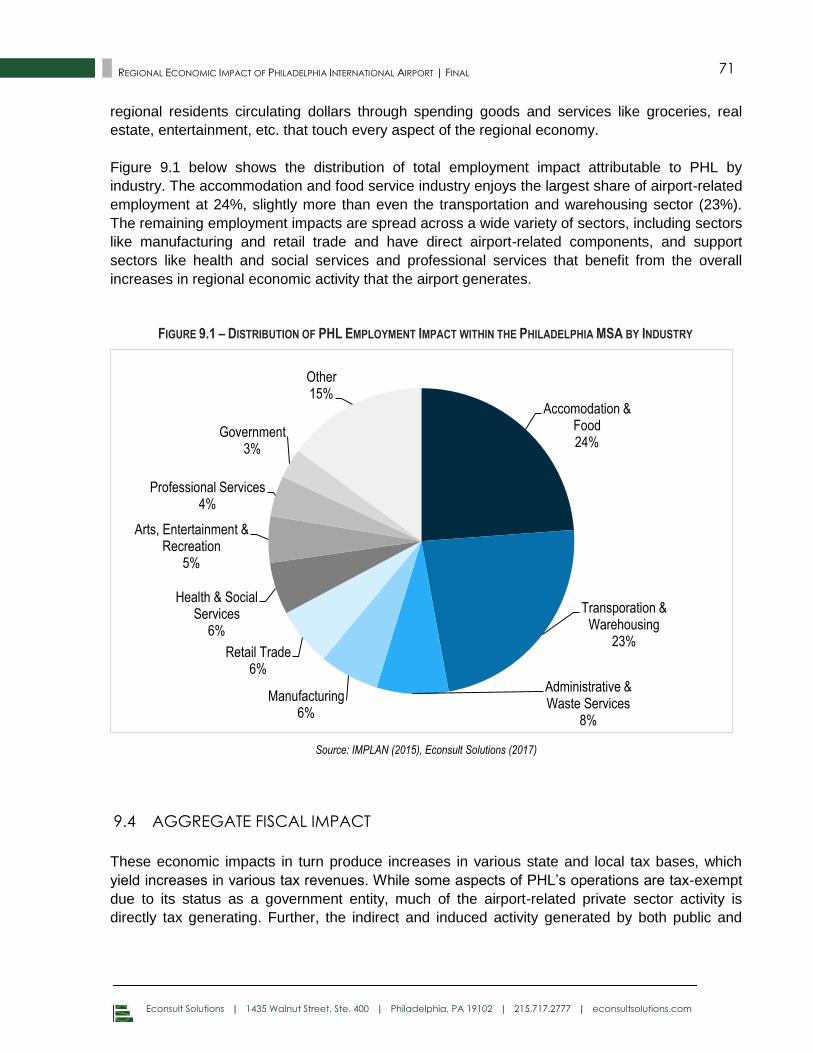
Econsult Solutions | 1435 Walnut Street, Ste. 400 | Philadelphia, PA 19102 | 215.717.2777 | econsultsolutions.com
71 REGIONAL ECONOMIC IMPACT OF PHILADELPHIA INTERNATIONAL AIRPORT | FINAL
regional residents circulating dollars through spending goods and services like groceries, real
estate, entertainment, etc. that touch every aspect of the regional economy.
Figure 9.1 below shows the distribution of total employment impact attributable to PHL by
industry. The accommodation and food service industry enjoys the largest share of airport-related
employment at 24%, slightly more than even the transportation and warehousing sector (23%).
The remaining employment impacts are spread across a wide variety of sectors, including sectors
like manufacturing and retail trade and have direct airport-related components, and support
sectors like health and social services and professional services that benefit from the overall
increases in regional economic activity that the airport generates.
FIGURE 9.1 – DISTRIBUTION OF PHL EMPLOYMENT IMPACT WITHIN THE PHILADELPHIA MSA BY INDUSTRY
Source: IMPLAN (2015), Econsult Solutions (2017)
AGGREGATE FISCAL IMPACT 9.4
These economic impacts in turn produce increases in various state and local tax bases, which
yield increases in various tax revenues. While some aspects of PHL’s operations are tax-exempt
due to its status as a government entity, much of the airport-related private sector activity is
directly tax generating. Further, the indirect and induced activity generated by both public and
Accomodation & Food 24%
Transporation & Warehousing
23%
Administrative & Waste Services
8%
Manufacturing 6%
Retail Trade 6%
Health & Social Services
6%
Arts, Entertainment & Recreation
5%
Professional Services 4%
Government 3%
Other 15%
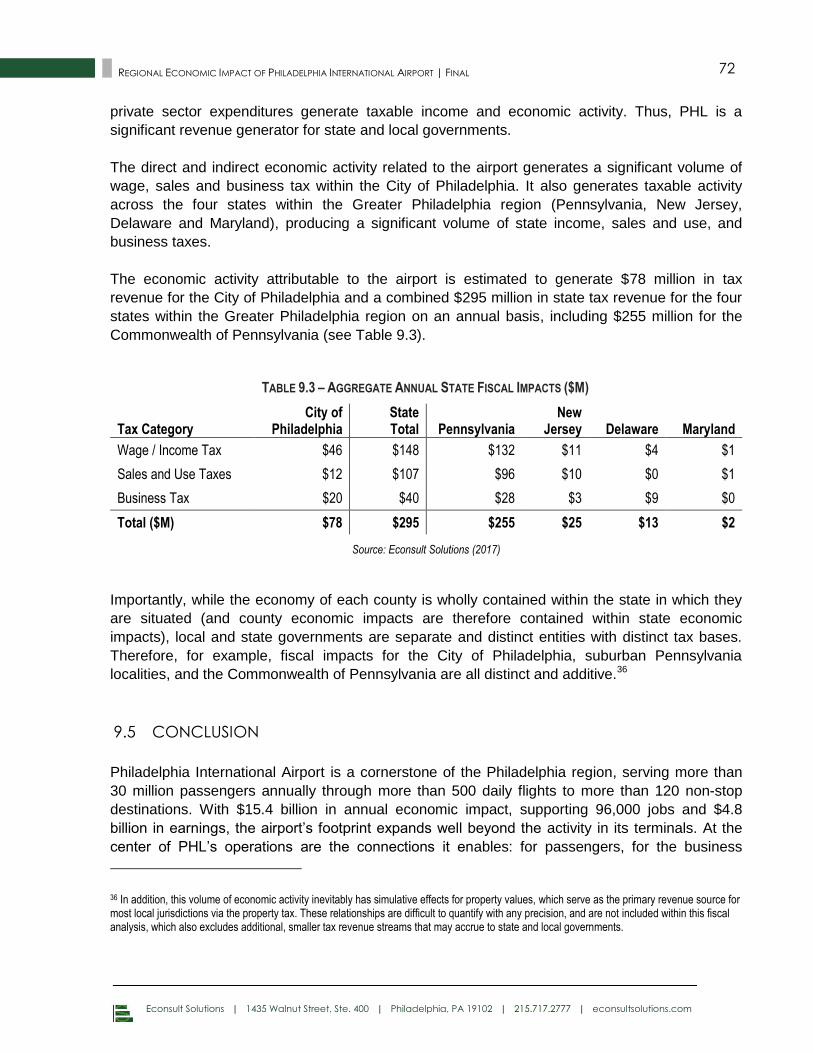
Econsult Solutions | 1435 Walnut Street, Ste. 400 | Philadelphia, PA 19102 | 215.717.2777 | econsultsolutions.com
72 REGIONAL ECONOMIC IMPACT OF PHILADELPHIA INTERNATIONAL AIRPORT | FINAL
private sector expenditures generate taxable income and economic activity. Thus, PHL is a
significant revenue generator for state and local governments.
The direct and indirect economic activity related to the airport generates a significant volume of
wage, sales and business tax within the City of Philadelphia. It also generates taxable activity
across the four states within the Greater Philadelphia region (Pennsylvania, New Jersey,
Delaware and Maryland), producing a significant volume of state income, sales and use, and
business taxes.
The economic activity attributable to the airport is estimated to generate $78 million in tax
revenue for the City of Philadelphia and a combined $295 million in state tax revenue for the four
states within the Greater Philadelphia region on an annual basis, including $255 million for the
Commonwealth of Pennsylvania (see Table 9.3).
TABLE 9.3 – AGGREGATE ANNUAL STATE FISCAL IMPACTS ($M)
Tax Category City of
Philadelphia State Total Pennsylvania
New Jersey Delaware Maryland
Wage / Income Tax $46 $148 $132 $11 $4 $1
Sales and Use Taxes $12 $107 $96 $10 $0 $1
Business Tax $20 $40 $28 $3 $9 $0
Total ($M) $78 $295 $255 $25 $13 $2
Source: Econsult Solutions (2017)
Importantly, while the economy of each county is wholly contained within the state in which they
are situated (and county economic impacts are therefore contained within state economic
impacts), local and state governments are separate and distinct entities with distinct tax bases.
Therefore, for example, fiscal impacts for the City of Philadelphia, suburban Pennsylvania
localities, and the Commonwealth of Pennsylvania are all distinct and additive.36
CONCLUSION 9.5
Philadelphia International Airport is a cornerstone of the Philadelphia region, serving more than
30 million passengers annually through more than 500 daily flights to more than 120 non-stop
destinations. With $15.4 billion in annual economic impact, supporting 96,000 jobs and $4.8
billion in earnings, the airport’s footprint expands well beyond the activity in its terminals. At the
center of PHL’s operations are the connections it enables: for passengers, for the business
36 In addition, this volume of economic activity inevitably has simulative effects for property values, which serve as the primary revenue source for most local jurisdictions via the property tax. These relationships are difficult to quantify with any precision, and are not included within this fiscal analysis, which also excludes additional, smaller tax revenue streams that may accrue to state and local governments.
Econsult Solutions | 1435 Walnut Street, Ste. 400 | Philadelphia, PA 19102 | 215.717.2777 | econsultsolutions.com
73 REGIONAL ECONOMIC IMPACT OF PHILADELPHIA INTERNATIONAL AIRPORT | FINAL
community, and for the region. PHL is a gateway for national and international travel and trade,
and the airport’s success reflects back on the region.
The City’s Division of Aviation has prioritized customer service in its training and investments to
create a seamless and hassle-free travel experience for the 82,000+ passengers pass through
PHL each day. This can be seen in the recent renovation of Terminal F and the planned redesign
to Terminal B, which focus on introducing updated facilities and new technology, making time
spent at the airport more enjoyable. From a regional economic development standpoint, this
approach recognizes that airports often serve as a gateway to their region and as such can
represent the first and last impression for out of town visitors (and for connecting passengers,
their only impression). Improvements to the physical space within the terminals and to the way in
which PHL and its partners offer passengers an integrated and pleasant customer experience
help the region derive the benefits of increased familiarity and connectively with the rest of the
country and world. It also enhances the status of PHL as an amenity to residents of the region.
PHL is also well-situated to cater to the major business sectors in the region, including
corporations, higher education, medical fields, and manufacturing. Its proximity to downtown
Philadelphia and major highways makes the airport convenient for users throughout the
region. The diversity of destinations PHL flies to, which is particularly enhanced by the American
Airlines hub and Oneworld alliance, increases the region’s competitiveness as a business
destination. Indeed, many businesses located in Philadelphia directly rely on the airport, like air
service firms and cargo and freight operator, or use PHL to facilitate connections with operating
locations, partners, and customers.
As this report clearly shows, PHL has a major economic and fiscal impact on the Philadelphia
region and is a significant catalyst for economic growth. Through the number of passengers it
serves each day, the workers it employs, and the dollars it infuses into the economy, PHL
impacts the area as both a quality of life amenity and a major economic driver. PHL is well
positioned to continue to serve the Philadelphia region by connecting it to country and the world,
providing top-rate service to travelers, and spurring economic activity and growth.
.
Econsult Solutions | 1435 Walnut Street, Ste. 400 | Philadelphia, PA 19102 | 215.717.2777 | econsultsolutions.com
A-1 REGIONAL ECONOMIC IMPACT OF PHILADELPHIA INTERNATIONAL AIRPORT |FINAL
APPENDIX A – DETAILED ECONOMIC AND FISCAL IMPACT
METHODOLOGY
A.1 OVERVIEW
Economic impact estimates are generated by utilizing input-output models to translate an initial
amount of direct economic activity into the total amount of economic activity that it supports,
which includes multiple waves of spillover impacts generated by spending on goods and services
and by spending of labor income by employees. This section summarizes the methodologies and
tools used to construct, use, and interpret the input-output models needed to estimate this
project’s economic impact.
A.2 INPUT-OUTPUT MODEL THEORY
In an inter-connected economy, every dollar spent generates two spillover impacts:
First, some amount of the proportion of that expenditure that goes to the purchase of
goods and services gets circulated back into an economy when those goods and services
are purchased from local vendors. This represents what is called the “indirect effect,”
and reflects the fact that local purchases of goods and services support local vendors,
who in turn require additional purchasing with their own set of vendors.
Second, some amount of the proportion of that expenditure that goes to labor income gets
circulated back into an economy when those employees spend some of their earnings on
various goods and services. This represents what is called the “induced effect,” and
reflects the fact that some of those goods and services will be purchased from local
vendors, further stimulating a local economy.
The role of input-output models is to determine the linkages across industries in order to model
out the magnitude and composition of spillover impact to all industries of a dollar spent in any one
industry. Thus, the total economic impact is the sum of its own direct economic footprint plus the
indirect and induced effects generated by that direct footprint.
A.3 INPUT-OUTPUT MODEL MECHANICS
To model the impacts resulting from the direct expenditures Econsult Solutions, Inc. developed a
customized economic impact model using the IMPLAN input/output modeling system. IMPLAN
represents an industry standard approach to assess the economic and job creation impacts of
economic development projects, the creation of new businesses, and public policy changes within
a county its surrounding area
Econsult Solutions | 1435 Walnut Street, Ste. 400 | Philadelphia, PA 19102 | 215.717.2777 | econsultsolutions.com
A-2 REGIONAL ECONOMIC IMPACT OF PHILADELPHIA INTERNATIONAL AIRPORT |FINAL
IMPLAN has developed a social accounting matrix (SAM) that accounts for the flow of
commodities through economics. From this matrix, IMPLAN also determines the regional
purchase coefficient (RPC), the proportion of local supply that satisfies local demand. These
values not only establish the types of goods and services supported by an industry or institution,
but also the level in which they are acquired locally. This assessment determines the multiplier
basis for the local and regional models created in the IMPLAN modeling system. IMPLAN takes
the multipliers and divides them into 440 industry categories in accordance to the North American
Industrial Classification System (NAICS) codes.
The IMPLAN modeling system also allows for customization of its inputs which alters multiplier
outputs. Where necessary, certain institutions may have different levels of demand for
commodities. When this occurs, an “analysis-by-parts” (ABP) approach is taken. This allows the
user to model the impacts of direct economic activity related to and institution or industry with
greater accuracy. Where inputs are unknown, IMPLAN is able to estimate other inputs based on
the level of employment, earnings, or output by an industry or institution.
A.4 EMPLOYMENT AND WAGES SUPPORTED
IMPLAN generates job estimates based on the term “job-years”, or how many jobs will be
supported each year. For instance, if a construction project takes two years, and IMPLAN
estimates there are 100 employees, or more correctly “job-years” supported, over two years, that
represents 50 annual jobs. Additionally, these can be a mix of a full and part-time employment.
Consequently, job creation could feature more part-time jobs than fulltime jobs. To account for
this, IMPLAN has a multiplier to covert annual jobs to full-time equivalent jobs.
As noted in Section 1.3.4 of this report, this definition differs significantly from the definition of
employment utilized in Econsult’s 2006 study for PHL. Input-output modeling for that study was
conducted using the RIMS model produced by the U.S. Department of Commerce’s Bureau of
Economic Analysis (BEA). The definition of employment embedded in that approach included all
employment, whether full-time or part-time, in the total employment count without any adjustment
for part-time positions. Accordingly, the same mix of full-time employment within the IMPLAN and
RIMS models would produce different resulting figures, since IMPLAN includes an adjustment to
represent part-time jobs fractionally based on the proportion of the year they cover, and RIMS
does not include this adjustment. Accordingly, as noted elsewhere in this study, the comparative
results from the 2006 PHL study and the current analysis are not representative of a percentage
change in PHL’s impact over this time period.
Income to direct, indirect, and induced jobs is calculated as employee compensation. This
includes wage and salary, all benefits (e.g., health, retirement) and payroll taxes (both sides of
social security, unemployment taxes, etc.). Therefore, IMPLAN’s measure of income estimates
gross pay opposed to just strictly wages.
Econsult Solutions | 1435 Walnut Street, Ste. 400 | Philadelphia, PA 19102 | 215.717.2777 | econsultsolutions.com
A-3 REGIONAL ECONOMIC IMPACT OF PHILADELPHIA INTERNATIONAL AIRPORT |FINAL
A.5 TAX REVENUE IMPACT
The economic impacts in turn produce one-time or ongoing increases in various tax bases, which
yield temporary or permanent increases in various tax revenues. To estimate these increases,
Econsult Solutions, Inc. created a tax revenue impact model to translate total economic impacts
into their commensurate tax revenue gains. These tax revenue gains only account for a subset of
the total tax revenue generation that an institution or industry may have on the economy.
Furthermore, where institutions are tax exempt, only the tax revenue generation from supported
indirect and induced industries is accounted for.
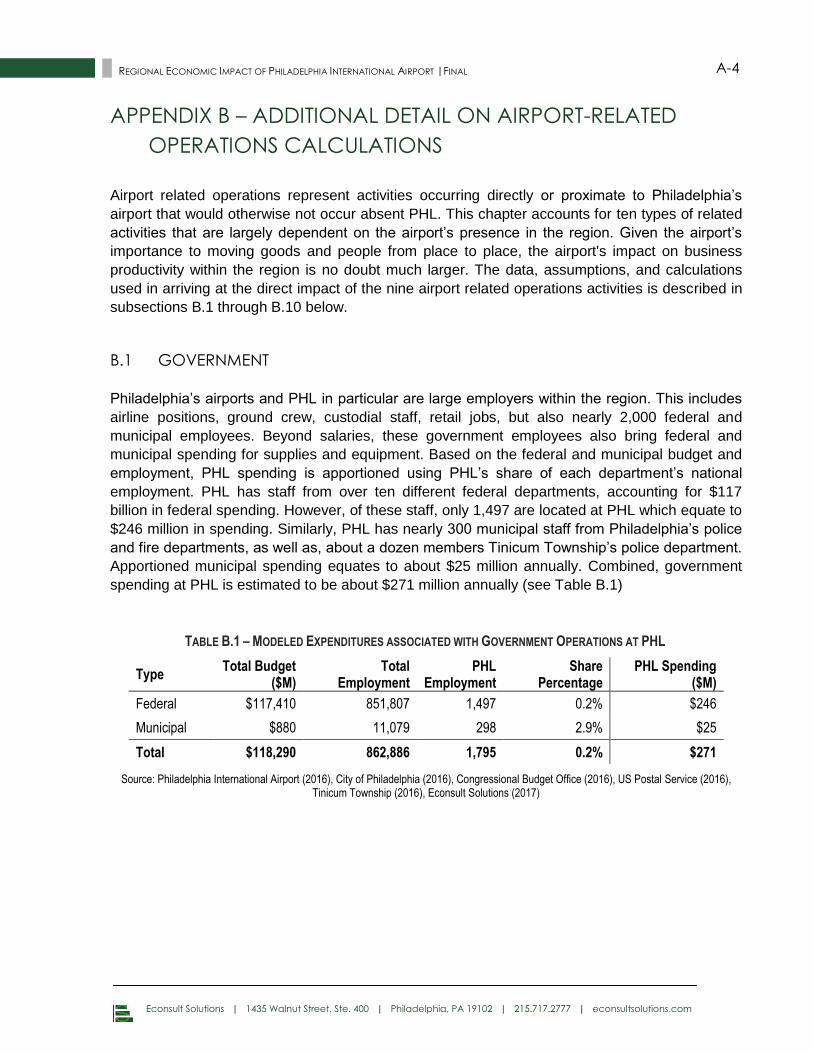
Econsult Solutions | 1435 Walnut Street, Ste. 400 | Philadelphia, PA 19102 | 215.717.2777 | econsultsolutions.com
A-4 REGIONAL ECONOMIC IMPACT OF PHILADELPHIA INTERNATIONAL AIRPORT |FINAL
APPENDIX B – ADDITIONAL DETAIL ON AIRPORT-RELATED
OPERATIONS CALCULATIONS
Airport related operations represent activities occurring directly or proximate to Philadelphia’s
airport that would otherwise not occur absent PHL. This chapter accounts for ten types of related
activities that are largely dependent on the airport’s presence in the region. Given the airport’s
importance to moving goods and people from place to place, the airport's impact on business
productivity within the region is no doubt much larger. The data, assumptions, and calculations
used in arriving at the direct impact of the nine airport related operations activities is described in
subsections B.1 through B.10 below.
B.1 GOVERNMENT
Philadelphia’s airports and PHL in particular are large employers within the region. This includes
airline positions, ground crew, custodial staff, retail jobs, but also nearly 2,000 federal and
municipal employees. Beyond salaries, these government employees also bring federal and
municipal spending for supplies and equipment. Based on the federal and municipal budget and
employment, PHL spending is apportioned using PHL’s share of each department’s national
employment. PHL has staff from over ten different federal departments, accounting for $117
billion in federal spending. However, of these staff, only 1,497 are located at PHL which equate to
$246 million in spending. Similarly, PHL has nearly 300 municipal staff from Philadelphia’s police
and fire departments, as well as, about a dozen members Tinicum Township’s police department.
Apportioned municipal spending equates to about $25 million annually. Combined, government
spending at PHL is estimated to be about $271 million annually (see Table B.1)
TABLE B.1 – MODELED EXPENDITURES ASSOCIATED WITH GOVERNMENT OPERATIONS AT PHL
Type Total Budget
($M) Total
Employment PHL
Employment Share
Percentage PHL Spending
($M)
Federal $117,410 851,807 1,497 0.2% $246
Municipal $880 11,079 298 2.9% $25
Total $118,290 862,886 1,795 0.2% $271
Source: Philadelphia International Airport (2016), City of Philadelphia (2016), Congressional Budget Office (2016), US Postal Service (2016), Tinicum Township (2016), Econsult Solutions (2017)
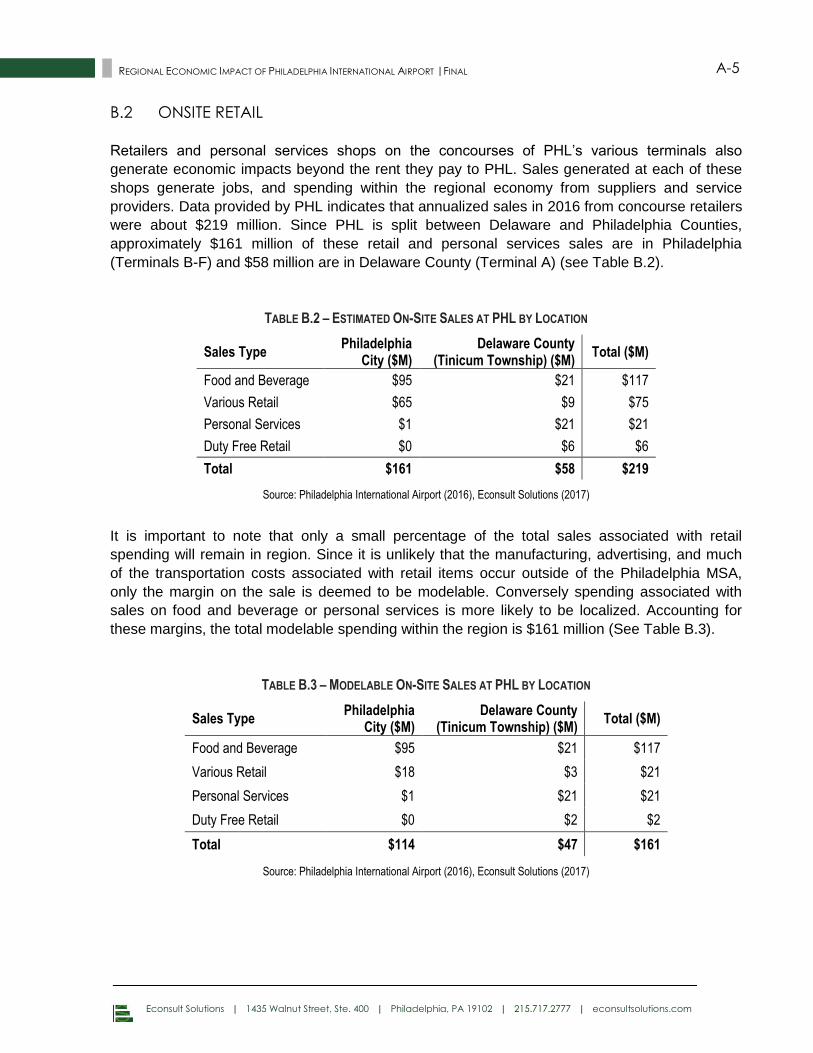
Econsult Solutions | 1435 Walnut Street, Ste. 400 | Philadelphia, PA 19102 | 215.717.2777 | econsultsolutions.com
A-5 REGIONAL ECONOMIC IMPACT OF PHILADELPHIA INTERNATIONAL AIRPORT |FINAL
B.2 ONSITE RETAIL
Retailers and personal services shops on the concourses of PHL’s various terminals also
generate economic impacts beyond the rent they pay to PHL. Sales generated at each of these
shops generate jobs, and spending within the regional economy from suppliers and service
providers. Data provided by PHL indicates that annualized sales in 2016 from concourse retailers
were about $219 million. Since PHL is split between Delaware and Philadelphia Counties,
approximately $161 million of these retail and personal services sales are in Philadelphia
(Terminals B-F) and $58 million are in Delaware County (Terminal A) (see Table B.2).
TABLE B.2 – ESTIMATED ON-SITE SALES AT PHL BY LOCATION
Sales Type Philadelphia
City ($M) Delaware County
(Tinicum Township) ($M) Total ($M)
Food and Beverage $95 $21 $117
Various Retail $65 $9 $75
Personal Services $1 $21 $21
Duty Free Retail $0 $6 $6
Total $161 $58 $219
Source: Philadelphia International Airport (2016), Econsult Solutions (2017)
It is important to note that only a small percentage of the total sales associated with retail
spending will remain in region. Since it is unlikely that the manufacturing, advertising, and much
of the transportation costs associated with retail items occur outside of the Philadelphia MSA,
only the margin on the sale is deemed to be modelable. Conversely spending associated with
sales on food and beverage or personal services is more likely to be localized. Accounting for
these margins, the total modelable spending within the region is $161 million (See Table B.3).
TABLE B.3 – MODELABLE ON-SITE SALES AT PHL BY LOCATION
Sales Type Philadelphia
City ($M) Delaware County
(Tinicum Township) ($M) Total ($M)
Food and Beverage $95 $21 $117
Various Retail $18 $3 $21
Personal Services $1 $21 $21
Duty Free Retail $0 $2 $2
Total $114 $47 $161
Source: Philadelphia International Airport (2016), Econsult Solutions (2017)
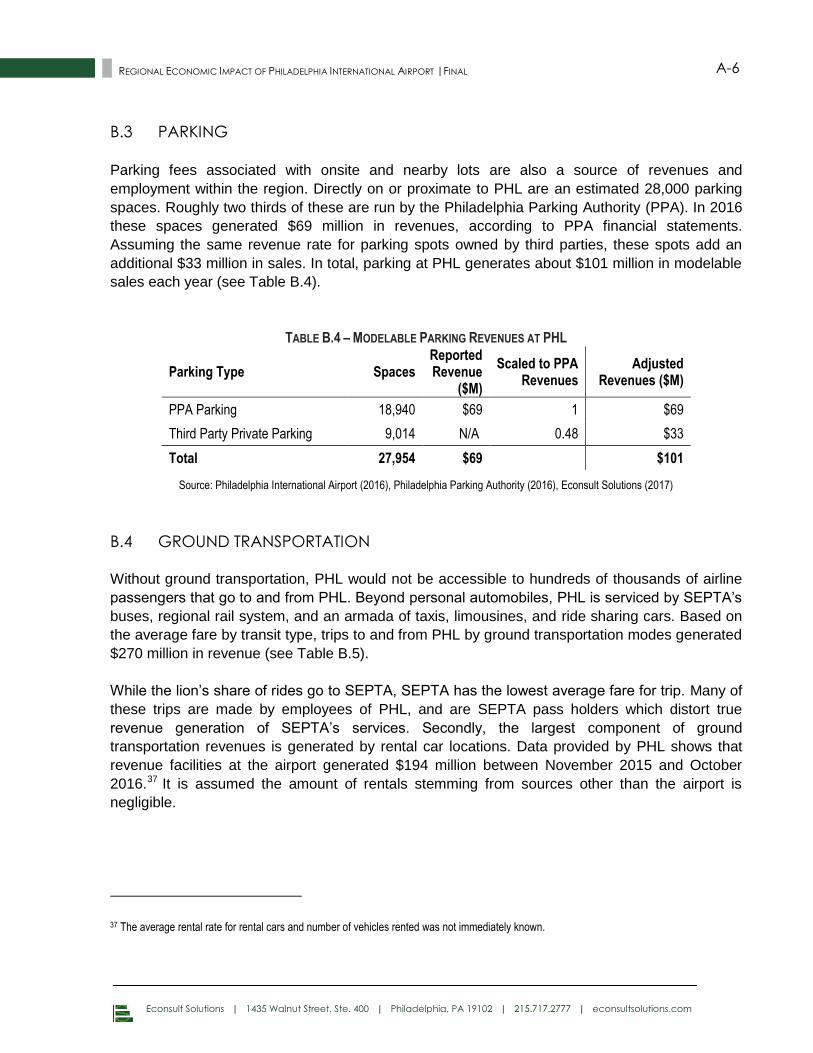
Econsult Solutions | 1435 Walnut Street, Ste. 400 | Philadelphia, PA 19102 | 215.717.2777 | econsultsolutions.com
A-6 REGIONAL ECONOMIC IMPACT OF PHILADELPHIA INTERNATIONAL AIRPORT |FINAL
B.3 PARKING
Parking fees associated with onsite and nearby lots are also a source of revenues and
employment within the region. Directly on or proximate to PHL are an estimated 28,000 parking
spaces. Roughly two thirds of these are run by the Philadelphia Parking Authority (PPA). In 2016
these spaces generated $69 million in revenues, according to PPA financial statements.
Assuming the same revenue rate for parking spots owned by third parties, these spots add an
additional $33 million in sales. In total, parking at PHL generates about $101 million in modelable
sales each year (see Table B.4).
TABLE B.4 – MODELABLE PARKING REVENUES AT PHL
Parking Type Spaces Reported Revenue
($M)
Scaled to PPA Revenues
Adjusted Revenues ($M)
PPA Parking 18,940 $69 1 $69
Third Party Private Parking 9,014 N/A 0.48 $33
Total 27,954 $69
$101
Source: Philadelphia International Airport (2016), Philadelphia Parking Authority (2016), Econsult Solutions (2017)
B.4 GROUND TRANSPORTATION
Without ground transportation, PHL would not be accessible to hundreds of thousands of airline
passengers that go to and from PHL. Beyond personal automobiles, PHL is serviced by SEPTA’s
buses, regional rail system, and an armada of taxis, limousines, and ride sharing cars. Based on
the average fare by transit type, trips to and from PHL by ground transportation modes generated
$270 million in revenue (see Table B.5).
While the lion’s share of rides go to SEPTA, SEPTA has the lowest average fare for trip. Many of
these trips are made by employees of PHL, and are SEPTA pass holders which distort true
revenue generation of SEPTA’s services. Secondly, the largest component of ground
transportation revenues is generated by rental car locations. Data provided by PHL shows that
revenue facilities at the airport generated $194 million between November 2015 and October
2016.37 It is assumed the amount of rentals stemming from sources other than the airport is
negligible.
37 The average rental rate for rental cars and number of vehicles rented was not immediately known.
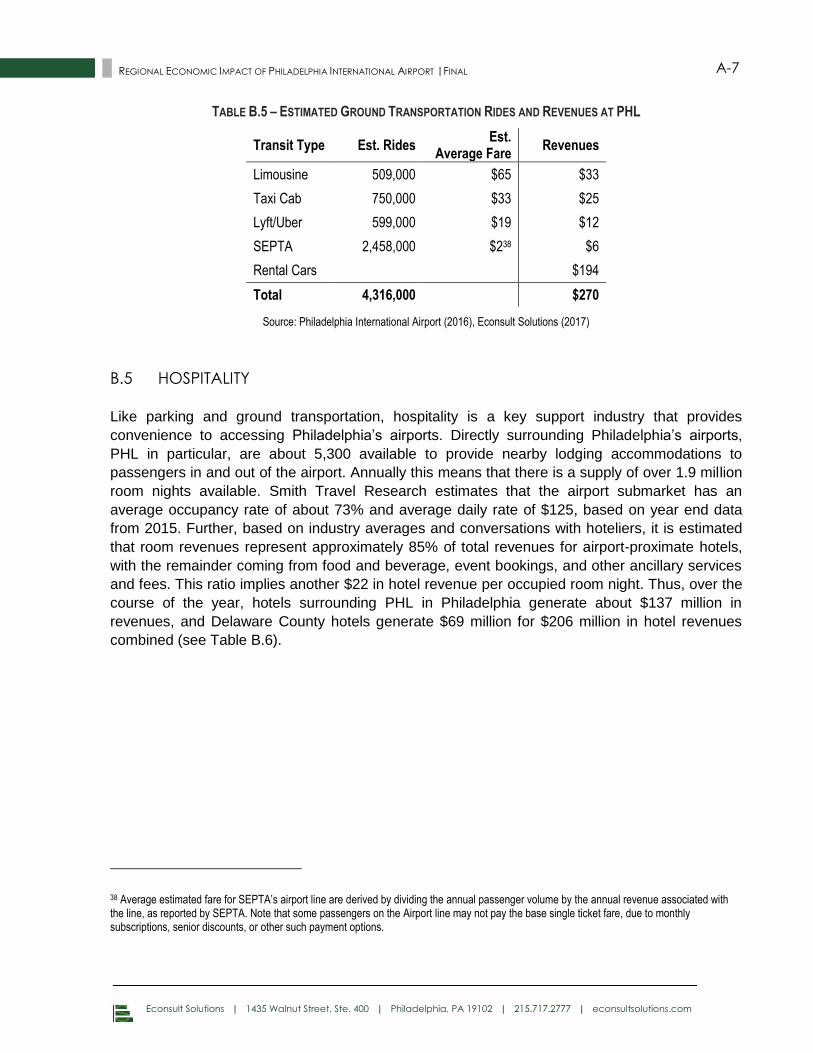
Econsult Solutions | 1435 Walnut Street, Ste. 400 | Philadelphia, PA 19102 | 215.717.2777 | econsultsolutions.com
A-7 REGIONAL ECONOMIC IMPACT OF PHILADELPHIA INTERNATIONAL AIRPORT |FINAL
TABLE B.5 – ESTIMATED GROUND TRANSPORTATION RIDES AND REVENUES AT PHL
Transit Type Est. Rides Est.
Average Fare Revenues
Limousine 509,000 $65 $33
Taxi Cab 750,000 $33 $25
Lyft/Uber 599,000 $19 $12
SEPTA 2,458,000 $238 $6
Rental Cars $194
Total 4,316,000 $270
Source: Philadelphia International Airport (2016), Econsult Solutions (2017)
B.5 HOSPITALITY
Like parking and ground transportation, hospitality is a key support industry that provides
convenience to accessing Philadelphia’s airports. Directly surrounding Philadelphia’s airports,
PHL in particular, are about 5,300 available to provide nearby lodging accommodations to
passengers in and out of the airport. Annually this means that there is a supply of over 1.9 million
room nights available. Smith Travel Research estimates that the airport submarket has an
average occupancy rate of about 73% and average daily rate of $125, based on year end data
from 2015. Further, based on industry averages and conversations with hoteliers, it is estimated
that room revenues represent approximately 85% of total revenues for airport-proximate hotels,
with the remainder coming from food and beverage, event bookings, and other ancillary services
and fees. This ratio implies another $22 in hotel revenue per occupied room night. Thus, over the
course of the year, hotels surrounding PHL in Philadelphia generate about $137 million in
revenues, and Delaware County hotels generate $69 million for $206 million in hotel revenues
combined (see Table B.6).
38 Average estimated fare for SEPTA’s airport line are derived by dividing the annual passenger volume by the annual revenue associated with the line, as reported by SEPTA. Note that some passengers on the Airport line may not pay the base single ticket fare, due to monthly subscriptions, senior discounts, or other such payment options.
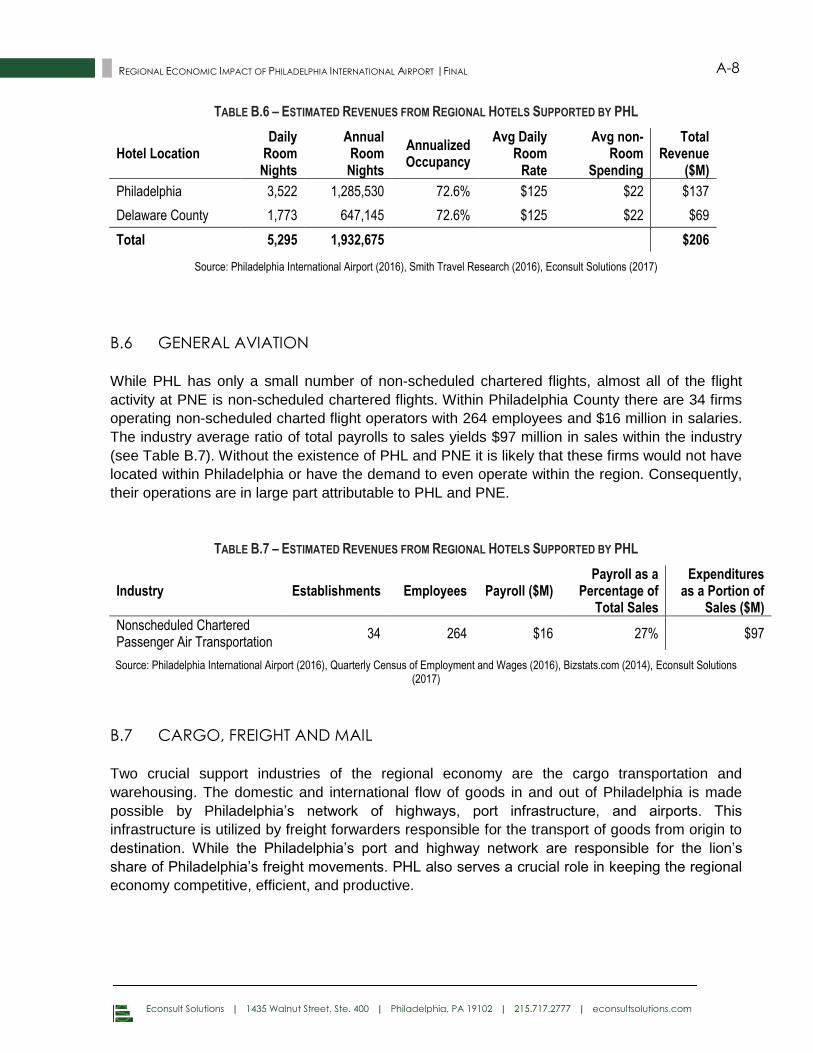
Econsult Solutions | 1435 Walnut Street, Ste. 400 | Philadelphia, PA 19102 | 215.717.2777 | econsultsolutions.com
A-8 REGIONAL ECONOMIC IMPACT OF PHILADELPHIA INTERNATIONAL AIRPORT |FINAL
TABLE B.6 – ESTIMATED REVENUES FROM REGIONAL HOTELS SUPPORTED BY PHL
Hotel Location Daily
Room Nights
Annual Room
Nights
Annualized Occupancy
Avg Daily Room
Rate
Avg non-Room
Spending
Total Revenue
($M)
Philadelphia 3,522 1,285,530 72.6% $125 $22 $137
Delaware County 1,773 647,145 72.6% $125 $22 $69
Total 5,295 1,932,675
$206
Source: Philadelphia International Airport (2016), Smith Travel Research (2016), Econsult Solutions (2017)
B.6 GENERAL AVIATION
While PHL has only a small number of non-scheduled chartered flights, almost all of the flight
activity at PNE is non-scheduled chartered flights. Within Philadelphia County there are 34 firms
operating non-scheduled charted flight operators with 264 employees and $16 million in salaries.
The industry average ratio of total payrolls to sales yields $97 million in sales within the industry
(see Table B.7). Without the existence of PHL and PNE it is likely that these firms would not have
located within Philadelphia or have the demand to even operate within the region. Consequently,
their operations are in large part attributable to PHL and PNE.
TABLE B.7 – ESTIMATED REVENUES FROM REGIONAL HOTELS SUPPORTED BY PHL
Industry Establishments Employees Payroll ($M) Payroll as a
Percentage of Total Sales
Expenditures as a Portion of
Sales ($M)
Nonscheduled Chartered Passenger Air Transportation
34 264 $16 27% $97
Source: Philadelphia International Airport (2016), Quarterly Census of Employment and Wages (2016), Bizstats.com (2014), Econsult Solutions (2017)
B.7 CARGO, FREIGHT AND MAIL
Two crucial support industries of the regional economy are the cargo transportation and
warehousing. The domestic and international flow of goods in and out of Philadelphia is made
possible by Philadelphia’s network of highways, port infrastructure, and airports. This
infrastructure is utilized by freight forwarders responsible for the transport of goods from origin to
destination. While the Philadelphia’s port and highway network are responsible for the lion’s
share of Philadelphia’s freight movements. PHL also serves a crucial role in keeping the regional
economy competitive, efficient, and productive.
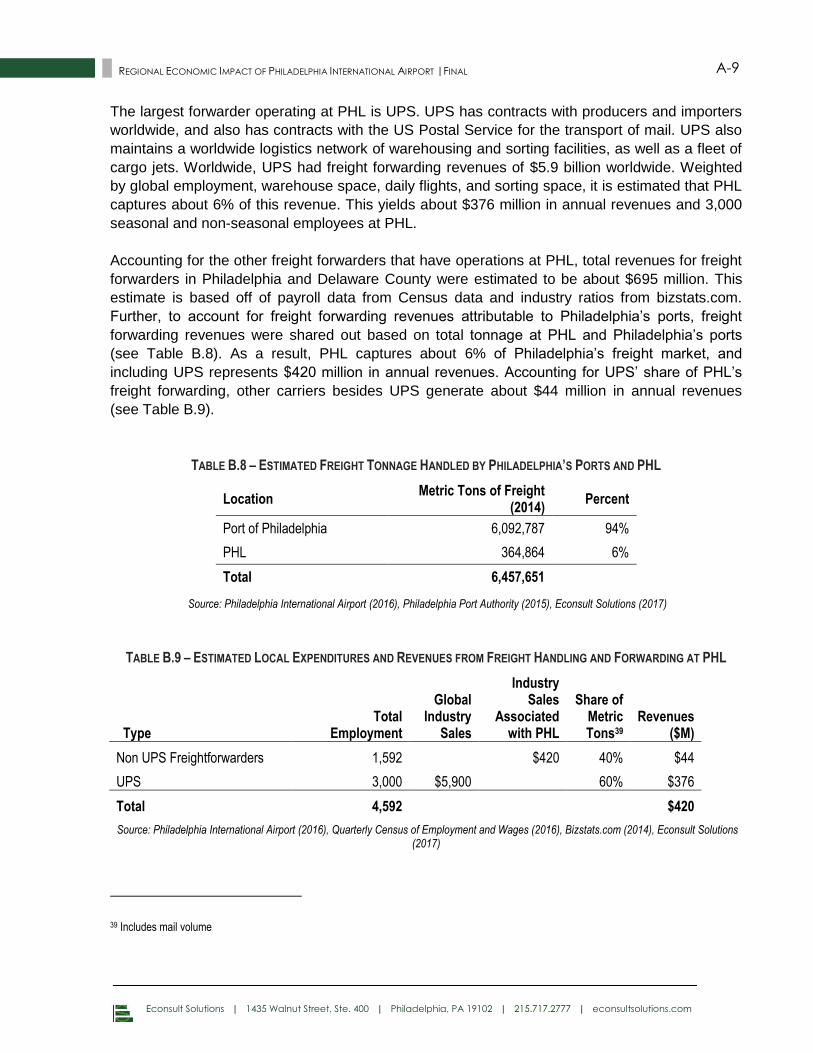
Econsult Solutions | 1435 Walnut Street, Ste. 400 | Philadelphia, PA 19102 | 215.717.2777 | econsultsolutions.com
A-9 REGIONAL ECONOMIC IMPACT OF PHILADELPHIA INTERNATIONAL AIRPORT |FINAL
The largest forwarder operating at PHL is UPS. UPS has contracts with producers and importers
worldwide, and also has contracts with the US Postal Service for the transport of mail. UPS also
maintains a worldwide logistics network of warehousing and sorting facilities, as well as a fleet of
cargo jets. Worldwide, UPS had freight forwarding revenues of $5.9 billion worldwide. Weighted
by global employment, warehouse space, daily flights, and sorting space, it is estimated that PHL
captures about 6% of this revenue. This yields about $376 million in annual revenues and 3,000
seasonal and non-seasonal employees at PHL.
Accounting for the other freight forwarders that have operations at PHL, total revenues for freight
forwarders in Philadelphia and Delaware County were estimated to be about $695 million. This
estimate is based off of payroll data from Census data and industry ratios from bizstats.com.
Further, to account for freight forwarding revenues attributable to Philadelphia’s ports, freight
forwarding revenues were shared out based on total tonnage at PHL and Philadelphia’s ports
(see Table B.8). As a result, PHL captures about 6% of Philadelphia’s freight market, and
including UPS represents $420 million in annual revenues. Accounting for UPS’ share of PHL’s
freight forwarding, other carriers besides UPS generate about $44 million in annual revenues
(see Table B.9).
TABLE B.8 – ESTIMATED FREIGHT TONNAGE HANDLED BY PHILADELPHIA’S PORTS AND PHL
Location Metric Tons of Freight
(2014) Percent
Port of Philadelphia 6,092,787 94%
PHL 364,864 6%
Total 6,457,651
Source: Philadelphia International Airport (2016), Philadelphia Port Authority (2015), Econsult Solutions (2017)
TABLE B.9 – ESTIMATED LOCAL EXPENDITURES AND REVENUES FROM FREIGHT HANDLING AND FORWARDING AT PHL
Type Total
Employment
Global Industry
Sales
Industry Sales
Associated with PHL
Share of Metric Tons39
Revenues ($M)
Non UPS Freightforwarders 1,592
$420 40% $44
UPS 3,000 $5,900 60% $376
Total 4,592
$420
Source: Philadelphia International Airport (2016), Quarterly Census of Employment and Wages (2016), Bizstats.com (2014), Econsult Solutions (2017)
39 Includes mail volume
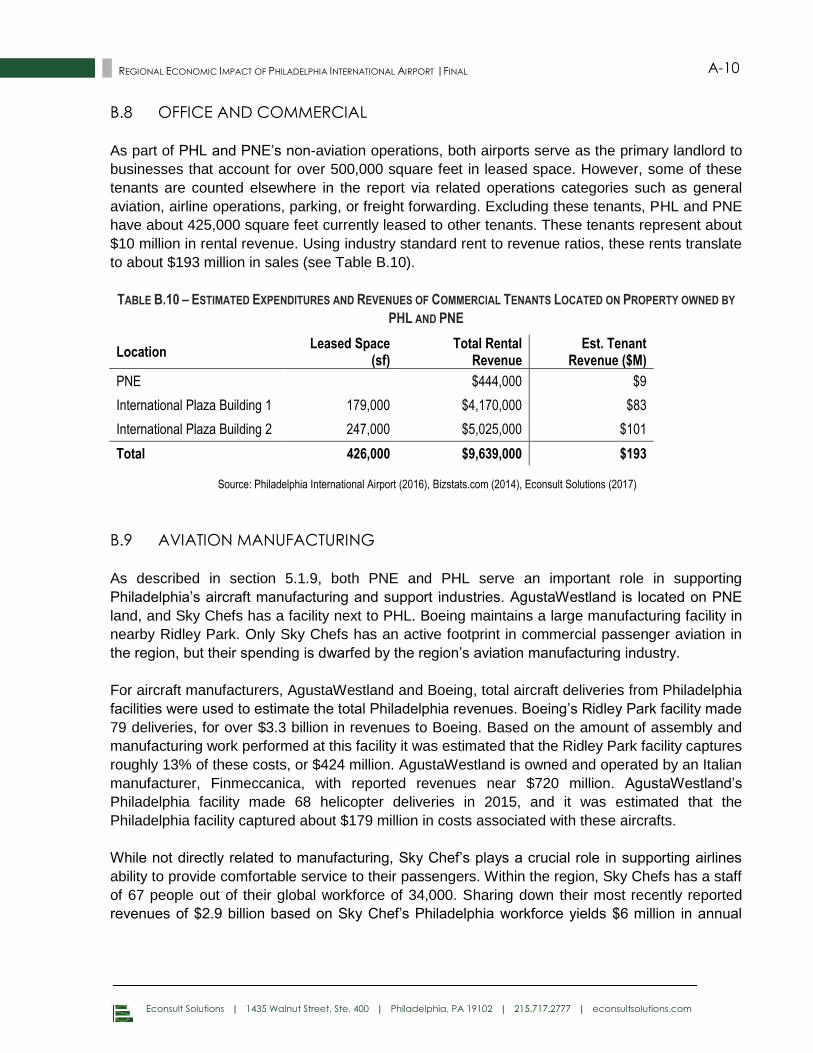
Econsult Solutions | 1435 Walnut Street, Ste. 400 | Philadelphia, PA 19102 | 215.717.2777 | econsultsolutions.com
A-10 REGIONAL ECONOMIC IMPACT OF PHILADELPHIA INTERNATIONAL AIRPORT |FINAL
B.8 OFFICE AND COMMERCIAL
As part of PHL and PNE’s non-aviation operations, both airports serve as the primary landlord to
businesses that account for over 500,000 square feet in leased space. However, some of these
tenants are counted elsewhere in the report via related operations categories such as general
aviation, airline operations, parking, or freight forwarding. Excluding these tenants, PHL and PNE
have about 425,000 square feet currently leased to other tenants. These tenants represent about
$10 million in rental revenue. Using industry standard rent to revenue ratios, these rents translate
to about $193 million in sales (see Table B.10).
TABLE B.10 – ESTIMATED EXPENDITURES AND REVENUES OF COMMERCIAL TENANTS LOCATED ON PROPERTY OWNED BY
PHL AND PNE
Location Leased Space
(sf) Total Rental
Revenue Est. Tenant
Revenue ($M)
PNE
$444,000 $9
International Plaza Building 1 179,000 $4,170,000 $83
International Plaza Building 2 247,000 $5,025,000 $101
Total 426,000 $9,639,000 $193
Source: Philadelphia International Airport (2016), Bizstats.com (2014), Econsult Solutions (2017)
B.9 AVIATION MANUFACTURING
As described in section 5.1.9, both PNE and PHL serve an important role in supporting
Philadelphia’s aircraft manufacturing and support industries. AgustaWestland is located on PNE
land, and Sky Chefs has a facility next to PHL. Boeing maintains a large manufacturing facility in
nearby Ridley Park. Only Sky Chefs has an active footprint in commercial passenger aviation in
the region, but their spending is dwarfed by the region’s aviation manufacturing industry.
For aircraft manufacturers, AgustaWestland and Boeing, total aircraft deliveries from Philadelphia
facilities were used to estimate the total Philadelphia revenues. Boeing’s Ridley Park facility made
79 deliveries, for over $3.3 billion in revenues to Boeing. Based on the amount of assembly and
manufacturing work performed at this facility it was estimated that the Ridley Park facility captures
roughly 13% of these costs, or $424 million. AgustaWestland is owned and operated by an Italian
manufacturer, Finmeccanica, with reported revenues near $720 million. AgustaWestland’s
Philadelphia facility made 68 helicopter deliveries in 2015, and it was estimated that the
Philadelphia facility captured about $179 million in costs associated with these aircrafts.
While not directly related to manufacturing, Sky Chef’s plays a crucial role in supporting airlines
ability to provide comfortable service to their passengers. Within the region, Sky Chefs has a staff
of 67 people out of their global workforce of 34,000. Sharing down their most recently reported
revenues of $2.9 billion based on Sky Chef’s Philadelphia workforce yields $6 million in annual
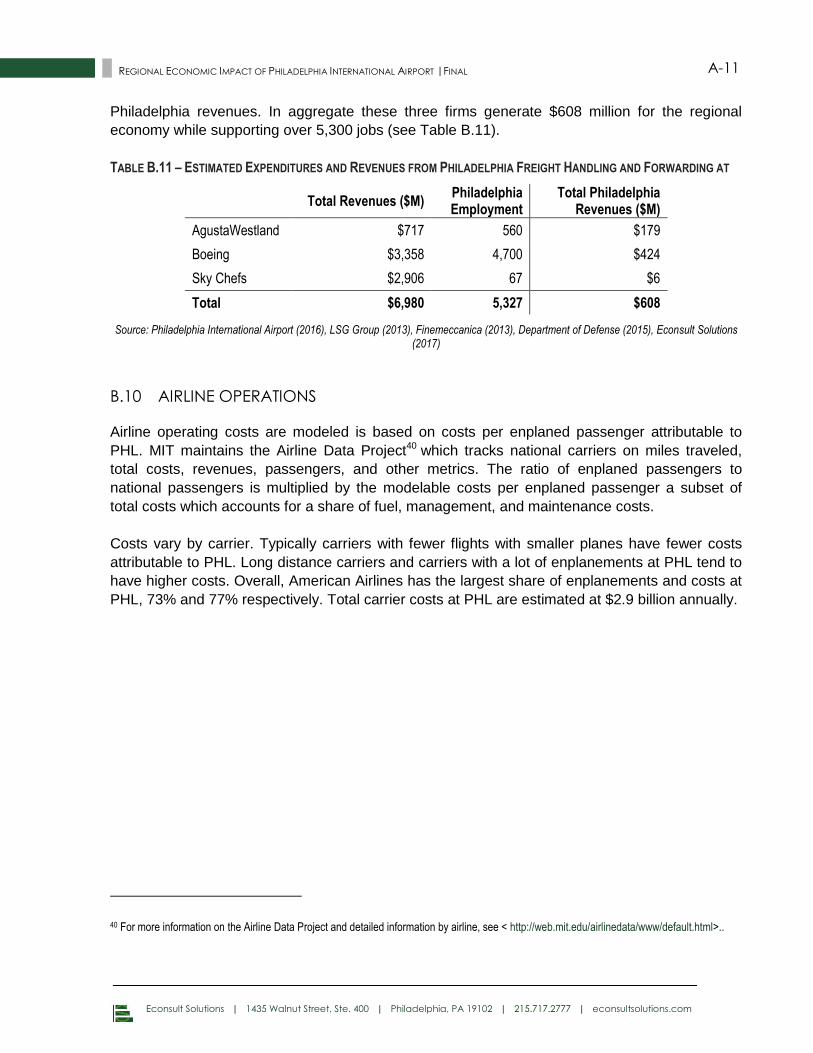
Econsult Solutions | 1435 Walnut Street, Ste. 400 | Philadelphia, PA 19102 | 215.717.2777 | econsultsolutions.com
A-11 REGIONAL ECONOMIC IMPACT OF PHILADELPHIA INTERNATIONAL AIRPORT |FINAL
Philadelphia revenues. In aggregate these three firms generate $608 million for the regional
economy while supporting over 5,300 jobs (see Table B.11).
TABLE B.11 – ESTIMATED EXPENDITURES AND REVENUES FROM PHILADELPHIA FREIGHT HANDLING AND FORWARDING AT
Total Revenues ($M) Philadelphia Employment
Total Philadelphia Revenues ($M)
AgustaWestland $717 560 $179
Boeing $3,358 4,700 $424
Sky Chefs $2,906 67 $6
Total $6,980 5,327 $608
Source: Philadelphia International Airport (2016), LSG Group (2013), Finemeccanica (2013), Department of Defense (2015), Econsult Solutions (2017)
B.10 AIRLINE OPERATIONS
Airline operating costs are modeled is based on costs per enplaned passenger attributable to
PHL. MIT maintains the Airline Data Project40 which tracks national carriers on miles traveled,
total costs, revenues, passengers, and other metrics. The ratio of enplaned passengers to
national passengers is multiplied by the modelable costs per enplaned passenger a subset of
total costs which accounts for a share of fuel, management, and maintenance costs.
Costs vary by carrier. Typically carriers with fewer flights with smaller planes have fewer costs
attributable to PHL. Long distance carriers and carriers with a lot of enplanements at PHL tend to
have higher costs. Overall, American Airlines has the largest share of enplanements and costs at
PHL, 73% and 77% respectively. Total carrier costs at PHL are estimated at $2.9 billion annually.
40 For more information on the Airline Data Project and detailed information by airline, see < http://web.mit.edu/airlinedata/www/default.html>..
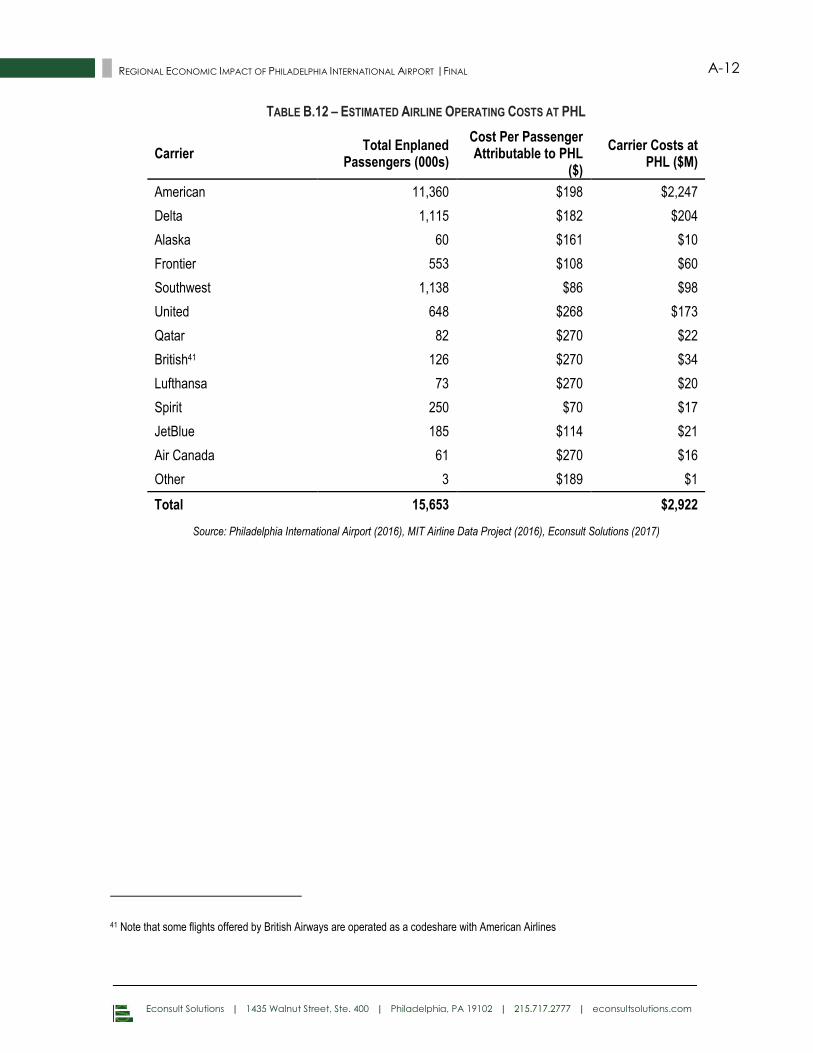
Econsult Solutions | 1435 Walnut Street, Ste. 400 | Philadelphia, PA 19102 | 215.717.2777 | econsultsolutions.com
A-12 REGIONAL ECONOMIC IMPACT OF PHILADELPHIA INTERNATIONAL AIRPORT |FINAL
TABLE B.12 – ESTIMATED AIRLINE OPERATING COSTS AT PHL
Carrier Total Enplaned
Passengers (000s)
Cost Per Passenger Attributable to PHL
($)
Carrier Costs at PHL ($M)
American 11,360 $198 $2,247
Delta 1,115 $182 $204
Alaska 60 $161 $10
Frontier 553 $108 $60
Southwest 1,138 $86 $98
United 648 $268 $173
Qatar 82 $270 $22
British41 126 $270 $34
Lufthansa 73 $270 $20
Spirit 250 $70 $17
JetBlue 185 $114 $21
Air Canada 61 $270 $16
Other 3 $189 $1
Total 15,653
$2,922
Source: Philadelphia International Airport (2016), MIT Airline Data Project (2016), Econsult Solutions (2017)
41 Note that some flights offered by British Airways are operated as a codeshare with American Airlines
Econsult Solutions | 1435 Walnut Street, Ste. 400 | Philadelphia, PA 19102 | 215.717.2777 | econsultsolutions.com
A-13 REGIONAL ECONOMIC IMPACT OF PHILADELPHIA INTERNATIONAL AIRPORT |FINAL
APPENDIX C – ADDITIONAL DETAIL ON REGIONAL TOURISM
EXPENDITURE CALCULATIONS
The purpose of this appendix is to review the methods and data sources utilized to estimate the
volume and composition of direct visitor spending taking place within the 11-County region that is
a) attributable to PHL and b) additive to spending already accounted for in this report. The
analysis proceeds by estimating the total volume of visitor spending by visitor type in the 11-
County region (extrapolating from a similar analysis of visitor to the 5-County Pennsylvania region
for regional tourism promotion agency Visit Philadelphia). It then excludes spending by those
visitors who are not estimated to be utilizing PHL air service, and excludes spending that is
already captured within the Airline Operations (Section 4) and Airport-Related Operations
analysis (Section 5) in this report, including airfare, in-terminal retail, ground transportation, and
airport-proximate hospitality. The remaining visitor spending within the region is considered both
attributable to PHL and non-duplicative with other economic activity captured in this analysis, and
therefore forms an additional category of PHL economic impact.
In addition to the visitor spending that it helps to bring into the region, PHL also serves as an
amenity for residents traveling outbound. This facilitates the activity of the local travel
arrangement industry, which relies in part on booking airfare for local residents departing from the
region. This appendix also details the data sources, assumptions and calculations used to define
the annual volume of regional travel arrangement industry activity attributable to PHL.
C.1 VISITOR SPENDING
The regional visitor spending proceeds in the following steps, detailed below:
1) Estimate total visitor spending within the 11-County region
2) Estimate the portion of this spending attributable to PHL
3) Estimate and net out the proportion already captured within the Airline Operations and
Airport-Related Operations analysis
The resulting visitor spending estimate is considered both attributable to PHL and additive to
other economic activity captured in this analysis.
Total Regional Direct Visitor Spending
ESI was commissioned by regional tourism promotion agency Visit Philadelphia to produce an
economic impact analysis of visitor spending in the 5-County Greater Philadelphia region
covering Bucks, Chester, Delaware and Montgomery County. That analysis concluded that
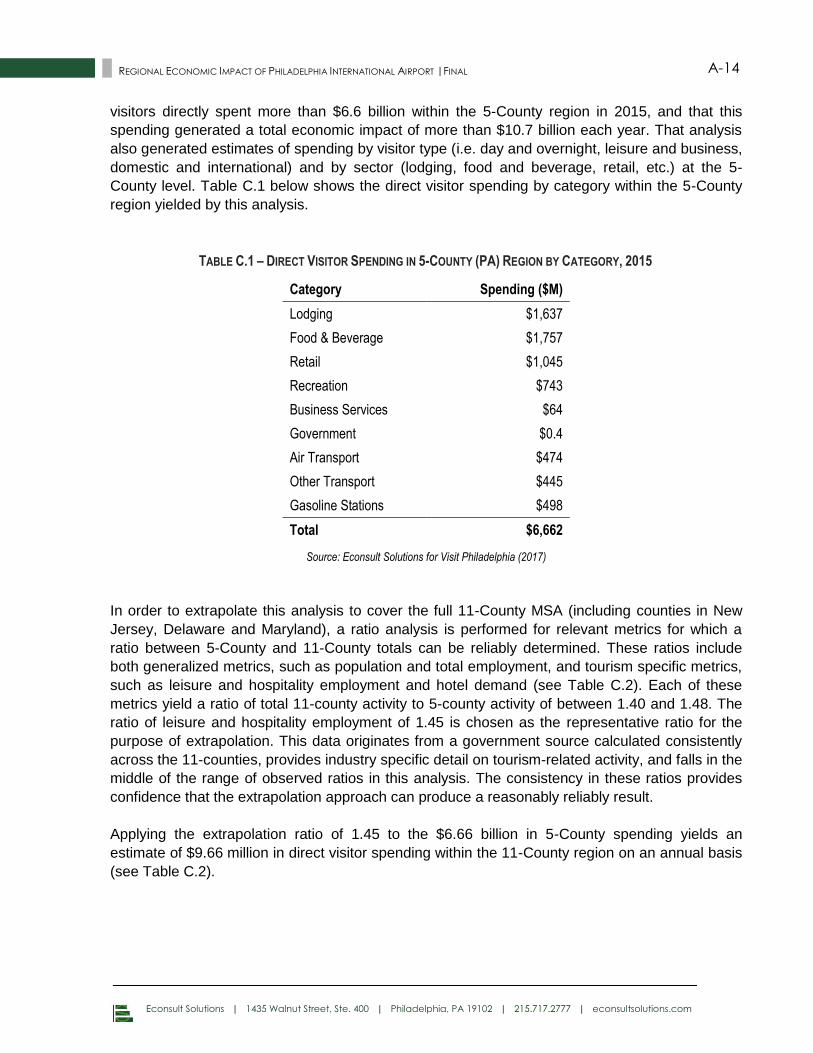
Econsult Solutions | 1435 Walnut Street, Ste. 400 | Philadelphia, PA 19102 | 215.717.2777 | econsultsolutions.com
A-14 REGIONAL ECONOMIC IMPACT OF PHILADELPHIA INTERNATIONAL AIRPORT |FINAL
visitors directly spent more than $6.6 billion within the 5-County region in 2015, and that this
spending generated a total economic impact of more than $10.7 billion each year. That analysis
also generated estimates of spending by visitor type (i.e. day and overnight, leisure and business,
domestic and international) and by sector (lodging, food and beverage, retail, etc.) at the 5-
County level. Table C.1 below shows the direct visitor spending by category within the 5-County
region yielded by this analysis.
TABLE C.1 – DIRECT VISITOR SPENDING IN 5-COUNTY (PA) REGION BY CATEGORY, 2015
Category Spending ($M)
Lodging $1,637
Food & Beverage $1,757
Retail $1,045
Recreation $743
Business Services $64
Government $0.4
Air Transport $474
Other Transport $445
Gasoline Stations $498
Total $6,662
Source: Econsult Solutions for Visit Philadelphia (2017)
In order to extrapolate this analysis to cover the full 11-County MSA (including counties in New
Jersey, Delaware and Maryland), a ratio analysis is performed for relevant metrics for which a
ratio between 5-County and 11-County totals can be reliably determined. These ratios include
both generalized metrics, such as population and total employment, and tourism specific metrics,
such as leisure and hospitality employment and hotel demand (see Table C.2). Each of these
metrics yield a ratio of total 11-county activity to 5-county activity of between 1.40 and 1.48. The
ratio of leisure and hospitality employment of 1.45 is chosen as the representative ratio for the
purpose of extrapolation. This data originates from a government source calculated consistently
across the 11-counties, provides industry specific detail on tourism-related activity, and falls in the
middle of the range of observed ratios in this analysis. The consistency in these ratios provides
confidence that the extrapolation approach can produce a reasonably reliably result.
Applying the extrapolation ratio of 1.45 to the $6.66 billion in 5-County spending yields an
estimate of $9.66 million in direct visitor spending within the 11-County region on an annual basis
(see Table C.2).
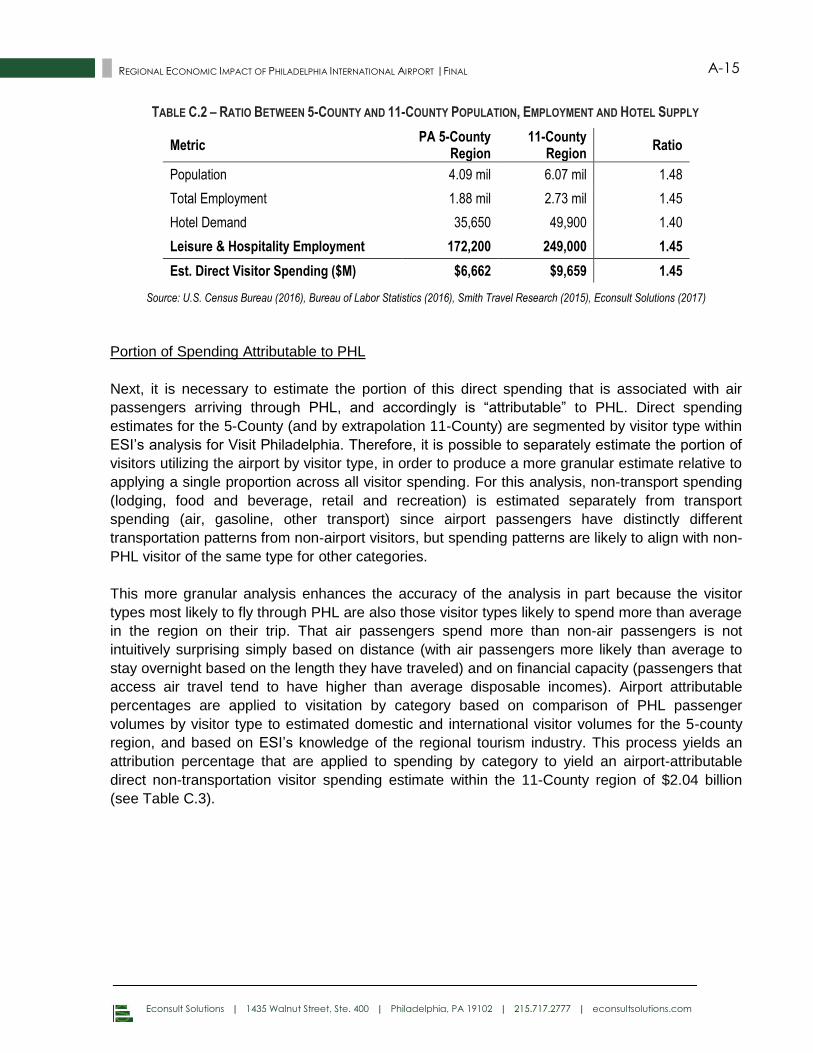
Econsult Solutions | 1435 Walnut Street, Ste. 400 | Philadelphia, PA 19102 | 215.717.2777 | econsultsolutions.com
A-15 REGIONAL ECONOMIC IMPACT OF PHILADELPHIA INTERNATIONAL AIRPORT |FINAL
TABLE C.2 – RATIO BETWEEN 5-COUNTY AND 11-COUNTY POPULATION, EMPLOYMENT AND HOTEL SUPPLY
Metric PA 5-County
Region 11-County
Region Ratio
Population 4.09 mil 6.07 mil 1.48
Total Employment 1.88 mil 2.73 mil 1.45
Hotel Demand 35,650 49,900 1.40
Leisure & Hospitality Employment 172,200 249,000 1.45
Est. Direct Visitor Spending ($M) $6,662 $9,659 1.45
Source: U.S. Census Bureau (2016), Bureau of Labor Statistics (2016), Smith Travel Research (2015), Econsult Solutions (2017)
Portion of Spending Attributable to PHL
Next, it is necessary to estimate the portion of this direct spending that is associated with air
passengers arriving through PHL, and accordingly is “attributable” to PHL. Direct spending
estimates for the 5-County (and by extrapolation 11-County) are segmented by visitor type within
ESI’s analysis for Visit Philadelphia. Therefore, it is possible to separately estimate the portion of
visitors utilizing the airport by visitor type, in order to produce a more granular estimate relative to
applying a single proportion across all visitor spending. For this analysis, non-transport spending
(lodging, food and beverage, retail and recreation) is estimated separately from transport
spending (air, gasoline, other transport) since airport passengers have distinctly different
transportation patterns from non-airport visitors, but spending patterns are likely to align with non-
PHL visitor of the same type for other categories.
This more granular analysis enhances the accuracy of the analysis in part because the visitor
types most likely to fly through PHL are also those visitor types likely to spend more than average
in the region on their trip. That air passengers spend more than non-air passengers is not
intuitively surprising simply based on distance (with air passengers more likely than average to
stay overnight based on the length they have traveled) and on financial capacity (passengers that
access air travel tend to have higher than average disposable incomes). Airport attributable
percentages are applied to visitation by category based on comparison of PHL passenger
volumes by visitor type to estimated domestic and international visitor volumes for the 5-county
region, and based on ESI’s knowledge of the regional tourism industry. This process yields an
attribution percentage that are applied to spending by category to yield an airport-attributable
direct non-transportation visitor spending estimate within the 11-County region of $2.04 billion
(see Table C.3).
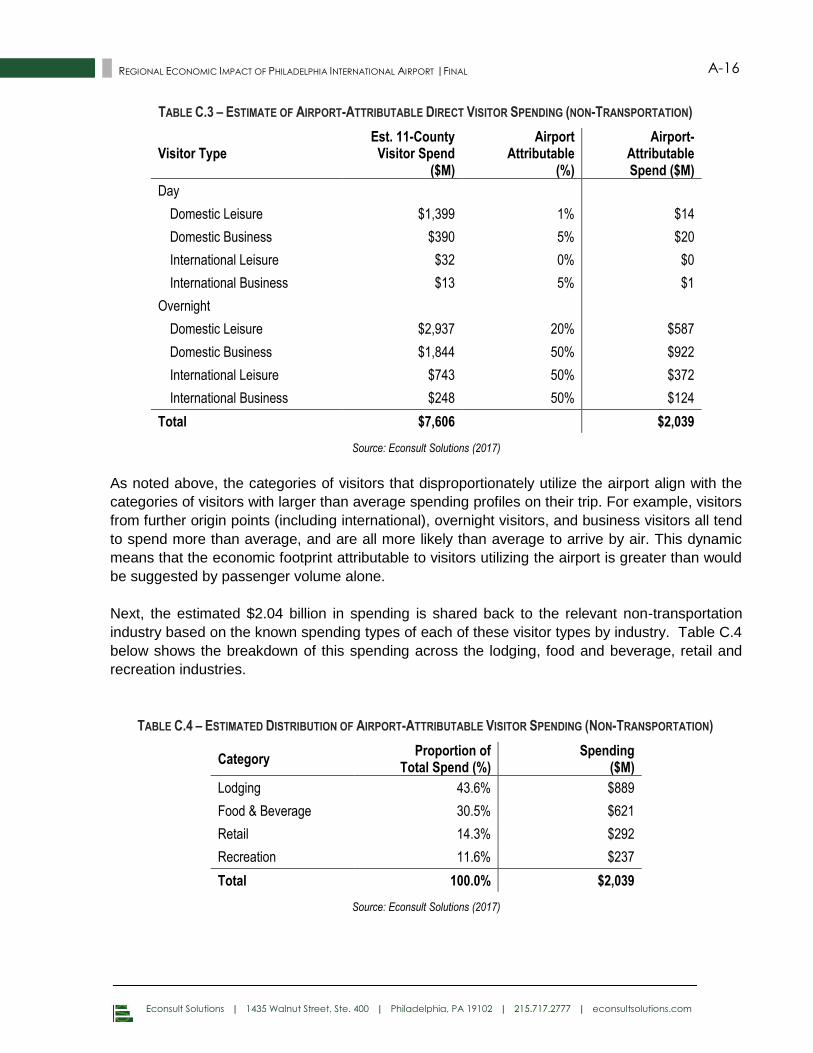
Econsult Solutions | 1435 Walnut Street, Ste. 400 | Philadelphia, PA 19102 | 215.717.2777 | econsultsolutions.com
A-16 REGIONAL ECONOMIC IMPACT OF PHILADELPHIA INTERNATIONAL AIRPORT |FINAL
TABLE C.3 – ESTIMATE OF AIRPORT-ATTRIBUTABLE DIRECT VISITOR SPENDING (NON-TRANSPORTATION)
Visitor Type Est. 11-County
Visitor Spend ($M)
Airport Attributable
(%)
Airport- Attributable Spend ($M)
Day
Domestic Leisure $1,399 1% $14
Domestic Business $390 5% $20
International Leisure $32 0% $0
International Business $13 5% $1
Overnight
Domestic Leisure $2,937 20% $587
Domestic Business $1,844 50% $922
International Leisure $743 50% $372
International Business $248 50% $124
Total $7,606 $2,039
Source: Econsult Solutions (2017)
As noted above, the categories of visitors that disproportionately utilize the airport align with the
categories of visitors with larger than average spending profiles on their trip. For example, visitors
from further origin points (including international), overnight visitors, and business visitors all tend
to spend more than average, and are all more likely than average to arrive by air. This dynamic
means that the economic footprint attributable to visitors utilizing the airport is greater than would
be suggested by passenger volume alone.
Next, the estimated $2.04 billion in spending is shared back to the relevant non-transportation
industry based on the known spending types of each of these visitor types by industry. Table C.4
below shows the breakdown of this spending across the lodging, food and beverage, retail and
recreation industries.
TABLE C.4 – ESTIMATED DISTRIBUTION OF AIRPORT-ATTRIBUTABLE VISITOR SPENDING (NON-TRANSPORTATION)
Category Proportion of
Total Spend (%) Spending
($M)
Lodging 43.6% $889
Food & Beverage 30.5% $621
Retail 14.3% $292
Recreation 11.6% $237
Total 100.0% $2,039
Source: Econsult Solutions (2017)
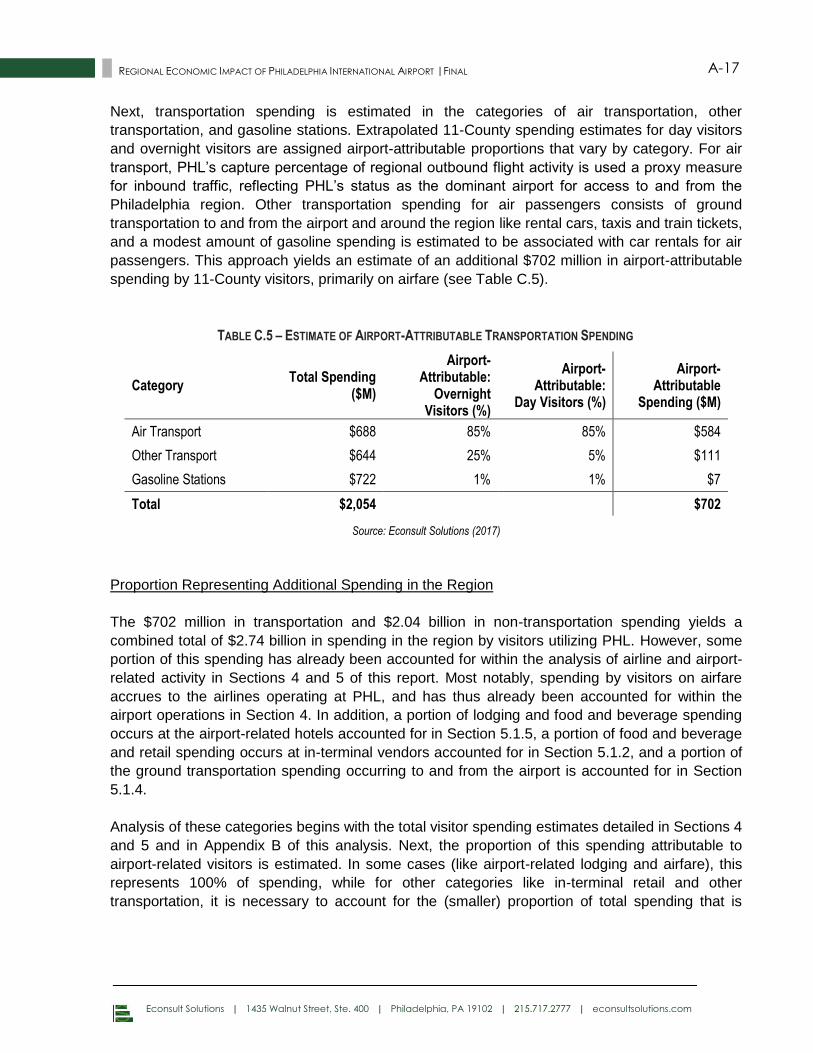
Econsult Solutions | 1435 Walnut Street, Ste. 400 | Philadelphia, PA 19102 | 215.717.2777 | econsultsolutions.com
A-17 REGIONAL ECONOMIC IMPACT OF PHILADELPHIA INTERNATIONAL AIRPORT |FINAL
Next, transportation spending is estimated in the categories of air transportation, other
transportation, and gasoline stations. Extrapolated 11-County spending estimates for day visitors
and overnight visitors are assigned airport-attributable proportions that vary by category. For air
transport, PHL’s capture percentage of regional outbound flight activity is used a proxy measure
for inbound traffic, reflecting PHL’s status as the dominant airport for access to and from the
Philadelphia region. Other transportation spending for air passengers consists of ground
transportation to and from the airport and around the region like rental cars, taxis and train tickets,
and a modest amount of gasoline spending is estimated to be associated with car rentals for air
passengers. This approach yields an estimate of an additional $702 million in airport-attributable
spending by 11-County visitors, primarily on airfare (see Table C.5).
TABLE C.5 – ESTIMATE OF AIRPORT-ATTRIBUTABLE TRANSPORTATION SPENDING
Category Total Spending
($M)
Airport-Attributable:
Overnight Visitors (%)
Airport-Attributable:
Day Visitors (%)
Airport-Attributable
Spending ($M)
Air Transport $688 85% 85% $584
Other Transport $644 25% 5% $111
Gasoline Stations $722 1% 1% $7
Total $2,054 $702
Source: Econsult Solutions (2017)
Proportion Representing Additional Spending in the Region
The $702 million in transportation and $2.04 billion in non-transportation spending yields a
combined total of $2.74 billion in spending in the region by visitors utilizing PHL. However, some
portion of this spending has already been accounted for within the analysis of airline and airport-
related activity in Sections 4 and 5 of this report. Most notably, spending by visitors on airfare
accrues to the airlines operating at PHL, and has thus already been accounted for within the
airport operations in Section 4. In addition, a portion of lodging and food and beverage spending
occurs at the airport-related hotels accounted for in Section 5.1.5, a portion of food and beverage
and retail spending occurs at in-terminal vendors accounted for in Section 5.1.2, and a portion of
the ground transportation spending occurring to and from the airport is accounted for in Section
5.1.4.
Analysis of these categories begins with the total visitor spending estimates detailed in Sections 4
and 5 and in Appendix B of this analysis. Next, the proportion of this spending attributable to
airport-related visitors is estimated. In some cases (like airport-related lodging and airfare), this
represents 100% of spending, while for other categories like in-terminal retail and other
transportation, it is necessary to account for the (smaller) proportion of total spending that is
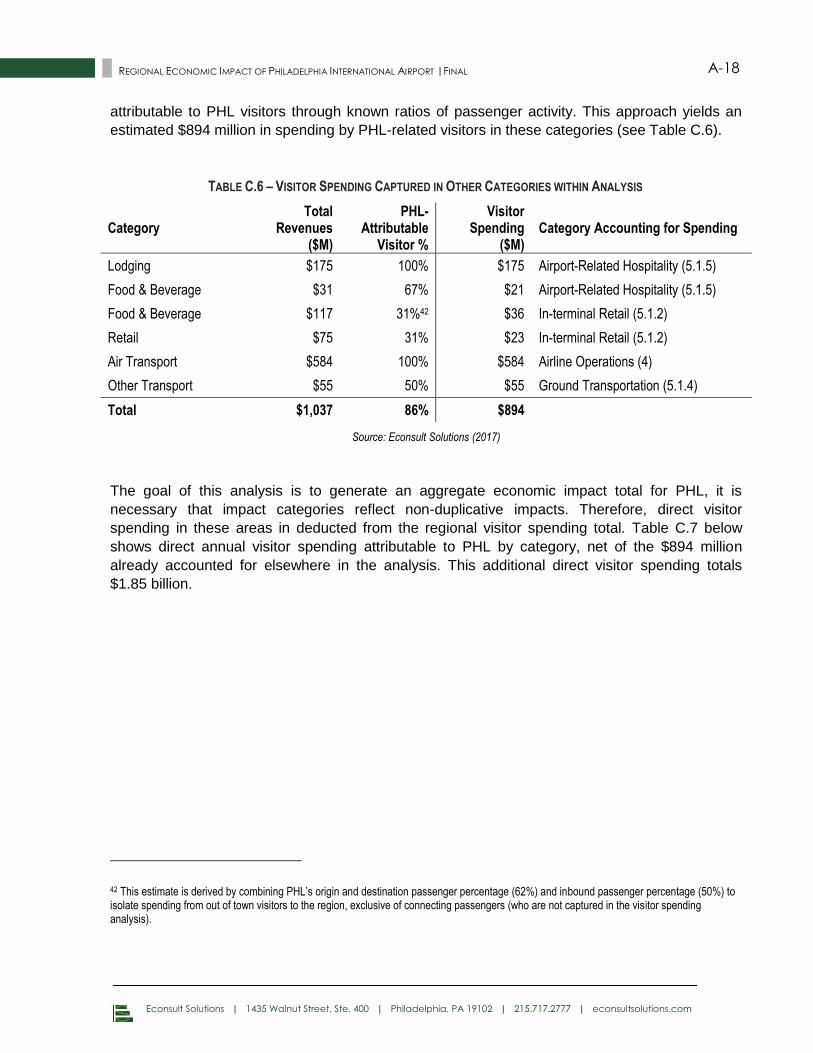
Econsult Solutions | 1435 Walnut Street, Ste. 400 | Philadelphia, PA 19102 | 215.717.2777 | econsultsolutions.com
A-18 REGIONAL ECONOMIC IMPACT OF PHILADELPHIA INTERNATIONAL AIRPORT |FINAL
attributable to PHL visitors through known ratios of passenger activity. This approach yields an
estimated $894 million in spending by PHL-related visitors in these categories (see Table C.6).
TABLE C.6 – VISITOR SPENDING CAPTURED IN OTHER CATEGORIES WITHIN ANALYSIS
Category Total
Revenues ($M)
PHL-Attributable
Visitor %
Visitor Spending
($M) Category Accounting for Spending
Lodging $175 100% $175 Airport-Related Hospitality (5.1.5)
Food & Beverage $31 67% $21 Airport-Related Hospitality (5.1.5)
Food & Beverage $117 31%42 $36 In-terminal Retail (5.1.2)
Retail $75 31% $23 In-terminal Retail (5.1.2)
Air Transport $584 100% $584 Airline Operations (4)
Other Transport $55 50% $55 Ground Transportation (5.1.4)
Total $1,037 86% $894
Source: Econsult Solutions (2017)
The goal of this analysis is to generate an aggregate economic impact total for PHL, it is
necessary that impact categories reflect non-duplicative impacts. Therefore, direct visitor
spending in these areas in deducted from the regional visitor spending total. Table C.7 below
shows direct annual visitor spending attributable to PHL by category, net of the $894 million
already accounted for elsewhere in the analysis. This additional direct visitor spending totals
$1.85 billion.
42 This estimate is derived by combining PHL’s origin and destination passenger percentage (62%) and inbound passenger percentage (50%) to isolate spending from out of town visitors to the region, exclusive of connecting passengers (who are not captured in the visitor spending analysis).
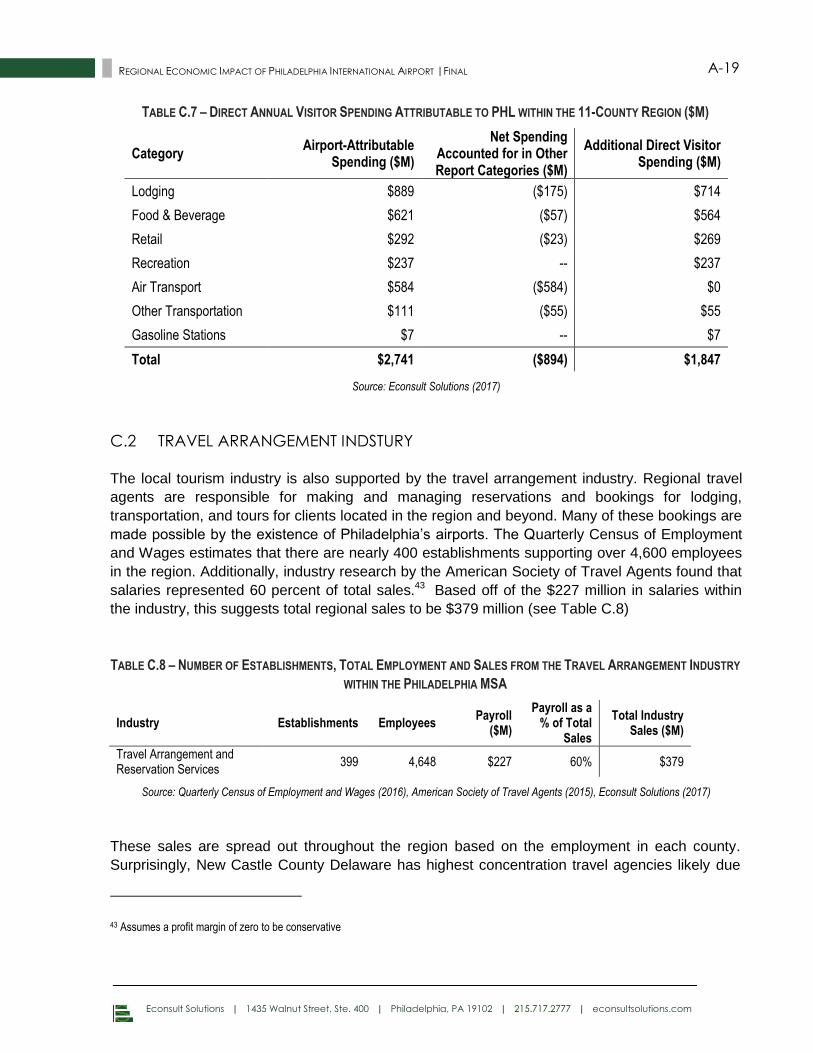
Econsult Solutions | 1435 Walnut Street, Ste. 400 | Philadelphia, PA 19102 | 215.717.2777 | econsultsolutions.com
A-19 REGIONAL ECONOMIC IMPACT OF PHILADELPHIA INTERNATIONAL AIRPORT |FINAL
TABLE C.7 – DIRECT ANNUAL VISITOR SPENDING ATTRIBUTABLE TO PHL WITHIN THE 11-COUNTY REGION ($M)
Category Airport-Attributable
Spending ($M)
Net Spending Accounted for in Other Report Categories ($M)
Additional Direct Visitor Spending ($M)
Lodging $889 ($175) $714
Food & Beverage $621 ($57) $564
Retail $292 ($23) $269
Recreation $237 -- $237
Air Transport $584 ($584) $0
Other Transportation $111 ($55) $55
Gasoline Stations $7 -- $7
Total $2,741 ($894) $1,847
Source: Econsult Solutions (2017)
C.2 TRAVEL ARRANGEMENT INDSTURY
The local tourism industry is also supported by the travel arrangement industry. Regional travel
agents are responsible for making and managing reservations and bookings for lodging,
transportation, and tours for clients located in the region and beyond. Many of these bookings are
made possible by the existence of Philadelphia’s airports. The Quarterly Census of Employment
and Wages estimates that there are nearly 400 establishments supporting over 4,600 employees
in the region. Additionally, industry research by the American Society of Travel Agents found that
salaries represented 60 percent of total sales.43 Based off of the $227 million in salaries within
the industry, this suggests total regional sales to be $379 million (see Table C.8)
TABLE C.8 – NUMBER OF ESTABLISHMENTS, TOTAL EMPLOYMENT AND SALES FROM THE TRAVEL ARRANGEMENT INDUSTRY
WITHIN THE PHILADELPHIA MSA
Industry Establishments Employees Payroll
($M)
Payroll as a % of Total
Sales
Total Industry Sales ($M)
Travel Arrangement and Reservation Services
399 4,648 $227 60% $379
Source: Quarterly Census of Employment and Wages (2016), American Society of Travel Agents (2015), Econsult Solutions (2017)
These sales are spread out throughout the region based on the employment in each county.
Surprisingly, New Castle County Delaware has highest concentration travel agencies likely due
43 Assumes a profit margin of zero to be conservative
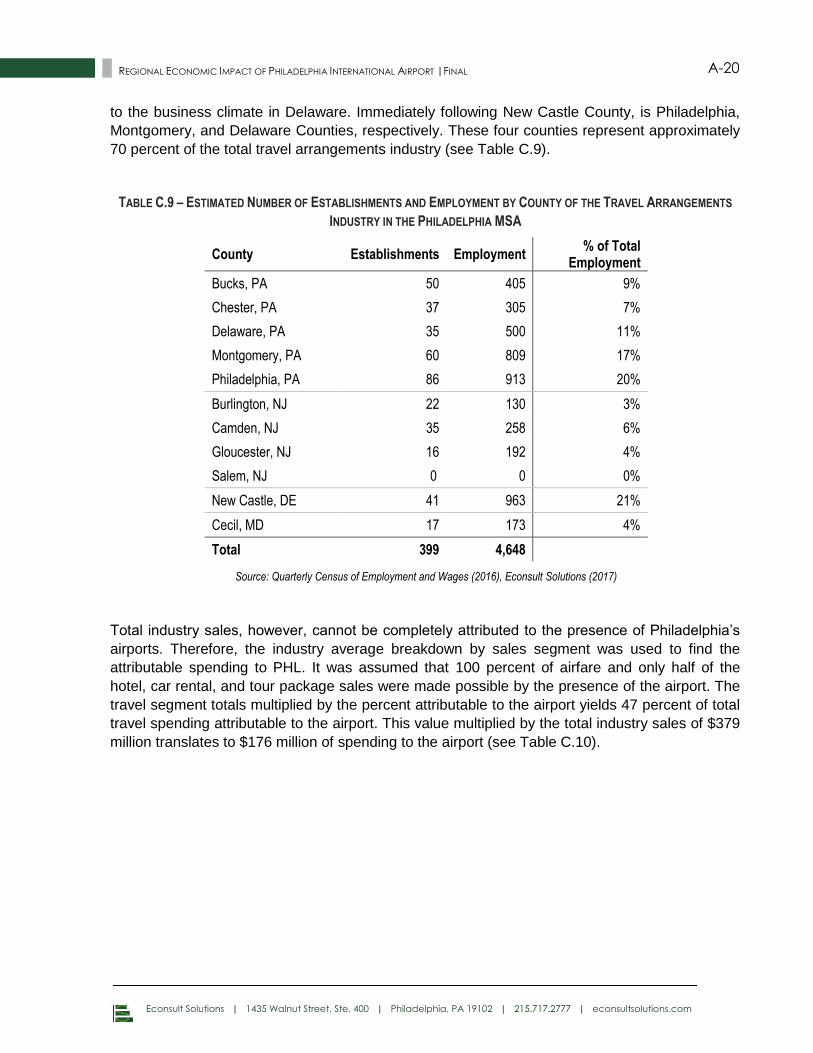
Econsult Solutions | 1435 Walnut Street, Ste. 400 | Philadelphia, PA 19102 | 215.717.2777 | econsultsolutions.com
A-20 REGIONAL ECONOMIC IMPACT OF PHILADELPHIA INTERNATIONAL AIRPORT |FINAL
to the business climate in Delaware. Immediately following New Castle County, is Philadelphia,
Montgomery, and Delaware Counties, respectively. These four counties represent approximately
70 percent of the total travel arrangements industry (see Table C.9).
TABLE C.9 – ESTIMATED NUMBER OF ESTABLISHMENTS AND EMPLOYMENT BY COUNTY OF THE TRAVEL ARRANGEMENTS
INDUSTRY IN THE PHILADELPHIA MSA
County Establishments Employment % of Total
Employment
Bucks, PA 50 405 9%
Chester, PA 37 305 7%
Delaware, PA 35 500 11%
Montgomery, PA 60 809 17%
Philadelphia, PA 86 913 20%
Burlington, NJ 22 130 3%
Camden, NJ 35 258 6%
Gloucester, NJ 16 192 4%
Salem, NJ 0 0 0%
New Castle, DE 41 963 21%
Cecil, MD 17 173 4%
Total 399 4,648
Source: Quarterly Census of Employment and Wages (2016), Econsult Solutions (2017)
Total industry sales, however, cannot be completely attributed to the presence of Philadelphia’s
airports. Therefore, the industry average breakdown by sales segment was used to find the
attributable spending to PHL. It was assumed that 100 percent of airfare and only half of the
hotel, car rental, and tour package sales were made possible by the presence of the airport. The
travel segment totals multiplied by the percent attributable to the airport yields 47 percent of total
travel spending attributable to the airport. This value multiplied by the total industry sales of $379
million translates to $176 million of spending to the airport (see Table C.10).
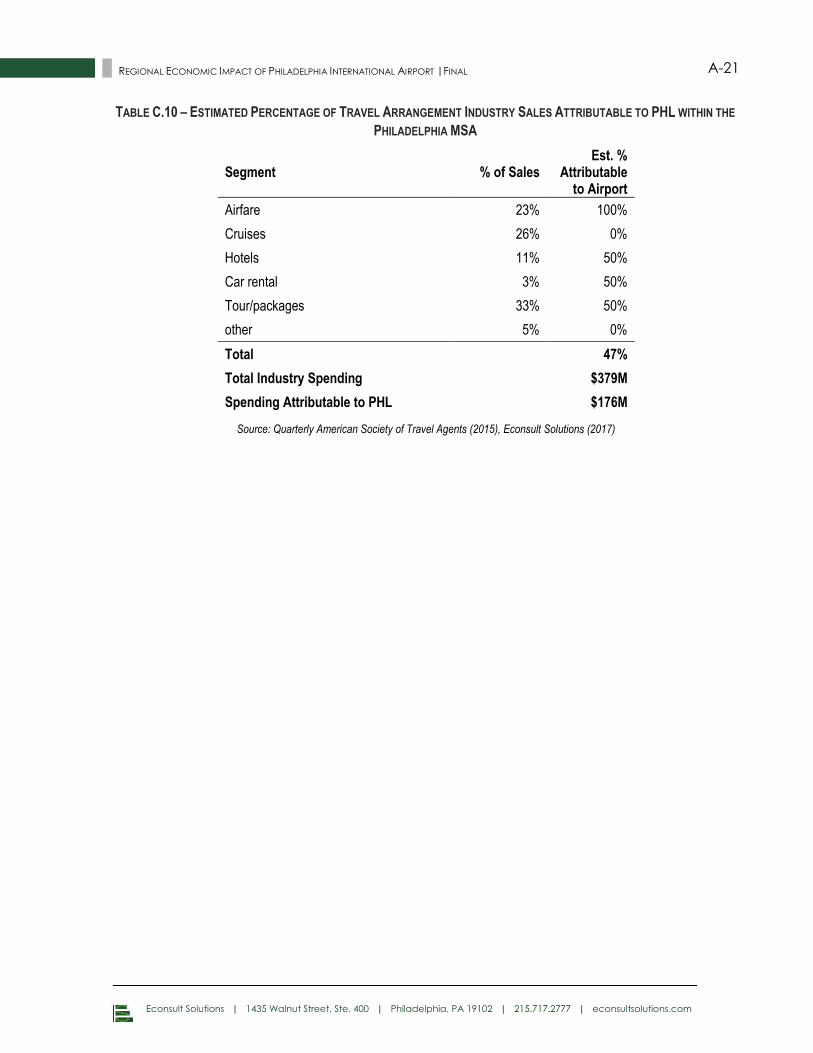
Econsult Solutions | 1435 Walnut Street, Ste. 400 | Philadelphia, PA 19102 | 215.717.2777 | econsultsolutions.com
A-21 REGIONAL ECONOMIC IMPACT OF PHILADELPHIA INTERNATIONAL AIRPORT |FINAL
TABLE C.10 – ESTIMATED PERCENTAGE OF TRAVEL ARRANGEMENT INDUSTRY SALES ATTRIBUTABLE TO PHL WITHIN THE
PHILADELPHIA MSA
Segment % of Sales Est. %
Attributable to Airport
Airfare 23% 100%
Cruises 26% 0%
Hotels 11% 50%
Car rental 3% 50%
Tour/packages 33% 50%
other 5% 0%
Total
47%
Total Industry Spending $379M
Spending Attributable to PHL $176M
Source: Quarterly American Society of Travel Agents (2015), Econsult Solutions (2017)
Econsult Solutions | 1435 Walnut Street, Ste. 400 | Philadelphia, PA 19102 | 215.717.2777 | econsultsolutions.com
A-22 REGIONAL ECONOMIC IMPACT OF PHILADELPHIA INTERNATIONAL AIRPORT |FINAL
APPENDIX D – ADDITIONAL DETAIL ON RESIDENT TRAVEL TIME
AND COST SAVINGS CALCULATION
The time and travel cost savings for regional residents associated with the presence of
Philadelphia International Airport is a function of the relative accessibility and service levels at
PHL and alternative airports from varying locations within the Philadelphia region. Statistically,
these relationships can be estimated through an economic modeling technique known as “gravity
modeling,” which is commonly used in retail sectors to understand the relative attractiveness and
predicted sales of a given location to customers at various distances.
The appendix that follows details the basis, specification and results of this modeling. Section D.1
details the literature review, which yielded empirical research which identifying distance and the
volume of air service as key predictive variables in consumer airport choice. Section D.2
describes in detail the predictive model, which uses observed data on the capture rate of PHL
among passengers originating within the 11-county region to specify the distance and air service
relationships within the model. Section D.3 then presents modeled results with and without PHL
included. The incremental difference between these two models represents the travel time and
cost savings for regional residents due to PHL. These savings are translated into economic terms
within Section 7.2 of this report.
D.1 LITERATURE REVIEW
A significant volume of academic study has been undertaken to answer the question of how
people choose airports. Researchers have built upon each other’s work over time, with several
using the San Francisco Bay Area, which features multiple international airport options, as the
testing ground for modeling consumer behavior and identifying key choice determinants.
Pels, Nijkamp and Rietveld (2001)44 conducted an empirical analysis of the San Francisco Bay
area and calibrated a statistical model for the passenger’s sequential choice of airport and airline.
This study identified access time to the airport and frequency of service as among the most
influential determinants of the choice of airport and airline. It also found that consumers first
choose the departure airport and then the airline, rather than choosing both simultaneously.
Basar and Bhat (2004)45 conducted a study in the San Francisco Bay Area using a probabilistic
choice set multinomial logit model. The two primary determinants of airport choice in their
analysis were access time to the airport and flight frequency. Hess and Polak (2005)46 followed
44 Pels, E. Nijkamp, P. and Rietvald, P. (2001), Airport choice in a multiple airport region: an empirical analysis for the San Francisco Bay Area. Regional Studies, Vol. 35, Issue 1, 2001.
45 Basar, G and Bhat, C (2004), A Parameterized Consideration Set Model for Airport Choice: An Application to the San Francisco Bay Area. Transportation Research, Part B, Vol. 38 No. 10, pp. 889-904.
46 Hess, S. and Polak, J.W. (2005), Mixed logit modeling of airport choice in multi-airport regions. Journal of Air Transportation Management 11 (2) pp. 59-68.
Econsult Solutions | 1435 Walnut Street, Ste. 400 | Philadelphia, PA 19102 | 215.717.2777 | econsultsolutions.com
A-23 REGIONAL ECONOMIC IMPACT OF PHILADELPHIA INTERNATIONAL AIRPORT |FINAL
with an analysis of the greater London area and revealed that access time was a determining
factor in travelers’ choice of departure airport while flight frequency, access cost, and flight time
also were important factors. Finally, Ishii, Jun, and Dender (2009)47 analyzed departures from the
San Francisco Bay Area with arrivals in the Los Angeles area estimating a weighted conditional
logit model of airport–airline choice. This study showed that non-price variables such as airport
access time, airport delay, flight frequency, the availability of particular airport–airline
combinations, and early arrival times were found to strongly affect choice probabilities.
D.2 METHODOLOGY
This analysis employs a gravity modeling approach to determine the travel time and distance
differentials between alternative airport options for regional residents. As described in Section
7.1, PHL captures approximately 85% of domestic passenger volume originating in the Greater
Philadelphia region, among a choice set of five other airports:
Newark Liberty International Airport (EWR) and Baltimore-Washington International
Airport (BWI) are alternative airports which offer a similar passenger and flight volume to
PHL.
o EWR, which serves approximately 37 million passengers a year, is located
approximately 85 miles (or 1.5 hours) northeast of downtown Philadelphia.
o BWI, which serves approximately 24 million passengers a year, is located
approximately 105 miles (or 2 hours) southwest of downtown Philadelphia.
Trenton-Mercer Airport (TNN), Atlantic City International Airport (ACY) and Lehigh Valley
International Airport (ABE) are smaller airports that may be competitive with PHL for
flights to specific domestic destinations where they feature service.
o TNN, which is served by two commercial airlines, is located approximately 35
miles (or 45 minutes) northeast of downtown Philadelphia.
o ACY, which is served by one commercial airline, is located approximately 55 miles
(or 1 hour) southwest of downtown Philadelphia
o ABE, which is served by five commercial airlines, is located approximately 65
miles (or 1 hour and 20 minutes) northwest of downtown Philadelphia.
The model described below is first run for the full choice set, and parameters are calibrated to the
known capture rate for PHL of 85% (meaning that the model is set by design such that it
“predicts” this known value to be the PHL capture rate, with the additional 15% of trips distributed
between the alternative airports based on the distance and air service relationships). The model
is then re-run removing PHL as an option, in order to estimate the distribution of passenger trips
47 Ishii, J, Van Dender, K, and Jun, S (2009) Air Travel Choices in Multi-airport Markets. Journal of Urban Economics, 65(2), 2009.
Econsult Solutions | 1435 Walnut Street, Ste. 400 | Philadelphia, PA 19102 | 215.717.2777 | econsultsolutions.com
A-24 REGIONAL ECONOMIC IMPACT OF PHILADELPHIA INTERNATIONAL AIRPORT |FINAL
by airport in the absence of PHL. The difference in travel time and travel distance between these
two scenarios represents the benefits attributable to PHL.
The model used here is Huff model, a probabilistic retail gravity model that is typically used to
predict consumer behavior among competing retail shopping locations. In general, the probability
(𝑃𝑖𝑗) that a consumer located at i will choose to shop at store j is calculated according to the
following formula:
𝑃𝑖𝑗 = 𝐴𝑗
𝛼 ∗ 𝐷𝑖𝑗−𝛽
∑ 𝐴𝑗𝛼 ∗ 𝐷𝑖𝑗
−𝛽𝑛1
𝑃𝑖𝑗 is the probability of a consumer at point i travelling to retail location j.
𝐴𝑗 is a measure of attractiveness of store j, such as square footage.
𝐷𝑖𝑗 is the distance from i to j
α is an attractiveness parameter estimated from empirical observations
β is the distance decay parameter estimated from empirical observations, reflecting the
sensitivity of the model with respect to distance.
n is the total number of stores including store j.
In this analysis:
𝐴𝑗 is the number of airlines of each airport (as reported on each airport’s website), which
serves as the proxy for flight availability, i.e. “store attractiveness” in this context
Distance variable 𝐷𝑖𝑗 is replaced by the Airport Access Time 𝑇𝑖𝑗 which performs the same
mathematical function. Access time is calculating using the Google Maps API to
determine travel time and travel distance from each the centroid of each Census tract in
the 11-County region to each potential airport
α is set to1
β is set to -2
n is 6, reflecting the six airport options (including PHL) and 5 in the second analysis
(eliminating PHL)
Thus, the probability of a passenger airport located at census tract i will choose the airport j is
calculated as:
𝑃𝑖𝑗 = 𝐴𝑗 ∗ 𝑇𝑖𝑗
−2
∑ 𝐴𝑗 ∗ 𝑇𝑖𝑗−25
1
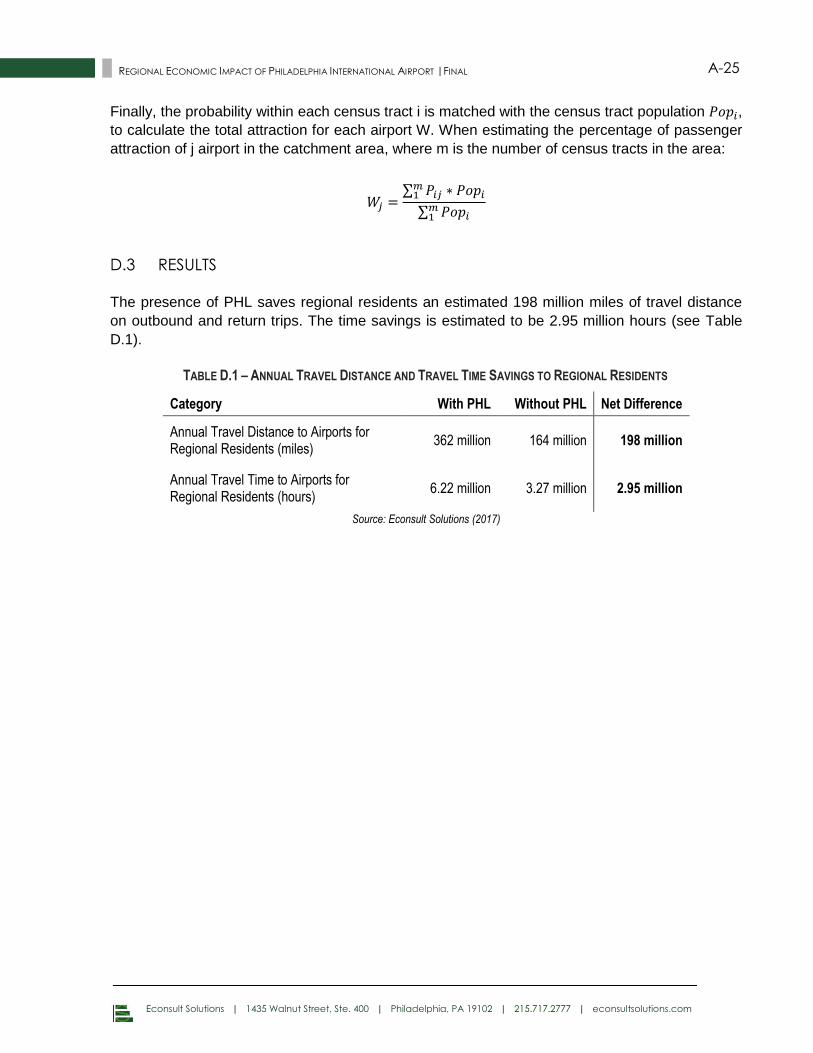
Econsult Solutions | 1435 Walnut Street, Ste. 400 | Philadelphia, PA 19102 | 215.717.2777 | econsultsolutions.com
A-25 REGIONAL ECONOMIC IMPACT OF PHILADELPHIA INTERNATIONAL AIRPORT |FINAL
Finally, the probability within each census tract i is matched with the census tract population 𝑃𝑜𝑝𝑖,
to calculate the total attraction for each airport W. When estimating the percentage of passenger
attraction of j airport in the catchment area, where m is the number of census tracts in the area:
𝑊𝑗 =∑ 𝑃𝑖𝑗 ∗ 𝑃𝑜𝑝𝑖
𝑚1
∑ 𝑃𝑜𝑝𝑖𝑚1
D.3 RESULTS
The presence of PHL saves regional residents an estimated 198 million miles of travel distance
on outbound and return trips. The time savings is estimated to be 2.95 million hours (see Table
D.1).
TABLE D.1 – ANNUAL TRAVEL DISTANCE AND TRAVEL TIME SAVINGS TO REGIONAL RESIDENTS
Category With PHL Without PHL Net Difference
Annual Travel Distance to Airports for Regional Residents (miles)
362 million 164 million 198 million
Annual Travel Time to Airports for Regional Residents (hours)
6.22 million 3.27 million 2.95 million
Source: Econsult Solutions (2017)
Econsult Solutions | 1435 Walnut Street, Ste. 400 | Philadelphia, PA 19102 | 215.717.2777 | econsultsolutions.com
A-26 REGIONAL ECONOMIC IMPACT OF PHILADELPHIA INTERNATIONAL AIRPORT |FINAL
APPENDIX E – ADDITIONAL DETAIL ON MODELING THE
DISTRIBUTION OF ECONOMIC ACTIVITY BY COUNTY
As described in Section 1 and again in Appendix A, ESI used an MSA wide IMPLAN model to
estimate the economic impacts of PHL’s and PNE’s economic impact to the Philadelphia region.
Where activity was occurring directly at either PHL or PNE, ESI utilized a multi-regional approach
to account for the direct activity within Philadelphia and Delaware Counties, and the attendant
spillover activity with both counties, and the remainder of the MSA. These impacts are
aggregated up to the MSA level and do not give a real sense of which counties in the region are
likely to benefit the most from economic activity generated and supported by Philadelphia’s
airports. To get a better estimate of the county-level impact, employment shares were calculated
based on the most recently available (Q2 2016 Quarterly Census of Employment and Wages)
employment by NAICS sector for each county within the MSA.
As part of the output for each IMPLAN model, total employment is broken down by NAICS code.
The employment output by NAICS code is applied to each county’s share of the entire MSA’s
employment in that industry. This methodology assumes that economic impacts are generated
where there is greater economic activity. Further, this method accounts for counties that have
high employment concentrations of particularly industries. Since the county where the direct
activity is taking place is usually know, the direct impacts are apportioned based on what county
they occur in instead of overall employment share. In the case of PHL, the airport straddles two
municipalities in two different counties. Based on terminal location, and location of hangars, office
buildings, warehouses, and roadways, operations at PHL within Philadelphia County and
Delaware County vary by where PHL’s activity (eg. flights, retail sales, parking, etc.) takes place.
Activities distributed across the entire MSA and not one particular county such as visitor spending
and the travel arrangement industry were input into an MSA wide model, and their results (direct,
indirect, and induced) were shared across the entire MSA. See Table E.1 for the MSA wide share
of employment by NAICS industry and county.
Conversely, for activity occurring at or proximate to either of Philadelphia’s airports, the multi-
regional approach required a two stage share down methodology. First, direct activity was
apportioned by physical location of activity, while indirect and induced activity was shared
between the share of employment between Philadelphia and Delaware County. This activity also
generates additional spillover activity to the rest of the region exclusive of either Philadelphia or
Delaware county. Employment within these nine counties is aggregated and the remaining
indirect and induced impacts generated by the multi-regional model are apportioned by the
employment share for this region. The total apportioned economic impact associated with PHL’s
and PNE’s operations is summed to arrive at the unique impact to each county. See Table E.2
and E.3 for the Philadelphia and Delaware County employment share, as well as the remaining
nine county multi-regional model’s employment share by NAICS category and county.
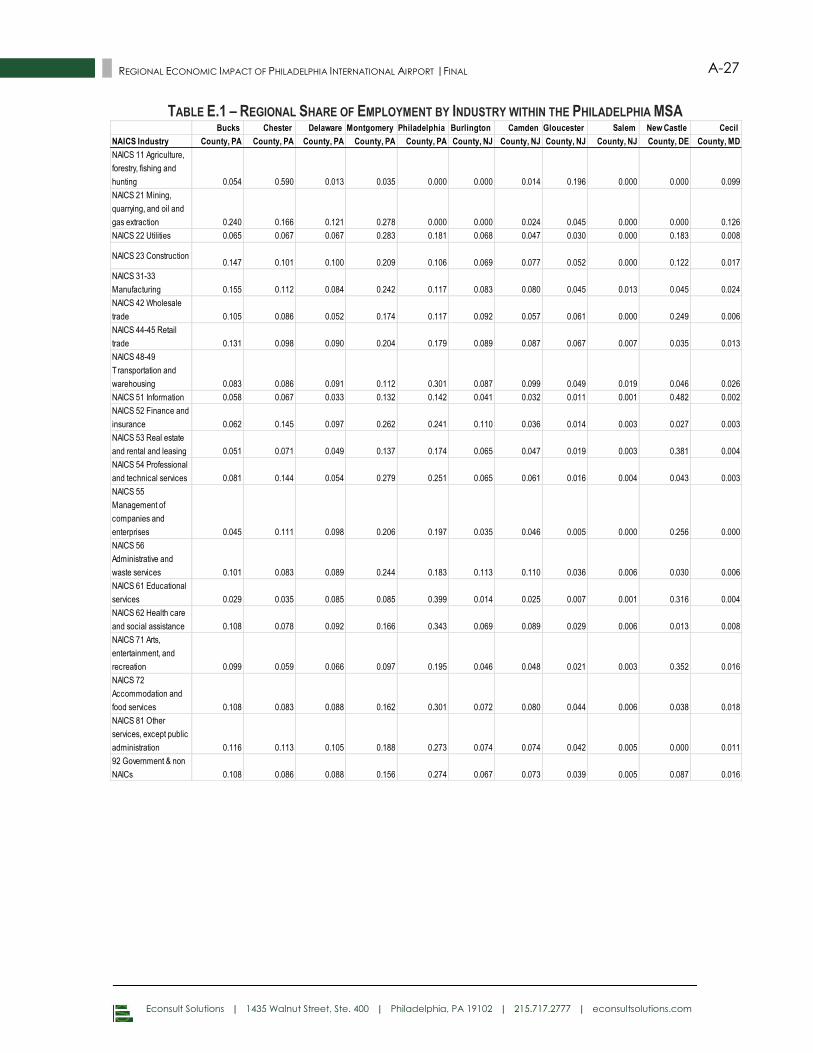
Econsult Solutions | 1435 Walnut Street, Ste. 400 | Philadelphia, PA 19102 | 215.717.2777 | econsultsolutions.com
A-27 REGIONAL ECONOMIC IMPACT OF PHILADELPHIA INTERNATIONAL AIRPORT |FINAL
Bucks Chester Delaware Montgomery Philadelphia Burlington Camden Gloucester Salem New Castle Cecil
NAICS Industry County, PA County, PA County, PA County, PA County, PA County, NJ County, NJ County, NJ County, NJ County, DE County, MD
NAICS 11 Agriculture,
forestry, fishing and
hunting 0.054 0.590 0.013 0.035 0.000 0.000 0.014 0.196 0.000 0.000 0.099
NAICS 21 Mining,
quarrying, and oil and
gas extraction 0.240 0.166 0.121 0.278 0.000 0.000 0.024 0.045 0.000 0.000 0.126
NAICS 22 Utilities 0.065 0.067 0.067 0.283 0.181 0.068 0.047 0.030 0.000 0.183 0.008
NAICS 23 Construction0.147 0.101 0.100 0.209 0.106 0.069 0.077 0.052 0.000 0.122 0.017
NAICS 31-33
Manufacturing 0.155 0.112 0.084 0.242 0.117 0.083 0.080 0.045 0.013 0.045 0.024
NAICS 42 Wholesale
trade 0.105 0.086 0.052 0.174 0.117 0.092 0.057 0.061 0.000 0.249 0.006
NAICS 44-45 Retail
trade 0.131 0.098 0.090 0.204 0.179 0.089 0.087 0.067 0.007 0.035 0.013
NAICS 48-49
Transportation and
warehousing 0.083 0.086 0.091 0.112 0.301 0.087 0.099 0.049 0.019 0.046 0.026
NAICS 51 Information 0.058 0.067 0.033 0.132 0.142 0.041 0.032 0.011 0.001 0.482 0.002
NAICS 52 Finance and
insurance 0.062 0.145 0.097 0.262 0.241 0.110 0.036 0.014 0.003 0.027 0.003
NAICS 53 Real estate
and rental and leasing 0.051 0.071 0.049 0.137 0.174 0.065 0.047 0.019 0.003 0.381 0.004
NAICS 54 Professional
and technical services 0.081 0.144 0.054 0.279 0.251 0.065 0.061 0.016 0.004 0.043 0.003
NAICS 55
Management of
companies and
enterprises 0.045 0.111 0.098 0.206 0.197 0.035 0.046 0.005 0.000 0.256 0.000
NAICS 56
Administrative and
waste services 0.101 0.083 0.089 0.244 0.183 0.113 0.110 0.036 0.006 0.030 0.006
NAICS 61 Educational
services 0.029 0.035 0.085 0.085 0.399 0.014 0.025 0.007 0.001 0.316 0.004
NAICS 62 Health care
and social assistance 0.108 0.078 0.092 0.166 0.343 0.069 0.089 0.029 0.006 0.013 0.008
NAICS 71 Arts,
entertainment, and
recreation 0.099 0.059 0.066 0.097 0.195 0.046 0.048 0.021 0.003 0.352 0.016
NAICS 72
Accommodation and
food services 0.108 0.083 0.088 0.162 0.301 0.072 0.080 0.044 0.006 0.038 0.018
NAICS 81 Other
services, except public
administration 0.116 0.113 0.105 0.188 0.273 0.074 0.074 0.042 0.005 0.000 0.011
92 Government & non
NAICs 0.108 0.086 0.088 0.156 0.274 0.067 0.073 0.039 0.005 0.087 0.016
TABLE E.1 – REGIONAL SHARE OF EMPLOYMENT BY INDUSTRY WITHIN THE PHILADELPHIA MSA
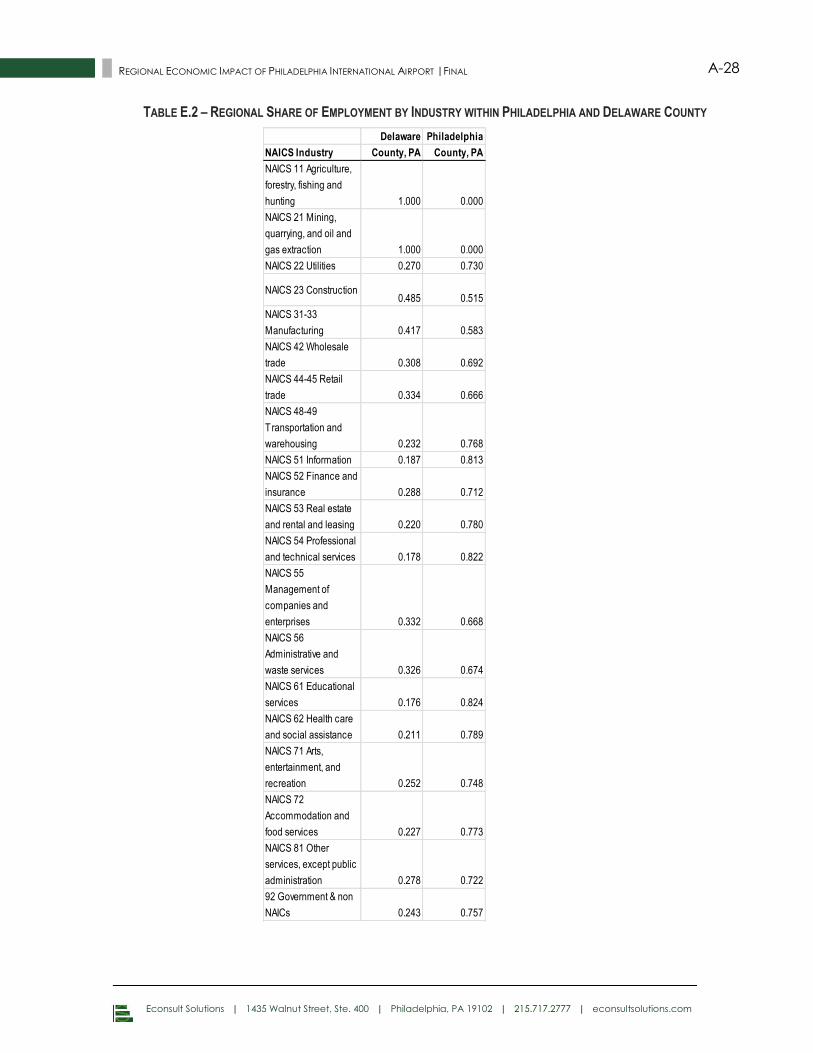
Econsult Solutions | 1435 Walnut Street, Ste. 400 | Philadelphia, PA 19102 | 215.717.2777 | econsultsolutions.com
A-28 REGIONAL ECONOMIC IMPACT OF PHILADELPHIA INTERNATIONAL AIRPORT |FINAL
Delaware Philadelphia
NAICS Industry County, PA County, PA
NAICS 11 Agriculture,
forestry, fishing and
hunting 1.000 0.000
NAICS 21 Mining,
quarrying, and oil and
gas extraction 1.000 0.000
NAICS 22 Utilities 0.270 0.730
NAICS 23 Construction0.485 0.515
NAICS 31-33
Manufacturing 0.417 0.583
NAICS 42 Wholesale
trade 0.308 0.692
NAICS 44-45 Retail
trade 0.334 0.666
NAICS 48-49
Transportation and
warehousing 0.232 0.768
NAICS 51 Information 0.187 0.813
NAICS 52 Finance and
insurance 0.288 0.712
NAICS 53 Real estate
and rental and leasing 0.220 0.780
NAICS 54 Professional
and technical services 0.178 0.822
NAICS 55
Management of
companies and
enterprises 0.332 0.668
NAICS 56
Administrative and
waste services 0.326 0.674
NAICS 61 Educational
services 0.176 0.824
NAICS 62 Health care
and social assistance 0.211 0.789
NAICS 71 Arts,
entertainment, and
recreation 0.252 0.748
NAICS 72
Accommodation and
food services 0.227 0.773
NAICS 81 Other
services, except public
administration 0.278 0.722
92 Government & non
NAICs 0.243 0.757
TABLE E.2 – REGIONAL SHARE OF EMPLOYMENT BY INDUSTRY WITHIN PHILADELPHIA AND DELAWARE COUNTY
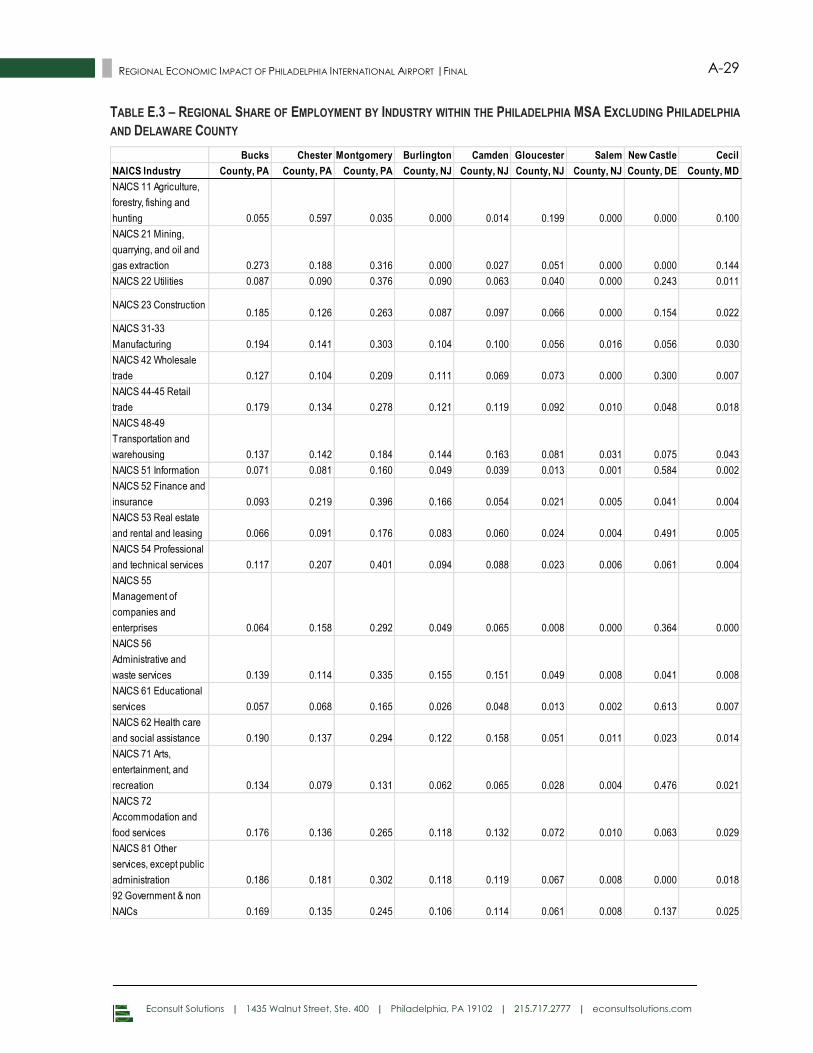
Econsult Solutions | 1435 Walnut Street, Ste. 400 | Philadelphia, PA 19102 | 215.717.2777 | econsultsolutions.com
A-29 REGIONAL ECONOMIC IMPACT OF PHILADELPHIA INTERNATIONAL AIRPORT |FINAL
TABLE E.3 – REGIONAL SHARE OF EMPLOYMENT BY INDUSTRY WITHIN THE PHILADELPHIA MSA EXCLUDING PHILADELPHIA
AND DELAWARE COUNTY
Bucks Chester Montgomery Burlington Camden Gloucester Salem New Castle Cecil
NAICS Industry County, PA County, PA County, PA County, NJ County, NJ County, NJ County, NJ County, DE County, MD
NAICS 11 Agriculture,
forestry, fishing and
hunting 0.055 0.597 0.035 0.000 0.014 0.199 0.000 0.000 0.100
NAICS 21 Mining,
quarrying, and oil and
gas extraction 0.273 0.188 0.316 0.000 0.027 0.051 0.000 0.000 0.144
NAICS 22 Utilities 0.087 0.090 0.376 0.090 0.063 0.040 0.000 0.243 0.011
NAICS 23 Construction0.185 0.126 0.263 0.087 0.097 0.066 0.000 0.154 0.022
NAICS 31-33
Manufacturing 0.194 0.141 0.303 0.104 0.100 0.056 0.016 0.056 0.030
NAICS 42 Wholesale
trade 0.127 0.104 0.209 0.111 0.069 0.073 0.000 0.300 0.007
NAICS 44-45 Retail
trade 0.179 0.134 0.278 0.121 0.119 0.092 0.010 0.048 0.018
NAICS 48-49
Transportation and
warehousing 0.137 0.142 0.184 0.144 0.163 0.081 0.031 0.075 0.043
NAICS 51 Information 0.071 0.081 0.160 0.049 0.039 0.013 0.001 0.584 0.002
NAICS 52 Finance and
insurance 0.093 0.219 0.396 0.166 0.054 0.021 0.005 0.041 0.004
NAICS 53 Real estate
and rental and leasing 0.066 0.091 0.176 0.083 0.060 0.024 0.004 0.491 0.005
NAICS 54 Professional
and technical services 0.117 0.207 0.401 0.094 0.088 0.023 0.006 0.061 0.004
NAICS 55
Management of
companies and
enterprises 0.064 0.158 0.292 0.049 0.065 0.008 0.000 0.364 0.000
NAICS 56
Administrative and
waste services 0.139 0.114 0.335 0.155 0.151 0.049 0.008 0.041 0.008
NAICS 61 Educational
services 0.057 0.068 0.165 0.026 0.048 0.013 0.002 0.613 0.007
NAICS 62 Health care
and social assistance 0.190 0.137 0.294 0.122 0.158 0.051 0.011 0.023 0.014
NAICS 71 Arts,
entertainment, and
recreation 0.134 0.079 0.131 0.062 0.065 0.028 0.004 0.476 0.021
NAICS 72
Accommodation and
food services 0.176 0.136 0.265 0.118 0.132 0.072 0.010 0.063 0.029
NAICS 81 Other
services, except public
administration 0.186 0.181 0.302 0.118 0.119 0.067 0.008 0.000 0.018
92 Government & non
NAICs 0.169 0.135 0.245 0.106 0.114 0.061 0.008 0.137 0.025
Econsult Solutions | 1435 Walnut Street, Ste. 400 | Philadelphia, PA 19102 | 215.717.2777 | econsultsolutions.com
A-30 REGIONAL ECONOMIC IMPACT OF PHILADELPHIA INTERNATIONAL AIRPORT |FINAL
APPENDIX F – ECONOMIC IMPACT RESULTS BY COUNTY AND
STATE
The following pages outline PHL’s impact in each of the 11 counties in the Philadelphia MSA.
These summaries are designed as standalone documents that can be used to illustrate how the
airport benefits the residents and businesses of counties and states impacted by PHL’s presence.
For further detail on how the economic impacts are shared down to the county level, see
Appendix E.
One-page summaries have been prepared for each of the counties and states in the Philadelphia
MSA:
The five counties in Pennsylvania (Bucks, Chester, Delaware, Montgomery, and
Philadelphia),
The Commonwealth of Pennsylvania
The four counties in New Jersey (Burlington, Camden, Gloucester, and Salem)
The State of New Jersey
New Castle County and the state of Delaware
Cecil County and the state of Maryland
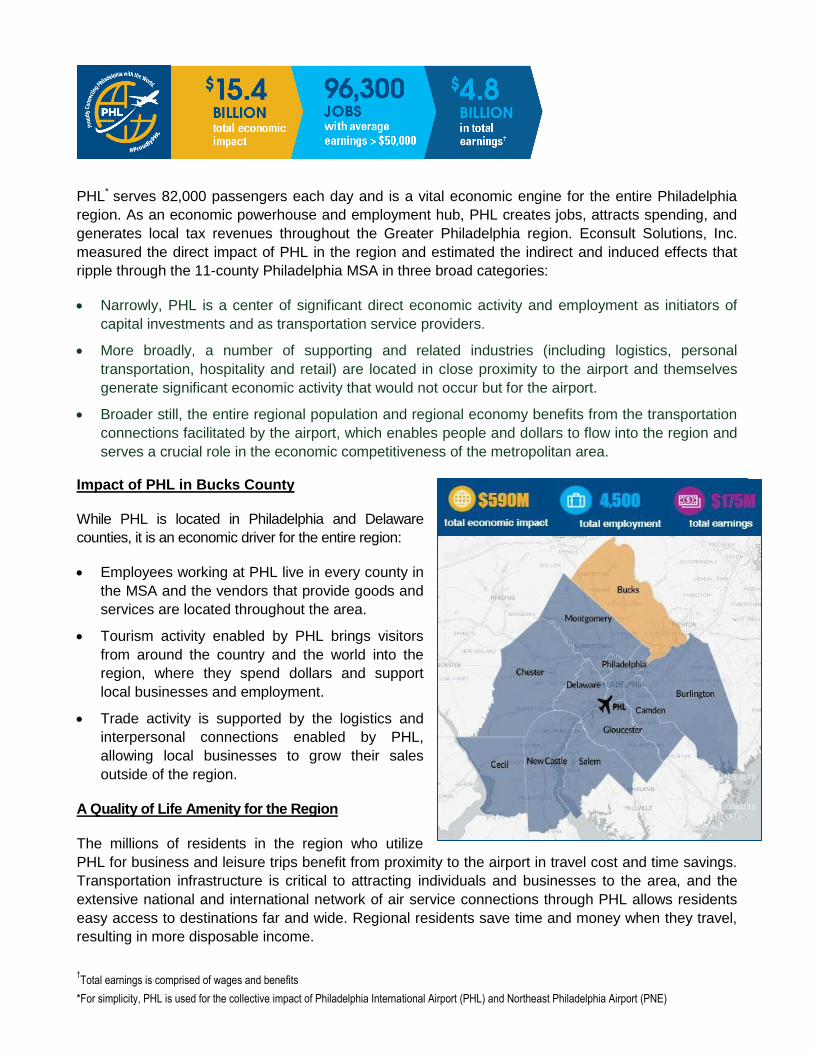
†Total earnings is comprised of wages and benefits
*For simplicity, PHL is used for the collective impact of Philadelphia International Airport (PHL) and Northeast Philadelphia Airport (PNE)
PHL* serves 82,000 passengers each day and is a vital economic engine for the entire Philadelphia
region. As an economic powerhouse and employment hub, PHL creates jobs, attracts spending, and
generates local tax revenues throughout the Greater Philadelphia region. Econsult Solutions, Inc.
measured the direct impact of PHL in the region and estimated the indirect and induced effects that
ripple through the 11-county Philadelphia MSA in three broad categories:
Narrowly, PHL is a center of significant direct economic activity and employment as initiators of
capital investments and as transportation service providers.
More broadly, a number of supporting and related industries (including logistics, personal
transportation, hospitality and retail) are located in close proximity to the airport and themselves
generate significant economic activity that would not occur but for the airport.
Broader still, the entire regional population and regional economy benefits from the transportation
connections facilitated by the airport, which enables people and dollars to flow into the region and
serves a crucial role in the economic competitiveness of the metropolitan area.
Impact of PHL in Bucks County
While PHL is located in Philadelphia and Delaware
counties, it is an economic driver for the entire region:
Employees working at PHL live in every county in
the MSA and the vendors that provide goods and
services are located throughout the area.
Tourism activity enabled by PHL brings visitors
from around the country and the world into the
region, where they spend dollars and support
local businesses and employment.
Trade activity is supported by the logistics and
interpersonal connections enabled by PHL,
allowing local businesses to grow their sales
outside of the region.
A Quality of Life Amenity for the Region
The millions of residents in the region who utilize
PHL for business and leisure trips benefit from proximity to the airport in travel cost and time savings.
Transportation infrastructure is critical to attracting individuals and businesses to the area, and the
extensive national and international network of air service connections through PHL allows residents
easy access to destinations far and wide. Regional residents save time and money when they travel,
resulting in more disposable income.
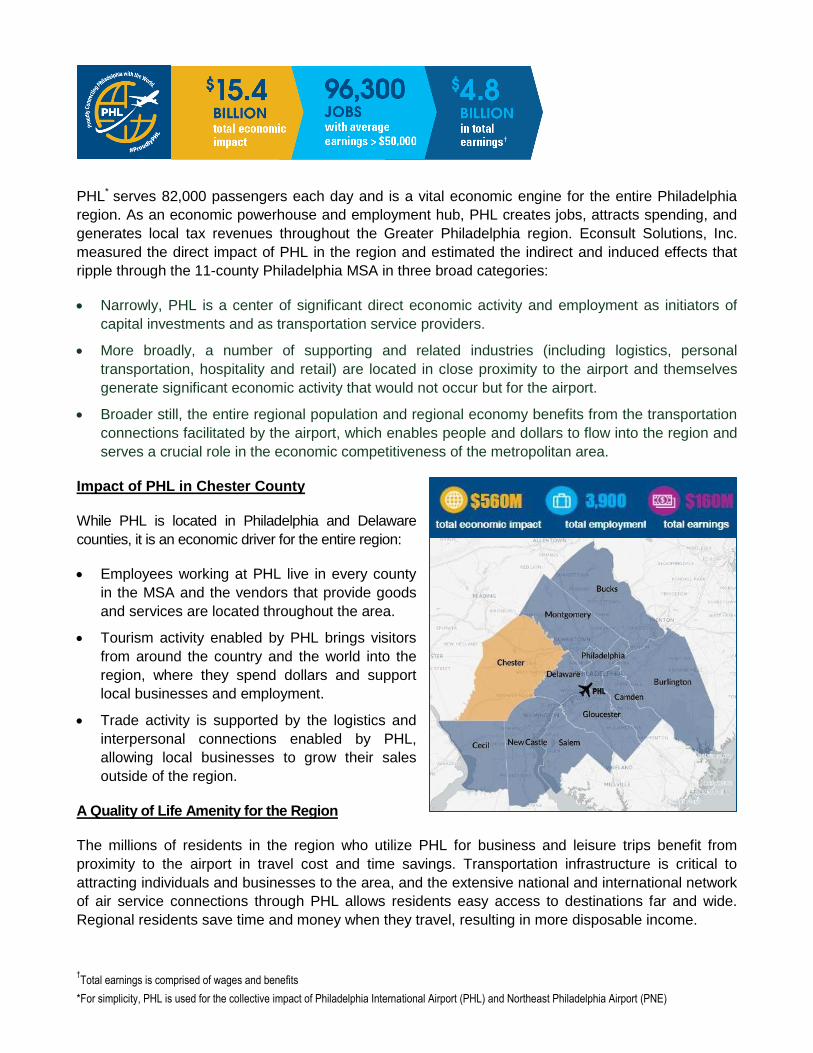
†Total earnings is comprised of wages and benefits
*For simplicity, PHL is used for the collective impact of Philadelphia International Airport (PHL) and Northeast Philadelphia Airport (PNE)
PHL* serves 82,000 passengers each day and is a vital economic engine for the entire Philadelphia
region. As an economic powerhouse and employment hub, PHL creates jobs, attracts spending, and
generates local tax revenues throughout the Greater Philadelphia region. Econsult Solutions, Inc.
measured the direct impact of PHL in the region and estimated the indirect and induced effects that
ripple through the 11-county Philadelphia MSA in three broad categories:
Narrowly, PHL is a center of significant direct economic activity and employment as initiators of
capital investments and as transportation service providers.
More broadly, a number of supporting and related industries (including logistics, personal
transportation, hospitality and retail) are located in close proximity to the airport and themselves
generate significant economic activity that would not occur but for the airport.
Broader still, the entire regional population and regional economy benefits from the transportation
connections facilitated by the airport, which enables people and dollars to flow into the region and
serves a crucial role in the economic competitiveness of the metropolitan area.
Impact of PHL in Chester County
While PHL is located in Philadelphia and Delaware
counties, it is an economic driver for the entire region:
Employees working at PHL live in every county
in the MSA and the vendors that provide goods
and services are located throughout the area.
Tourism activity enabled by PHL brings visitors
from around the country and the world into the
region, where they spend dollars and support
local businesses and employment.
Trade activity is supported by the logistics and
interpersonal connections enabled by PHL,
allowing local businesses to grow their sales
outside of the region.
A Quality of Life Amenity for the Region
The millions of residents in the region who utilize PHL for business and leisure trips benefit from
proximity to the airport in travel cost and time savings. Transportation infrastructure is critical to
attracting individuals and businesses to the area, and the extensive national and international network
of air service connections through PHL allows residents easy access to destinations far and wide.
Regional residents save time and money when they travel, resulting in more disposable income.

†Total earnings is comprised of wages and benefits
*For simplicity, PHL is used for the collective impact of Philadelphia International Airport (PHL) and Northeast Philadelphia Airport (PNE)
PHL* serves 82,000 passengers each day and is a vital economic engine for the entire Philadelphia
region. As an economic powerhouse and employment hub, PHL creates jobs, attracts spending, and
generates local tax revenues throughout the Greater Philadelphia region. Econsult Solutions, Inc.
measured the direct impact of PHL in the region and estimated the indirect and induced effects that
ripple through the 11-county Philadelphia MSA in three broad categories:
Narrowly, PHL is a center of significant direct economic activity and employment as initiators of
capital investments and as transportation service providers.
More broadly, a number of supporting and related industries (including logistics, personal
transportation, hospitality and retail) are located in close proximity to the airport and themselves
generate significant economic activity that would not occur but for the airport.
Broader still, the entire regional population and regional economy benefits from the transportation
connections facilitated by the airport, which enables people and dollars to flow into the region and
serves a crucial role in the economic competitiveness of the metropolitan area.
Impact of PHL in Delaware County
PHL is located in Philadelphia and Delaware counties,
and is an economic driver for the county and the region:
Employees working at PHL live in every county
in the MSA and the vendors that provide goods
and services are located throughout the area.
Tourism activity enabled by PHL brings visitors
from around the country and the world into the
region, where they spend dollars and support
local businesses and employment.
Trade activity is supported by the logistics and
interpersonal connections enabled by PHL,
allowing local businesses to grow their sales
outside of the region.
A Quality of Life Amenity for the Region
The millions of residents in the region who utilize PHL for business and leisure trips benefit from
proximity to the airport in travel cost and time savings. Transportation infrastructure is critical to
attracting individuals and businesses to the area, and the extensive national and international network
of air service connections through PHL allows residents easy access to destinations far and wide.
Regional residents save time and money when they travel, resulting in more disposable income.
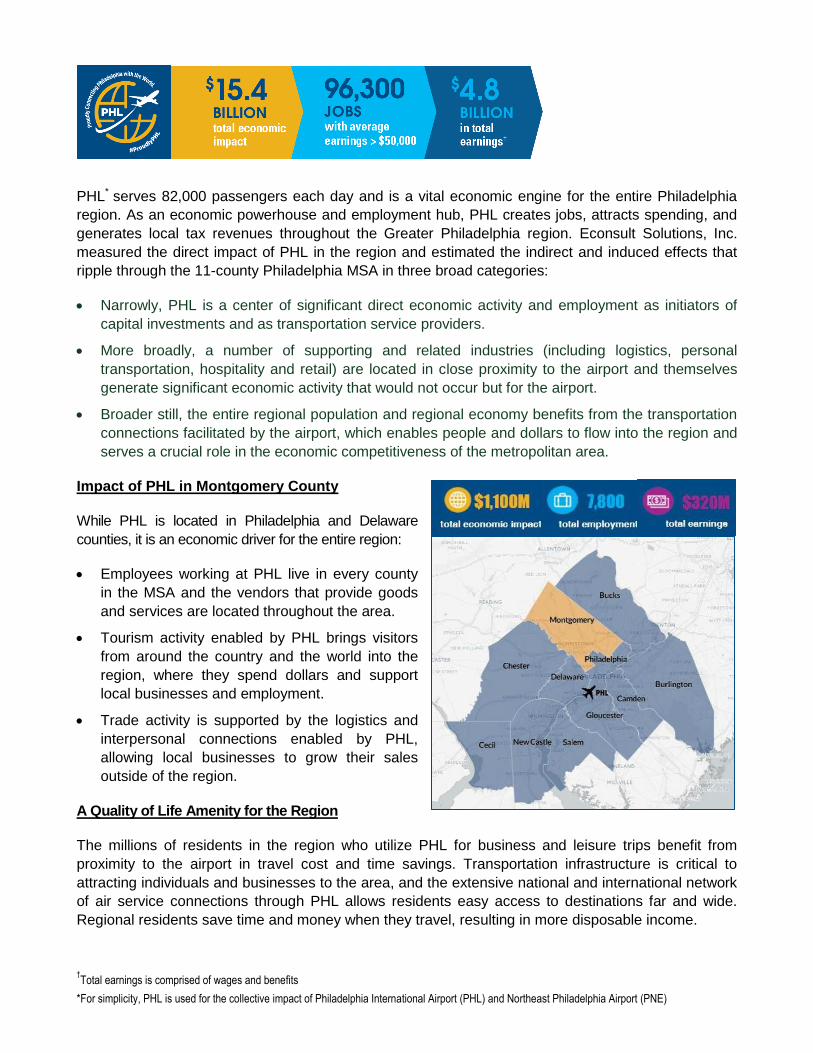
†Total earnings is comprised of wages and benefits
*For simplicity, PHL is used for the collective impact of Philadelphia International Airport (PHL) and Northeast Philadelphia Airport (PNE)
PHL* serves 82,000 passengers each day and is a vital economic engine for the entire Philadelphia
region. As an economic powerhouse and employment hub, PHL creates jobs, attracts spending, and
generates local tax revenues throughout the Greater Philadelphia region. Econsult Solutions, Inc.
measured the direct impact of PHL in the region and estimated the indirect and induced effects that
ripple through the 11-county Philadelphia MSA in three broad categories:
Narrowly, PHL is a center of significant direct economic activity and employment as initiators of
capital investments and as transportation service providers.
More broadly, a number of supporting and related industries (including logistics, personal
transportation, hospitality and retail) are located in close proximity to the airport and themselves
generate significant economic activity that would not occur but for the airport.
Broader still, the entire regional population and regional economy benefits from the transportation
connections facilitated by the airport, which enables people and dollars to flow into the region and
serves a crucial role in the economic competitiveness of the metropolitan area.
Impact of PHL in Montgomery County
While PHL is located in Philadelphia and Delaware
counties, it is an economic driver for the entire region:
Employees working at PHL live in every county
in the MSA and the vendors that provide goods
and services are located throughout the area.
Tourism activity enabled by PHL brings visitors
from around the country and the world into the
region, where they spend dollars and support
local businesses and employment.
Trade activity is supported by the logistics and
interpersonal connections enabled by PHL,
allowing local businesses to grow their sales
outside of the region.
A Quality of Life Amenity for the Region
The millions of residents in the region who utilize PHL for business and leisure trips benefit from
proximity to the airport in travel cost and time savings. Transportation infrastructure is critical to
attracting individuals and businesses to the area, and the extensive national and international network
of air service connections through PHL allows residents easy access to destinations far and wide.
Regional residents save time and money when they travel, resulting in more disposable income.
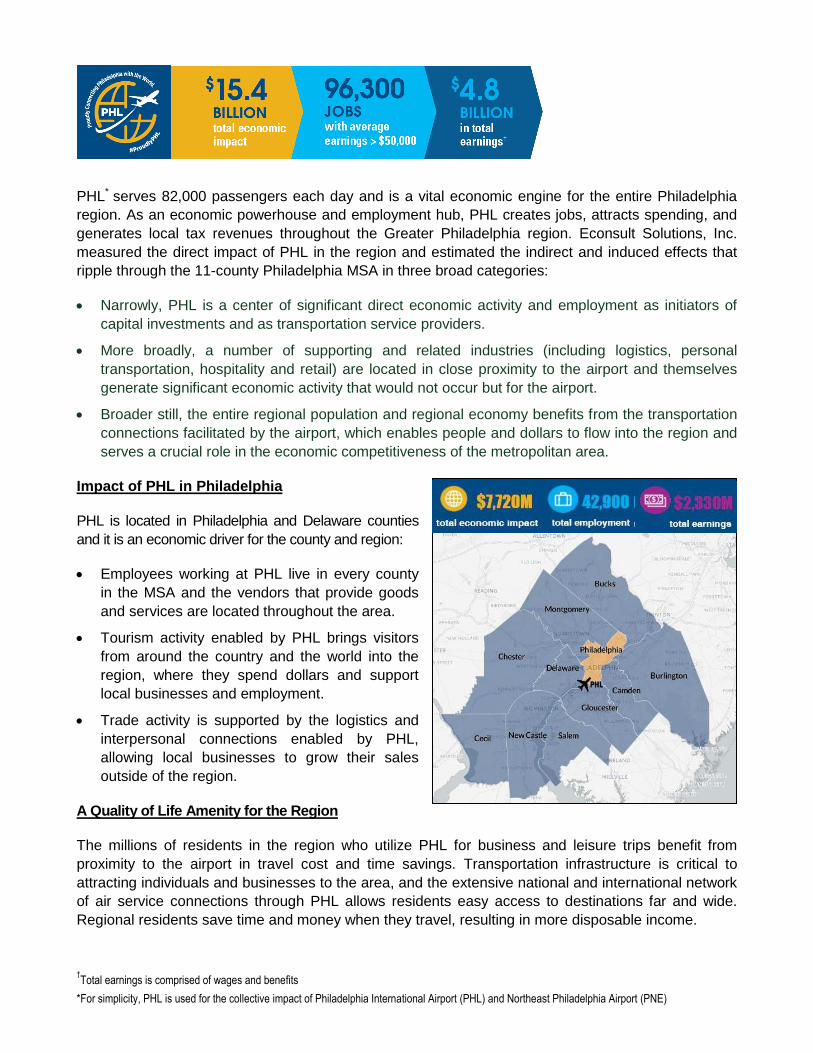
†Total earnings is comprised of wages and benefits
*For simplicity, PHL is used for the collective impact of Philadelphia International Airport (PHL) and Northeast Philadelphia Airport (PNE)
PHL* serves 82,000 passengers each day and is a vital economic engine for the entire Philadelphia
region. As an economic powerhouse and employment hub, PHL creates jobs, attracts spending, and
generates local tax revenues throughout the Greater Philadelphia region. Econsult Solutions, Inc.
measured the direct impact of PHL in the region and estimated the indirect and induced effects that
ripple through the 11-county Philadelphia MSA in three broad categories:
Narrowly, PHL is a center of significant direct economic activity and employment as initiators of
capital investments and as transportation service providers.
More broadly, a number of supporting and related industries (including logistics, personal
transportation, hospitality and retail) are located in close proximity to the airport and themselves
generate significant economic activity that would not occur but for the airport.
Broader still, the entire regional population and regional economy benefits from the transportation
connections facilitated by the airport, which enables people and dollars to flow into the region and
serves a crucial role in the economic competitiveness of the metropolitan area.
Impact of PHL in Philadelphia
PHL is located in Philadelphia and Delaware counties
and it is an economic driver for the county and region:
Employees working at PHL live in every county
in the MSA and the vendors that provide goods
and services are located throughout the area.
Tourism activity enabled by PHL brings visitors
from around the country and the world into the
region, where they spend dollars and support
local businesses and employment.
Trade activity is supported by the logistics and
interpersonal connections enabled by PHL,
allowing local businesses to grow their sales
outside of the region.
A Quality of Life Amenity for the Region
The millions of residents in the region who utilize PHL for business and leisure trips benefit from
proximity to the airport in travel cost and time savings. Transportation infrastructure is critical to
attracting individuals and businesses to the area, and the extensive national and international network
of air service connections through PHL allows residents easy access to destinations far and wide.
Regional residents save time and money when they travel, resulting in more disposable income.
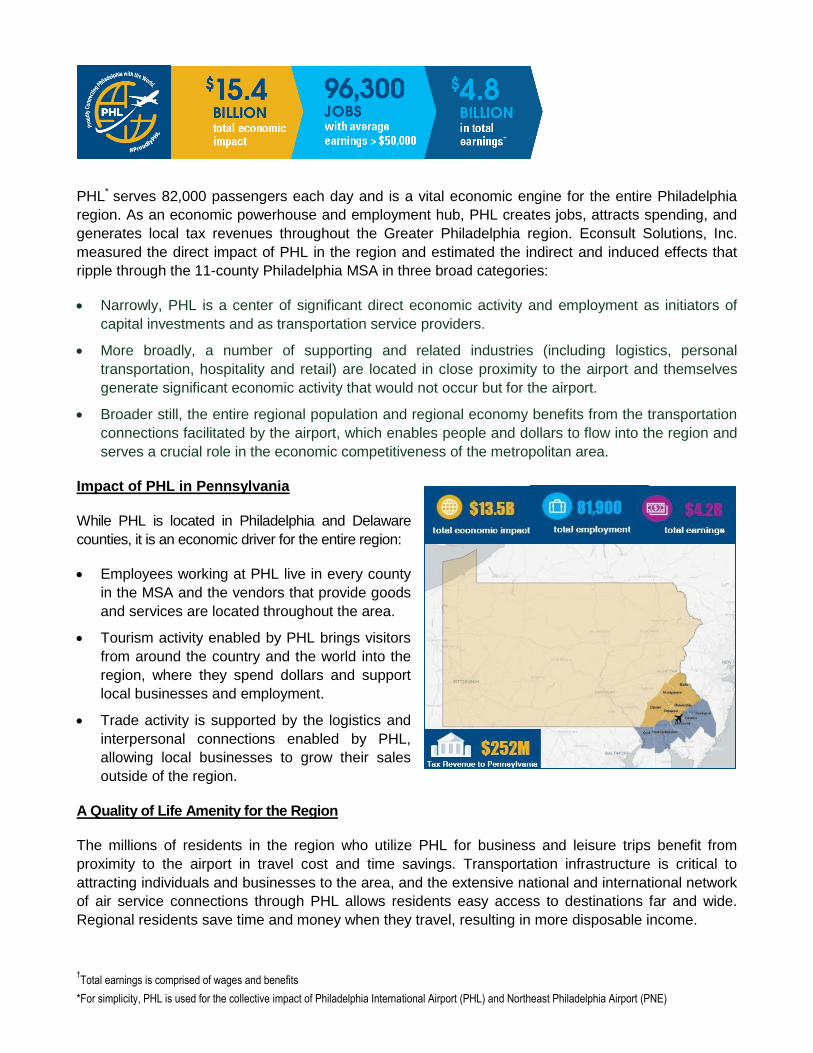
†Total earnings is comprised of wages and benefits
*For simplicity, PHL is used for the collective impact of Philadelphia International Airport (PHL) and Northeast Philadelphia Airport (PNE)
PHL* serves 82,000 passengers each day and is a vital economic engine for the entire Philadelphia
region. As an economic powerhouse and employment hub, PHL creates jobs, attracts spending, and
generates local tax revenues throughout the Greater Philadelphia region. Econsult Solutions, Inc.
measured the direct impact of PHL in the region and estimated the indirect and induced effects that
ripple through the 11-county Philadelphia MSA in three broad categories:
Narrowly, PHL is a center of significant direct economic activity and employment as initiators of
capital investments and as transportation service providers.
More broadly, a number of supporting and related industries (including logistics, personal
transportation, hospitality and retail) are located in close proximity to the airport and themselves
generate significant economic activity that would not occur but for the airport.
Broader still, the entire regional population and regional economy benefits from the transportation
connections facilitated by the airport, which enables people and dollars to flow into the region and
serves a crucial role in the economic competitiveness of the metropolitan area.
Impact of PHL in Pennsylvania
While PHL is located in Philadelphia and Delaware
counties, it is an economic driver for the entire region:
Employees working at PHL live in every county
in the MSA and the vendors that provide goods
and services are located throughout the area.
Tourism activity enabled by PHL brings visitors
from around the country and the world into the
region, where they spend dollars and support
local businesses and employment.
Trade activity is supported by the logistics and
interpersonal connections enabled by PHL,
allowing local businesses to grow their sales
outside of the region.
A Quality of Life Amenity for the Region
The millions of residents in the region who utilize PHL for business and leisure trips benefit from
proximity to the airport in travel cost and time savings. Transportation infrastructure is critical to
attracting individuals and businesses to the area, and the extensive national and international network
of air service connections through PHL allows residents easy access to destinations far and wide.
Regional residents save time and money when they travel, resulting in more disposable income.
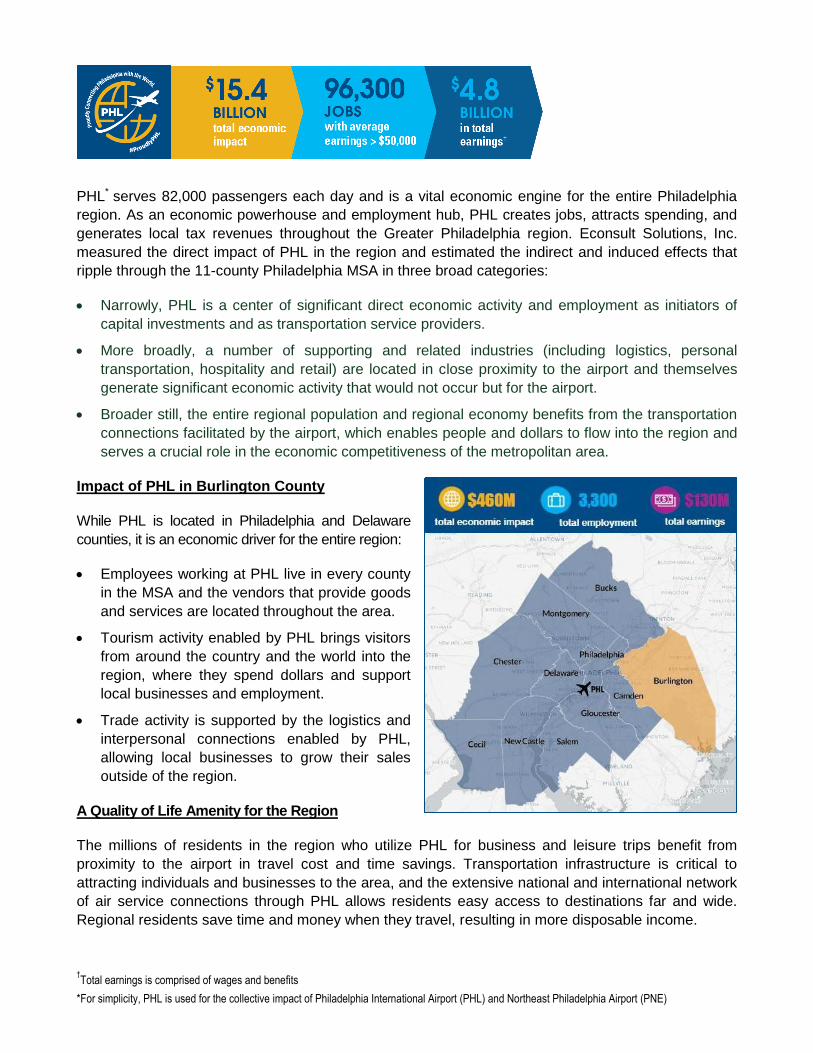
†Total earnings is comprised of wages and benefits
*For simplicity, PHL is used for the collective impact of Philadelphia International Airport (PHL) and Northeast Philadelphia Airport (PNE)
PHL* serves 82,000 passengers each day and is a vital economic engine for the entire Philadelphia
region. As an economic powerhouse and employment hub, PHL creates jobs, attracts spending, and
generates local tax revenues throughout the Greater Philadelphia region. Econsult Solutions, Inc.
measured the direct impact of PHL in the region and estimated the indirect and induced effects that
ripple through the 11-county Philadelphia MSA in three broad categories:
Narrowly, PHL is a center of significant direct economic activity and employment as initiators of
capital investments and as transportation service providers.
More broadly, a number of supporting and related industries (including logistics, personal
transportation, hospitality and retail) are located in close proximity to the airport and themselves
generate significant economic activity that would not occur but for the airport.
Broader still, the entire regional population and regional economy benefits from the transportation
connections facilitated by the airport, which enables people and dollars to flow into the region and
serves a crucial role in the economic competitiveness of the metropolitan area.
Impact of PHL in Burlington County
While PHL is located in Philadelphia and Delaware
counties, it is an economic driver for the entire region:
Employees working at PHL live in every county
in the MSA and the vendors that provide goods
and services are located throughout the area.
Tourism activity enabled by PHL brings visitors
from around the country and the world into the
region, where they spend dollars and support
local businesses and employment.
Trade activity is supported by the logistics and
interpersonal connections enabled by PHL,
allowing local businesses to grow their sales
outside of the region.
A Quality of Life Amenity for the Region
The millions of residents in the region who utilize PHL for business and leisure trips benefit from
proximity to the airport in travel cost and time savings. Transportation infrastructure is critical to
attracting individuals and businesses to the area, and the extensive national and international network
of air service connections through PHL allows residents easy access to destinations far and wide.
Regional residents save time and money when they travel, resulting in more disposable income.
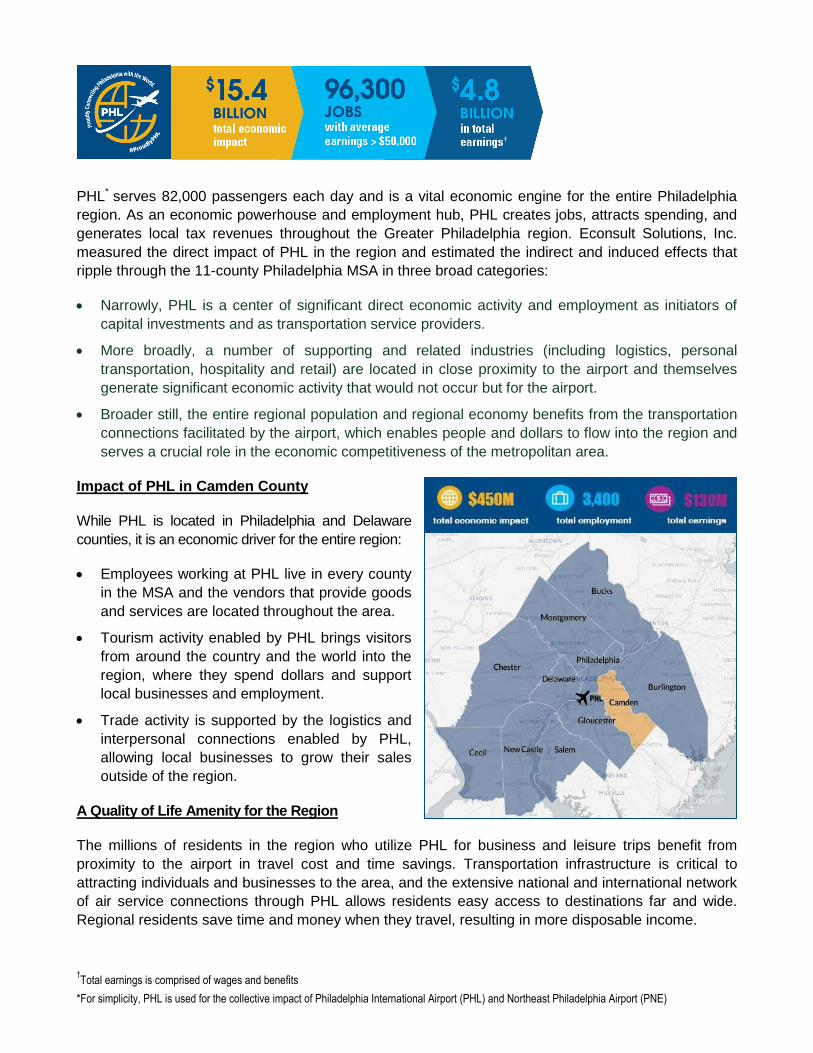
†Total earnings is comprised of wages and benefits
*For simplicity, PHL is used for the collective impact of Philadelphia International Airport (PHL) and Northeast Philadelphia Airport (PNE)
PHL* serves 82,000 passengers each day and is a vital economic engine for the entire Philadelphia
region. As an economic powerhouse and employment hub, PHL creates jobs, attracts spending, and
generates local tax revenues throughout the Greater Philadelphia region. Econsult Solutions, Inc.
measured the direct impact of PHL in the region and estimated the indirect and induced effects that
ripple through the 11-county Philadelphia MSA in three broad categories:
Narrowly, PHL is a center of significant direct economic activity and employment as initiators of
capital investments and as transportation service providers.
More broadly, a number of supporting and related industries (including logistics, personal
transportation, hospitality and retail) are located in close proximity to the airport and themselves
generate significant economic activity that would not occur but for the airport.
Broader still, the entire regional population and regional economy benefits from the transportation
connections facilitated by the airport, which enables people and dollars to flow into the region and
serves a crucial role in the economic competitiveness of the metropolitan area.
Impact of PHL in Camden County
While PHL is located in Philadelphia and Delaware
counties, it is an economic driver for the entire region:
Employees working at PHL live in every county
in the MSA and the vendors that provide goods
and services are located throughout the area.
Tourism activity enabled by PHL brings visitors
from around the country and the world into the
region, where they spend dollars and support
local businesses and employment.
Trade activity is supported by the logistics and
interpersonal connections enabled by PHL,
allowing local businesses to grow their sales
outside of the region.
A Quality of Life Amenity for the Region
The millions of residents in the region who utilize PHL for business and leisure trips benefit from
proximity to the airport in travel cost and time savings. Transportation infrastructure is critical to
attracting individuals and businesses to the area, and the extensive national and international network
of air service connections through PHL allows residents easy access to destinations far and wide.
Regional residents save time and money when they travel, resulting in more disposable income.
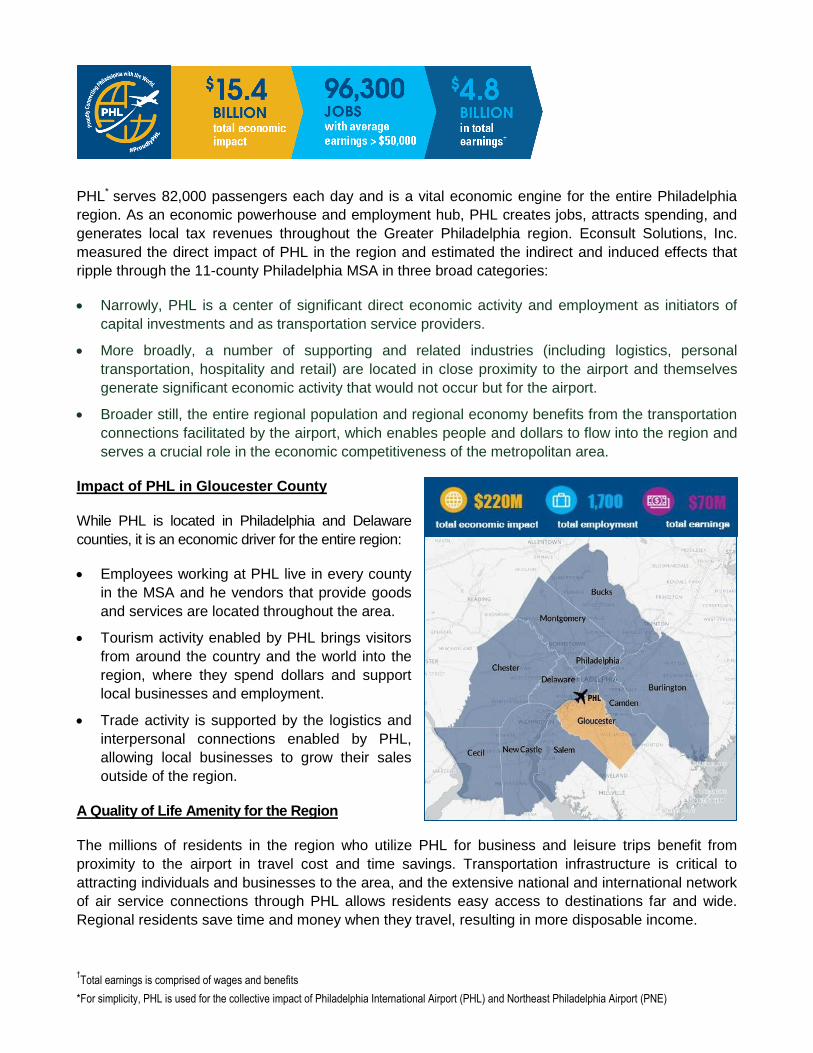
†Total earnings is comprised of wages and benefits
*For simplicity, PHL is used for the collective impact of Philadelphia International Airport (PHL) and Northeast Philadelphia Airport (PNE)
PHL* serves 82,000 passengers each day and is a vital economic engine for the entire Philadelphia
region. As an economic powerhouse and employment hub, PHL creates jobs, attracts spending, and
generates local tax revenues throughout the Greater Philadelphia region. Econsult Solutions, Inc.
measured the direct impact of PHL in the region and estimated the indirect and induced effects that
ripple through the 11-county Philadelphia MSA in three broad categories:
Narrowly, PHL is a center of significant direct economic activity and employment as initiators of
capital investments and as transportation service providers.
More broadly, a number of supporting and related industries (including logistics, personal
transportation, hospitality and retail) are located in close proximity to the airport and themselves
generate significant economic activity that would not occur but for the airport.
Broader still, the entire regional population and regional economy benefits from the transportation
connections facilitated by the airport, which enables people and dollars to flow into the region and
serves a crucial role in the economic competitiveness of the metropolitan area.
Impact of PHL in Gloucester County
While PHL is located in Philadelphia and Delaware
counties, it is an economic driver for the entire region:
Employees working at PHL live in every county
in the MSA and he vendors that provide goods
and services are located throughout the area.
Tourism activity enabled by PHL brings visitors
from around the country and the world into the
region, where they spend dollars and support
local businesses and employment.
Trade activity is supported by the logistics and
interpersonal connections enabled by PHL,
allowing local businesses to grow their sales
outside of the region.
A Quality of Life Amenity for the Region
The millions of residents in the region who utilize PHL for business and leisure trips benefit from
proximity to the airport in travel cost and time savings. Transportation infrastructure is critical to
attracting individuals and businesses to the area, and the extensive national and international network
of air service connections through PHL allows residents easy access to destinations far and wide.
Regional residents save time and money when they travel, resulting in more disposable income.
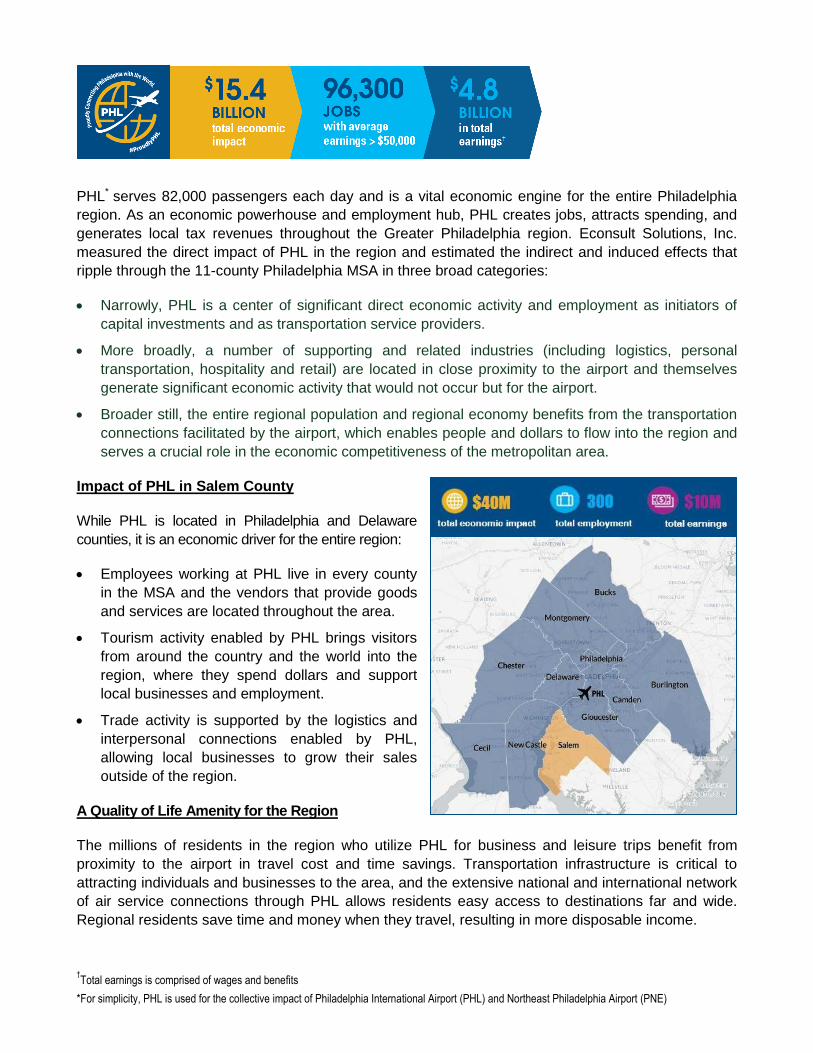
†Total earnings is comprised of wages and benefits
*For simplicity, PHL is used for the collective impact of Philadelphia International Airport (PHL) and Northeast Philadelphia Airport (PNE)
PHL* serves 82,000 passengers each day and is a vital economic engine for the entire Philadelphia
region. As an economic powerhouse and employment hub, PHL creates jobs, attracts spending, and
generates local tax revenues throughout the Greater Philadelphia region. Econsult Solutions, Inc.
measured the direct impact of PHL in the region and estimated the indirect and induced effects that
ripple through the 11-county Philadelphia MSA in three broad categories:
Narrowly, PHL is a center of significant direct economic activity and employment as initiators of
capital investments and as transportation service providers.
More broadly, a number of supporting and related industries (including logistics, personal
transportation, hospitality and retail) are located in close proximity to the airport and themselves
generate significant economic activity that would not occur but for the airport.
Broader still, the entire regional population and regional economy benefits from the transportation
connections facilitated by the airport, which enables people and dollars to flow into the region and
serves a crucial role in the economic competitiveness of the metropolitan area.
Impact of PHL in Salem County
While PHL is located in Philadelphia and Delaware
counties, it is an economic driver for the entire region:
Employees working at PHL live in every county
in the MSA and the vendors that provide goods
and services are located throughout the area.
Tourism activity enabled by PHL brings visitors
from around the country and the world into the
region, where they spend dollars and support
local businesses and employment.
Trade activity is supported by the logistics and
interpersonal connections enabled by PHL,
allowing local businesses to grow their sales
outside of the region.
A Quality of Life Amenity for the Region
The millions of residents in the region who utilize PHL for business and leisure trips benefit from
proximity to the airport in travel cost and time savings. Transportation infrastructure is critical to
attracting individuals and businesses to the area, and the extensive national and international network
of air service connections through PHL allows residents easy access to destinations far and wide.
Regional residents save time and money when they travel, resulting in more disposable income.
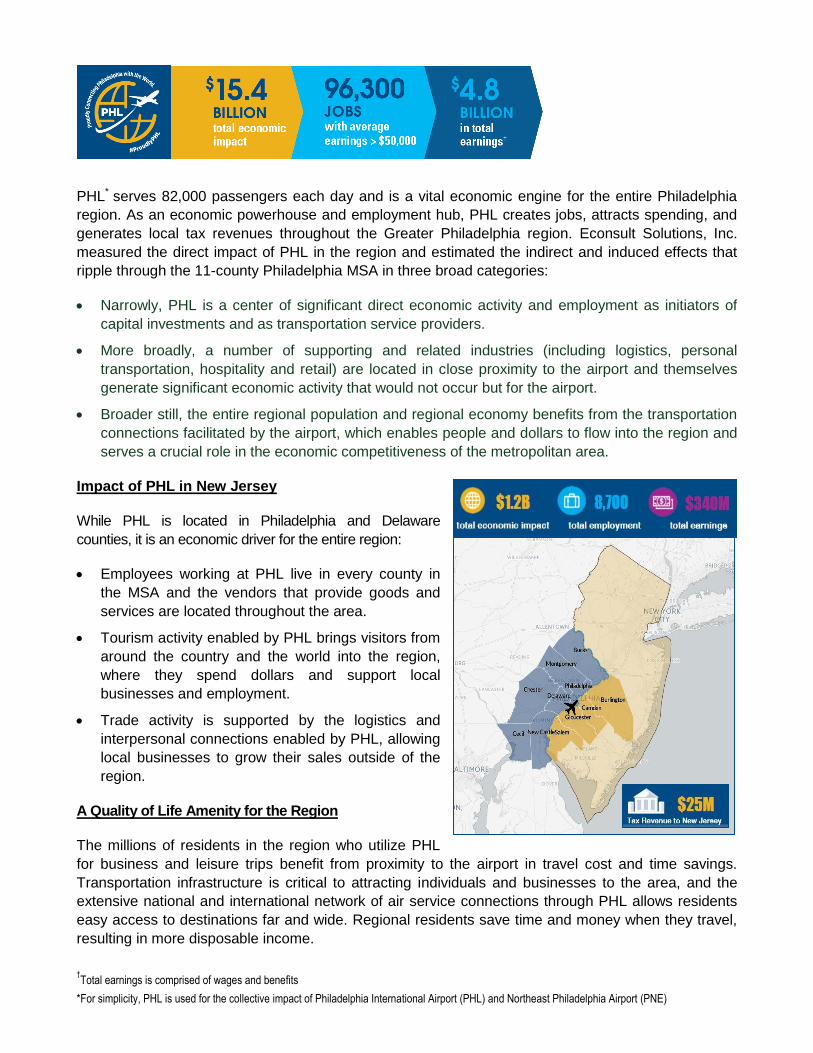
†Total earnings is comprised of wages and benefits
*For simplicity, PHL is used for the collective impact of Philadelphia International Airport (PHL) and Northeast Philadelphia Airport (PNE)
PHL* serves 82,000 passengers each day and is a vital economic engine for the entire Philadelphia
region. As an economic powerhouse and employment hub, PHL creates jobs, attracts spending, and
generates local tax revenues throughout the Greater Philadelphia region. Econsult Solutions, Inc.
measured the direct impact of PHL in the region and estimated the indirect and induced effects that
ripple through the 11-county Philadelphia MSA in three broad categories:
Narrowly, PHL is a center of significant direct economic activity and employment as initiators of
capital investments and as transportation service providers.
More broadly, a number of supporting and related industries (including logistics, personal
transportation, hospitality and retail) are located in close proximity to the airport and themselves
generate significant economic activity that would not occur but for the airport.
Broader still, the entire regional population and regional economy benefits from the transportation
connections facilitated by the airport, which enables people and dollars to flow into the region and
serves a crucial role in the economic competitiveness of the metropolitan area.
Impact of PHL in New Jersey
While PHL is located in Philadelphia and Delaware
counties, it is an economic driver for the entire region:
Employees working at PHL live in every county in
the MSA and the vendors that provide goods and
services are located throughout the area.
Tourism activity enabled by PHL brings visitors from
around the country and the world into the region,
where they spend dollars and support local
businesses and employment.
Trade activity is supported by the logistics and
interpersonal connections enabled by PHL, allowing
local businesses to grow their sales outside of the
region.
A Quality of Life Amenity for the Region
The millions of residents in the region who utilize PHL
for business and leisure trips benefit from proximity to the airport in travel cost and time savings.
Transportation infrastructure is critical to attracting individuals and businesses to the area, and the
extensive national and international network of air service connections through PHL allows residents
easy access to destinations far and wide. Regional residents save time and money when they travel,
resulting in more disposable income.
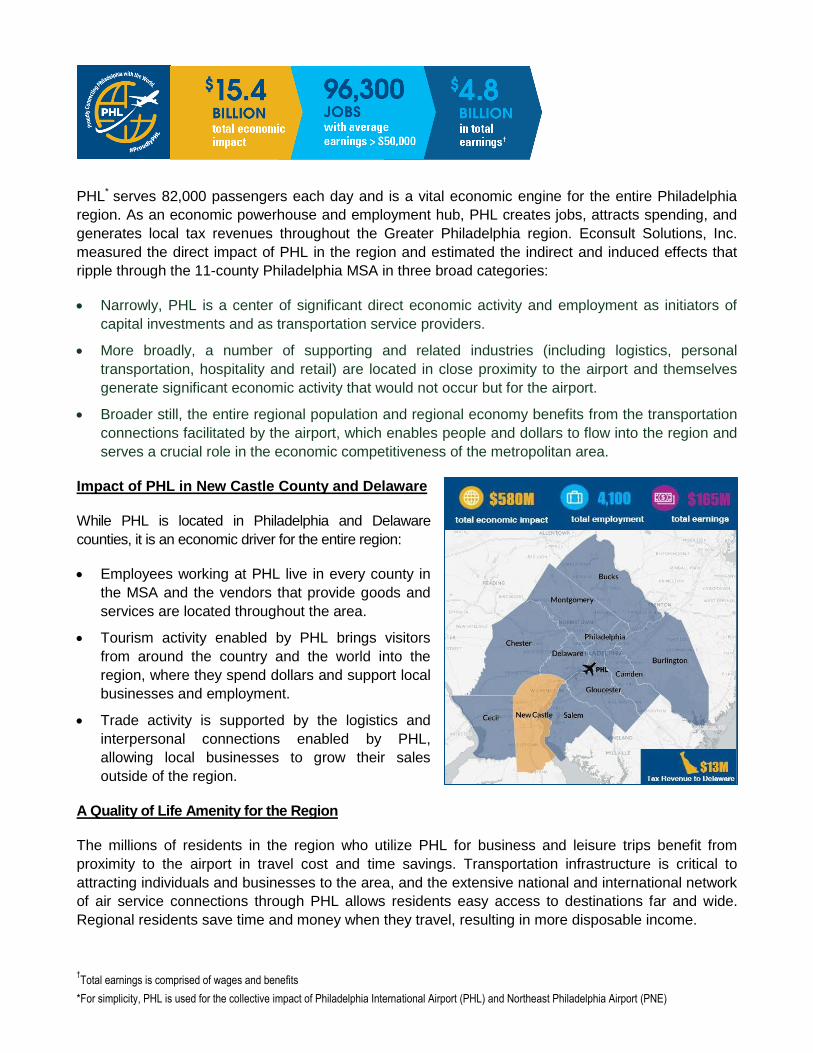
†Total earnings is comprised of wages and benefits
*For simplicity, PHL is used for the collective impact of Philadelphia International Airport (PHL) and Northeast Philadelphia Airport (PNE)
PHL* serves 82,000 passengers each day and is a vital economic engine for the entire Philadelphia
region. As an economic powerhouse and employment hub, PHL creates jobs, attracts spending, and
generates local tax revenues throughout the Greater Philadelphia region. Econsult Solutions, Inc.
measured the direct impact of PHL in the region and estimated the indirect and induced effects that
ripple through the 11-county Philadelphia MSA in three broad categories:
Narrowly, PHL is a center of significant direct economic activity and employment as initiators of
capital investments and as transportation service providers.
More broadly, a number of supporting and related industries (including logistics, personal
transportation, hospitality and retail) are located in close proximity to the airport and themselves
generate significant economic activity that would not occur but for the airport.
Broader still, the entire regional population and regional economy benefits from the transportation
connections facilitated by the airport, which enables people and dollars to flow into the region and
serves a crucial role in the economic competitiveness of the metropolitan area.
Impact of PHL in New Castle County and Delaware
While PHL is located in Philadelphia and Delaware
counties, it is an economic driver for the entire region:
Employees working at PHL live in every county in
the MSA and the vendors that provide goods and
services are located throughout the area.
Tourism activity enabled by PHL brings visitors
from around the country and the world into the
region, where they spend dollars and support local
businesses and employment.
Trade activity is supported by the logistics and
interpersonal connections enabled by PHL,
allowing local businesses to grow their sales
outside of the region.
A Quality of Life Amenity for the Region
The millions of residents in the region who utilize PHL for business and leisure trips benefit from
proximity to the airport in travel cost and time savings. Transportation infrastructure is critical to
attracting individuals and businesses to the area, and the extensive national and international network
of air service connections through PHL allows residents easy access to destinations far and wide.
Regional residents save time and money when they travel, resulting in more disposable income.
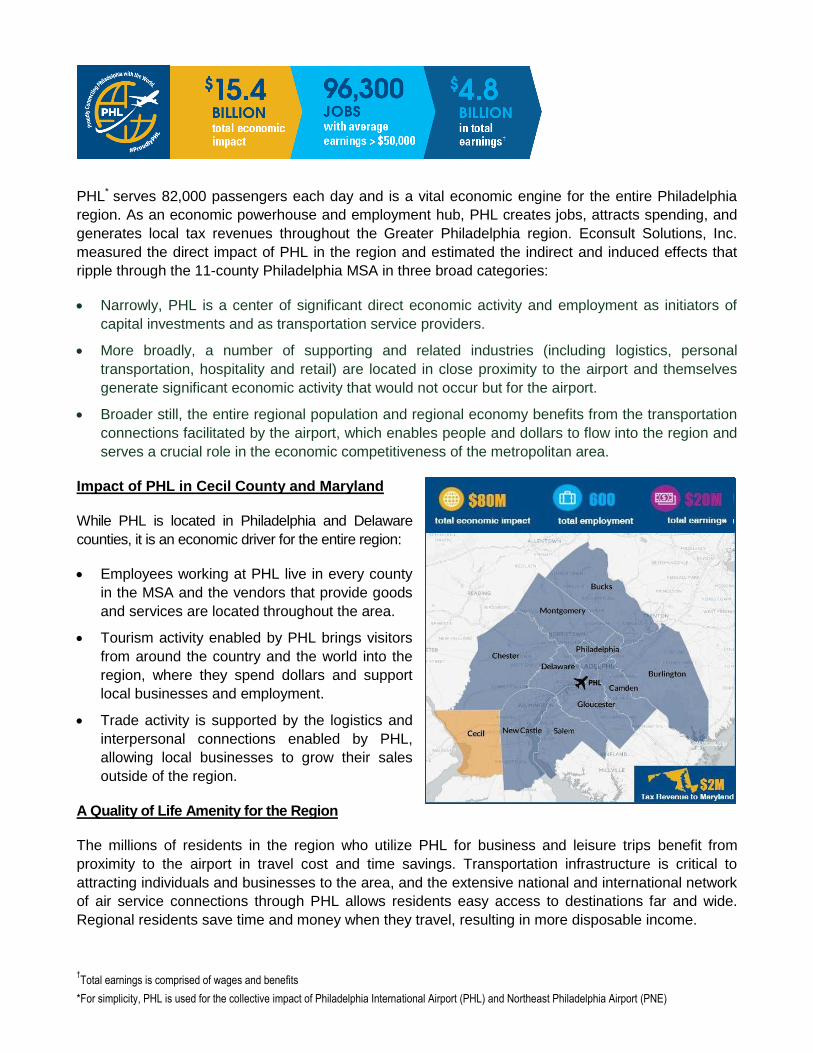
†Total earnings is comprised of wages and benefits
*For simplicity, PHL is used for the collective impact of Philadelphia International Airport (PHL) and Northeast Philadelphia Airport (PNE)
PHL* serves 82,000 passengers each day and is a vital economic engine for the entire Philadelphia
region. As an economic powerhouse and employment hub, PHL creates jobs, attracts spending, and
generates local tax revenues throughout the Greater Philadelphia region. Econsult Solutions, Inc.
measured the direct impact of PHL in the region and estimated the indirect and induced effects that
ripple through the 11-county Philadelphia MSA in three broad categories:
Narrowly, PHL is a center of significant direct economic activity and employment as initiators of
capital investments and as transportation service providers.
More broadly, a number of supporting and related industries (including logistics, personal
transportation, hospitality and retail) are located in close proximity to the airport and themselves
generate significant economic activity that would not occur but for the airport.
Broader still, the entire regional population and regional economy benefits from the transportation
connections facilitated by the airport, which enables people and dollars to flow into the region and
serves a crucial role in the economic competitiveness of the metropolitan area.
Impact of PHL in Cecil County and Maryland
While PHL is located in Philadelphia and Delaware
counties, it is an economic driver for the entire region:
Employees working at PHL live in every county
in the MSA and the vendors that provide goods
and services are located throughout the area.
Tourism activity enabled by PHL brings visitors
from around the country and the world into the
region, where they spend dollars and support
local businesses and employment.
Trade activity is supported by the logistics and
interpersonal connections enabled by PHL,
allowing local businesses to grow their sales
outside of the region.
A Quality of Life Amenity for the Region
The millions of residents in the region who utilize PHL for business and leisure trips benefit from
proximity to the airport in travel cost and time savings. Transportation infrastructure is critical to
attracting individuals and businesses to the area, and the extensive national and international network
of air service connections through PHL allows residents easy access to destinations far and wide.
Regional residents save time and money when they travel, resulting in more disposable income.