regional economic integration and geographic …iiep/assets/docs/papers/chen_iiepwp25.pdfregional...
TRANSCRIPT

ARTICLE IN PRESS
Contents lists available at ScienceDirect
European Economic Review
European Economic Review 53 (2009) 355–375
0014-29
doi:10.1
� Tel.
E-m1 Eu2 Eu
journal homepage: www.elsevier.com/locate/eer
Regional economic integration and geographic concentration ofmultinational firms
Maggie X. Chen �
Department of Economics and Elliott School of International Affairs, George Washington University, 2115 G Street, NW, #367, Washington, DC 20052, USA
a r t i c l e i n f o
Article history:
Received 6 March 2007
Accepted 19 May 2008Available online 4 June 2008
JEL classification:
F15
F23
Keywords:
Regional economic integration
Multinational firms
Geographic concentration
Market potential
Comparative advantage
21/$ - see front matter & 2008 Elsevier B.V. A
016/j.euroecorev.2008.05.002
: +1202 994 0192.
ail address: [email protected]
ropean Industrial Relations Observatory, Oct
ropean Industrial Relations Observatory, Ma
a b s t r a c t
A number of theoretical studies have predicted that preferential trade agreements
(PTAs) raise outside multinationals’ incentive to invest in the participating countries,
especially in those that are integrated with larger markets and have lower production
costs. The hypothesis has, however, not been tested empirically. This paper addresses
the issue by estimating the impact of PTAs on countries’ ability to attract multinationals.
The evidence is broadly consistent with expectations. The formation of PTAs leads to an
increase in FDI by outside multinationals, but the effect varies sharply with the size of
integrated markets and countries’ comparative advantage. Countries integrated with
larger markets experience a greater increase in total and export-platform FDI. Those
with a higher labor endowment also attract more FDI especially in labor-intensive
industries, but at the expense of their labor-scarce PTA partners.
& 2008 Elsevier B.V. All rights reserved.
1. Introduction
The proliferation of regional economic integration is reshaping the flows of foreign direct investment (FDI). Anincreasing number of multinational corporations (MNCs) move their production across borders, especially to countries thathave lower production costs and better access to large markets. General motors (GM), for example, recently undertookaggressive job cuts in its German-based subsidiary, Opel, and shut down its plant near Lisbon, Portugal. At the same time asthese contractions, it built a new production facility in Poland, a recent member of the European Union (EU).1 Similarly, theDutch-based electronics group Philips closed the operations of its Novalux subsidiary in Spain in 2004 and transferred theresearch and development (R&D) section to France and the manufacturing section to Poland.2 In fact, the World InvestmentReport (2005) indicates that these two companies’ location adjustment reflects an aggregate trend in FDI. The statisticsshow that while the total inflow of FDI to the EU rose in 2004, the majority of the EU-15 countries experienced a decrease innew investment. Countries such as Ireland and Spain, which used to be able to attract a large volume of FDI prior to 2004because of their relative advantage in labor cost and corporate tax in the EU-15, now see investment flow to some of themore competitive new EU members.
Economic theories suggest that when a preferential trade agreement (PTA) is formed, firms from outside the region aremotivated to move their production to the integrated bloc because the benefit of preferential market access is exclusive to
ll rights reserved.
ober 30, 2006.
rch 3, 2004.

ARTICLE IN PRESS
M.X. Chen / European Economic Review 53 (2009) 355–375356
inside firms.3 The effect is, however, not uniform across integrated countries. Countries that are integrated with a largernumber of countries or countries with a larger market size are more likely to experience an increase in FDI. Furthermore, astrade costs fall within the region, firms have a greater incentive to concentrate their production in the country with lowerproduction costs and achieve greater economies of scale. As a result, low-cost countries will receive a greater amount of FDIat the expense of their high-cost PTA partners and become the platforms from which multinationals export to othercountries.
This paper seeks to examine the above hypotheses. In particular, it asks: Does regional economic integration increaseoutside multinationals’ investments in the participating countries? Which countries gain multinational firms at theexpense of others? And do multinationals indeed adopt some integrated countries as export platforms? While thetheoretical literature yields clear predictions on the above questions, little has been done to test them. In fact, very fewempirical studies, with the exceptions of Barrel and Pain (1999), Feinberg and Keane (2001), and Ekholm et al. (2007), haveexamined the relationship between regional economic integration and FDI. Barrel and Pain (1999) were one of the first toexplore the FDI effect of the Single Market Programme implemented in the EU. They find that the removal of trade barrierswithin the EU has changed the permeability of national borders and raised FDI in four major European economies. Feinbergand Keane (2001) analyze the effect of trade liberalization between the U.S. and Canada and find that a lower U.S. tariffraises the exports of U.S. multinational affiliates in Canada back to the U.S. A more recent study by Ekholm et al. (2007)focuses on multinational affiliates’ exports to third countries and shows that multinationals located in a free trade areatend to engage in export-platform FDI.
This paper contributes to the above literature in two ways. First, instead of estimating the effect of a single PTA, itexamines how the effect of PTAs depends on the size of the integrated region. As shown in Fig. 1, which is constructed basedon U.S. multinational affiliate sales data in 2002, multinational firms are unevenly distributed across regions. The paperseeks to explain this pattern by introducing the role of regional economic integration. The paper posits that becauseintegrated regions vary in the size of participating countries (e.g., the EU versus the MERCOSUR) the extent to which PTAscan raise member countries’ ability to attract foreign investments is different. A member of a larger integrated bloc haspreferential access to a larger region and thus offers a stronger incentive for outside firms to invest in the country. Thepaper also takes into account the fact that countries often belong to more than one PTA. In these cases, countries with twoor more PTA memberships (e.g., Mexico) become a hub and can export to all the spoke countries at low or zero tariff (e.g.,Canada and Japan, both of which have a Free Trade Agreement with Mexico), whereas the same benefit does not necessarilyapply between spokes. Firms that seek to minimize trade costs are therefore more likely to locate their production in thehub countries. These hypotheses have been largely ignored in the empirical literature and will be formally tested in thisstudy.
This paper also examines how regional economic integration may lead to an asymmetric FDI effect within an integratedbloc. While integration may raise the total volume of FDI in the region, multinationals’ investment incentive can beweakened in some participating countries. This is because the improvement in market access between integrated countriesoffers firms a greater incentive to concentrate their production geographically and realize economies of scale. As it becomesless costly to export within the integrated region, multinationals’ production in less attractive locations, for example,countries with relatively high production costs, can be replaced by exports from the other production locations in theregion. The former countries may therefore experience a decline in inward FDI while their more attractive, low-cost PTApartners witness an increase. This is especially likely when countries in the integrated region are highly heterogeneous.This hypothesis has been established in theoretical studies but largely overlooked in the empirical literature.
The paper is also built on the broader literature that examines the causes of FDI. Two main motives have beenestablished in previous studies. First, firms may choose to invest in a foreign market to avoid trade costs. This will happenwhen the benefit of proximity to consumers outweighs the benefit of scale economy, in which case firms are better offengaging in horizontal FDI and duplicating their production in countries with similar factor endowment. This strategy hasbeen referred to as the market access or tariff-jumping motive and is formally established in studies such as Markusen(1984) and Markusen and Venables (2000). Firms may also choose to invest abroad because of foreign countries’comparative advantage. When the production process consists of separable stages that require different factor intensities,firms may prefer to locate each stage in a country where the factor used intensively in that stage is abundant. This strategyleads to a vertical type of FDI and is referred to as the comparative advantage motive. It has been examined in influentialstudies such as Helpman (1984). The above two motives have also been tested in a number of important empirical papers,including Brainard (1997), Markusen and Maskus (1999), Carr et al. (2001), Markusen and Maskus (2001), and Yeaple(2003). While papers such as Brainard (1997) find mainly evidence of horizontal FDI, Carr et al. (2001) and Yeaple (2003)lend support to both horizontal and vertical FDI.
This study is closely related to the above strand of literature but focuses on how a decline in trade costs within a blocmay lead multinational firms to adjust their location choices. The paper suggests that while firms from outside the bloc aremotivated to move their production to the integrated region because the benefit of preferential market access is exclusiveto insiders, they no longer have the incentive to have multiple plants within the region. Not only would they become more
3 Examples of classic theoretical work in this area include Motta and Norman (1996), Krugman and Venables (1996), Puga and Venables (1997), and
Ekholm et al. (2007). See Section 2 for a detailed discussion of these studies.

ARTICLE IN PRESS
mor
e th
an $
300,
000
mill
ion
$200
,000
-300
,000
mill
ion
$100
,000
-200
,000
mill
ion
$50,
000-
100,
000
mill
ion
$10,
000-
50,0
00 m
illio
n$5
,000
-10,
000
mill
ion
$1,0
00-5
,000
mill
ion
less
than
$1,
000
mill
ion
Fig. 1. The geographical distribution of U.S. multinationals by affiliate sales in 2002.
M.X. Chen / European Economic Review 53 (2009) 355–375 357
geographically concentrated and serve some intra-regional markets through exports, their choice of production locationswould be dominated by the comparative advantage factor.
To test these predictions and estimate the role of regional economic integration, this paper constructs a measure ofmarket potential for each potential host country. This measure of market potential is motivated by previous studiesincluding Harris (1954), Krugman (1992), Head and Mayer (2004), and Hanson (2005). It takes into account not only thehost-country market size but also the size of other countries (discounted by trade costs). The paper posits that theformation of a PTA improves a participating country’s market access to its PTA partners and raises its market potential inforeign markets. Countries that are integrated with large markets therefore have a greater ability to attract multinationals.The paper departs from the previous studies, in particular, Head and Mayer (2004), by distinguishing host countries’ exportmarkets to countries that have formed a PTA with the host country and the rest of the world. This distinction makes itpossible to estimate the importance of market integration in a country’s ability to receive foreign investments.

ARTICLE IN PRESS
M.X. Chen / European Economic Review 53 (2009) 355–375358
The empirical evidence is broadly consistent with the hypotheses. First, the paper finds, based on both U.S. and otherOECD countries’ FDI data, that multinationals do have a greater incentive to invest in a region after economic integration.The effect is, however, significantly asymmetric across integrated countries and varies sharply with the size of theintegrated region and the comparative advantage of host countries. Those that are integrated with a larger number ofcountries or countries with a larger market size experience a greater increase in outside multinationals’ activities. Withinintegrated regions, countries with a greater labor endowment attract more FDI, especially in labor-intensive industrieswhere their capital-abundant PTA partners experience a decline. Regional economic integration is also found to increaseexport-platform FDI as predicted in the theoretical literature. This effect again rises with the size of countries with whichthe host is integrated. The paper also estimates the effect of PTAs on intra-bloc FDI and finds that while PTAs significantlyraise the investment from outside the region they do not promote intra-regional FDI. This is not surprising considering thatregional integration not only lowers MNCs’ tariff-jumping motive within the region but also increases the competition fromoutside MNCs. These findings are robust to the measures of FDI: Both affiliate sales and FDI flow from outside the region arefound to rise when the region is integrated.
The paper accounts for the potential issue of omitted variables using the novel approach introduced by Head and Mayer(2004). Specifically, it constructs a generalized measure of market potential that takes into account factors such as thedegree of competition in export markets and additional trade costs such as language and national border. This generalizedmeasure serves as a better indicator of export demand and does not change the results qualitatively. The effect of PTApartners on host countries’ ability to attract multinationals remains significant. The paper also addresses the potentialendogeneity of PTAs by investigating the economic and political determinants of PTAs. Using a two-stage InstrumentalVariable (IV) method, the paper finds that the estimated effect of economic integration on both total and export-platformFDI remains similar.
The rest of the paper is organized as follows. Section 2 outlines the main hypotheses of this paper and the econometricframework. Section 3 describes the data employed in the analysis. Section 4 discusses the main empirical results, whileSection 5 presents sensitivity analyses including alternative data sample, different estimation methodology, andapproaches to deal with the issues of omitted variables and potential endogeneity of PTAs. Section 6 concludes the paper.
2. Hypotheses and econometric framework
Several theoretical studies, including Motta and Norman (1996), Krugman and Venables (1996), Puga and Venables(1997), and Ekholm et al. (2007), have formally examined the effect of regional economic integration on multinationals’location decision. Motta and Norman (1996) adopt a game theoretic model of FDI and find that the formation of a PTAbetween two countries can motivate firms in the third country to invest in the integrated region and engage in export-platform FDI. In a two-country two-industry model, Krugman and Venables (1996) show that at lower trade barriersagglomeration force can dominate firms’ location decision and lead each industry to concentrate in a single location. Pugaand Venables (1997) consider a more complicated trading system and also find that a fall in trade barriers can lead somemember countries to gain industries at the expense of other countries. The recent study by Ekholm et al. (2007) introducescountry asymmetry to the model. They find that the formation of a free trade area between a large, high-cost country and asmall, low-cost country will increase export-platform FDI in the latter country from both inside and outside firms.
In sum, several predictions have been reached in the literature. First, a fall in trade cost between two countries isexpected to raise a third-country firm’s incentive to produce in the integrated region. This is especially true for countriesthat are integrated with large markets. However, not all integrated countries will necessarily experience an increase in FDI:Those with lower production costs are likely to gain outside multinationals at the expense of their high-cost PTA partners,as multinationals now have a greater incentive to concentrate their production within the region and achieve greatereconomies of scale. This also leads to the third prediction of the literature: When countries form a PTA, multinationalswould adopt the country with relatively low production costs as an export platform and export to the other countries fromthere.
To test these intuitive predictions, the paper estimates the following baseline equation:
FDIhikt ¼ aþ b1Xhikt þ b2Mit þjhk þ gik þ mt þ �hikt , (1)
where FDIhikt is the natural log of FDI from home country h to foreign country i in industry k and year t, Xhikt represents avector of home- and host-country characteristics that capture MNCs’ market access and comparative advantage motives,jhk and gik are vectors of home- and host-country-industry dummies, mt is a vector of time dummies, and �ikt denotes theerror term.4
The equation also includes a measure of host countries’ status in regional integration, Mit , the primary variable of theanalysis. The construction of this variable is motivated by previous studies including Harris (1954), Krugman (1992), Headand Mayer (2004) and Hanson (2005). It reflects the total potential demand faced by each host country, taking into accountnot only the host country’s domestic market size but also the size of export markets including, respectively, its PTA partners
4 Note that by including both the cross-section and time fixed effects this paper controls for all country-industry specific and time specific factors.

ARTICLE IN PRESS
M.X. Chen / European Economic Review 53 (2009) 355–375 359
and the rest of the world. The exact formula is
Mit � Yit þo1PTAiht �Yht
tihþXjai;h
o2PTAijt �Yjt
tij
� �þXjai
o3ð1� PTAijtÞ �Yjt
tij
� �, (2)
where Mit denotes the market potential of host country i at year t, Yit , Yht , and Yjt represent, respectively, the market size ofhost country i, MNCs’ home country h, and country j, PTAiht and PTAijt are dummy variables that are equal to 1 if hostcountry i has a PTA with, respectively, MNCs’ home country and country j, and o1, o2, and o3 are the parameters to beestimated. Note that each non-host country’s market size is also weighed by the transport cost of exporting to that countryfrom the host, denoted by tih and tij. Countries that are geographically distant from the host country are considered to havea smaller weight in the host country’s market potential.
It is also noteworthy that a country’s PTA partners are divided in Eq. (2) to MNCs’ home country and countries otherthan the home and host countries. This distinction is important because home–host PTA affects multinationals differentlyfrom the PTAs that exclude MNCs’ home country. The former captures the effect of economic integration on intra-regionalFDI while the latter represents the effect of economic integration on FDI from outside the bloc. As discussed above, PTAs areexpected to increase investment by outside multinationals because of improved market accessibility in the integratedregion. But this effect is not necessarily true for multinationals inside the bloc. The reason is twofold. First, while PTAsformed between MNCs’ home and host countries (such as the NAFTA) lower the cost of (U.S.) affiliates exporting productsto the home market and stimulate vertical FDI, they also lower the cost of firms exporting from home to the foreign market.Firms are thus less likely to undertake horizontal FDI in which the incentive to avoid trade costs is the original motive toinvest abroad. Home–host PTAs can also decrease intra-regional FDI because of the increased investment and productionby outside multinationals. For example, if the EU multinationals increase their investment in Mexico after NAFTA wasformed, the increased competition can adversely affect U.S. multinationals.
To examine how the effect of economic integration may depend on the characteristics of integrated countries, Eq. (1) ismodified as follows:
FDIhikt ¼ aþ b1Xhikt þ b2Mit þ b3Xhikt � PTAit þjhk þ gik þ mt þ �hikt , (3)
where a vector of interaction terms, i.e., Xhikt � PTAit , is formed between the host-country characteristics and a dummyvariable PTAit that identifies integrated host countries at year t. The parameters of the interaction variables b3 reflect howthe effect of PTAs varies with country attributes.
To test the hypothesis on export-platform FDI, the paper follows Ekholm et al. (2007) and considers MNCs’ exports tothird countries as the dependent variable. The relevant estimation equation is
export_FDIhikt ¼ aþ b1X0hikt þ b2Meit þjhk þ gik þ mt þ �hikt , (4)
where X0hikt is the corresponding vector of explanatory variables and Meit is the host country’s export market potential in
countries other than MNCs’ home characterized as
Meit �
Xjai;h
o2PTAijt �Yjt
tijþo3ð1� PTAijtÞ �
Yjt
tij
� �. (5)
In addition to host countries’ market potential, the following explanatory variables are included to test MNCs’ marketaccess and comparative advantage motives. First, the paper controls for the host-country sectoral tariff rates onmultinationals’ home country and expects a positive correlation between the two. The home-country sectoral tariff rates oneach host country are also included. In contrast to the host-country tariff, this tariff is expected to adversely affectmultinationals, especially those that seek to export their final products from foreign affiliates to the home market. Freightcost between home and host countries is also included as a measure of trade costs and expected to have an ambiguouseffect on FDI. While a greater freight cost motivates firms to supply foreign markets through local production instead ofexports, it discourages multinationals from undertaking vertical FDI and exporting back home.
Following the existing empirical literature, a country’s factor endowment ratio, i.e., K=L, is used to represent thecountry’s comparative advantage.5 It is not only included independently but also interacted with industries’ capitalintensity to test the hypothesis that capital-abundant countries attract capital-intensive multinationals whereas labor-abundant countries attract more labor-intensive firms. Finally, the estimations also take into account countries’ corporatetax rate and expect a negative correlation with the level of FDI.
3. Data
The main dataset employed in this paper is taken from the U.S. Bureau of Economic Analysis (BEA). This dataset reportsthe sales and exports of U.S. majority owned affiliates in major manufacturing industries and 40 countries during the
5 Sectoral unit labor costs would be another possible measure of comparative advantage. Such data can be obtained from the International Labor
Organization, Bureau of Labor Statistics, and the UNIDO database, but there are many missing values in these datasets which would reduce the sample
size substantially.

ARTICLE IN PRESS
Table 1The distribution of US multinational affiliate sales across geographic regions and sales destinations (in millions of US dollars)
Host regions/Sales destinations 1986 1990 1994 1998
World 720,069 (100%) 1,208,349 (100%) 1,435,901 (100%) 1,971,909 (100%)
Western Europe (15 countries) 359,438 (49%) 647,098 (53%) 725,336 (50%) 1,000,725 (50%)
Local sales 66% 68% 67% 63%
Exports back to the U.S. 3% 3% 3% 5%
Exports to third countries 29% 28% 29% 31%
North America 133,950 (18%) 197,997 (16%) 233,245 (16%) 303,019 (15%)
Local sales 72% 73% 69% 66%
Exports back to the U.S. 24% 23% 28% 30%
Exports to third countries 3% 3% 2% 3%
South America 37,622 (5%) 53,755 (4%) 65,466 (4%) 122,075 (6%)
Local sales 85% 86% 85% 82%
Exports back to the U.S. 8% 6% 5% 4%
Exports to third countries 6% 7% 9% 12%
Southeast Asia 23,377 (3%) 51,260 (4%) 85,580 (6%) 118,091 (6%)
Local sales 35% 47% 49% 43%
Exports back to the U.S. 29% 22% 19% 22%
Exports to third countries 35% 30% 31% 34%
Australia–New Zealand 25,258 (3%) 43,809 (3%) 64,346 (4%) 58,308 (3%)
Local sales 88% 85% 86% 84%
Exports back to the U.S. 2% 4% 3% 3%
Exports to third countries 8% 10% 10% 13%
M.X. Chen / European Economic Review 53 (2009) 355–375360
period between 1986 and 1999.6 Sections 5.1 and 5.2 consider an alternative dataset that is obtained from the OECD FDIdatabase and include additional source countries such as Germany, Italy, Portugal, and Japan. Including these countries, inparticular, the EU members, enables the paper to examine the robustness of the estimates, especially the estimated effect ofPTAs on intra-regional FDI.7 This dataset, however, does not report information on export-platform FDI, i.e., exports ofmultinationals to third countries. It also contains a large number of missing values at the industry level, which lead theanalysis in Sections 5.1 and 5.2 to use country-level FDI data.
A summary of the BEA dataset is provided in Table 1. First, the affiliate sales are divided by host regions consisting ofWestern Europe, North America, South America, Southeast Asia, and Australia–New Zealand, all of which have reached atleast one PTA by 1999. Two observations are noteworthy. First, the volume of total affiliate sales has grown at an annualrate of 13% between 1986 and 1998. Second, the percentage of total affiliate sales by affiliates located in Southeast Asia hasincreased from 3% to 6% from 1986 to 1998, while the percentage of sales by affiliates located in Canada and Mexico hasdeclined from 18% to 15%.
The data are then divided by sales destinations. The first category is the percentage of affiliate sales to local consumers.This category captures the horizontal type of FDI that is undertaken to avoid trade costs and access local markets. Thiscomponent of multinationals’ activities is dominant in all regions with the possible exception of Southeast Asia. Theimportance of this component has, however, declined over time implying that U.S. multinationals have become relativelyless local-market oriented. The second category of affiliate sales is the percentage of sales exported back to the U.S. Thiscategory reflects U.S. multinationals’ comparative advantage motive which leads them to move production abroad andserve U.S. consumers through exports. Table 4 shows that this component of affiliate sales has grown significantly inCanada and Mexico especially since 1994 when the NAFTA was formed, but has fallen in South America and Southeast Asia.The last category is the share of affiliate sales exported to third countries (excluding the host country and the U.S.), which isalso defined as export-platform FDI. This part of affiliate sales is viewed as a combination of horizontal and vertical FDI andis highest in Western Europe and Southeast Asia.
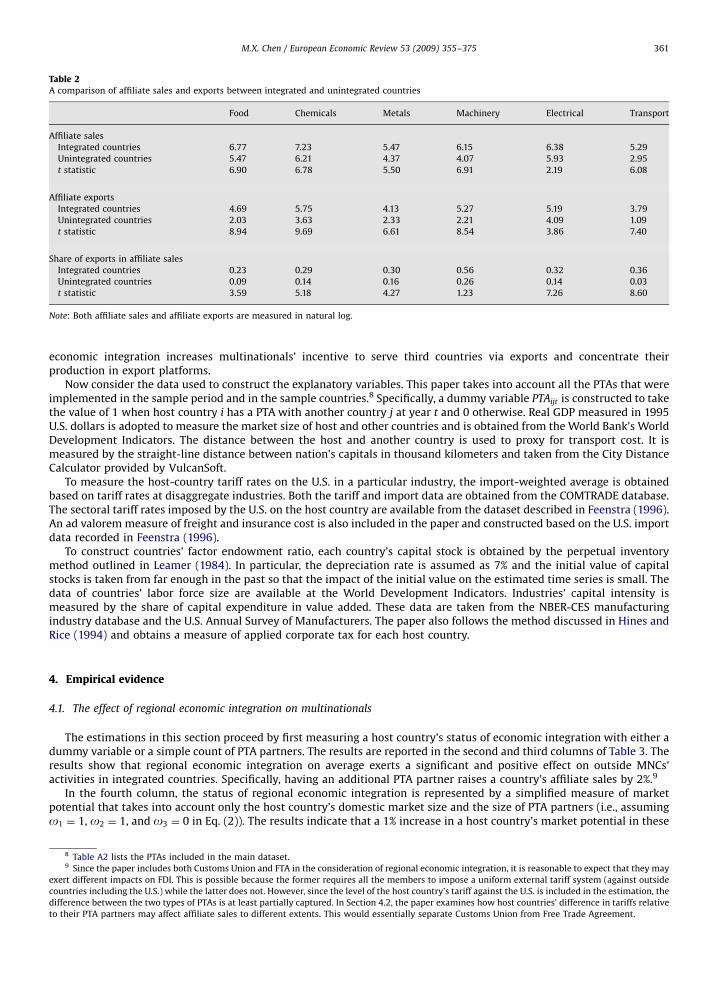
Table 2 compares affiliate sales and exports between integrated (i.e., countries that have at least one PTA) and non-integrated countries (i.e., those that do not belong to any PTA). As shown, the level of total affiliate sales is generally higherin integrated countries, especially in machinery and transport industries. The same observation applies to the level ofaffiliate exports while the difference between integrated and non-integrated countries is widened. The percentage ofexported affiliate sales is unambiguously greater in integrated countries, consistent with the hypothesis that regional
6 Table A1 lists the included countries. Because the BEA switched the industry classification from SIC to NAICE in 1999, the data of affiliate sales and
exports are recorded in SIC codes until 1999. These data cannot be matched with the data after 1999 because of the level of aggregation. As a result, the
sample period is between 1986 and 1999.7 Section 5 also considers an alternative measure of FDI, i.e., the level of FDI flow. While affiliate sales have been adopted by the majority of existing
studies (e.g., Brainard, 1997; Carr et al., 2001; Markusen and Maskus, 2001; Yeaple, 2003; Ekholm et al., 2007) as the measure of FDI, using FDI flow data
allows the paper to directly verify that the effect of regional economic integration in increasing multinationals’ geographic concentration is not only
reflected in their sales and exports but also their investment activities.
ARTICLE IN PRESS
Table 2A comparison of affiliate sales and exports between integrated and unintegrated countries
Food Chemicals Metals Machinery Electrical Transport
Affiliate sales
Integrated countries 6.77 7.23 5.47 6.15 6.38 5.29
Unintegrated countries 5.47 6.21 4.37 4.07 5.93 2.95
t statistic 6.90 6.78 5.50 6.91 2.19 6.08
Affiliate exports
Integrated countries 4.69 5.75 4.13 5.27 5.19 3.79
Unintegrated countries 2.03 3.63 2.33 2.21 4.09 1.09
t statistic 8.94 9.69 6.61 8.54 3.86 7.40
Share of exports in affiliate sales
Integrated countries 0.23 0.29 0.30 0.56 0.32 0.36
Unintegrated countries 0.09 0.14 0.16 0.26 0.14 0.03
t statistic 3.59 5.18 4.27 1.23 7.26 8.60
Note: Both affiliate sales and affiliate exports are measured in natural log.
M.X. Chen / European Economic Review 53 (2009) 355–375 361
economic integration increases multinationals’ incentive to serve third countries via exports and concentrate theirproduction in export platforms.
Now consider the data used to construct the explanatory variables. This paper takes into account all the PTAs that wereimplemented in the sample period and in the sample countries.8 Specifically, a dummy variable PTAijt is constructed to takethe value of 1 when host country i has a PTA with another country j at year t and 0 otherwise. Real GDP measured in 1995U.S. dollars is adopted to measure the market size of host and other countries and is obtained from the World Bank’s WorldDevelopment Indicators. The distance between the host and another country is used to proxy for transport cost. It ismeasured by the straight-line distance between nation’s capitals in thousand kilometers and taken from the City DistanceCalculator provided by VulcanSoft.
To measure the host-country tariff rates on the U.S. in a particular industry, the import-weighted average is obtainedbased on tariff rates at disaggregate industries. Both the tariff and import data are obtained from the COMTRADE database.The sectoral tariff rates imposed by the U.S. on the host country are available from the dataset described in Feenstra (1996).An ad valorem measure of freight and insurance cost is also included in the paper and constructed based on the U.S. importdata recorded in Feenstra (1996).
To construct countries’ factor endowment ratio, each country’s capital stock is obtained by the perpetual inventorymethod outlined in Leamer (1984). In particular, the depreciation rate is assumed as 7% and the initial value of capitalstocks is taken from far enough in the past so that the impact of the initial value on the estimated time series is small. Thedata of countries’ labor force size are available at the World Development Indicators. Industries’ capital intensity ismeasured by the share of capital expenditure in value added. These data are taken from the NBER-CES manufacturingindustry database and the U.S. Annual Survey of Manufacturers. The paper also follows the method discussed in Hines andRice (1994) and obtains a measure of applied corporate tax for each host country.
4. Empirical evidence
4.1. The effect of regional economic integration on multinationals
The estimations in this section proceed by first measuring a host country’s status of economic integration with either adummy variable or a simple count of PTA partners. The results are reported in the second and third columns of Table 3. Theresults show that regional economic integration on average exerts a significant and positive effect on outside MNCs’activities in integrated countries. Specifically, having an additional PTA partner raises a country’s affiliate sales by 2%.9
In the fourth column, the status of regional economic integration is represented by a simplified measure of marketpotential that takes into account only the host country’s domestic market size and the size of PTA partners (i.e., assumingo1 ¼ 1, o2 ¼ 1, and o3 ¼ 0 in Eq. (2)). The results indicate that a 1% increase in a host country’s market potential in these
8 Table A2 lists the PTAs included in the main dataset.9 Since the paper includes both Customs Union and FTA in the consideration of regional economic integration, it is reasonable to expect that they may
exert different impacts on FDI. This is possible because the former requires all the members to impose a uniform external tariff system (against outside
countries including the U.S.) while the latter does not. However, since the level of the host country’s tariff against the U.S. is included in the estimation, the
difference between the two types of PTAs is at least partially captured. In Section 4.2, the paper examines how host countries’ difference in tariffs relative
to their PTA partners may affect affiliate sales to different extents. This would essentially separate Customs Union from Free Trade Agreement.

ARTICLE IN PRESS
Table 3The impact of regional economic integration on multinational affiliate sales
Dependent variable: Affiliate sales OLS OLS OLS Nonlinear LS
KL endowment ratio �0:65��� �0:63�� �0:83��� �0:80���
(0.30) (0.30) (0.30) (0.28)
KL endowment ratio�capital intensity 3:68� 2.74 3:92� 6:60���
(2.25) (2.23) (2.22) (2.28)
Capital intensity �33:88 �23:31 �36:47 �65:82���
(25.11) (24.95) (24.73) (25.46)
Corporate tax 0.07 0.06 0.05 0.08
(0.04) (0.04) (0.04) (0.04)
Freight �0:13��� �0:12��� �0:12�� �0:14���
(0.05) (0.05) (0.05) (0.05)
Host country’s tariff on the U.S. 0:08� 0:08� 0:08� 0:11��
(0.05) (0.05) (0.05) (0.05)
U.S. tariff on the host country �0:09 �0:08 �0:10� �0:14���
(0.06) (0.06) (0.06) (0.05)
Domestic market size 0:57�� 0:64���
(0.28) (0.27)
PTA with the U.S. 0.03 0.12
(0.26) (0.26)
PTA with third countries 0:08�
(0.05)
Number of integrated third countries 0:02�
(0.01)
Integrated market potential 1:04���
(0.29)
Aggregate market potential 6:48���
(1.30)
Weight of PTA with home (o1) �0:02
(0.04)
Weight of other PTA partners (o2) 0:63��
(0.33)
Weight of ROW (o3) 0:51�
(0.28)
Country-industry fixed effect Yes Yes Yes Yes
Year fixed effect Yes Yes Yes Yes
Number of observations 1450 1450 1450 1450
R square 0.97 0.97 0.97 0.97
Root MSE 0.50 0.50 0.50 0.49
Notes: (i) Integrated market potential � Yit þ PTAiht �YhttihþP
jai;hPTAijt �Yjt
tijaggregate market potential � Mit is defined in Eq. (2); (ii) all variables are
measured in natural log except capital intensity and PTA dummy; (iii) standard errors are reported in the parentheses; (iv) ��� , �� , and � represent
significance at 1%, 5%, and 10% level, respectively.
M.X. Chen / European Economic Review 53 (2009) 355–375362
markets leads to a 1.04% increase in U.S. multinationals’ affiliate sales. This suggests that multinationals’ activities increasenot only with the number of PTA partners a country has but also the market size of these countries.
Finally, the last column of Table 3 reports the results based on the measure of market potential defined in Eq. (2). Thismeasure of market potential includes, in addition to the host-country domestic market size, (i) the market size of MNCs’home country if there exists a PTA between the home and host, (ii) the market size of other PTA partners, and (iii) the restof the world.10 The relative importance of these different groups, i.e., o1, o2 and o3, is estimated in a nonlinear least-square model. The results show that a 1% increase in a host country’s aggregate market potential leads to a 6.5% increase inaffiliate sales. The weight of PTA partners that excludes multinationals’ home country is, however, 23% (¼ 0:63=0:51� 1)greater than the weight of unintegrated countries. This suggests that the former group plays a more important role than thelatter in determining the host-country’s ability to attract MNCs.
Note in all the above specifications PTAs formed between home and host countries are treated separately. As discussedin Section 2, this distinction is important because, in contrast to the PTAs formed between host and other countries, theeffect of home–host PTAs captures the impact of regional integration on intra-bloc FDI. On the one hand, they encouragemultinationals to engage in vertical FDI and supply home-country consumers via exports, especially when the PTA partner
10 For host countries that do not have any PTAs, their market potential is the sum of their domestic market size and group (iii) (i.e., the market size of
the rest of the world), with the value of groups (ii) (i.e., the market size of integrated countries) equal to zero. For host countries that have adopted a PTA in
a certain year, the total value of group (i) and (ii) becomes positive in that year while the value of (iii) decreases, but the unweighted sum remains the
same.

ARTICLE IN PRESS
M.X. Chen / European Economic Review 53 (2009) 355–375 363
countries are complementary in comparative advantage. On the other hand, they discourage horizontal FDI in PTA partnercountries and promote intra-regional trade. Furthermore, because they raise the inflow of FDI from outside the bloc, theincreased competition from outside multinationals can also reduce intra-bloc FDI. The estimates in Table 3 suggest that thePTAs formed between the U.S. and host countries do not have a significant effect on U.S. FDI.11
The estimated effect of other host-country variables also appears largely consistent with the expectations. First, theevidence suggests a significant comparative advantage motive for U.S. multinationals. Countries with a greater laborendowment tend to have greater affiliate sales, especially in labor-intensive industries. The U.S. tariff on host countries also hasthe expected impact, suggesting that some U.S. MNCs engage in vertical FDI and supply home consumers with foreignproduction. Freight cost is negatively associated with multinationals’ activities. As discussed in Section 2, this result can beattributed to either the negative effect of transport cost on multinationals’ exports to the home country or the role of distancein raising the fixed cost of investment (such as the monitoring cost). Multinationals’ tariff-jumping motive is also confirmed inthe table. A 1% increase in the tariff imposed by the host country raises multinationals’ affiliate sales by about 0.8%. The effectof corporate tax is statistically insignificant, which can be partially due to the use of country-industry fixed effect.12
4.2. Geographic concentration of multinationals within integrated regions
While the above results suggest that regional economic integration does raise outside multinationals’ activities inintegrated countries, the effect is expected to vary across countries. Given multinationals’ increased incentive toconcentrate their production geographically, some countries are likely to gain multinationals at the expense of others,especially their PTA partners. This section hence evaluates the following questions: Do outside multinationals indeedbecome more concentrated within the integrated region? What types of host countries gain more FDI? Which countrieslose? To address these issues, Eq. (3) is estimated where the PTA dummy variable is interacted with host-countrycharacteristics. Table 4 reports the results.
As seen in the upper part of Table 4, labor-abundant countries receive a greater increase in multinationals’ affiliate salesthan labor-scarce countries after forming PTAs. This is especially true for labor-intensive industries. This finding suggeststhat countries in an integrated region will gain FDI in industries where they have a comparative advantage at the cost ofcountries that have a comparative disadvantage in these same industries. The result similarly holds for countries with alower corporate tax. The effect of PTAs also depends on the freight cost of exporting to the host countries from the U.S.:Those that require a higher shipping cost experience a greater increase in multinationals’ activities after integration.13
These results are broadly consistent with the hypotheses outlined in Section 2.Next, instead of comparing the effect of regional economic integration across all integrated countries, the rest of this section
compares each individual country with its PTA partners only. The motivation for this comparison is that with free market accessbetween integrated countries a country is most likely to gain FDI from its PTA partners and vice versa. To test this hypothesis, thedifference between a host country’s characteristics and the average of its PTA partners is calculated, i.e., DXhikt � Xhikt� XhjktjPTAijt¼1,and interacted with the PTA dummy variable. This measure captures the host country’s advantage or disadvantage in FDIdeterminants relative to their PTA partners. The lower part of Table 4 reports the estimates. As expected, countries that arerelatively more labor abundant than their PTA partners receive a greater increase in affiliate sales in labor-intensive industries.Multinationals also tend to increase their activities in countries that require a higher freight cost than their PTA partners.
Figs. 2–4 depict the estimated marginal effect of an additional PTA partner for each host country.14 The figures suggestthat there exists a statistically significant correlation between country-specific estimates and capital–labor endowmentratio. It is clear that not all integrated countries gain multinationals. In the food industry, for example, labor-abundantcountries, such as Thailand, Malaysia, Peru, and Chile, experience an increase in multinationals’ activities, whereas capital-abundant countries such as most EU members see a decline. This finding is not surprising provided that foodmanufacturing is a labor-intensive industry. The sign of correlation is reversed for the chemical (for the Europeancountries) and electrical appliance industries as they require a relatively high capital intensity. In particular, the positiveimpact of regional integration in the electrical appliance industry is exclusive to a few industrial countries (e.g., Ireland,Switzerland, and Denmark); every other country witnesses a decline in FDI. These findings further suggest an increasingconcentration of multinational firms within integrated blocs.
4.3. Export-platform FDI
The geographic concentration of multinational firms as a result of regional economic integration should also lead to anincrease in export-platform FDI. This prediction has been made in many theoretical studies including Motta and Norman
11 This result can, however, be driven by the inclusion of U.S. and host-country tariffs in the existing specifications, which at least partially control for
the PTAs that exist between the U.S. and host countries.12 Host countries’ GDP is included separately in the second and third columns and found to be positively correlated with multinationals’ affiliate sales.13 Table 4 reports a selected list of estimates. The complete table is available upon request.14 Because the paper includes a country-industry fixed effect, it cannot estimate country-specific effects of the PTA dummy variable. This variable will
be perfectly correlated with the fixed effect if a country has a PTA throughout the sample period. Country-specific effects of an additional PTA partner are
hence estimated instead.

ARTICLE IN PRESS
Greece
UK
Finland
Portugal
Austria
Denmark
Switzerland
Spain
Ireland
Germany
Italy
France
SwedenNetherlands
Belgium
Brazil
ChilePeru
Ecuador
Malaysia
Venezuela
Thailand
-5
-4
-3
-2
-1
0
1
2
3
9 9.5 10 10.5 11 11.5 12
ln (K/L)
mar
gina
l effe
ct o
f PTA
par
tner
s
Fig. 2. The correlation between country-specific marginal effect of PTA partners and relative factor endowment—the food industry: The slope is �0:71
with a p-value of 0.01 (only statistically significant estimates are included).
Table 4The asymmetric impact of regional economic integration
Dependent variable: Affiliate sales (1)
PTA�
KL endowment ratio �0:78���
(0.28)
KL endowment ratio� capital intensity 10:63���
(3.40)
Capital intensity �122:06���
(36.17)
Corporate tax �0:17�
(0.11)
Freight 0:24���
(0.08)
Host country’s tariff on the U.S. �0:15
(0.12)
U.S. tariff on the host country 0.05
(0.06)
Number of observations 1450
R square 0.97
Root MSE 0.49
Dependent variable: Affiliate sales (2)
PTA�
DKL endowment ratio �0:1
(0.09)
DKL endowment ratio�capital intensity 2:79���
(1.18)
Capital intensity �39:57���
(13.17)
Dcorporate tax 0.09
(0.07)
Dfreight 0:18���
(0.05)
Dhost-country’s tariff on the U.S. �0:05
(0.06)
DU.S. tariff on the host country �0:07
(0.09)
Number of observations 1450
Root MSE 0.49
R square 0.97
Notes: (i) All variables are measured in natural log except capital intensity and PTA; (ii) the rest of the estimates are not reported but available upon
request; (iii) standard errors are reported in the parentheses; (iv) ��� , �� , and * represent significance at 1%, 5%, and 10% level, respectively.
M.X. Chen / European Economic Review 53 (2009) 355–375364

ARTICLE IN PRESS
Belgium
Netherlands
Sweden
France
ItalyGermany
Ireland
Spain
Switzerland
DenmarkAustria
Portugal
Finland
UK
GreeceThailand VenezuelaMalaysiaEcuador
PeruChile Brazil
-2
-1
0
1
2
3
4
5
9 9.5 10 10.5 11 11.5 12
ln (K/L)
mar
gina
l effe
ct o
f PTA
par
tner
s
Fig. 3. The correlation between country-specific marginal effect of PTA partners and relative factor endowment—the chemicals industry: The slope is 2.37
for the European countries with a p-value of 0.10 and insignificant for the others (only statistically significant estimates are included).
Greece
Finland
Portugal
AustriaDenmark
Switzerland
Spain
Ireland
Germany
ItalyFrance
Sweden
Netherlands
Belgium
Brazil
Chile
Peru
Malaysia VenezuelaThailand
-5
-4
-3
-2
-1
0
1
2
3
9 9.5 10 10.5 11 11.5 12
ln (K/L)
mar
gina
l effe
ct o
f PTA
par
tner
s
Fig. 4. The correlation between country-specific marginal effect of PTA partners and relative factor endowment—the electrical appliances industry: The
slope is 1.05 with a p-value of 0.09 (only statistically significant estimates are included).
M.X. Chen / European Economic Review 53 (2009) 355–375 365
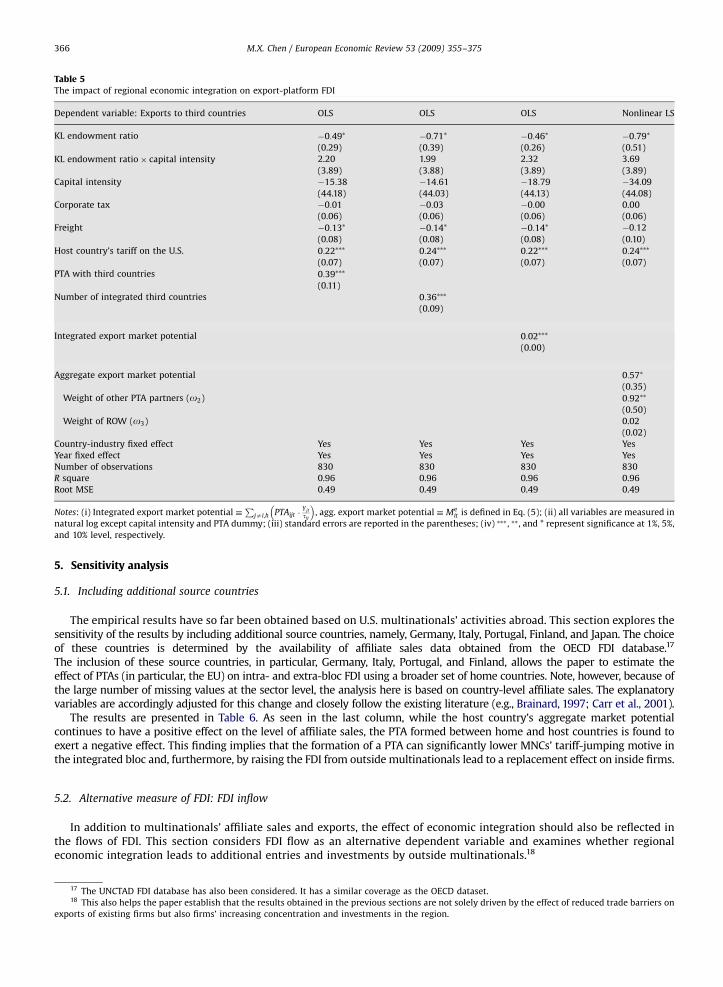
(1996) and Ekholm et al. (2007). With a decline in trade costs within an integrated bloc, exporting from intra-regionalproduction location can be less costly than establishing a local production plant. Multinational firms therefore are morelikely to engage in export-platform FDI than dispersed FDI. To test this hypothesis, Eq. (4) is estimated where U.S.multinationals’ exports to third countries is adopted as the dependent variable.15
As seen in Table 5, forming a PTA does raise the exports of multinational affiliates.16 This effect also rises with thenumber of preferential trading partners (as suggested in the third column) and the size of these partners (as suggested inthe fourth column). When the market size of integrated and unintegrated countries is taken into account separately, theresults indicate that the weight of PTA partners significantly exceeds that of the rest of the world. This implies thatpreferential market access to other markets raises a country’s attractiveness as the export platform. Comparative advantageis also a significant determinant of export-platform FDI. Host countries with a greater labor endowment tend to experiencea larger increase in the exports of multinational affiliates.
15 One drawback of the BEA export data is that it does not distinguish between integrated export markets and the rest of the world. As a result, the
effect of economic integration is estimated based on U.S. multinationals’ exports to all third countries (countries other than the host and home countries).
Explanatory variables are accordingly adjusted for this estimation. First, the host country’s GDP is no longer included on the right-hand side. Second, the
U.S. market is also excluded from the measure of market potential, because the current dependent variable, i.e., multinationals’ exports to third countries,
does not include the exports back to the U.S. For the same reason, the U.S. tariff rates on the host country are also dropped from the estimation. As a
robustness check, the paper considered including the host country’s GDP in the regressions and found it does not have a significant effect.16 The size of the sample is significantly reduced because of the missing values in the export data.
ARTICLE IN PRESS
Table 5The impact of regional economic integration on export-platform FDI
Dependent variable: Exports to third countries OLS OLS OLS Nonlinear LS
KL endowment ratio �0:49� �0:71� �0:46� �0:79�
(0.29) (0.39) (0.26) (0.51)
KL endowment ratio� capital intensity 2.20 1.99 2.32 3.69
(3.89) (3.88) (3.89) (3.89)
Capital intensity �15:38 �14:61 �18:79 �34:09
(44.18) (44.03) (44.13) (44.08)
Corporate tax �0:01 �0:03 �0:00 0.00
(0.06) (0.06) (0.06) (0.06)
Freight �0:13� �0:14� �0:14� �0:12
(0.08) (0.08) (0.08) (0.10)
Host country’s tariff on the U.S. 0:22��� 0:24��� 0:22��� 0:24���
(0.07) (0.07) (0.07) (0.07)
PTA with third countries 0:39���
(0.11)
Number of integrated third countries 0:36���
(0.09)
Integrated export market potential 0:02���
(0.00)
Aggregate export market potential 0:57�
(0.35)
Weight of other PTA partners (o2) 0:92��
(0.50)
Weight of ROW (o3) 0.02
(0.02)
Country-industry fixed effect Yes Yes Yes Yes
Year fixed effect Yes Yes Yes Yes
Number of observations 830 830 830 830
R square 0.96 0.96 0.96 0.96
Root MSE 0.49 0.49 0.49 0.49
Notes: (i) Integrated export market potential �P
jai;h PTAijt �Yjt
tij
� �, agg. export market potential � Me
it is defined in Eq. (5); (ii) all variables are measured in
natural log except capital intensity and PTA dummy; (iii) standard errors are reported in the parentheses; (iv) ��� , �� , and * represent significance at 1%, 5%,
and 10% level, respectively.
M.X. Chen / European Economic Review 53 (2009) 355–375366
5. Sensitivity analysis
5.1. Including additional source countries
The empirical results have so far been obtained based on U.S. multinationals’ activities abroad. This section explores thesensitivity of the results by including additional source countries, namely, Germany, Italy, Portugal, Finland, and Japan. The choiceof these countries is determined by the availability of affiliate sales data obtained from the OECD FDI database.17
The inclusion of these source countries, in particular, Germany, Italy, Portugal, and Finland, allows the paper to estimate theeffect of PTAs (in particular, the EU) on intra- and extra-bloc FDI using a broader set of home countries. Note, however, because ofthe large number of missing values at the sector level, the analysis here is based on country-level affiliate sales. The explanatoryvariables are accordingly adjusted for this change and closely follow the existing literature (e.g., Brainard, 1997; Carr et al., 2001).
The results are presented in Table 6. As seen in the last column, while the host country’s aggregate market potentialcontinues to have a positive effect on the level of affiliate sales, the PTA formed between home and host countries is found toexert a negative effect. This finding implies that the formation of a PTA can significantly lower MNCs’ tariff-jumping motive inthe integrated bloc and, furthermore, by raising the FDI from outside multinationals lead to a replacement effect on inside firms.
5.2. Alternative measure of FDI: FDI inflow
In addition to multinationals’ affiliate sales and exports, the effect of economic integration should also be reflected inthe flows of FDI. This section considers FDI flow as an alternative dependent variable and examines whether regionaleconomic integration leads to additional entries and investments by outside multinationals.18
17 The UNCTAD FDI database has also been considered. It has a similar coverage as the OECD dataset.18 This also helps the paper establish that the results obtained in the previous sections are not solely driven by the effect of reduced trade barriers on
exports of existing firms but also firms’ increasing concentration and investments in the region.

ARTICLE IN PRESS
Table 6Sensitivity analysis I: Including non-U.S. multinationals
Dependent variable: Affiliate sales OLS OLS OLS Nonlinear LS
KL endowment ratio difference �0:50 �0:49 �0:50 �0:48���
(0.33) (0.33) (0.34) (0.16)
Corporate tax �0:41 �0:40 �0:39 �0:38
(0.33) (0.33) (0.33) (0.35)
Distance �1:14��� �1:12��� �1:12��� �1:18���
(0.12) (0.13) (0.09) (0.08)
Ave. of host- and home-country GDP 1.48 1.59 1.69 1.82
(1.29) (1.30) (1.25) (1.51)
Diff. of host- and home-country GDP �0:34��� �0:34��� �0:33��� �0:31���
(0.06) (0.05) (0.05) (0.04)
PTA between host and home country �0:05 �0:06
(0.28) (0.29)
PTA between host and third countries 0.59**
(0.31)
Host’s number of PTA partners 0.004
(0.00)
Host’s integrated market potential 0:03���
(0.01)
Host’s aggregate market potential 1:72���
(0.62)
Weight of PTA with home (o1) �0:05��
(0.02)
Weight of other PTA partners (o2) 0:31���
(0.06)
Weight of ROW (o3) 0:22��
(0.12)
Host-country fixed effect Yes Yes Yes Yes
Home-country fixed effect Yes Yes Yes Yes
Year fixed effect Yes Yes Yes Yes
Number of observations 949 949 949 949
R square 0.89 0.89 0.89 0.89
Root MSE 1.18 1.18 1.18 1.17
Notes: (i) Integrated market potential � Yit þ PTAiht �YhttihþP
jai;h PTAijt �Yjt
tij
� �, aggregate market potential � Mit is defined in Eq. (2); (ii) all variables are
measured in natural log except capital intensity and PTA dummy; (iii) standard errors are reported in the parentheses; (iv) ��� , �� , and * represent
significance at 1%, 5%, and 10% level, respectively.
M.X. Chen / European Economic Review 53 (2009) 355–375 367
Results are obtained for all the available OECD countries. As seen in Table 7, regional economic integration does lead to agreater amount of FDI inflow to the integrated countries. This effect also rises with the number of PTA partners the hostcountry has (see the third column) and the size of the PTA partners (see the fourth column). The PTA between home andhost countries, however, does not have a significant effect on the level of FDI flow. These findings are similarly shown in thelast column where the market size of PTA partners is separated from that of the rest of the world. The results there indicatethat while a host country’s aggregate market potential is positively associated with its receipt of FDI flow, the importance ofexport markets is greater when they have a preferential trade relationship with the host country.
5.3. Poisson quasi-MLE
The paper has so far used either linear or nonlinear least-square estimations. As a robustness analysis, this sectionconsiders Poisson quasi-MLE (QMLE) as an alternative estimator. The study by Santos Silva and Tenreyaro (2006) points outthat Poisson QMLE can be more attractive than least-square estimators when the variance of the error term is a function ofthe covariates, in which case the conditional expectation of the logged error term in the log-form estimation equation willnot be zero. Head and Ries (2008) have adopted this approach and found that estimates produced in this method are smallerthan the least-square estimates and remarkably robust to the treatment of zeros and missing values in the FDI data.19
This section follows Head and Ries (2008) and uses the fixed-effect Poisson QMLE. Results are obtained for both U.S.multinationals’ affiliate sales and exports to third countries and reported in Table 8.20 Similar to the findings of Head andRies (2008), most parameters in Table 8, such as the coefficient of host-country capital–labor ratio, have decreased in
19 More details on the robustness and efficiency properties of Poisson QMLE are provided in Wooldridge (2001).20 The Poisson QMLE has also been used to estimate FDI from the countries considered in Sections 5.1 and 5.2. The results are largely similar to Table 7.

ARTICLE IN PRESS
Table 7Sensitivity analysis II: The impact of regional economic integration on FDI flow
Dependent variable: FDI inflow OLS OLS OLS Nonlinear LS
KL endowment ratio difference �0:22��� �0:11 �0:10 �0:11
(0.07) (0.07) (0.07) (0.08)
Corporate tax 0.05 �0:02 0.03 �0:03
(0.22) (0.22) (0.22) (0.22)
Distance �1:77��� �1:79��� �1:74��� �1:84���
(0.06) (0.06) (0.05) (0.06)
Ave. of host- and home-country GDP 2:29��� 2:84��� 2:68��� 2:61���
(0.66) (0.70) (0.68) (0.73)
Diff. of host- and home-country GDP �0:35��� �0:33��� �0:32��� �0:33���
(0.04) (0.04) (0.04) (0.04)
PTA between host and home country �0:09 �0:23
(0.14) (0.15)
PTA between host and third countries 0:43���
(0.17)
Host’s number of PTA partners 0:02���
(0.01)
Host’s integrated market potential 0:03���
(0.01)
Host’s aggregate market potential 3:72��
(2.07)
Weight of PTA with home (o1) 1.90
(1.37)
Weight of other PTA partners (o2) 5:01���
(0.88)
Weight of ROW (o3) 3:92 � ��
(0.56)
Host-country fixed effect Yes Yes Yes Yes
Home-country fixed effect Yes Yes Yes Yes
Year fixed effect Yes Yes Yes Yes
Number of observations 12,660 12,660 12,660 12,660
R square 0.45 0.44 0.44 0.45
Root MSE 4.03 4.03 4.03 4.03
Notes: (i) Integrated market potential � Yit þ PTAiht �Yht
tihþP
jai;h PTAijt �Yjt
tij
� �, aggregate market potential � Mit is defined in Eq. (2); (ii) all variables are
measured in natural log except capital intensity and PTA dummy; (iii) standard errors are reported in the parentheses; (iv) ��� , �� , and � represent
significance at 1%, 5%, and 10% level, respectively.
M.X. Chen / European Economic Review 53 (2009) 355–375368
magnitude compared to the estimates in Tables 3 and 5. The parameter of integrated market potential is, however, adjustedupward in some cases. Countries integrated with a larger number of partners or partners with a larger market sizeexperience a greater increase in the activities of outside multinationals.
5.4. Omitted variables
As described in Section 2, this paper includes country-industry and year fixed effects in all estimations to, respectively,control for sectoral host-country variables and time factors that may have a significant effect on multinationals’ activities.However, the issue of omitted variables can still arise in the existing econometric framework. For example, it is possiblethat the estimated effect of PTA on host countries’ market potential has captured the effect of some other factors such asborder and language. It is also possible that the current measure of market potential has excluded some important marketcharacteristics, such as the degree of competition, which can significantly affect the demand in host countries and theirability to attract multinationals. To account for these issues, this section adopts an approach considered in Head and Mayer(2004) and constructs a generalized measure of market potential (and export market potential) for each host country.
The procedure proceeds in two steps. First, a standard trade equation is estimated where the dependent variable is thenatural log of imports of country j from country i denoted by Qijt. More specifically, the equation is characterized as
Qijt ¼ EXit þ IMjt þ lZijt þ �ijt , (6)
where lZijt � l1 ln tij þ l2Bij þ l3Bij � Lij þ l4PTAijt . In the above equation, EXit denotes the exporter-year fixed effect, IMjt
represents the importer-year fixed effect, and Zijt is a vector of bilateral market access variables. In particular, Zijt includesln tij, the natural log of distance between the capitals of the importer and exporter countries, Bij, a dummy variable that isequal to 1 if the trading countries share a border and 0 otherwise, and Lij, a dummy variable that is equal to 1 when the twocountries share a common language. Furthermore, following Head and Mayer (2004), the equation allows the border effect

ARTICLE IN PRESS
Table 8Sensitivity analysis III: Estimation results based on the Poisson Quasi-MLE
Dependent variable: (1) Affiliates sales; (2) exports to third countries Poisson QMLE
(1) (2)
KL endowment ratio 0.11 �0:08�� �0:14 0.57
(0.44) (0.04) (1.21) (1.14)
KL endowment ratio� capital intensity 0.59 0.37 �0:26 �1:60
(2.82) (2.99) (7.31) (4.63)
Capital intensity 0.44 3.38 12.24 25.82
(32.55) (34.30) (82.90) (48.67)
Corporate tax �0:00 �0:01 0.12 0.09
(0.04) (0.04) (0.07) (0.07)
Freight �0:11��� �0:11��� �0:17�� �0:23���
(0.05) (0.05) (0.10) (0.07)
Host country’s tariff on the U.S. 0:04� 0:05� 0:19�� 0:16���
(0.02) (0.03) (0.08) (0.06)
U.S. tariff on the host country 0.00 �0:01
(0.04) (0.04)
Domestic market size 1:88���
(0.29)
PTA with the U.S. 0.25
(0.25)
Number of integrated third countries 0:02�� 0:07��
(0.01) (0.03)
Integrated market potential 2:00���
(0.32)
Integrated export market potential 0:01��
(0.00)
Country-industry fixed effect Yes Yes Yes Yes
Year fixed effect Yes Yes Yes Yes
Number of observations 1450 1450 1450 1450
Wald chi2 880.1 992.7 490.2 503.4
Prob4chi2 0.00 0.00 0.00 0.00
Notes: (i) Integrated market potential � Yit þ PTAiht �YhttihþP
jai;h PTAijt �Yjt
tij
� �, integrated export market potential �
Pjai;h PTAijt �
Yjt
tij
� �; (ii) dependent
variable is measured in absolute level, and explanatory variables are measured in natural log except capital intensity and PTA dummy; (iii) standard errors
are reported in the parentheses; (iv) ��� , �� , and * represent significance at 1%, 5%, and 10% level, respectively.
M.X. Chen / European Economic Review 53 (2009) 355–375 369
to differ across importing countries dependent on whether it speaks the same language as the exporting country. Thishypothesis has been largely supported by the empirical literature; see, for example, Chen (2004).
To estimate Eq. (6), a dataset that covers the trade flows between 80 countries is used. The results are reported inTable 9. As shown, the estimated effect of bilateral market access, including distance, border, language and PTA, is broadlyconsistent with the vast literature that estimates trade flows using gravity equation.21 These estimates, along with theestimated importer-year fixed effect cIMjt , are used in the second stage to construct a generalized measure of marketpotential.
Specifically, in the second stage expðcIMjtÞ (which takes into account factors such as the degree of market competition) isadopted as a proxy for the importing country’s market demand in a particular year, and exp½bl1 ln tij þ Bijð
bl2 þbl3LijÞ� (which
takes into account the relative importance of distance, border and language in trade) is used as a proxy for the trade cost forcountry i to export to country j. The product of these two factors, exp½cIMjt þ
bl1 ln tij þ Bijðbl2 þ
bl3Lij�, represents the trade-cost weighted import demand in market j faced by exporters in country i, i.e., bYjt=btij. Then, using the estimates of bYjt=btij theaggregate market potential for each host country i defined in Eq. (2) is rewritten as
bMit �bYit þo1PTAiht
bYhtbtihþXjai;h
o2PTAijt
bYjtbtij
" #þXjai
o3ð1� PTAijtÞbYjtbtij
" #, (7)
where each potential importing country’s demand is further weighted by its PTA status with host country i. Similarly, theexport market potential defined in Eq. (5) becomes
bMe
it �Xjai;h
o2PTAijt
bYjtbtijþo3ð1� PTAijtÞ
bYjtbtij
" #. (8)
21 For a comprehensive review in this area, see, for example, Anderson and van Wincoop (2004).

ARTICLE IN PRESS
Table 10Sensitivity analysis IV: Addressing omitted variables (the second-stage estimation with a generalized measure of market potential)
Dependent variable: (1) Affiliate sales; (2) exports to third countries Nonlinear LS
(1) (2)
KL endowment ratio �1:00��� �0:63�
(0.31) (0.35)
KL endowment ratio� capital intensity 4:64�� 1.15
(2.24) (3.99)
Capital intensity �44:49�� �5:80
(25.03) (45.33)
Corporate tax 0.05 �0:05
(0.04) (0.06)
Freight �0:13��� �0:12
(0.05) (0.10)
Host country’s tariff on the U.S. 0:09� 0:21���
(0.05) (0.07)
U.S. tariff on the host country �0:14��
(0.07)
Aggregate market potential 0:89���
(0.27)
Aggregate export market potential 0:16�
(0.10)
Weight of PTA with home (o1) 0.15
(0.67)
Weight of other PTA partners (o2) 0:34�� 0:16�
(0.18) (0.09)
Weight of ROW (o3) �1:06��� 0.10
(0.29) (0.17)
Country-industry fixed effect Yes Yes
Year fixed effect Yes Yes
Number of observations 1450 830
R square 0.97 0.96
Root MSE 0.49 0.49
Notes: (i) Agg. market potential � bMit is defined in Eq. (7), agg. export market potential � bMe
it is defined in Eq. (8); (ii) all variables are measured in natural
logs except capital intensity; (iii) standard errors are reported in the parentheses; (iv) ��� , �� , and � represent significance at 1%, 5%, and 10% level,
respectively.
Table 9Sensitivity analysis IV: Addressing omitted variables (the first-stage trade equation)
Dependent variable: Imports OLS
Distance �1:346���
(0.042)
Border 0:636���
(0.058)
Border� language 0:919���
(0.029)
PTA dummy 0:298���
(0.039)
Exporter-year fixed effect Yes
Importer-year fixed effect Yes
Number of observations 56,044
R square 0.60
Root MSE 1.86
Notes: (i) Standards errors are reported in the parentheses; (ii) ��� , �� , and � represent significant at 1%, 5%, and 10%, respectively.
M.X. Chen / European Economic Review 53 (2009) 355–375370
As in Section 4, the goal is to estimate o1, o2 and o3—the importance of PTA partners relative to the rest of the world indetermining a country’s ability to attract multinationals.
As shown in Table 10, host countries’ aggregate market potential bMit is positively correlated with U.S. multinationals’affiliate sales. The market demand in the PTA partners, in particular, provides a powerful stimulus to multinationals,whereas the market size of unintegrated countries appears to reduce multinationals’ activities in the host country. Thisresult is not surprising because when the host countries do not have preferential market access to a foreign market, themultinational firm may find it more profitable to serve that foreign market through local production than exports from its

ARTICLE IN PRESS
M.X. Chen / European Economic Review 53 (2009) 355–375 371
existing affiliates. This decision will in turn dilute the sales of the multinational firm in the existing host countries. Hostcountries’ export market potential bMe
it is also found to be positively correlated with multinationals’ export-platform FDI.The market demand of PTA partners, in particular, contributes significantly to a country’s receipt of export-platform FDI.
5.5. Endogeneity of economic integration
The concern of endogeneity of PTA may also arise in the context of this paper. There are two potential sources ofendogeneity. First, a host country’s PTA status or market potential in its PTA partners can be correlated with unobservedfactors in the residual term. The approach adopted in the above section, to a certain extent, accounted for this issue.However, the causality between a country’s PTA status and its receipt of FDI may still be questionable. It can be argued thatcountries’ adoption of PTAs is an effort to attract outside multinationals. This section thus employs the IV method to correctfor the potential endogeneity of PTA and establish the causal effect of PTA on multinationals’ affiliate sales.
While a large theoretical literature has been established to address the economic determinants of PTAs (see, e.g., theseminal work by Krugman, 1991a, b; Frankel, 1997; Frankel et al., 1995, 1996, 1998), the empirical literature on this topic isonly recently built by Magee (2003) and Baier and Bergstrand (2004, 2007). This paper follows the theoretical andeconometric framework of Baier and Bergstrand (2004) and estimates the determinants of two countries’ sharing of a PTA,PTAijt . As in Baier and Bergstrand (2004), the paper considers that two countries will form a PTA only if the PTA leads to apositive net welfare gain for both countries and that the level of welfare gain is a function of trade creation and tradediversion.
In particular, three categories of economic determinants are included. First, countries with a similarly large market sizeare expected to experience a greater trade creation from the formation of a PTA and thus have a higher probability ofreaching an agreement. Countries with a large difference in factor endowment (and consequently in comparativeadvantage) are also predicted to derive a greater trade creation after forming a PTA. Their differences in factor endowmentfrom the rest of the world are, however, expected to increase the possibility of trade diversion and decrease the probabilityof a PTA. Finally, the welfare gain from forming a PTA is predicted to be greater between natural trading partners,i.e., countries that are geographically close to each other but remote from the rest of the world.
In addition to the above economic determinants, a political variable is included in the estimation of PTA. A large politicalscience literature (see, e.g., Gowa and Mansfield, 1993) argues that PTAs generate a ‘‘security’’ externality and nations oftenchoose to internalize this externality by forming a PTA with an ally. This argument suggests that countries with a closerpolitical alliance are more likely to form PTAs. To measure the degree of political alliance between two countries, this paperadopts the ‘‘affinity’’ index described in Gartzke et al. (1999). This index represents countries’ similarity in votes at theUnited Nations’ General Assembly.22
The exact estimation equation is as follows:
PrðPTAijt ¼ 1Þ ¼ F y1 �1
2ðln Yit þ ln YjtÞ þ y2j ln Yit � ln Yjtj þ y3 ln
Kit
Lit� ln
Kjt
Ljt
���� �����
þy4 �1
2
Xk¼i;j
lnKkt
Lkt� ln
KROW ;t
LROW ;t
���� ����þ y5 ln tij þ y6remoteij þ y7allianceijt þ �ijt
35. (9)
In this equation, Fð:Þ denotes the cumulative probability function, 1=2ðln Yit þ ln YjtÞ represents two countries’ average innatural-log GDP, j ln Yit � ln Yjtj is their absolute difference, j lnðKit=LitÞ � lnðKjt=LjtÞj reflects two countries’ difference infactor endowment ratio,23 and 1=2
Pk¼i;j j lnðKkt=LktÞ � lnðKROW ;t=LROW ;tÞj is their difference from the rest of the world.
Furthermore, the estimation equation includes ln tij, the distance between two countries’ capital cities, and remoteij, theirremoteness from the rest of world, with
remoteij � continentij �1
2lnXkai;j
tik=ðN � 1Þ þ lnXkai;j
tjk=ðN � 1Þ
24 35, (10)
where continentij is a dummy variable that is equal to 1 if countries i and j are located in the same continent and 0otherwise. The political alliance variable is denoted by allianceijt and is an index that varies between �1 and 1. A highervalue of the affinity index represents a greater similarity in two countries’ votes at the United Nations General Assembly.
An additional note needs to be made about the estimation of Eq. (9). Because the dependent variable, PTAijt , is countries’status in sharing a PTA at a certain time, it is possible that this variable has a causal effect on some of the explanatoryvariables, such as GDP, and lead to potential endogeneity. To avoid this possibility, the explanatory variables are lagged by10 years such that the data are taken from far enough in the past for most countries.24 An alternative approach is to
22 The level of political alliance may also affect two countries’ probability of sharing a PTA through influencing the negotiation costs.23 The square of this variable is also included in the estimation to examine if the correlation between countries’ factor endowment difference and
probability of having a PTA is monotonic.24 However, for countries that formed a PTA before 1986, i.e., the initial EU members, the endogeneity of the explanatory variables may still exist.
Hence, as discussed next an alternative approach that estimates the decision to form a PTA instead of the status of sharing a PTA is adopted.
ARTICLE IN PRESS
Table 11Sensitivity analysis V: Addressing potential endogeneity of PTA (the first-stage estimation of the probability of PTA)
Dependent variable: (1) PTA; (2) PTA decision (1) (2)
Probit FE linear prob Probit FE linear prob
GDP average 0:317��� 0:222��� 0:145��� 0:058���
(0.009) (0.015) (0.022) (0.004)
Difference in GDP �0:111��� 0.016 �0:117��� �0:005
(0.009) (0.014) (0.020) (0.004)
Difference in KL endowment ratio 0:904��� 0:074��� 0:837��� 0:034���
(0.049) (0.029) (0.117) (0.008)
Squared difference in KL endowment ratio �0:306��� �0:008 �0:282��� �0:003��
(0.014) (0.005) (0.039) (0.002)
Difference in KL endowment ratio from the ROW 0:266��� 0:112��� 0:088� 0:027���
(0.023) (0.043) (0.049) (0.010)
Distance �0:976��� – �0:567��� –
(0.022) (0.037)
Remoteness 0:078��� – 0:034��� –
(0.004) (0.008)
Affinity 0:419��� 0:114��� 0:352��� 0:013��
(0.055) (0.033) (0.118) (0.007)
Pair fixed effect No Yes No Yes
Number of observations 29,120 29,120 25,727 25,727
(Pseudo) R square 0.55 0.77 0.25 0.15
Log likelihood �5704:3 – �1185:4 –
Notes: (i) Standards errors are reported in the parentheses; (ii) ��� , �� , and � represent significant at 1%, 5%, and 10%, respectively.
M.X. Chen / European Economic Review 53 (2009) 355–375372
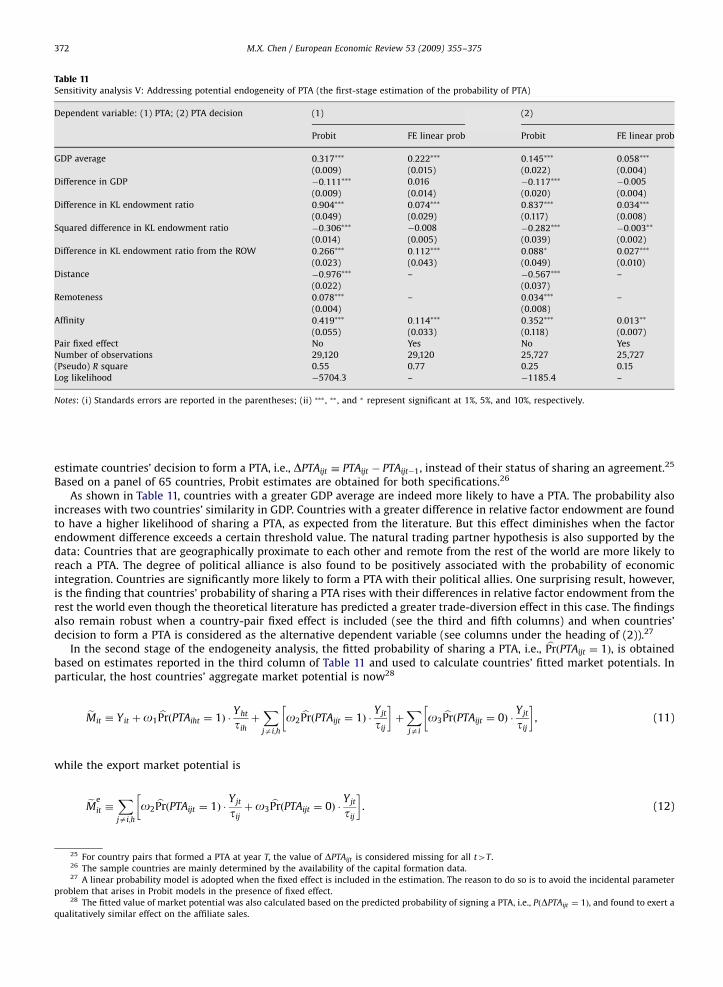
estimate countries’ decision to form a PTA, i.e., DPTAijt � PTAijt � PTAijt�1, instead of their status of sharing an agreement.25
Based on a panel of 65 countries, Probit estimates are obtained for both specifications.26
As shown in Table 11, countries with a greater GDP average are indeed more likely to have a PTA. The probability alsoincreases with two countries’ similarity in GDP. Countries with a greater difference in relative factor endowment are foundto have a higher likelihood of sharing a PTA, as expected from the literature. But this effect diminishes when the factorendowment difference exceeds a certain threshold value. The natural trading partner hypothesis is also supported by thedata: Countries that are geographically proximate to each other and remote from the rest of the world are more likely toreach a PTA. The degree of political alliance is also found to be positively associated with the probability of economicintegration. Countries are significantly more likely to form a PTA with their political allies. One surprising result, however,is the finding that countries’ probability of sharing a PTA rises with their differences in relative factor endowment from therest the world even though the theoretical literature has predicted a greater trade-diversion effect in this case. The findingsalso remain robust when a country-pair fixed effect is included (see the third and fifth columns) and when countries’decision to form a PTA is considered as the alternative dependent variable (see columns under the heading of (2)).27
In the second stage of the endogeneity analysis, the fitted probability of sharing a PTA, i.e., bPrðPTAijt ¼ 1Þ, is obtainedbased on estimates reported in the third column of Table 11 and used to calculate countries’ fitted market potentials. Inparticular, the host countries’ aggregate market potential is now28
eMit � Yit þo1bPrðPTAiht ¼ 1Þ �
Yht
tihþXjai;h
o2bPrðPTAijt ¼ 1Þ �
Yjt
tij
� �þXjai
o3bPrðPTAijt ¼ 0Þ �
Yjt
tij
� �, (11)
while the export market potential is
eMe
it �Xjai;h
o2bPrðPTAijt ¼ 1Þ �
Yjt
tijþo3
bPrðPTAijt ¼ 0Þ �Yjt
tij
� �. (12)
25 For country pairs that formed a PTA at year T, the value of DPTAijt is considered missing for all t4T.26 The sample countries are mainly determined by the availability of the capital formation data.27 A linear probability model is adopted when the fixed effect is included in the estimation. The reason to do so is to avoid the incidental parameter
problem that arises in Probit models in the presence of fixed effect.28 The fitted value of market potential was also calculated based on the predicted probability of signing a PTA, i.e., PðDPTAijt ¼ 1Þ, and found to exert a
qualitatively similar effect on the affiliate sales.
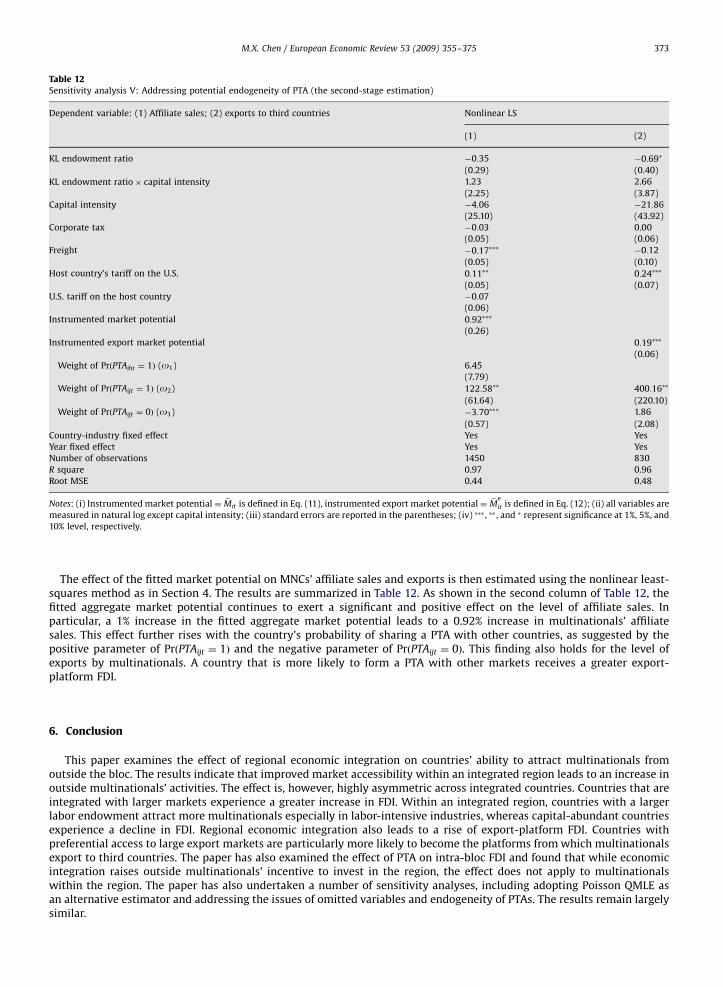
ARTICLE IN PRESS
Table 12Sensitivity analysis V: Addressing potential endogeneity of PTA (the second-stage estimation)
Dependent variable: (1) Affiliate sales; (2) exports to third countries Nonlinear LS
(1) (2)
KL endowment ratio �0:35 �0:69�
(0.29) (0.40)
KL endowment ratio� capital intensity 1.23 2.66
(2.25) (3.87)
Capital intensity �4:06 �21:86
(25.10) (43.92)
Corporate tax �0:03 0.00
(0.05) (0.06)
Freight �0:17��� �0:12
(0.05) (0.10)
Host country’s tariff on the U.S. 0:11�� 0:24���
(0.05) (0.07)
U.S. tariff on the host country �0:07
(0.06)
Instrumented market potential 0:92���
(0.26)
Instrumented export market potential 0:19���
(0.06)
Weight of PrðPTAiht ¼ 1Þ (o1) 6.45
(7.79)
Weight of PrðPTAijt ¼ 1Þ (o2) 122:58�� 400:16��
(61.64) (220.10)
Weight of PrðPTAijt ¼ 0Þ (o3) �3:70��� 1.86
(0.57) (2.08)
Country-industry fixed effect Yes Yes
Year fixed effect Yes Yes
Number of observations 1450 830
R square 0.97 0.96
Root MSE 0.44 0.48
Notes: (i) Instrumented market potential � eMit is defined in Eq. (11), instrumented export market potential � eMe
it is defined in Eq. (12); (ii) all variables are
measured in natural log except capital intensity; (iii) standard errors are reported in the parentheses; (iv) ��� , �� , and � represent significance at 1%, 5%, and
10% level, respectively.
M.X. Chen / European Economic Review 53 (2009) 355–375 373
The effect of the fitted market potential on MNCs’ affiliate sales and exports is then estimated using the nonlinear least-squares method as in Section 4. The results are summarized in Table 12. As shown in the second column of Table 12, thefitted aggregate market potential continues to exert a significant and positive effect on the level of affiliate sales. Inparticular, a 1% increase in the fitted aggregate market potential leads to a 0.92% increase in multinationals’ affiliatesales. This effect further rises with the country’s probability of sharing a PTA with other countries, as suggested by thepositive parameter of PrðPTAijt ¼ 1Þ and the negative parameter of PrðPTAijt ¼ 0Þ. This finding also holds for the level ofexports by multinationals. A country that is more likely to form a PTA with other markets receives a greater export-platform FDI.
6. Conclusion
This paper examines the effect of regional economic integration on countries’ ability to attract multinationals fromoutside the bloc. The results indicate that improved market accessibility within an integrated region leads to an increase inoutside multinationals’ activities. The effect is, however, highly asymmetric across integrated countries. Countries that areintegrated with larger markets experience a greater increase in FDI. Within an integrated region, countries with a largerlabor endowment attract more multinationals especially in labor-intensive industries, whereas capital-abundant countriesexperience a decline in FDI. Regional economic integration also leads to a rise of export-platform FDI. Countries withpreferential access to large export markets are particularly more likely to become the platforms from which multinationalsexport to third countries. The paper has also examined the effect of PTA on intra-bloc FDI and found that while economicintegration raises outside multinationals’ incentive to invest in the region, the effect does not apply to multinationalswithin the region. The paper has also undertaken a number of sensitivity analyses, including adopting Poisson QMLE asan alternative estimator and addressing the issues of omitted variables and endogeneity of PTAs. The results remain largelysimilar.

ARTICLE IN PRESS
M.X. Chen / European Economic Review 53 (2009) 355–375374
The evidence presented in this paper conveys an important message to host-country policy makers. Not every countrybenefits from economic integration in their receipt of FDI. Some gain at the expense of others. Countries with a relativelylarge labor endowment or a favorable tax policy, for example, are likely to divert outside multinationals away from theirlabor-scarce and high-tax PTA partners. This effect can generate substantial economic consequences for both types ofcountries. Countries that do experience an increase in FDI may benefit from MNCs’ technology spillover to the domesticindustries, but often have to deal with the crowding-out effect of increased competition. Countries that witness a decreasein multinationals’ activities face the impacts of losing FDI, which include a potential increase in total unemployment. AsPTAs become an increasingly popular approach to liberalize trade, understanding firms’ location preferences in the contextof regional integration is crucial for countries’ selection of optimal preferential trading partners.
Acknowledgments
I am deeply grateful to Jonathan Eaton, Keith Maskus, Jim Markusen, Mike Moore, Aaditya Mattoo, Bob Goldfarb, PravinKrishna, and an anonymous referee for many valuable comments and suggestions. I also wish to thank the seminarparticipants at George Washington University, Georgetown University, SAIS of Johns Hopkins University, FloridaInternational University, and U.S. International Trade Commission for very helpful feedbacks and discussions.
Appendix A
Tables A1 and A2 list the countries and the PTAs included in the main dataset, respectively.
Table A1The list of countries in the sample
Argentina Finland Malaysia Spain
Australia France Mexico Sweden
Austria Germany Netherlands Switzerland
Belgium Greece New Zealand Taiwan
Brazil Hong Kong Norway Thailand
Canada Indonesia Peru Turkey
Chile Ireland Philippines United Kingdom
Colombia Israel Portugal Venezuela
Costa Rica Italy Singapore
Denmark Japan South Africa
Ecuador Luxembourg South Korea
Table A2The list of included preferential trade agreements
EC EC-Romania
EFTA EFTA-Romania
EC-Switzerland and Liechtenstein EFTA-Bulgaria
EC-Iceland EC-Bulgaria
EC-Norway NAFTA
EC-Algeria Costa Rica–Mexico
EC-Syria Canada–Israel
CER Turkey–Israel
United States–Israel Canada–Chile
EC-Andorra Turkey–Romania
MERCOSUR EC–Tunisia
EFTA–Turkey Mexico–Nicaragua
EFTA–Israel Turkey–Bulgaria

ARTICLE IN PRESS
M.X. Chen / European Economic Review 53 (2009) 355–375 375
References
Anderson, J., van Wincoop, E., 2004. Trade costs. Journal of Economic Literature 42 (3), 691–751.Baier, S.L., Bergstrand, J.H., 2004. Economic determinants of free trade agreements. Journal of International Economics 64 (1), 29–63.Baier, S.L., Bergstrand, J.H., 2007. Do free trade agreements actually increase members’ international trade? Journal of International Economics 71, 72–95.Barrel, R., Pain, N., 1999. Domestic institutions, agglomerations and foreign direct investment in Europe. European Economic Review 43, 925–934.Brainard, S.L., 1997. An empirical assessment of proximity-concentration trade-off between multinational sales and trade. American Economic Review 87,
520–544.Carr, D., Markusen, J., Maskus, K., 2001. Estimating the knowledge-capital model of the multinational enterprise. American Economic Review 91, 691–708.Chen, N., 2004. Intra-national versus international trade in the European Union: Why do national borders matter? Journal of International Economics 63
(1), 93–118.Ekholm, K., Forslid, R., Markusen, J., 2007. Export-platform foreign direct investment. Journal of European Economic Association 5 (4), 776–795.Feenstra, R., 1996. U.S. imports, 1972–1994: Data and concordance. NBER Working Paper #5515.Feinberg, S., Keane, M., 2001. U.S.–Canada trade liberalization and MNC production location. Review of Economics and Statistics 83 (1), 118–132.Frankel, J.A., 1997. Regional Trading Blocs. Institute for International Economics, Washington, DC.Frankel, J.A., Stein, E., Wei, S.-J., 1995. Trading blocs and the Americas: The natural, the unnatural, and the super-natural. Journal of Development
Economics 47 (1), 61–95.Frankel, J.A., Stein, E., Wei, S.-J., 1996. Regional trading arrangements: Natural or supernatural? American Economic Review 86 (2), 52–56.Frankel, J.A., Stein, E., Wei, S.-J., 1998. Continental trading blocs: Are they natural or supernatural? In: Frankel, J.A. (Ed.), The Regionalization of the World
Economy. The University of Chicago Press, Chicago, pp. 91–113.Gartzke, E., Jo, D.-J., Tucker, R., 1999. United Nations General Assembly Voting hhttp://www.vanderbilt.edu/�rtucker/data/affinity/un/assemblyi.Gowa, J., Mansfield, E.D., 1993. Power politics and international trade. American Political Science Review 87, 408–420.Hanson, G., 2005. Market potential, increasing returns, and geographic concentration. Journal of International Economics 67 (1), 1–24.Harris, C., 1954. The market as a factor in the localization of industry in the United States. Annals of the Association of American Geographers 64, 315–348.Head, K., Mayer, T., 2004. Market potential and the location of Japanese investment in the European Union. Review of Economics and Statistics 86 (4),
957–972.Head, K., Ries, J., 2008. FDI as an outcome of the market for corporate control: Theory and evidence. Journal of International Economics 74, 2–20.Helpman, E., 1984. A simple theory of trade with multinational corporations. Journal of Political Economy 92, 451–471.Hines Jr., J., Rice, E., 1994. Fiscal paradise: Foreign tax havens and American business. Quarterly Journal of Economics 109 (1), 149–182.Krugman, P., 1991a. Is bilateralism bad? In: Helpman, E., Razin, A. (Eds.), International Trade and Trade Policy. MIT Press, Cambridge, MA, pp. 9–23.Krugman, P., 1991b. The move toward free trade zones. In: Policy Implications of Trade and Currency Zones, Proceedings of a Federal Reserve Bank of
Kansas City Symposium, pp. 7–41.Krugman, P., 1992. A dynamic spatial model. National Bureau of Economic Research Working Paper #4219.Krugman, P., Venables, A., 1996. Integration, specialization, and adjustment. European Economic Review 40, 959–967.Leamer, E.E., 1984. Sources of International Comparative Advantage: Theory and Evidence. MIT Press, Cambridge, MA.Magee, C., 2003. Endogenous preferential trade agreements: An empirical analysis. Contributions to Economic Analysis and Policy 2 (1).Markusen, J., 1984. Multinationals, multi-plant economies, and the gains from trade. Journal of International Economics 16, 205–226.Markusen, J., Maskus, K., 1999. Discriminating among alternative theories of multinational enterprise. NBER Working Paper #7164.Markusen, J., Maskus, K., 2001. Multinational firms: Reconciling theory and evidence. In: Blomstrom, M., Goldberg, L. (Eds.), Topics in Empirical
International Economics: A Festschrift in Honor of Robert Lipsey. University of Chicago Press for NBER.Markusen, J., Venables, A., 2000. The theory of endowment, intra-industry and multi-national trade. Journal of International Economics 52, 209–234.Motta, M., Norman, G., 1996. Does economic integration cause foreign direct investment? International Economic Review 37, 757–783.Puga, D., Venables, A., 1997. Preferential trading arrangements and industrial location. Journal of International Economics 43, 346–368.Santos Silva, J., Tenreyaro, S., 2006. The log of gravity. Review of Economics and Statistics 88, 641–658.Wooldridge, J., 2001. Econometric Analysis of Cross Section and Panel Data. The MIT Press, Cambridge, MA.World Investment Report, 2005. United Nations Conference on Trade and Development.Yeaple, S., 2003. The role of skill endowments in the structure of U.S. outward foreign direct investment. Review of Economics and Statistics 85 (3),
726–734.