regional electricity and renewable integration: benefits ... - pineau.pdf · departement of...
TRANSCRIPT

DEPARTEMENT OF DECISION SCIENCES
Pierre-Olivier Pineau
Regional Electricity and Renewable
Integration: Benefits of Hydropower
Reservoirs
Tuesday, June 20th 2017 / 4:00 - 5:30 pm
40th IAEE International Conference
Concurrent Session 33. Energy and Water
Orchid: 4206 & 4306
with Sébastien DebiaLéonard LangloisSylvain Perron

2
Outline
1.The Electricity Challenge & New York
Case
2.Regional Electricity Models
3.Our Model
4.Results: Gains from Regional Integration

1. THE ELECTRICITY
CHALLENGE & NEW YORK
CASE
3

4
Global GHG Emissions 2010: 49 Gt CO2e
IPCC (2014)
Electricity & Heat
25%

5
Reduction Opportunities for the
Electricity Sector (from the IPCC)
• Increased Efficiency of Power Plants and Fuel
Switching
• Renewable Energy
• Increased Energy Efficiency (end-use)
• Nuclear Energy
• Carbon Capture Sequestration and Storage
… but not regional integration!
IPCC (2014) and EPA (2017)
6
Recent publications on electricity market
integration

7
Integrating Thermal and Hydro Electricity
Markets: Economic and Environmental Costs of
not Harmonizing Pricing Rules
E. Billette de Villemeur and P.-O. Pineau
2016 Volume 37, Number 1
>1 Mt of CO2
-37$/t of abatement cost

8
New York’s REV
• “50% of electricity consumed in New York to come
from renewable sources” (https://rev.ny.gov/)
• “50% of energy generation from renewable energy
sources” (https://energyplan.ny.gov/)

2. REGIONAL ELECTRICITY
MODELS
9
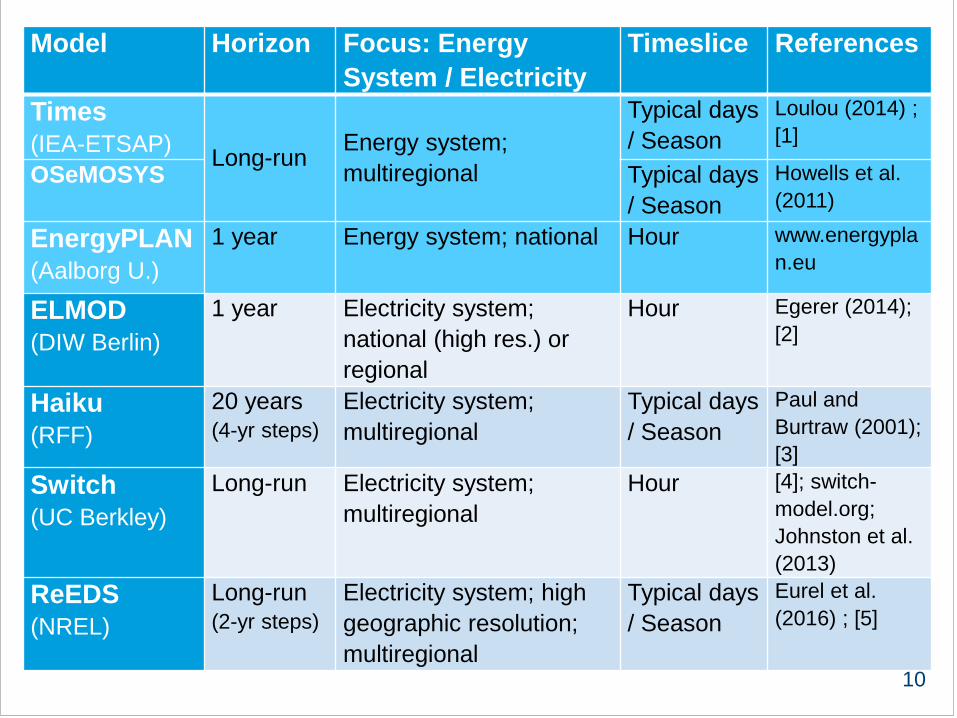
10
Model Horizon Focus: Energy
System / Electricity
Timeslice References
Times
(IEA-ETSAP)Long-run
Energy system;
multiregional
Typical days
/ Season
Loulou (2014) ;
[1]
OSeMOSYS Typical days
/ Season
Howells et al.
(2011)
EnergyPLAN
(Aalborg U.)
1 year Energy system; national Hour www.energypla
n.eu
ELMOD
(DIW Berlin)
1 year Electricity system;
national (high res.) or
regional
Hour Egerer (2014);
[2]
Haiku
(RFF)
20 years
(4-yr steps)
Electricity system;
multiregional
Typical days
/ Season
Paul and
Burtraw (2001);
[3]
Switch
(UC Berkley)
Long-run Electricity system;
multiregional
Hour [4]; switch-
model.org;
Johnston et al.
(2013)
ReEDS
(NREL)
Long-run
(2-yr steps)
Electricity system; high
geographic resolution;
multiregional
Typical days
/ Season
Eurel et al.
(2016) ; [5]

11
Renewable Integration Studies
2016
North American Renewable
Integration Study (NARIS)
NRCan / SNER / DoE-NREL
Final results for 2019

12
New York 140 TWh
41 % natural gas
1,7 % coal
New England 111 TWh
48 % natural gas
3,5 % coal
Ontario 154 TWh
10 % natural gas
New Brunswick 16 TWh
44 % fossil fuels
QC 200 TWh
99 % hydro27 large reservoirs
176 TWh of storage
QUEBEC ELECTRICITY PRODUCTION AND ITS NEIGHBORS (2015)

3. OUR MODEL
Renewable Integration and
Storage Assessment – RISA(Based on Tapia-Ahumada et al. 2015)
13
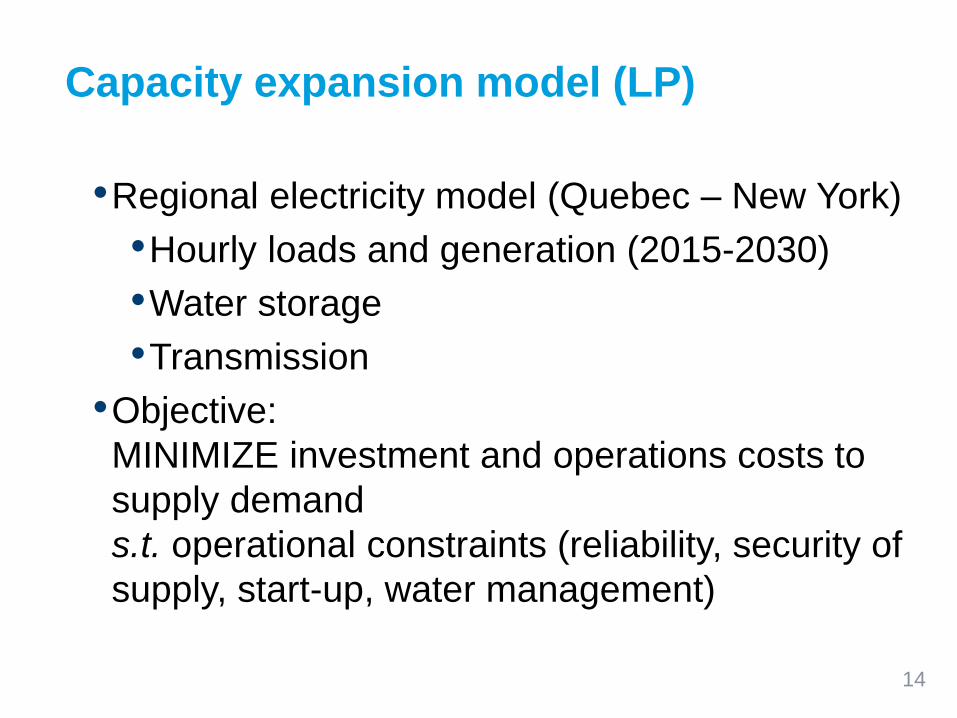
Capacity expansion model (LP)
•Regional electricity model (Quebec – New York)
•Hourly loads and generation (2015-2030)
•Water storage
•Transmission
•Objective:
MINIMIZE investment and operations costs to
supply demand
s.t. operational constraints (reliability, security of
supply, start-up, water management)
14

15
Scenarios
• RISA1: “BAU” no renewable energy constraint
• RISA2: 50% renewable generation in NY by 2030
• RISA5: Quebec imports count as renewable (no new transmission)
• RISA6: RISA5 + new transmission possible

4. RESULTS
16

35,62 $
37,45 $
36,20 $
35,54 $
34,50 $
35,00 $
35,50 $
36,00 $
36,50 $
37,00 $
37,50 $
38,00 $
RISA1 RISA2 RISA5 RISA6 17
Total Cost ($G)

0
5
10
15
20
25
30
35
40
45
50G
W
Solar
Wind
PS
ROR
FO2
NG - OC
NG - CC
FO6
NG - Steam
Coal
Ur
18
NY Capacity – RISA1

0
5
10
15
20
25
30
35
40
45
50
20
15
20
16
20
17
20
18
20
19
20
20
20
21
20
22
20
23
20
24
20
25
20
26
20
27
20
28
20
29
20
30
GW
Solar
Wind
PS
ROR
FO2
NG - OC
NG - CC
FO6
NG - Steam
Coal
Ur
19
NY Capacity – RISA2

0
5
10
15
20
25
30
35
40
45
50
20
15
20
16
20
17
20
18
20
19
20
20
20
21
20
22
20
23
20
24
20
25
20
26
20
27
20
28
20
29
20
30
GW
Solar
Wind
PS
ROR
FO2
NG - OC
NG - CC
FO6
NG - Steam
Coal
Ur
20
NY Capacity – RISA5
0
5
10
15
20
25
30
35
40
45
50
20
15
20
16
20
17
20
18
20
19
20
20
20
21
20
22
20
23
20
24
20
25
20
26
20
27
20
28
20
29
20
30
GW
Solar
Wind
PS
ROR
FO2
NG - OC
NG - CC
FO6
NG - Steam
Coal
Ur
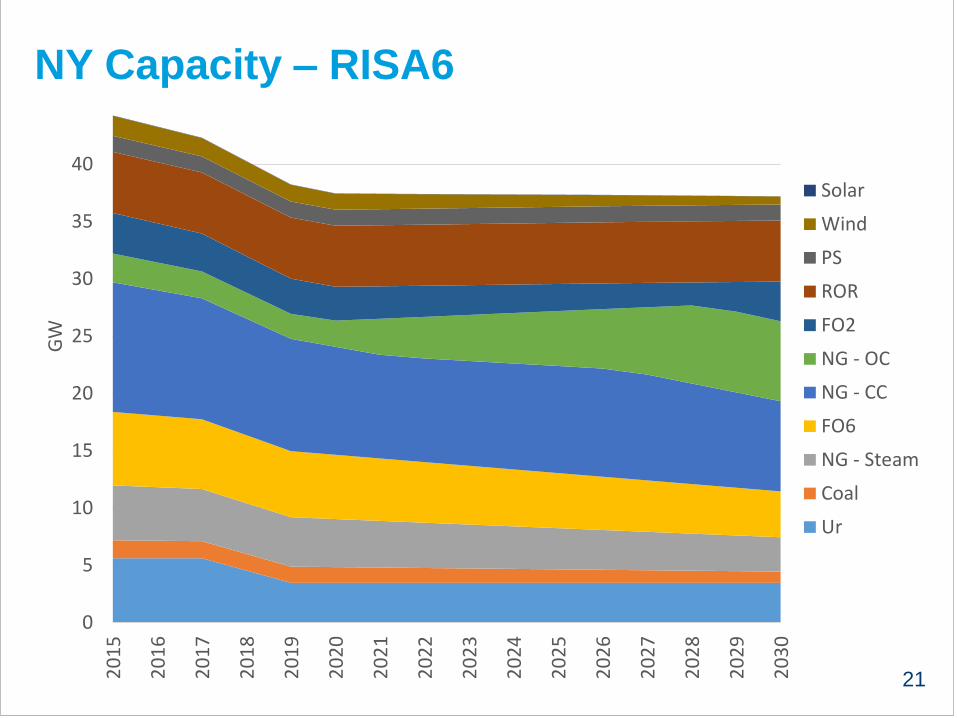
21
NY Capacity – RISA6

0,0
0,5
1,0
1,5
2,0
2,5
3,0
3,5
4,0
4,5
20
15
20
16
20
17
20
18
20
19
20
20
20
21
20
22
20
23
20
24
20
25
20
26
20
27
20
28
20
29
20
30
RISA1
RISA2
RISA5
RISA6
22
QC-NY Transmisison Capacity

0,0
5 000,0
10 000,0
15 000,0
20 000,0
25 000,0
30 000,0
35 000,0
20
15
20
16
20
17
20
18
20
19
20
20
20
21
20
22
20
23
20
24
20
25
20
26
20
27
20
28
20
29
20
30
RISA1
RISA2
RISA5
RISA6
RISA2 NY to QC
RISA5 NY to QC
RISA6 NY to QC
23
Quebec-NY Trade (GWh)

0
20 000
40 000
60 000
80 000
100 000
120 000
140 000
160 000G
Wh
Solar
Wind
PS
ROR
FO2
NG - OC
NG - CC
FO6
NG - Steam
Coal
Ur
24
NY Production – RISA1

0
20 000
40 000
60 000
80 000
100 000
120 000
140 000
160 000G
Wh
Solar
Wind
PS
ROR
FO2
NG - OC
NG - CC
FO6
NG - Steam
Coal
Ur
25
NY Production – RISA2

0
20 000
40 000
60 000
80 000
100 000
120 000
140 000
160 000G
Wh
Solar
Wind
PS
ROR
FO2
NG - OC
NG - CC
FO6
NG - Steam
Coal
Ur
26
NY Production – RISA5

0
20 000
40 000
60 000
80 000
100 000
120 000
140 000
160 000G
Wh
Solar
Wind
PS
ROR
FO2
NG - OC
NG - CC
FO6
NG - Steam
Coal
Ur
27
NY Production – RISA6

0,0
10,0
20,0
30,0
40,0
50,0
60,0
20
15
20
16
20
17
20
18
20
19
20
20
20
21
20
22
20
23
20
24
20
25
20
26
20
27
20
28
20
29
20
30
RISA1
RISA2
RISA5
RISA6
28
NY Prices ($/MWh)

0,0
5,0
10,0
15,0
20,0
25,0
30,0
35,0
40,0
45,0
50,0
20
15
20
16
20
17
20
18
20
19
20
20
20
21
20
22
20
23
20
24
20
25
20
26
20
27
20
28
20
29
20
30
RISA1
RISA2
RISA5
RISA6
29
Quebec Prices ($/MWh)
30
Conclusion
• Integration can decrease cost
• Renewable energy goals leads to some types of
“production leaks” (and possibly higher GHG emissions)
• Next steps:
• Add carbon constraints
• Better analyze hydropower’s role
• Add other regions
Your suggestions are welcome!