regional geophysical investigations in the la sal mountains area
TRANSCRIPT
Regional Geophysical
Investigations in the
La Sal Mountains Area
Utah and ColoradoBy J. E. CASE, H. R. JOESTING, and P. EDWARD BYERLY
GEOPHYSICAL FIELD INVESTIGATIONS
GEOLOGICAL SURVEY PROFESSIONAL PAPER 316-F
Prepared in cooperation with the U.S. Atomic Energy Commission
UNITED STATES GOVERNMENT PRINTING OFFICE, WASHINGTON : 1963

UNITED STATES DEPARTMENT OF THE INTERIOR
STEWART L. UDALL, Secretary
GEOLOGICAL SURVEY
Thomas B. Nolan, Director
For sale by the Superintendent of Documents, U.S. Government Printing OfficeWashington 25, D.C.

CONTENTSPage
Abstract-.,. _ __-_______-_-_-___--___-__._____-______ 91Introduction--____-._-_--__-_---_-_-___________-__-- 91Geology--________-----_-_---_-____-__.__ 93
Rocks of Precambrian age_______________________ 93Sedimentary rocks of pre-Hermosa age___________ 93Sedimentary rocks of Late Pennsylvanian and Per
mian age___-__--___-__---__-_--_____________ 94Sedimentary rocks of Mesozoic and Cenozoic age__ 96Igneous rocks of the La Sal Mountains.___________ 97Structural geology_-_-_-__--__-__--___--__-____- 98
Aeromagnetic surveys._-_-_-___-_-_--______________- 99Gravity surveys------------------------------------ 99
Horizontal control------------------------------ 99Elevation control------------------------------- 99Reduction of gravity data.______________________ 100Errors in gravity anomalies_-___---_______--_____ 100
Interpretation of the geophysical data.________________ 100Magnetic map_______-__--__--__-_________-___ 100Gravity anomaly map._-__---__-_--____-__-___-_ 100Regional magnetic and gravity anomalies._________ 101
Magnetic anomalies.----.------------------- 101Gravity anomalies--_---_-_-_---_--__--___-_ 102 Gravity and magnetic highs northwest of the
La Sal Mountains___--------____-___. 104
Interpretation of the geophysical data Continued Regional magnetic and gravity anomalies Con.
Gravity low near the Dolores River.__________ 305Gravity and magnetic highs southwest and
south of South Mountain-_-__-_____----__- 105Configuration of the basement surface.____________ 105Gravity and magnetic anomalies associated with the
salt anticlines____--_-----__-_-__--_ _______ 106Sinbad Valley-Fisher Valley salt anticline__ __ 106 Paradox Valley-Castle Valley salt anticline.___ 107 Pine Ridge-Pack Creek Valley-Spanish Valley
salt anticlines-___-_________-__ ________ 107Magnetic and gravity anomalies associated with
laccolithic intrusions______-____-_______-_-____ 108Magnetic anomalies___-__-__-_______-______- 108Gravity anomalies_--_---__--__-----_---__-- 112Gravity anomalies at North Mountain. _______ 113Gravity anomalies at Middle and South
Mountains....._--___-_____--_.___-__-___ 114Summary of conclusions.----------.--.------------.- 114References cited___--_---------_-_-_____-___.______- 115
ILLUSTRATIONS[Plates 14-17 In pocket)
PLATE 14. Generalized geologic map of La Sal Mountains area.
15. Aeromagnetic map of the La Sal Mountains area.16. Magnetic map of the La Sal Mountains area.17. Gravity anomaly map of the La Sal Mountains area.
FIQUKE 33. Index map of La Sal Mountains area__...34. Inferred configuration of Precambrian sur
face in the La Sal Mountains area.______35. Histograms of magnetic susceptibilities of
some intrusive rocks of the La Sal Moun tains. ________________________________
Page 92
95
98
Page FIGURE 36. Histogram of densities of intrusive igneous
rocks_______________ ____ ____ 9837. Two interpretations of the Wilson Mesa
regional gravity gradient.-______________ 10338. Analysis of the gravity anomaly at Fisher
Valley_......._ _. .......__.._... 10839. Analysis of the gravity anomaly at Castle
Valley .---_------_---------___- 10940. Analysis of the North Mountain magnetic
anomaly...__--_----_--_---------_--_- 11141. Analysis of the South Mountain magnetic
anomaly______-_--____-__--_--_-_----- 11242. Analysis of the gravity anomaly at North
Mountain __ _________________________ 113
TABLES
TABLE 1. Generalized geologic column-Page
94 TABLE 2. Magnetic susceptibilities of igneous rocks of La Sal Mountains____--__-----------
Pr«re
97in

GEOPHYSICAL FIELD INVESTIGATIONS
REGIONAL GEOPHYSICAL INVESTIGATIONS IN THE LA SAL MOUNTAINS AREA, UTAH AND COLORADO
By J. E. CASE, H. E. JOESTING, and P. EDWARD BYERLY
ABSTRACT
Regional gravity and aeromagnetic surveys covering about 1,000 square miles have been made in the La Sal Mountains area of southeast Utah and southwest Colorado as part of a program of geophysical studies of the Colorado Plateau. Major geologic features are the laccolithic La Sal Mountains, and parts of the northwestward-trending salt anticlines at Castle, Fisher, Spanish, Sinbad, and Paradox Valleys, and at Pine Ridge.
Sedimentary rocks exposed in the area include marine beds of Pennsylvanian and Permian (?) age; continental beds of Per mian, Triassic, Jurassic, and Early Cretaceous age; and ma rine beds of Late Cretaceous age. Marine beds of Mississippian, Devonian, and Cambrian age have been penetrated by deep wells. The densities of most of the sedimentary rocks range from 2.5 to 2.65 g per cm3, but evaporites of Pennsylvanian age, which form the cores of the salt anticlines, have densities of about 2.2 to 2.3 g per cm3 .
The igneous intrusions comprising the three laccolithic groups of the La Sal Mountains are of latest Cretaceous or early to middle Tertiary age. The intrusive rocks are diorite porphy ry, monzonite porphyry, and syenite porphyry. They have an average density of about 2.61 g per cm3 and an average mag netic susceptibility of about 0.002 cgs units, as determined by sampling.
The salt anticlines and the laccolithic intrusions at North and South Montains trend northwestward, parallel to the struc tural front of the Uncompahgre uplift and to the axis of Sagers Wash syncline. In these areas the igneous rocks were injected along the strike of older salt anticlines. Steepened regional gravity and magnetic gradients along Paradox Valley salt anti cline and North Mountain are apparently related to northwest ward-trending basement faults or warps, so that deep-seated structural control is indicated for the positions of the salt anti cline and the igneous intrusions.
Other prominent zones of steepened regional gravity gradi ents, which coincide in trend with magnetic contours, are also apparently related to structural and lithologic changes in the Precambrian basement rocks. These indicated basement struc tural zones trend east-west between South Mountain and Kane Springs Canyon and northeast between Pack Creek and North Mountain.
Basement rocks are probably shallower, and possibly more dense, south of and beneath the La Sal Mountains than at Polar Mesa and at Spanish, Fisher, and Sinbad Valleys. A broad zone of comparatively flat magnetic gradient extending beneath the La Sal Mountains indicates that the basement rocks are uni
formly magnetized and are probably of low to moderate mag netization.
The salt anticlines of the area are left-laterally offset alo^g a zone extending northeastward from Pack Creek past Pol^r Mesa. This zone of offset coincides with northeastward-trend ing gravity and magnetic contours, indicating that Pennsylra- nian, or earlier, faulting of the Precambrian basement may have occurred. The igneous intrusions at North Mountain were emplaced near the intersection of the inferred northeastward- trending basement fault with the northwestward-trending bare- ment fault which extends from Paradox Valley to North Moun tain.
Amplitudes of the salt cores of the anticlines at Fisher and Castle Valleys are indicated by gravity minima to be about 10,000 and 7,000 feet, respectively. Thickened salt of Castle Val ley anticline apparently extends beneath the northwest laccoliths of North Mountain and may be continuous at depth with thick ened salt of the Paradox Valley anticline. Thickened salt may also extend partly beneath South Mountain, according to avail able geologic and gravity evidence.
High-gradient magnetic anomalies closely reflect the are^.l pattern of the igneous intrusions of the mountains. Analysis of the anomaly at North Mountain indicates that the average aggregate thickness of the laccoliths, exclusive of a central feeder stock, is about 2,000 to 2,500 feet At South Mountain the maximum thickness of the laccoliths may be 4,000 to 5,000 feet. There is no magnetic indication of a parent body froti which the laccolithic complex was derived, therefore, any such body probably lies at comparatively great depth.
INTRODUCTION
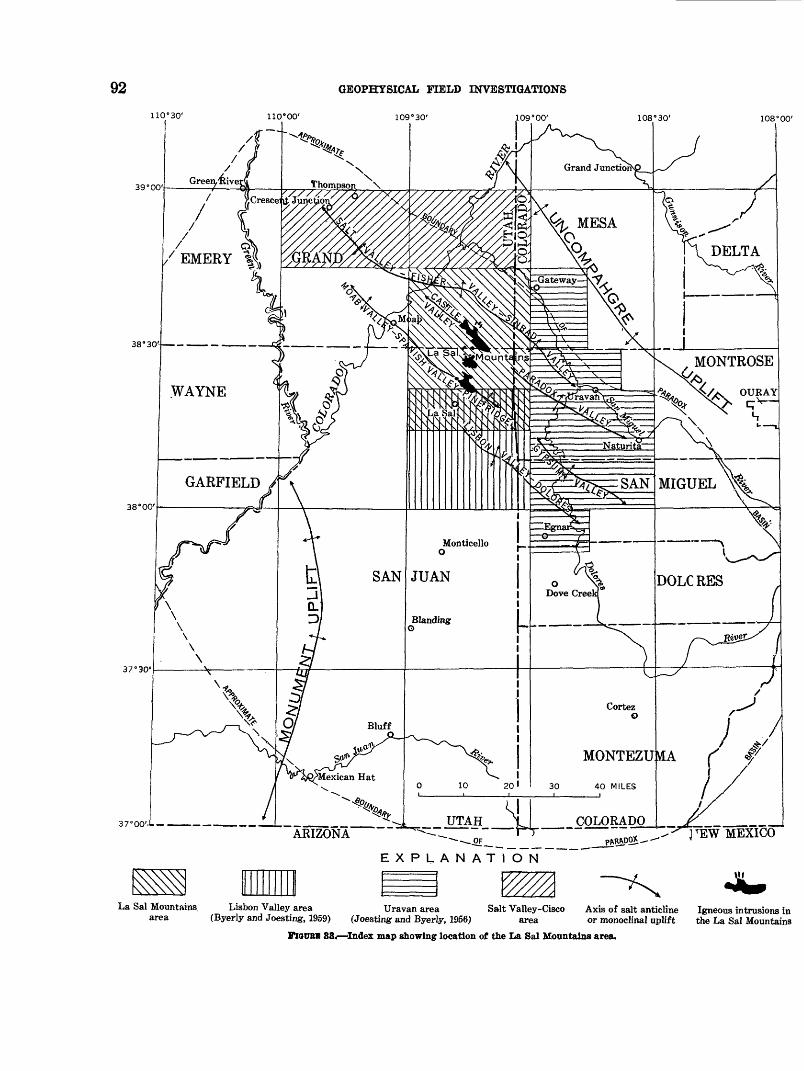
Regional gravity and aeromagnetic surveys har°> been made over the La Sal Mountains and the adjacert canyon lands of southeast Utah and southwest Colo rado (fig. 33) as part of a program of geophysical studies of the central Colorado Plateau. The area is near the deeper part of the Paradox basin of Pennsyl vanian age and is just southwest of the Uncompahgre uplift, a rejuvenated part of the ancestral Rocky Moun tains.
These surveys are an extension of those made east of the La Sal Mountains in the Uravan area (Joesting and Byerly, 1956, 1958), south of the La Sal Mountains in the Lisbon Valley area (Byerly and Joesting, 1959), and
91
92ncrao' IIO'OO'
GEOPHYSICAL FIELD INVESTIGATIONS
109°30' 109°00' 108"30' 108°00'
37°00
EXPLANATION
La Sal Mountains area
Lisbon Valley area Uravan area Salt Valley-Cisco Axis of salt anticline Igneous intrusions in (Byerly and Joesting, 1959) (Joesting and Byerly, 1956) area or monoclinal uplift the La Sal Mountains
PIQUED 33^ Index map showing location of the La Sal Moantalna area.

GEOPHYSICAL INVESTIGATIONS IN THE LA SAL MOUNTAINS
north of the La Sal Mountains hi the Salt Valley-Cisco area (Joesting and Case, 1962). They were made to gain information on the structure of the buried Pre- cambrian rocks, on the shapes of the salt anticlines and laccoliths and their relation to deep-seated structure, and on the relation of buried structures to the occur rence of uranium and oil.
We acknowledge with thanks the advice and interest of many geologists of the U.S. Geological Survey and the U.S. Atomic Energy Commission. We are par ticularly indebted to C. B. Hunt, E. M. Shoemaker, G. W. Weir, P. L. Williams, W. P. Puffett, and W. D. Carter for many helpful suggestions on interpretation of results. C. B. Hunt of the U.S. Geological Survey provided numerous specimens of igneous rocks from the La Sal Mountains for measurement of densities and magnetic susceptibilities. G. S. Home, W. K. Dyer, and H. H. Ingalls assisted on the gravity survey; R. B. Helmick, E. A. Barbour, and H. H. Smith assisted in compilation of the gravity data; and Koy Shuler as sisted in theoretical computations based on the magnetic data. The aeromagnetic surveys were flown under the direction of J. L. Meuschke and R. W. Bromery, and compilation of the aeromagnetic map was supervised by W. J. Dempsey.
This investigation by the U.S. Geological Survey has been supported jointly by the U.S. Geological Survey and by the Division of Raw Materials, U.S. Atomic Energy Commission.
GEOLOGY
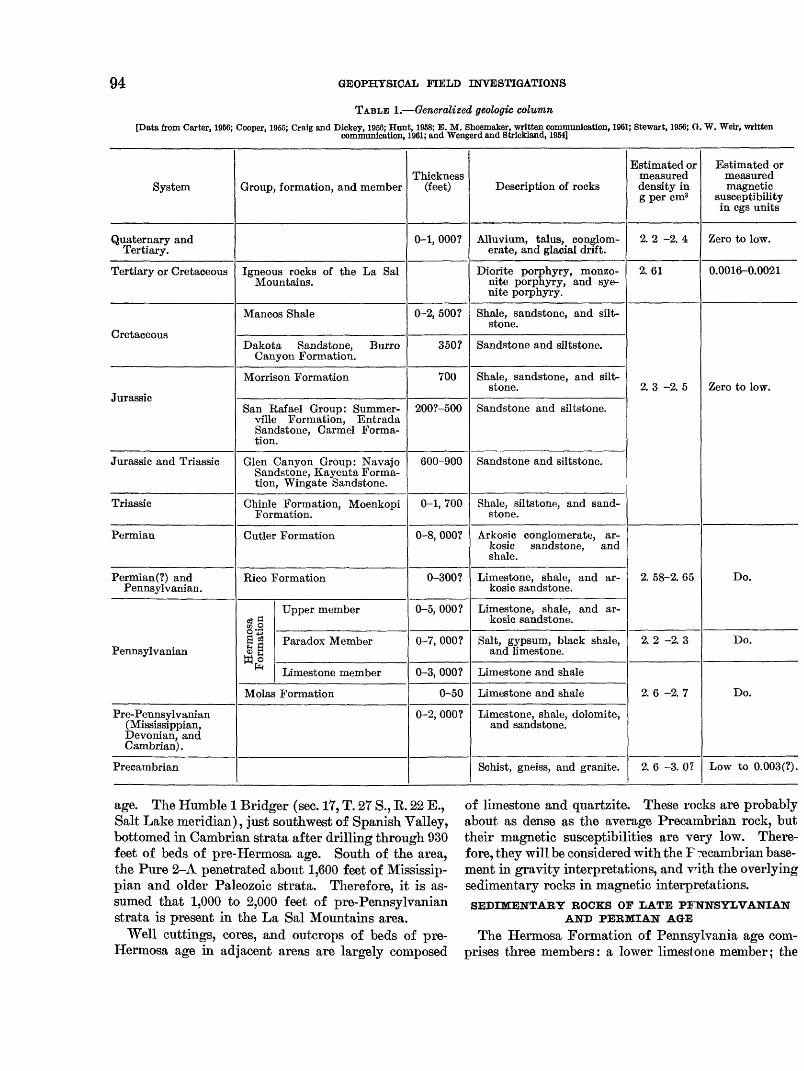
Rocks exposed in the La Sal Mountains area range in age from Pennsylvanian to Recent (pi. 14). Princi pal rock units of geophysical significance are the buried Precambrian rocks and pre-Pennsylvanian sedimentary rocks; the Hermosa Formation of Pennsylvanian age, which includes the low-density Paradox Member; the Cutler Formation of Permian age; sedimentary rocks of Mesozoic and Cenozoic age; and igneous rocks of the laccolithic intrusions in the La Sal Mountains, which are of late Mesozoic or early to middle Tertiary age (table 1).
ROCKS OF PRECAMBRIAN AGE
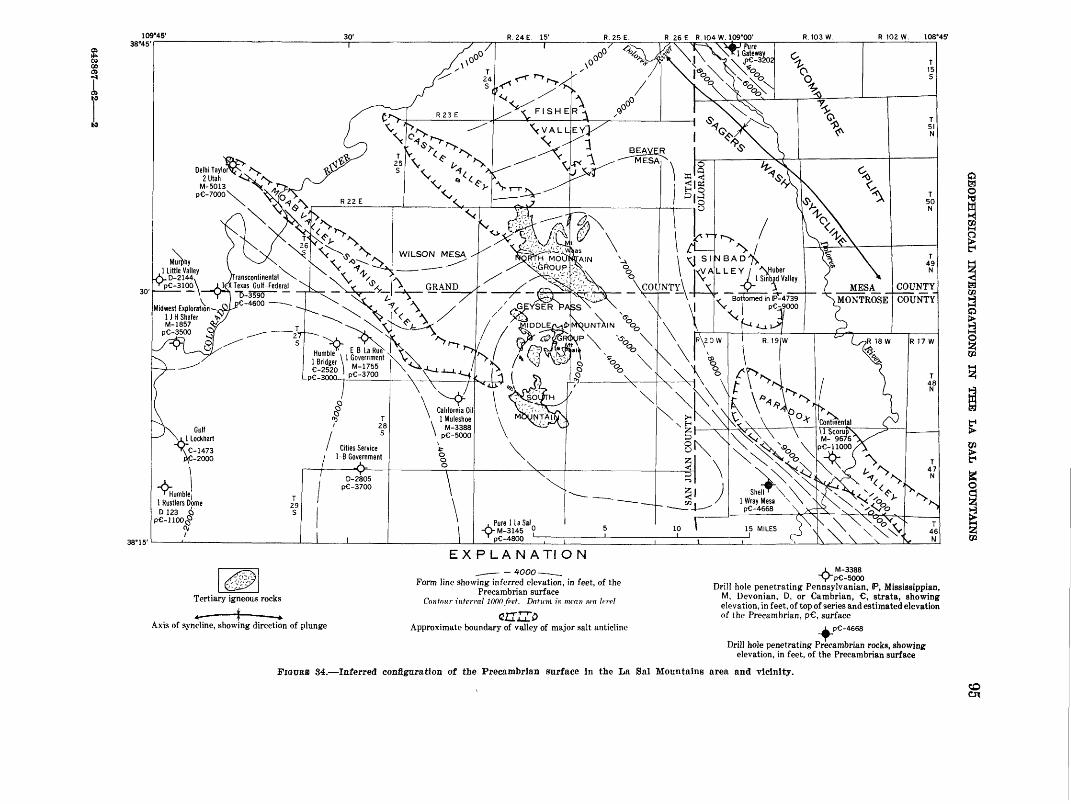
Precambrian crystalline rocks are exposed in the core of the Uncompahgre uplift, east of the La Sal Moun tains area (Shoemaker, 1956), but they are buried be neath 8,000 to 17,000 feet of sedimentary and igneous rocks within the area discussed in this report. Base ment crystalline rocks have been penetrated in the Pure 1 Gateway (sec. 15, T. 15 S., R. 104 W., 6th prin cipal meridian) near the Dolores River in the north eastern part of the area, where granite was found about
3,100 feet below sea level beneath a cover of 7,800 feot of arkose of possible Pennsylvanian and Permian (?) age (fig. 34). Precambrian rocks were penetrated at an elevation of 4,668 feet below sea level in the Shell 1 Wray Mesa Unit (sec. 21, T., 47 N., R. 19 W., Ne^v Mexico principal Meridian), southwest of Paradox Valley. Biotite granite was found in the Pure 2-A NW Lisbon (sec. 10, T. 30 S., R. 24 E., Salt Lal'e meridian), southwest of Lisbon Valley (fig. 1), at an elevation of about 2,670 feet below sea level. Con figuration of the basement surface shown in figure 24 is discussed more fully on page 105.
Many inclusions are present in the igneous rocks of the La Sal Mountains. Waters and Hunt (in Hunt, 1958, p. 349-351) have found that some of the inclusions are unmodified granite, gneiss, and schist from the cryr- talline basement, and some are undoubtedly xenoliths of Paleozoic or Mesozoic sedimentary rocks. However, most of the inclusions are hornblendic in compositicn and were probably derived from preexisting amphibol- ites or related metamorphic rocks of the Precambrian basement.
From the lithology of the inclusions it may be inferred that the upper part of the Precambrian basement be neath the La Sal Mountains is granite, gneiss, and schist, whereas a high proportion of amphibolites or related rocks are present at greater depths within tN basement. Broad low-gradient regional magnetic anomalies indicate that at least the upper part of tH Precambrian basement is of low to moderate, com paratively uniform magnetization.
The density of the Precambrian rocks is unknown, but probably ranges from 2.60 to 3.07 g per cm3, aver aging about 2.71 g per cm3. These are similar to densi ties obtained from surface samples in the Uncompahgre Plateau and adjoining regions (Joesting and Byerly, 1958, p. 4).
SEDIMENTARY ROCKS OF PRE-HERMOSA AGE
The oldest Paleozoic rocks exposed in the La Sal Mountains area are beds of the Hermosa Formation of Pennsylvanian age. Cambrian, Devonian, and Mi^1 - sissippian strata, and Pennsylvanian strata of pre- Hermosa age (Molas Formation) are present in the Sa n Juan Mountains of Colorado and have been identified in deep wells south, east, and west of the La Sal Moun tains. Cooper (1955, p. 59-65) has estimated that tl °. total thickness of the pre-Pennsylvanian sedimentary rocks is about 1,000 feet in the eastern part of the Para dox basin and 2,500 feet in the western part. TH Cities Service 1-B Government (sec. 34, T. 28 S., R. fl2 E., Salt Lake meridian, fig. 34), southwest of the La S<1 Mountains, bottomed in Devonian strata after drilling through about 900 feet of beds of pre-Pennsylvanir,n
94 GEOPHYSICAL FIELD INVESTIGATIONS
TABLE 1. Generalized geologic column[Data from Carter, 1956; Cooper, 1965; Craig and Dickey, 1956; Hunt, 1958; E. M, Shoemaker, written communication, 1961; Stewart, 1966; O, W. Weir, written
communication, 1961; and Wengerd and Strickland, 1954]
System
Quaternary and Tertiary.
Tertiary or Cretaceous
Cretaceous
Jurassic
Jurassic and Triassic
Triassic
Permian
Permian(?) and Pennsylvanian.
Pennsylvanian
Pre-Pennsylvanian(Mississippian, Devonian, and Cambrian) .
Precambrian
Group, formation, and member
Igneous rocks of the La Sal Mountains.
Mancos Shale
Dakota Sandstone, Burro Canyon Formation.
Morrison Formation
San Rafael Group: Summer- ville Formation, Entrada Sandstone, Carmel Forma tion.
Glen Canyon Group: Navajo Sandstone, Kayenta Forma tion, Wingate Sandstone.
Chinle Formation, Moenkopi Formation.
Cutler Formation
Rico Formation
Upper memberoS g(B O0-^3 B °? Parados MemberC? H
W °PH
Limestone member
Molas Formation
Thickness (feet)
0-1, 000?
0-2, 500?
350?
700
200?-500
600-900
0-1, 700
0-8, 000?
0-300?
0-5, 000?
0-7, 000?
0-3, 000?
0-50
0-2, 000?
Description of rocks
Alluvium, talus, conglom erate, and glacial drift.
Diorite porphyry, monzo- nite porphyry, and sye nite porphyry.
Shale, sandstone, and silt- stone.
Sandstone and siltstone.
Shale, sandstone, and silt- stone.
Sandstone and siltstone.
Sandstone and siltstone.
Shale, siltstone, and sand stone.
Arkosic conglomerate, ar- kosic sandstone, and shale.
Limestone, shale, and ar- kosic sandstone.
Limestone, shale, and ar- kosic sandstone.
Salt, gypsum, black shale, and limestone.
Limestone and shale
Limestone and shale
Limestone, shale, dolomite, and sandstone.
Schist, gneiss, and granite.
Estimated or measured density in g per cm3
2. 2 -2. 4
2. 61
2. 3 -2. 5
2. 58-2. 65
2. 2 -2. 3
2. 6 -2. 7
2. 6 -3. 0?
Estimated or measured magnetic
susceptibility in cgs units
Zero to low.
0.0016-0.0021
Zero to low.
Do.
Do.
Do.
Low to 0.003(?).
age. The Humble 1 Bridger (sec. 17, T. 27 S., R. 22 E., Salt Lake meridian), just southwest of Spanish Valley, bottomed in Cambrian strata after drilling through 930 feet of beds of pre-Hermosa age. South of the area, the Pure 2-A penetrated about 1,600 feet of Mississip pian and older Paleozoic strata. Therefore, it is as sumed that 1,000 to 2,000 feet of pre-Pennsylvanian strata is present in the La Sal Mountains area.
Well cuttings, cores, and outcrops of beds of pre- Hermosa age in adjacent areas are largely composed
of limestone and quartzite. These rocks are probably about as dense as the average Precambrian rock, but their magnetic susceptibilities are very low. There fore, they will be considered with the F^ecambrian base ment in gravity interpretations, and with the overlying sedimentary rocks in magnetic interpretations.SEDIMENTARY ROCKS OF LATE PFNNSYLVANIAN
AND PERMIAN AGE
The Hermosa Formation of Pennsylvania age com prises three members: a lower limestone member; the
GE
OP
HY
SIC
AL
IN
VE
ST
IGA
TIO
NS
IN
T
HE
L
A
SAL
M
OU
NT
AIN
S
643867
62
-
96 GEOPHYSICAL FIELD INVESTIGATIONS
Paradox Member, a thick cyclical sequence of evapo- rites, black shale, sandstone, limestone, and locally, ar- kosic rocks; and an upper member which consists of marine limestone and shale, which grades to sandstone and conglomerate toward the northeast (Bass, 1944; Wengerd and Strickland, 1954). The maximum dep- ositional thickness of the Paradox Member may be as much as 7,000 feet near Paradox Valley, according to Elston and Shoemaker (1960, p. 49-51). Wengerd and Strickland (1954, p. 2174) have estimated the thickness of the upper member, including coarse clastic parts adjacent to the Uncompahgre uplift, to be about 5,000 feet. In the Humble 1 Bridger the approximate thick ness of the upper member is about 1,980 feet, of the evaporite series about 1,730 feet, and of the lower mem ber about 146 feet. The Hubbard 1 Government (sec. 12, T. 24 S., R. 23 E., Salt Lake meridian), northeast of Onion Creek, bottomed in the Paradox Member after penetrating about 2,100 feet of the upper member and 170 feet of the Paradox Member (E. M. Shoemaker, written communication, 1961).
Beds of the Hermosa Formation are exposed near the crest of salt anticlines at Sinbad, Fisher, and Castle Valleys, where the leached gypsum caprock is prominent.
The Paradox Member is the most significant sedimen tary unit of the area with respect to interpretation of the gravity data. The relatively low density of the evaporite series causes pronounced gravity minima where the salt forms the thickened cores of the salt an ticlines. The density of halite is about 2.1 g per cm3 (Birch and others, 1942, p. 10), but the Paradox Mem ber includes denser clastic and nonclastic beds, and the percentage of clastic material within the member in creases from southwest to northeast toward the Un compahgre uplift. The average density of the salt interval thus increases from southwest to northeast (Shoemaker and others, 1958, p. 47-48; Elston and Shoemaker, 1960, p. 49-51). The average density of the Paradox Member in the core of the most easterly salt anticlines may be as high as 2.3 g per cm3.
The Rico Formation of Pennsylvanian and Per mian ( ?) age is considered to be a transitional unit be tween the marine sedimentary rocks below and the terrestrial rocks above (Baker and others, 1927, p. 807). It consists of limestone, shale, and arkosic sandstone. The thickness of the Rico Formation in the Hubbard 1 Government is about 300 feet, according to E. M. Shoemaker (written communication, 1961). The Rico Formation is locally exposed in Sinbad Valley. Non- fossiliferous limestone which may be in the Rico For mation is also exposed in the hogbacks flanking the North Mountain group of peaks and South Mountain.
The Cutler Formation of Permian age overlies the Rico Formation. The formation increases in thickness northeastward toward the Dolores River. More than 4,000 feet of arkosic beds were penetrated by the Hub bard 1 Government well, and, as previously noted, about 7,800 feet of arkosic material was penetrated by the Pure 1 Gateway. Formation boundaries could not be picked in the Pure 1 Gateway and some of the material may represent equivalents of the Hermosa and Rico Formations. The Cutler Formation is exposed along the Dolores River; in the cliffs at Sinbad, Fisher, Cas tle, and Spanish Valleys; in the hogbacks of the North Mountain group and at South Mountain; and along the Colorado River near Professor Creek.
In addition to the general northeastward thickening of the Cutler Formation, there are not able variations in thickness related to growth of the salt anticlines. There is stratigraphic and geophysical evidence that the Cutler Formation thins toward the crests of the salt anticlines and thickens in areas between the salt anticlines (Shoemaker and others, 1958, p. 48-55; Elston and Landis, 1960, p. B-261; Elston and Shoemaker, 1960, p. 53; Joesting and Byerly, 1958, p. 12,15, 16).
The effective density of the Rico and Cutler Forma tions and the limestone of the Hermosa Formation is probably about 2.55 to 2.65 g per cm3 . Eight samples of limestone of the Hermosa near Pig Indian Wash in the Lisbon Valley area have an average density of 2.65 g per cm3 (Byerly and Joesting, 1959, p. 41). Sat urated densities of 30 samples of the Cutler Formation collected near Gateway, Colo., average 2.58 g per cm3 (Joesting and Byerly, 1958, p. 5).
SEDIMENTARY ROCKS OP MESOZOIC AND CENOZOIC AGE
Mesozoic strata of the area are dominantly continen tal sandstone, shale, and conglomerate. However, the Mancos Shale of Late Cretaceous age is marine. Hunt (1958, p. 310) has estimated that aliout 3,500 feet of
Mesozoic strata is present in the La Sal Mountains. The average density of Mesozoic rocks from the Win- gate Sandstone of Triassic age to the Morrison Forma tion of Jurassic age was found to b^ about 2.5 g per cm3, from gravity measurements at tH top and bottom of the canyon of the San Miguel River near Uravan, Colo. (Joesting and Byerly, 1958, p. 7).
Deposits of alluvium, conglomerate, and windblown material of Cenozoic age are found in the valleys, on alluvial fans around the mountains, and on some of the mesas. Glacial deposits are widespread in the moun tains (Hunt, 1958, p. 314). In general, the Cenozoic deposits are thin, but in the valleys along the breached crests of the salt anticlines the fill may be 1,000 feet
GEOPHYSICAL INVESTIGATIONS IN THE LA SAL MOUNTAINS 97
thick (Hunt, 1958, p. 314). The density of much of the relatively porous fill probably does not differ appreci ably from that of the underlying evaporates. The thin Cenozoic deposits have little effect on the gravity and magnetic interpretations.
Mesozoic and Cenozoic strata blanket much of the area and, considered together, are 4,000 to 5,000 feet thick, for which a density of 2.5 g per cm3 has been as sumed. Gravity reductions, including terrain correc tions, have been made using this density.
IGNEOUS BOCKS OP THE LA SAL MOUNTAINS
The geology of the La Sal Mountains has been de scribed by Hunt (1958) who found that three stocks with associated laccoliths, dikes, sills, and bysmaliths comprise the intrusive igneous cores of the three moun tain groups (fig. 34). In the northernmost group of mountains, known collectively as North Mountain, the intrusions include diorite porphyry, monzonite por phyry, syenite porphyry, soda rhyolite, and aegerine granite. The soda rhyolite and aegerine granite are related to a volcanic phase of igneous activity. In the middle group, known collectively as Middle Mountain, laccoliths of diorite porphyry are exposed. A small syenite sill is also present at Middle Mountain, but it is probably part of the North Mountain feldspathoidal series according to Hunt and Waters (in Hunt, 1958, p. 344). At South Mountain the laccoliths are predom inantly diorite porphyry, plus minor amounts of mon zonite porphyry.
The igneous rocks cut the Mancos Shale, hence they are not older than Late Cretaceous. Hunt considers the intrusions to be Tertiary (1958, p. 309), whereas Shoemaker (1954, p. 63) has stated that a latest Creta ceous age for the laccolithic mountains of the Colorado Plateau is not precluded by the available evidence.
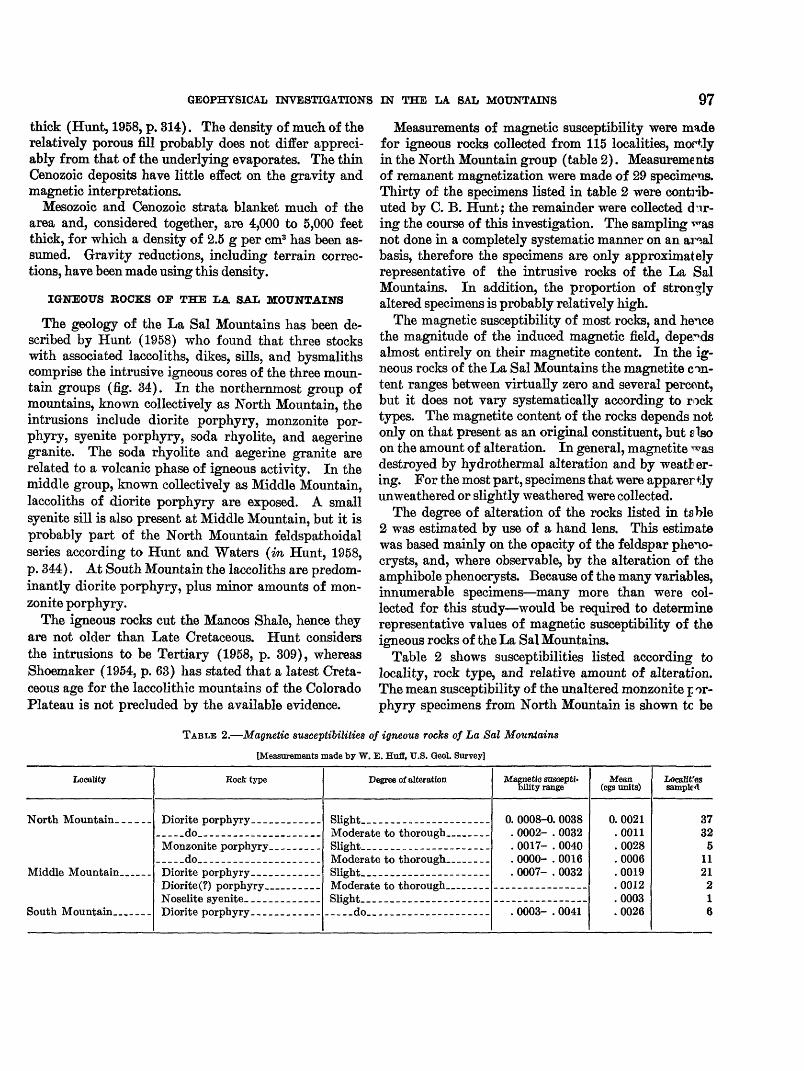
Measurements of magnetic susceptibility were made for igneous rocks collected from 115 localities, mortly in the North Mountain group (table 2). Measurements of remanent magnetization were made of 29 specimens. Thirty of the specimens listed in table 2 were contrib uted by C. B. Hunt; the remainder were collected dur ing the course of this investigation. The sampling T^as not done in a completely systematic manner on an arml basis, therefore the specimens are only approximately representative of the intrusive rocks of the La Sal Mountains. In addition, the proportion of strongly altered specimens is probably relatively high.
The magnetic susceptibility of most rocks, and hence the magnitude of the induced magnetic field, depends almost entirely on their magnetite content. In the ig neous rocks of the La Sal Mountains the magnetite con tent ranges between virtually zero and several percent, but it does not vary systematically according to rock types. The magnetite content of the rocks depends not only on that present as an original constituent, but also on the amount of alteration. In general, magnetite ^as destroyed by hydrothermal alteration and by weather ing. For the most part, specimens that were apparertly unweathered or slightly weathered were collected.
The degree of alteration of the rocks listed in table 2 was estimated by use of a hand lens. This estimate was based mainly on the opacity of the feldspar pheno- crysts, and, where observable, by the alteration of the amphibole phenocrysts. Because of the many variables, innumerable specimens many more than were col lected for this study would be required to determine representative values of magnetic susceptibility of the igneous rocks of the La Sal Mountains.
Table 2 shows susceptibilities listed according to locality, rock type, and relative amount of alteration. The mean susceptibility of the unaltered monzonite p ->r- phyry specimens from North Mountain is shown tc be
TABLE 2. Magnetic susceptibilities of igneous rocks of La Sal Mountains
[Measurements made by W. E. Huff, U.S. Geol. Survey]
Locality
North Mountain _____
Middle Mountain ___ _
South Mountain __ ___
Book type
Diorite porphyry __ _______________do____________ _ ______Monzonite porphyry. _____ _
_____do_________________.___Diorite porphyry _ _______Diorite (?) porphyry __ _____
Diorite porphyry. _ __________
Degree of alteration
Slight.
Slight Moderate to thorough __ ___Slight _ _-___._____----____Moderate to thorough __ _ _ _Slight .----.- ---------
_-_-_do_---_--_--_----------
Magnetic suscepti bility range
0. 0008-0. 0038. 0002- . 0032. 0017- . 0040. 0000- . 0016. 0007- . 0032
. 0003- . 0041
Mean (cgs units)
0. 0021.0011.0028.0006.0019.0012.0003.0026
Localises sampled
3732
51121216

98 GEOPHYSICAL FIELD INVESTIGATIONS
slightly higher than those found for the diorite por phyry ; but the difference is probably not significant in view of the small number of monzonite porphyry localities sampled. Rocks that are only slightly altered have higher susceptibilities in general than the more strongly altered rocks, though the range in susceptibil ities is so wide that there is considerable overlap (table 2 and fig. 35).
15 -
Average: 0.0016 cgs units
0.001 0.002 0.003
A All samples
0.004 0.005 cgs units
Average: 0.0021 cgs units
0.001 0.002 0.003 0.004
B Unaltered or little-altered samples
0.005 cgs units
FIGURE 35. Histograms of magnetic susceptibilities of some intrusive igneous rock of the La Sal Mountains.
26
25 -\
20 -
15 -
10 -
5 -
2.50 2.52 2.54 2.56 2.58 2.60 2.62 2.64 2.66 2.68 2.70 OR GREATER AVERAGE SATURATED DENSITY, IN GRAMS PER CUBIC CENTIMETER
FIGUEB 36. Histogram of densities of intrusive Igneous rocks in the La Sal Mountains.
The average susceptibility of all specimens of intru sive rocks was about 0.0016 cgs unit, and that of the unaltered or little-altered specimens w^s about 0.0021. Because a disproportionate number cf altered rocks was collected, the value 0.002 is considered to be roughly representative of the average magnetic suscep tibility of the intrusive rocks of the La Sal Mountains.
Remanent magnetization of 29 oriented specimens of intrusive rocks ranged from low to moderate. The di rection of remanent magnetization was mainly random in the specimens tested, therefore the magnetic anom alies associated with the La Sa Mourtains are prob ably governed largely by the magnetic susceptibilities of the intrusive rocks.
Densities of 108 specimens of igneous rocks range from 2.51 to 2.81 g per cm3 (fig. 36). Tie mean density is 2.61 g per cm3, with a standard devi?,tion of ±0.04 g per cm3. Density control is probably adequate for the purposes of this investigation, judging from the rela tively small spread of measured densities.
STRUCTURAL GEOLOGY
Three prominent systems of salt anticlines trend northwestward across the area (pi. 14). The anti clines are underlain by ridges of thiclrened salt of the Paradox Member of the Hermosa Formation. Large valleys have been eroded at intervals along the breached crests of the anticlines. Collapse of the crests by fault ing or subsidence is common.
Fisher and Sinbad Valleys lie on tH northeast sys tem of anticlines. Salt Valley anticline (Dane, 1935) is a northwestern extension of the system. Normal faults connect the major valleys, probably defining a deep-seated ridge of salt which connects larger salt masses at the valleys (Shoemaker, 1954, p. 53). Castle and Paradox Valleys are the sites of salt anticlines along the middle system. Spanish and Pack Creek Valleys, and Pine Ridge are on anticlines of tH southwest sys tem, which includes Moab salt anticline to the north west. A fourth major system, the Dolores-Lisbon Valley salt anticline, lies south of the La Sal Mountains area (fig. 33).
Although each system of anticlines trends northwest ward, the axis of Fisher Valley anticline is offset from that of Sinbad Valley anticline, and th? axis of Spanish Valley anticline is offset from the Pine Ridge anticline (pi. 14). These offsets are apparently left lateral, and they may define a deep northeastward-trending trans verse structure in the presalt basement, as discussed on pages 106-107.
Summaries of the geologic history of the salt anti clines and related structures have been given by Baker (1933), Dane (1935), Stokes (1948, 1956), Shoemaker
GEOPHYSICAL INVESTIGATIONS IN THE LA SAL MOUNTAINS
(1954), Cater (1955), Shoemaker and others (1958), and Jones (1959). These reports contain extensive ref erences to the literature on the salt anticlines.
The La Sal Mountains are on a broad structural dome with a relief of at least 3,000 feet. Belief on the dome is locally increased by relief of the salt anticlines and by local doming around the stocks and laccoliths. At North and South Mountains the domes surrounding the intrusions are superimposed on older anticlinal struc tures. Although the stocks and laccoliths at these mountains were emplaced in older salt anticlines, those at Middle Mountain were emplaced between the two anticlinal systems. The degree of local doming at the three mountain groups is proportional to the diameter of the stocks, and, if the domes were flattened, the space occupied by the stocks would be closed (Hunt, 1958, p. 316).
Sagers Wash syncline, in the northeastern part of the area (pi. 14), marks the approximate boundary between the Paradox basin and Uncompahgre uplift (fig. 33).
Structure contours shown on plate 14 are drawn at the base of the Dakota Sandstone of Cretaceous age. In general, the thickness of beds between the base of the Dakota Sandstone and the base of the Wingate Sand stone of Triassic age is relatively constant, varying no more than 500 feet in the area. There are no major angular unconformities between the Wingate and Da kota Sandstones except locally near the salt anticlines; thus the structure contours also show the approximate configuration of Triassic beds.
AEROMAGNETIC SURVEYS
Aeromagnetic surveys of the La Sal Mountains area (pis. 15,16) were made in 1955 and 1956, by using a con tinuously recording AN/ASQ-3A flux-gate magnetom eter, installed in a two-engine airplane flying at about 150 miles per hour. East-west lines were flown about 1 mile apart, about 12,500 feet above sea level. Lines were spaced to avoid the highest peaks. Magnetic data were obtained and compiled by standard procedures de scribed by Balsley (1952).
Aerial photographs were used for pilot guidance, and the flight path of the plane was recorded by a gyro- stabilized continuous-strip camera. The magnetic data were plotted on photomosaics, as topographic maps were not available when the area was flown. Errors therefore exist in the positions of some of the flight lines and magnetic anomalies, but they apparently do not effect the results seriously. Other errors of unknown magnitude result from deviation of the plane from its barometrically controlled flight level. The errors are largest close to the higher peaks, where the vertical magnetic gradient is large.
GRAVITY SURVEYS
Worden gravity meters with scale constants of about 0.5 milligal were used throughout the survey. The no"- mal drift rate of the meters was about 0.05 milligal per hour, although the rate was as high as 0.10 milligal per hour in a few traverses. Gravity bases were established at convenient points along the main access roads ard were tied at several points to a master base net which originates at the U.S. Coast and Geodetic Survey pen dulum gravity station Egnar at Egnar, Colo. (fig. 33). The maximum closure difference at junction points within the base net was 0.3 milligal. Gravity bas^,s were occupied about every 2 hours, when possible, and frequent repeats of gravity readings were made at in tervening gravity stations for close drift control.
About 640 gravity stations, including 37 bases, were established. Eighty additional gravity stations frcm the northern part of the Lisbon Valley area are in cluded on the gravity anomaly map (pi. 17).
About 800 square miles were covered during the sur vey. Gravity stations were usually spaced 1 to 2 miles apart,, although closer spacing was made over the salt anticlines and other areas of special geologic interest. Spacing is wider in difficultly accessible areas.
HORIZONTAL CONTBOL
Horizontal control was provided by preliminary edi tions of multiplex topographic maps (scale 1:24,000) of the La Sal, La Sal Junction, Castle Valley, and Polar Mesa 15-minute quadrangles. Locations of grav ity stations were chosen at points that were readily rec ognizable on the topographic maps.
ELEVATION CONTROL
Elevation control was obtained from U.S. Coast and Geodetic Survey and U.S. Geological Survey berch marks (3 percent), from photogrammetric spot eleva tions (27 percent), from contour interpolation of the topographic maps (< 1 percent), and from altimetric surveys (70 percent). The range of the surveying altimeters was 7,000 feet and the dials could be read to the nearest 2 feet. Three altimetric methods were used: the single-base method, leapfrog method, and loops be tween bench marks or spot elevations with one or t^o altimeters. Descriptions of altimetric methods may be found in standard references, for example, in Brr«sd andHosmer (1953).
Elevations at bench marks are correct within 1 f c ot, spot elevations are generally correct within 15 or 20 feet, contour interpolations are assumed to be correct within 40 feet, the map contour interval, and many alti metric elevations are estimated to be correct within 20
100 GEOPHYSICAL FIELD INVESTIGATIONS
feet. About 1 percent of the altimetric elevations were obtained during the course of extended traverses through large ranges of altitude and these elevations may be as much as 40 feet in error.
REDUCTION OF GRAVITY DATA
Gravity data were reduced by standard methods (for example, see Nettleton, 1940, p. 51-61). Theoretical gravity at seal level as a function of latitude was deter mined from the "International Formula" of spheroidal gravity of 1930. An elevation factor of 0.062 milligal per foot was used in computation of the gravity anom alies. This factor corresponds to a density of 2.5 g per cm3 as determined in the Uravan area (Joesting and Byerly, 1958, p. 7). The contour values on the gravity anomaly map (pi. 17) are Bouguer anomalies, for the given reference spheroid and reduction density, plus 300 milligals. It should be noted that use of a different reduction density of reasonable value, 2.4 or 2.6 g per cm3, would not appreciably change the pattern of grav ity anomalies shown on plate 17. If 2.6 g per cm3 were used, negative anomalies would become somewhat more negative and positive anomalies would become some what less positive. The reverse would be the case if a density of 2.4 g per cm3 were used in the reductions.
Corrections for terrain were generally made to dis tances ranging from 20.3 miles for the stations below 8,500 feet to 104 miles for stations above 11,000 feet. Terrain corrections through zone "J" of Hammer's tables (1939) were applied at most of the stations in the adjoining Lisbon Valley area (Byerly and Joesting, 1959, p. 43). In general, terrain corrections for outer zones were not continued beyond the zone in which the contribution of the terrain was below about 0.7 milligals. Terrain corrections for outer zones were estimated at some stations; the estimates were based on corrections at nearby stations of similar elevation and topographic position.
Gravity anomalies at stations occupying the higher peaks and the floors of the deepest canyons may be 1 to 3 milligals low with respect to the other stations, be cause of regional terrain effects. The largest terrain correction, 52 milligals, was required for the station on the crest of Mount Tukuhnikivatz. Terrain cor rections were 5 milligals or larger at about 20 percent of the gravity stations.
ERRORS IN THE GRAVITY ANOMALIES
Inaccurate determination of elevations is the princi pal source of error in the reduced gravity values. Most of the elevations are estimated to be correct within 20 feet, equivalent to errors of 1.2 milligals in the gravity values. One percent of the elevations may be as much
as 40 feet in error, equivalent to errors of 2.5 milligals in the gravity values.
The errors in calculated terrain corrections probably do not exceed 5 to 10 percent of their values, which range from 0.5 to 52 milligals.
The maximum closure difference at junction points of the base lines was 0.3 milligal. The tc ftal drift of the gravity meters during a normal day's traverse did not exceed 1.0 milligal. Because frequent repeats of readings were made at gravity bases and intervening stations it is believed that the maximum error in apply ing drift corrections did not exceed 0.3 milligal for any traverse. Therefore, the error in "absolute" observed gravity at a given station may be as large as 0.6 milligal, the sum of the maximum error in observed gravity at the bases and the maximum error involved in correction for meter drift. However, the maximum error in ob served gravity between adjacent stations is probably only about 0.1 to 0.2 milligal.
Other sources of error include regional terrain effects, neglect of the effect of the curvature of the earth, in accuracies of calibration of the gravity meters, and nonlinear behavior of their moving systems.
It is estimated that the average relative error in the gravity anomalies is less than 2 milligals across the area surveyed. One or two percent of the anomalies may be in error by as much as 3 or 4 milligals; these are associated with stations on high peaks or in deep nar row canyons.
INTERPRETATION OF THE GEOPHYS1CAL DATA
MAGNETIC TVTAP
Anomalies associated with two distinct sources are shown on the magnetic maps (pis. 15, 16). The broad low-gradient regional anomalies re flect principally structures in the Prec^mbrian base ment rocks and variations in the composition of and depth to the Precambrian surface. The high-gradient generally closed local anomalies are associated with the La Sal Mountains laccolithic complex. The regional magnetic effects are shown more prominently on plate 16, from which a latitude gradient was removed. This gradient, which is positive to the nortli, is about 8.9 gammas per mile along the magnetic meridian in the La Sal Mountains region (U.S. Coast and Geodetic Sur vey Chart 3077f).
GRAVITY ANOMALY MAP
The most prominent gravity anomalies in the area are gravity lows associated with the salt anticlines that have cores of salt, gypsum, and elastic sedimentary rocks of low average density (pi. 17). Gravity highs
GEOPHYSICAL INVESTIGATIONS IN THE LA SAL MOUNTAINS 101
are associated with the intrusive igneous rocks of the La Sal Mountains, which are slightly denser than the surrounding sedimentary rocks. Broad positive and negative regional anomalies are related to structural and lithologic changes in the basement rocks and to varia tions in thickness of the overlying sedimentary rocks. The three groups of anomalies overlap so that isolation of a particular anomaly requires subjective evaluation of their relative importance. Second derivative or residual gravity methods have not been used to isolate anomalies, because they tend to magnify errors which are relatively large in this gravity survey.
In the following interpretation of the magnetic and gravity maps, emphasis has been placed on parallelism or divergence in strike of the contours with the strike of structure contours on Mesozoic reference horizons. Parallelism indicates, in part, that the contours reflect Mesozoic or Cenozoic structures, whereas divergence is considered evidence of pre-Triassic structure. In some places, however, the magnetic and gravity effects of the basement rooks and the gravity effects of salt of the Paradox Member are so strong that this interpretative procedure cannot be followed.
BEGIONAL MAGNETIC AND GBAVITY ANOMALIES
MAGNETIC ANOMALIES
In general, the Precambrian basement sources of the regional magnetic anomalies are comparatively deep in the La Sal Mountains area (pis. 15, 16), although no reliable estimates of depth are possible from the magnetic data because of the small amplitude of the anomalies associated with the basement rocks. As noted previously, basement rocks are buried at depths rang ing from about 7,800 feet at the Pure 1 Gateway to 17,000 feet at the Continental 1 Scorup in Paradox Valley, just east of the area. The small regional mag netic anomalies indicate that the basement rocks are generally of low to moderate magnetization; and moderate contrasts are indicated by steepened gradients south of South Mountain and along a zone that extends from Paradox Valley to the northern mountain group (North Mountain). Eegional gravity anomalies, how ever, indicate rather large contrasts in the density of the basement rocks. It is therefore likely that these rocks are made up of several types of metamorphosed sedimentary rocks, and possibly also of granitic rocks, which would account for the relatively moderate and uniform magnetization and large density contrasts.
The regional magnetic trends and changes in mag netic gradients are associated mainly with structural trends and compositional changes in the basement rocks. The main magnetic trends are northwesterly over much of the area, in agreement with the regional structural
trend of the sedimentary rocks and the strike of the salt anticlines. Just west and northwest of the La Sal Mountains, however, a series of transverse magnetic trends extends southwest across the area, with resuh- ing offset to the left of the northwesterly trends. These transverse trends coincide generally with a prominent gravity trend (the Wilson Mesa regional gradient). They apparently mark a major structural and lithologic discontinuity in the Precambrian basement, which crosses the main regional northwestward-trendirg structures just west and northwest of the La S*.l Mountains.
Several changes in regional magnetic gradient seeia to be structurally meaningful. In the southern part of the area a northwestward-trending zone of relative^ high gradient passes south of South Mountain, is offset to the southwest by the transverse zone already dis cussed, and continues west-northwest parallel to Kane Springs Canyon. Farther north a similar zone of higher magnetic gradient extends northwestward f ro'n the vicinity of Paradox Valley. This zone is interrupted by the local magnetic effects of North Mounutain but it is present just to the west, where it is also offset to the southwest before resuming its northwesterly trend c*i- agonally across Spanish Valley. These two zones are northwestern extensions of a single high-gradient zone between Gypsum and Paradox Valleys in the Uravan area to the east (Joesting and Byerly, 1958, pi. 2), which split in the La Sal Mountain area. They are related to contrasts in the composition of the underlying Precam brian rocks and possibly to their displacement by fault ing or warping.
A broad regional magnetic low lies between the tr^o zones of higher gradient and encompasses all of the La Sal Mountains. This regional low is shown prominently on plate 16, the magnetic map from which a latitude gradient has been removed. West of the mountains the broad low becomes constricted and is offset to the southwest conformably with the higher magnetic gra dients. The regional magnetic low coincides closely in outline with a regional gravity high (pi. 17), whnh will be discussed more fully later. The coincidence indicates lithologic contrasts in the underlying bare- ment rocks and probably of basement relief, along boundaries defined approximately by the regional mag netic and gravity anomalies.
There is no magnetic evidence of a parent body from which the laccolithic complex of the La Sal Mountains was derived; in fact the regional magnetic low shows that the underlying rocks are of moderately low and uniform magnetization. The absence of other than inverse magnetic effects that might be attributable to a parent igneous body does not preclude the possibility of its existence. It indicates, however, that any sinh
102 GEOPHYSICAL FIELD INVESTIGATIONS
body lies at a depth below which magnetic effects dis appear. Vacquier and Affleck (1941) estimate this depth to be between 11 and 14 kilometers beneath the surface, which is also about the estimated depth at which the Curie point for magnetite-bearing material is reached. If appreciable titanium oxide is associated with the magnetite, the Curie point would be reached at a lower temperature and smaller depth.
The magnetic evidence suggests that the igneous rocks at North and South Mountains were intruded near the intersections of major northwestward and southwest- ward-trending zones of basement displacement. Sig nificantly, the salt anticlines of Paradox and Castle Valleys are along the same northwestward-trending zone as North Mountain; and the Gypsum Valley, Pine Ridge, and Spanish Vally salt anticlines occur along the same zone as South Mountain. The apparent left- lateral offset of the salt anticlines near the La Sal Moun tains is interpreted to be related to a transverse structure that continues northeasterly toward the Un- compahgre structural front northeast of the Dolores River.
The positive northerly magnetic gradient along the Dolores River in the northeastern part of the area is a continuation of a strong trend along the Uncompahgre uplift (Joesting and Byerly, 1958, pi. 2). It reflects the effect of more strongly magnetic Precambrian rocks in the Uncompahgre Plateau, and possibly of increasing magnetite content of the crystalline rocks toward the uplift. The positive gradient is not believed to be associated with shallower basement, as the gravity and structural evidence indicate that the basement is com paratively deep along Sagers Wash syncline (fig. 34 and pi. 17").
GRAVITY ANOMALIES
The most prominent regional gravity anomalies are steepened gravity gradients south of Spanish Valley, west of the La Sal Mountains, and between the northern group of peaks (North Mountain) and Paradox Valley (pi. 17"). South of Spanish Valley gravity contours trend westward and northwestward, decreasing from 116 milligals near Kane Springs Canyon to about 70 milligals in Spanish Valley; gravity values then grad ually increase to about 84 milligals near Negro Bill Canyon. This westward-trending steepened gradient is termed the "Spanish Valley regional gradient." Salt thickening of 7,000 to 10,000 feet at Spanish Val ley can account for as much as 30 milligals of the gra dient from Kane Springs Canyon to Spanish Valley, but there remains a residual decrease of 16 milligals which must be explained by density changes or struc tural relief, or both, in the basement rocks. Basement rocks are probably less dense or deeper under Spanish
Valley than to the south. This regional gravity gra dient continues westward, into the Inter River area north of Upheaval Dome (Joesting and Case, 1960, fig. 114.3; Joesting and Plouff, 1958, p. 8f, 91), diverging from Spanish Valley salt anticline.
The estimated elevation of the Precr.mbrian surface is 3,000 feet below sea level at the Humble 1 Bridger, just southwest of Spanish Valley (fig. 34). It is 7,000 feet below sea level at the Delhi-Taylor 2 Utah (sec. 18, T. 25 S., R. 21 E., Salt Lake meridian) on Moab an- ticiline, 14 miles northwest of the Humb1o< well (fig. 34). Part of the Spanish Valley regional gradient is un doubtedly caused by the 4,000 feet of presalt basement relief across the southwest flank of Spanish Valley.
Near Pack Creek at the southwest end of Spanish Valley the steepened regional gradient changes abruptly in trend and continues northeast acrosr South and Wil son Mesas to the northwest flank of I Torth Mountain. The gravity values decrease from 116 milligals at Gey ser Pass to 86 milligals at Wilson Mesa a decrease of 30 milligals in 8 miles. The steep gradient, termed here the "Wilson Mesa gradient," cen be partly ex plained by the positive gravitational effects of the ig neous intrusions of the mountains, combined with the negative effect of thickened salt at Spanish and Castle Valleys. However, analysis of these combined effects indicates that at least 20 milligals of tt e gradient is due to changes in the density or relief of the pre-Paradox rocks, or to a combination of the two, The northeast gravity trend agrees with the magnetic trends previ ously discussed, which indicates that tl °, gravity trends are caused, in part at least, by Precambrian rocks. Furthermore, the northeast gravity trend is generally transverse to the structure of the Triassic and younger beds (pi. 14) which emphasizes the pr>Triassic age of the source of the gradient.
In the absence of subsurface control between the La Sal Mountains and Spanish Valley, it is not possible to determine the relative importance of basement re lief, intrabasement density contrasts, salt thinning, and the laccolithic intrusions in producing the Wilson Mesa regional gradient.
To set reasonable limits on the sources of the regional gradient, the gravitational effects of two models have been computed (fig. 37) using standard methods of graticule analysis described by Hubber*. (1943). It has been assumed that the source of the gravity anomaly is two dimensional, that is, its length is g^eat with respect to its width. The models do not yield a total anomaly as large as that observed, hence they are conservative in that larger basement relief, more salt thinning, or larger intrabasement density contrasts would be re quired to reproduce the total observed anomaly. It

OBSE
RVED
GRA
VITY
ANO
MAL
Y, I
N M
ILLI
GAL
SOB
SERV
ED G
RAVI
TY A
NOM
ALY,
IN
MIL
LIG
ALS
104 GEOPHYSICAL FIELD INVESTIGATIONS
must be noted that the models shown on figure 37 are greatly simplified and are therefore only approximately representative of possible geologic conditions at depth.
On model A (fig. 37), the pre-Paradox sedimentary rocks are included with the Precambrian rocks because they are probably of nearly the same density. The den sity of 2.75 g per cm3 that has been assigned to this pre- salt basement may be somewhat too high, but a lower density would require a correspondingly greater base ment relief. The basement relief from Wilson Mesa to Geyser Pass is assumed to be 8,000 feet. The salt of the Paradox, of density 2.2 g per cm8, is assumed to thin from 6,000 feet at Wilson Mesa to 1,000 feet be neath Geyser Pass. The relief of the top of the salt is assumed to be about 3,000 feet, the same as the known structural relief of Mesozoic rocks between Wilson Mesa and Geyser Pass. Such complementary salt thinning with large basement relief may imply that the base ment relief occurred during deposition of salt of the Paradox. The beds overlying the salt have been as signed an average density of 2.55 g per cm8, which is considered to be a reasonable average value for the Mesozoic and uppermost Paleozoic beds, and for the igneous intrusions that are present near Geyser Pass.
East of the southeast end of the profile, at A', the basement probably drops steeply toward Paradox Val ley, hence the anomalous density distribution is as sumed to end at A'.
On the model B (fig. 37) the source of the Wilson Mesa regional gradient is assumed to lie entirely in the presalt basement, with horizontal beds resting on the presalt basement. Within the basement a density con trast of 0.35 g per cm8 is assumed across a vertical fault, the region of higher density being under the mountains. This density contrast is shown extending from 3,000 to 16,000 feet below sea level. A better fit could be ob tained by appropriate changes in the inclination of the fault; or in the density contrast, depth to basement, or thickness of the zone of contrasting density, but such refinements are not warranted because of the lack of subsurface control.
Both models are probably extreme in their configura tion and in the density contrasts assumed. It is unlike ly that basement relief is as great as 8,000 feet between Wilson Mesa and Geyser Pass, and that density con trasts as large as 0.35 g per cm8 are present in the upper part of the presalt basement. We believe the anomaly is caused by some intermediate combination of base ment relief, salt thinning, and intrabasement density contrasts. Both models indicate that a structural zone involving the presalt basement exists parallel to the Wilson Mesa regional gradient.
The Wilson Mesa regional gradient apparently ends
near the northwest flank of the North Mountain group of peaks. A flatter gravity gradient continues north easterly across Polar Mesa and North Beaver Mesa to the Dolores Eiver, but a more pronounced gradient swings abruptly around the north flank of North Mountain and continues to the southeast toward Para dox Valley. This regional gradient parallels the northeast side of North Mountain and the southwest limb of the Paradox Valley salt anticline, hence it is termed the Paradox Valley regional gradient. It continues along most of the length of Paradox Valley in the Uravan area (Joesting and Byer'y, 1958, p. 12, pi. 3), and corresponds to an inferred I^asement fault along the southwest flank of Paradox Vr-Uey (Joesting and Case, 1960, figs. 114.2 and 114.3).
From the eastern flank of the La Sal Mountains to Buckeye Eeservoir, at the head of Paradox Valley, the gravity values decrease from 116 to 90 milligals. The gravitational effects of the igneous intrusions of the La Sal Mountains are probably at a minium, here, so that a reasonable estimate of the magnitude of the gra dient can be made. Smoothing of regional gravity con tours suggests that no more than 10 milligals of the decrease is due to the effects of thickened salt along the northwest extension of the Paradox Valley salt anti cline. Near Buckeye Reservoir the effects of the igneous intrusions are relatively small, as the nearest outcrops of diorite porphyry are 7 miles away at Mount Peale. Thus, the decrease of at least 16 milligals across the Paradox Valley regional gradient m?y be explained in part by deeper basement rocks under Paradox Val ley and Beaver Mesa than under the area southwest of Buckeye Reservoir. A steep drop in the presalt base ment surface across the Paradox Valley regional gradi ent is indicated by data from the Continental 1 Scorup in Paradox Valley and the Shell 1 Wrr.y Mesa Unit 5 miles southwest of the Continental 1 Scorup (fig. 34). Original depositional thickening of the Paradox Mem ber of the Hermosa Formation toward the northeast may also explain part of the gradient. If such dep ositional thickening took place at the base of the Para dox Member, and, if the gradient is lar-rely caused by it, the sharpness of the gradient indicates faulting in Paradox time, perhaps contemporaneous with salt deposition.
GRAVITY AND MAGNETIC HIGHS NORTflFWEST OF THE LiA SAL MOUNTAINS
A broad gravity high extends from the Hubbard 1 Government across Professor Creek to Fegro Bill Can yon northwest of the La Sal Mountains Gravity lows over the salt anticlines at Fisher and Castle Valleys are superimposed on this regional gravity 1 igh. The high coincides generally with a broad magnetic high (pi.
GEOPHYSICAL INVESTIGATIONS IN THE LA SAL MOUNTAINS 105
16) whose axis extends southwestward parallel to the Colorado Eiver. Such coincidence of gravity and mag netic highs indicates that the basement is probably more dense and highly magnetized near Professor Creek than near Negro Bill Canyon. Regional depositional thickening of salt toward Negro Bill Canyon may also contribute to the gravity anomaly.
GRAVITY LOW NEAR THE DOLORES RIVER
Along the Dolores River a regional gravity low coin cides with the Sagers Wash syncline, which involves beds as young as the Mancos Shale of Late Cretaceous age just north of the area shown on plate 14. The low represents deep and possibly low-density basement rocks, but it probably does not reflect the effect of thick salt because the proportion of clastic material in the Paradox Member is undoubtedly large in this region near the Uncompahgre front.
A saddle in the gravity contours is seen near the Pure Gateway 1, coinciding generally with a broader saddle in the structure contours. Therefore, the gravity con tours probably partly reflect post-Mancos structural movements.
GRAVITY AND MAGNETIC HIGHS SOUTHWEST AND
SOUTH OF SOUTH MOUNTAIN
The gravity high which extends westward from South Mountain to Kane Springs Canyon is related partly to thinning of low-density salt between the Span ish Valley-Pack Creek salt anticline to the north and the Lisbon Valley salt anticline to the south (Byerly and Joesting, 1959, p. 45-46). The high is at the south ern margin of the Pack Creek regional gradient, and may therefore also be related to dense or shallow base ment rocks.
The steepened regional magnetic gradient south and southwest of South Mountain (pis. 15, 16) is offset to the left by the transverse magnetic trend already dis cussed. North of this gradient the basement is more magnetic and possibly shallower, but no reliable esti mates of depth could be made because the flight lines are nearly parallel to the magnetic trend. The mag netic high southwest of Spanish Valley coincides in part with the gravity high at Kane Springs Canyon, and may partly reflect a shallow ridge bounding the deeper part of the salt basin to the north. In general, the magnetic trends and gradients in the south part of the area probably reflect Precambrian compositional and structural trends more nearly than the gravity anomalies, as the latter are influenced by contrasts in the density and thickness of the sedimentary rocks as well as in the crystalline basement. East-west trends of gravity and magnetic contours indicate that Precam
brian compositional and structural trends are nearl^ east-west to the south and west of South Mountain.
CONFIGURATION OF THE BASEMENT SURFACE
Little is known of the configuration of the Precam brian surface in the La Sal Mountains area because of the scarcity of deep wells and because most of the mag netic anomalies are not suitable for depth estimate ̂ However, a few wells in or near the margins of tH area allow estimation of the depth to the basement when combined with gravity and magnetic data (fig. 34).
The Delhi-Taylor 2 Utah was drilled completely through the core of the Moab salt anticline and reached the lower member of the Hermosa Formation at an ele vation of about 5,000 feet below sea level (Hite, 196'), fig. 1). Assuming 2,000 feet of pre-Pennsylvanian beds, the elevation of the top of the Precambrian is about 7,000 feet below sea level. There is probably relatively little basement relief between the Delhi-Taylor well ard Wilson Mesa, based on flat regional gravity and mag netic gradients (Joesting and Case, 1960, figs. 114.2 ari 114.3), so the elevation of the Precambrian surface at Wilson Mesa can also be assumed to about 7,000 feet b*- low sea level.
In the analysis of the Wilson Mesa regional gradient (fig. 37) two extremes of basement relief were shown in the region between Wilson Mesa and Geyser Pass 8,000 feet of basement relief (model A) and no basement re lief (model B). From these extreme estimates, we have chosen an intermediate basement relief of about 4,000 feet between Wilson Mesa and Geyser Pass, thus the elevation of the top of the Precambrian at Geyser Pass may be on the order of 3,000 to 4,000 feet below S"*a level.
Precambrian rocks were penetrated at an elevation of 4,668 feet below sea level at the Shell 1 Wray Me^a Unit, just east of the La Sal Mountains area. Between Geyser Pass and the Shell well, the basement probably drops about 1,500 feet. The Continental 1 Scorup was drilled through the core of Paradox Valley salt anti cline (Jones, 1959, p. 1888) and rocks of Mississippian age were found at a depth of 14,700 feet or about 9,700 feet below sea level. The top of the Precambrian is estimated to be about 11,000 feet below sea level, as suming 1,300 feet of pre-Pennsylvanian beds. There fore, if our assumptions are correct, the Precambrian surface drops 8,000 feet between Geyser Pass and Para dox Valley and about 6,300 feet between Wray Me^ia and Paradox Valley. The dropoff in the basement coincides with the Paradox Valley regional gravity gradient.
In Sinbad Valley salt anticline, the Huber 1 Sinb^d (sec. 16, T. 49 N., R. 19 W., New Mexico principal

106 GEOPHYSICAL FIELD INVESTIGATIONS
ridian) bottomed in evaporites of the Paradox Member at a depth of 10,300 feet, or at 4,800 feet below sea level (Shoemaker and others, 1958, p. 43, 58). If the well reached almost to the bottom of the Paradox Member, and if there are 1,200 feet of beds of pre-Paradox age, the elevation of the Precambrian surface is about 6,000 feet below sea level. On the other hand, if the total column of salt at Sinbad Valley anticline is as thick as at Paradox Valley, 14,700 feet, and if there are 1,300 feet of beds of pre-Paradox age, the Precambrian sur face is 10,500 feet below sea level. Between these limits we have arbitrarily estimated the top of the Precam brian surface at 9,000 feet below sea level at Sinbad Valley, weighting our estimate toward the deeper limit because regional gravity and magnetic contours indicate relatively little basement relief between Paradox and Sinbad Valleys.
Along the structural front of the Uncompahgre up lift, the top of the Precambrian is 3,100 feet below sea level in the Pure 1 Gateway. Therefore, between the Pure 1 Gateway and Paradox Valley, the basement drops about 8,000 feet. Both gravity and magnetic gradients between Paradox Valley and the Pure well indicate that most of this relief takes place in a rela tively restricted zone that coincides with the northeast flank of Sagers Wash syncline. The saddle in the form lines of figure 34, southwest of the Pure 1 Gateway, is based on saddles in the structure contours (pi. 14) and in the gravity contours (pi. 17). Just north of the area shown in figure 34 the Eichfield Onion Creek (sec. 31, T. 23 S., E. 24 E.) bottomed in the Paradox Member at an elevation of 9,615 feet below sea level. The Precam brian basement is probably about 11,000 feet below sea level.
Deep wells are comparatively abundant southeast and southwest of the La Sal Mountains. As noted previ ously, the Humble 1 Bridger southwest of Spanish Valley bottomed in Cambrian strata at an elevation of 2,520 feet below sea level. Precambrian rocks are probably about 500 feet deeper, at an elevation of 3,000 feet below sea level. The E. B. La Eue 1 Government (sec. 15, T. 27 S., E. 22 E., Salt Lake meridian) near the southwest flank of Spanish Valley penetrated Mis- sissippian strata at 1,755 feet below sea level and Pre cambrian rocks are estimated to lie at 3,700 feet below sea level, assuming 2,000 feet of Mississippian, Devo nian, and Cambrian beds. The drop in the basement surface between the Humble well and the Delhi-Taylor well on Moab Valley anticline is about 4,000 feet. The California Co. 1 Muleshoe (sec. 2, T. 28 S., E. 23 E.) penetrated Mississippian beds at 3,388 feet below sea level; Precambrian basement is estimated to lie at about 5,000 feet below sea level. Much of this basement
relief probably coincides with the Sparish Valley re gional gravity gradient. The Pure 1 La Sal (sec. 19, T. 29 S., R. 24 E.) penetrated Mississippian beds at S,145 feet below sea level; Precambrian basement is estimated at 4,800 feet below sea level.
Other wells near the Colorado Eiver that provide con trol on the configuration of the Precambrian surface are shown on figure 34. A number of deep wells have been drilled near Lisbon Valley anticline, just south of the area shown on figure 34. They indicate that the basement surface is very irregular and that Lisbon Val ley anticline apparently is underlain by a grabenlike depression.
Geophysical and well data thus indicate that the three segments of the large regional gravity gradient outline a zone of more dense or shallower basement rock or thinner salt (or all three) south of and beneath the La Sal Mountains, and a broad region of less dense or deeper basement rocks or thicker salt (or all three) under Beaver Mesa and Spanish, Castle, and Paradox Valleys (fig. 34). The nature of the boundary between these two broad zones is not known, but basement faults are probable, especially near North Mountain and Para dox Valley.
The northeastward-trending basement structure along the west flank of the La Sal Mountains, extending to the Uncompahgre uplift near the Dolores Eiver, is part of a broader regional pattern of transverse base ment structures in the central Colorado Plateau which is en echelon with the Colorado mineral belt (Case and Joesting,1961).
GRAVITY AND MAGNETIC ANOMALIES ASSOCIATED WITH SALT ANTICLINES
SINBAD VAULEY-PISHBR VAIXBY SAJJT ANTICLINE
In the following analysis of the gravity anomalies of the salt anticlines, estimates of the densities of their cores are based on the supposition that evaporites near the Uncompahgre front contain a higher proportion of clastic material and are therefore denser than those farther southwest. Thus, a density of 2.25 g per cm3 has been assumed for the core of Castle Valley anticline and 2.30 for the core of Fisher Valley anticline, as the latter is closer to the structural front.
A gravity low of about 16 milligals is associated with Sinbad Valley salt anticline. The Huber 1 Sinbad, near the center of the valley (fig. 34), bottomed in evaporites after penetrating about 10,300 feet of e,vaporites and clastic material. In an earlier report, Shoemaker and others (1958, p. 43) estimated from well logs that the composition of the core of the Sinbad Valley anticline includes 42 percent evaporites and 58 percent clastic material. Assuming that the density of the evaporites
GEOPHYSICAL INVESTIGATIONS IN THE LA SAL MOUNTAINS 107
is 2.2 g per cm3 and the density of the clastic material is 2.5 g per cm3, the average density of the material in the core is about 2.37 g per cm8.
Reanalysis of logs of the Huber well indicates that the proportion of clastic material in the core of the anti cline is probably less than originally estimated, being about 33 percent rather than 58 percent (C. L. Jones, D. P. Elston, and E. M. Shoemaker, written commu nication, 1961). Therefore, the average density of ma terial in the core is probably about 2.3 g per cm8. If this is correct, the vertical extent of the core of the anti cline may be less than 11,000 feet.
A magnetic high just southwest of Sinbad Valley (pi. 14) is probably associated mainly with higher mag netization of the basement rocks, although it may re sult in part from shallower basement. Ordinarily the effects of basement topography cannot be distinguished from those of small contrasts in magnetization. This anomaly, together with a similar magnetic high in the Uravan area to the southeast (Joesting and Byerly, 1958, pi. 2) is alined with the Sinbad Valley salt anti cline and may indicate basement control.
Northwest of Sinbad Valley a gravity low follows a graben system toward Fisher Valley; changes in trend of the gravity low correspond to changes in trend of the graben system. Thus Sinbad Valley salt anticline is offset to the northeast with respect to the Fisher Valley salt anticline, as shown by the surface structure and the gravity contours.
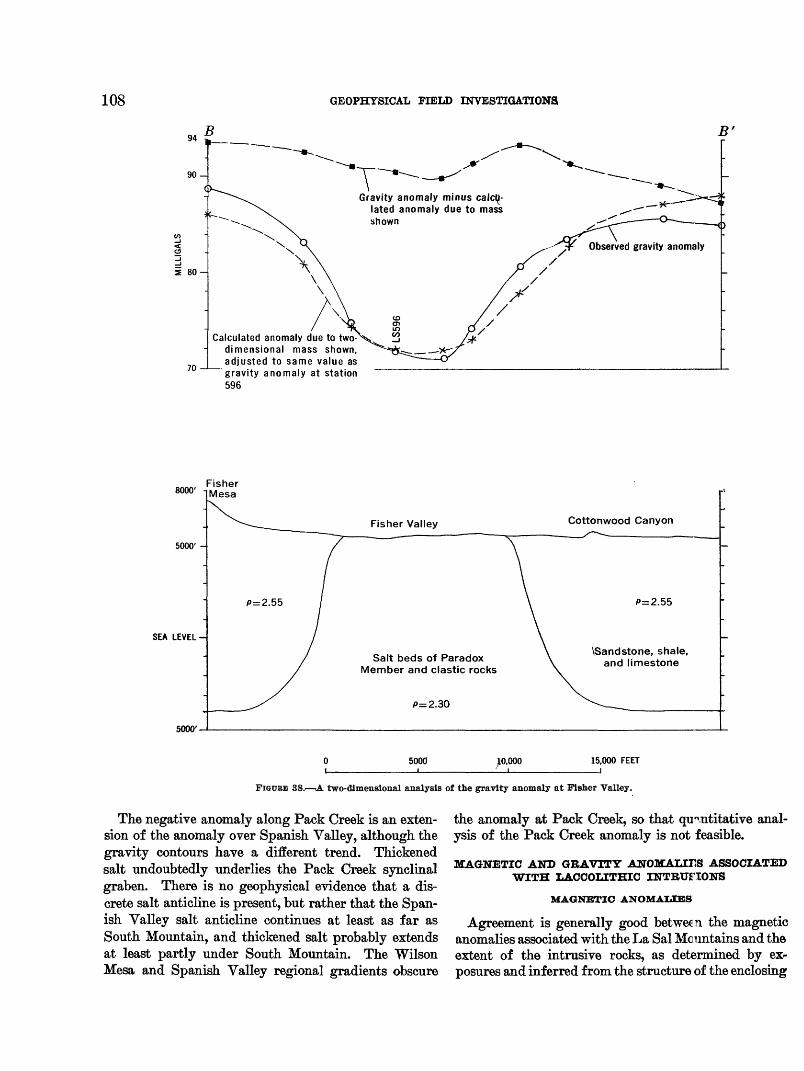
The residual gravity low associated with the Fisher Valley salt anticline is about 18 milligals. Figure 38 shows an interpretation of the anomaly over the valley. The surficial margins of the salt core were picked from a map of Shoemaker (1954), and the subsurface config uration and distribution of rock densities were adjusted to yield a computed anomaly agreeing with the ob served anomaly. The computed vertical extent of the core is about 10,000 feet, when densities of 2.3 and 2.55 g per cm3 are assumed respectively for the core and for the beds outside the core.
A gravity low continues westerly from the northwest end of Fisher Valley. The low, which is nearly parallel to but slightly north of a fault system (pi. 14) in the central part of T. 24 S., K. 23 E. (Salt Lake meridian), is probably related to a zone of thickened salt connect ing the core of the Fisher Valley anticline with the core of the Cache Creek-Salt Valley anticline.
There is little gravity or magnetic evidence that base ment structures coincide with the Fisher Valley anti cline. The magnetic map indicates that compositional trends of the basement rock cross the axis of Fisher Valley.
PARADOX VALLEY-CASTLE VALLEY SALT ANTICLINE
Gravity and well data indicate that the amplitude of the salt core of the Paradox Valley anticline is about 10,000 feet (Joesting and Byerly, 1958, p. 14-15; Joner 1959, p. 1888). The gravity low over Paradox Valley continues northwest past Buckeye Reservoir, toward North Mountain, and is terminated by the northwest ward-trending Paradox Valley regional gradient and the gravity high associated with the laccolithic intru sions at North Mountain. The abrupt decrease in th<?i amplitude of the negative anomaly near Buckeye Res ervoir indicates that the vertical extent of the anticlir<?. decreases toward North Mountain. There is no gravity evidence of thickened salt northeast of the SE*4 T. £3 S., R. 25 E. (Salt Lake meridian) at the county lir<s (Pl. 17).
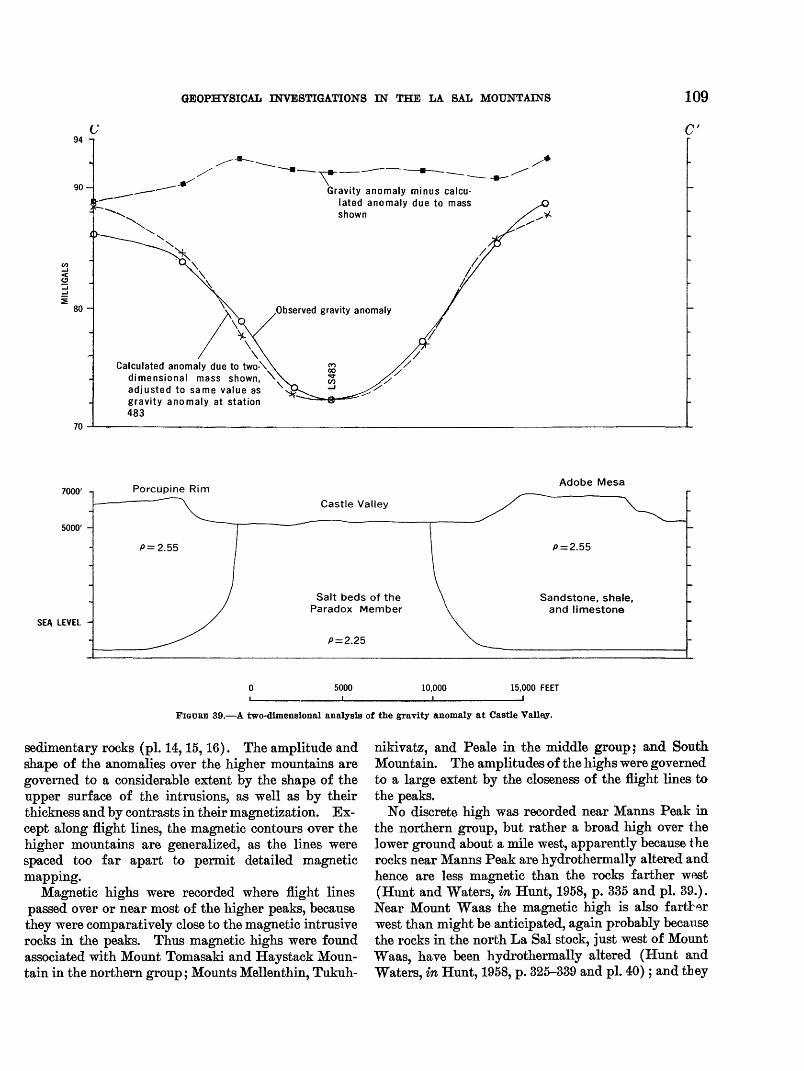
Castle Valley is underlain by a salt anticline, tH southeastern part of which has been intruded by tH laccoliths at North Mountain. The shape of the gravity contours indicates that thickened salt extends beneath at least the northwestern part of North Mountain. TH residual gravity low associated with the salt core of Castle Valley is about 16 milligals. An interpretation of the anomaly is shown in figure 39. In the analys: « a density of 2.25 g per cm3 was assumed for the salt cor^ and the average density of the adjacent rocks was as sumed to be 2.55 g per cm3 . The gravity effects of Round Montain, an intrusive body of diorite porphyry, complicate the gravity minimum in the center of Castle Valley. Therefore the residual gravity low may It somewhat more positive than if the igneous body were not present, and the computed vertical extent of tho salt core may be too small. The computed amplitude is about 7,000 feet.
Evidently the intrusive body that forms RomH Mountain is too small to produce measurable magnetic effects at the altitude at which the survey was flown. The flight altitude was 12,500 feet and the altitude cf Round Mountain is 6,184 feet. Samples of the un- weathered diorite porphyry contained magnetic min erals in about the same proportion as those from the La Sal Mountains.
PINE RIDGE-PACK CREEK VALLEY-SPANISH VALLEY SALT ANTICLINES
The geologic map (pi. 14) shows that the Pine Ridgre salt anticline is alined with the laccolithic intrusions cf South Mountain. The gravity trough southeast of South Mountain indicates that thickened salt underlies the intrusions, although gravity coverage is sparse. The gravity anomaly over Pine Ridge anticline has been analyzed by Byerly and Joesting (1959, p. 48-49).
108 GEOPHYSICAL FIELD INVESTIGATIONS
Gravity anomaly minus calcij- lated anomaly due to mass shown
s 80-
70
Calculated anomaly due to two- dimensional mass shown, adjusted to same value as gravity anomaly at station 596
«nnn' Fisher 8000 IMesa
5000' -
SEA LEVEL -
5000'
Fisher Valley Cottonwood Canyon
Salt beds of Paradox Member and clastic rocks
P=2.30
P=2.55
\Sandstone, shale, and limestone
5000 JtO.OOO 15,000 FEET
FIGOBB 38. A two-dimensional analysis of the gravity anomaly at Fisher Valley.
The negative anomaly along Pack Creek is an exten sion of the anomaly over Spanish Valley, although the gravity contours have a different trend. Thickened salt undoubtedly underlies the Pack Creek synclinal graben. There is no geophysical evidence that a dis crete salt anticline is present, but rather that the Span ish Valley salt anticline continues at least as far as South Mountain, and thickened salt probably extends at least partly under South Mountain. The Wilson Mesa and Spanish Valley regional gradients obscure
the anomaly at Pack Creek, so that quantitative anal ysis of the Pack Creek anomaly is not feasible.
MAGNETIC AND GRAVITY ANOMALIES ASSOCIATED WITH LACCOLITHIC INTRUFIONS
MAGNETIC ANOMAUCES
Agreement is generally good between the magnetic anomalies associated with the La Sal Mountains and the extent of the intrusive rocks, as determined by ex posures and inferred from the structure of the enclosing
GEOPHYSICAL INVESTIGATIONS IN THE LA SAL MOUNTAINS 109
c94 -T
90-
C'
80 -
70
Gravity anomaly minus calcu lated anomaly due to mass shown
Calculated anomaly due to two-\ dimensional mass shown, adjusted to same value as gravity anomaly at station 483
7000' n
5000' -
Porcupine Rim
SE/V LEVEL -
Castle Valley
Salt beds of the Paradox Member
P = 2.25
Adobe Mesa
= 2.55
Sandstone, shale, and limestone
5000 10,000 15,000 FEET
FIGURE 39. A two-dimensional analysis of the gravity anomaly at Castle Valley.
sedimentary rocks (pi. 14,15,16). The amplitude and shape of the anomalies over the higher mountains are governed to a considerable extent by the shape of the upper surface of the intrusions, as well as by their thickness and by contrasts in their magnetization. Ex cept along flight lines, the magnetic contours over the higher mountains are generalized, as the lines were spaced too far apart to permit detailed magnetic mapping.
Magnetic highs were recorded where flight lines passed over or near most of the higher peaks, because they were comparatively close to the magnetic intrusive rocks in the peaks. Thus magnetic highs were found associated with Mount Tomasaki and Haystack Moun tain in the northern group; Mounts Mellenthin, Tukuh-
nikivatz, and Peale in the middle group 5 and South Mountain. The amplitudes of the highs were governed to a large extent by the closeness of the flight lines to the peaks.
No discrete high was recorded near Manns Peak in the northern group, but rather a broad high over the lower ground about a mile west, apparently because the rocks near Manns Peak are hydrothermally altered and hence are less magnetic than the rocks farther west (Hunt and Waters, in Hunt, 1958, p. 335 and pi. 39.). Near Mount Waas the magnetic high is also farther west than might be anticipated, again probably because the rocks in the north La Sal stock, just west of Mount Waas, have been hydrothermally altered (Hunt and Waters, in Hunt, 1958, p. 325-339 and pi. 40); and they
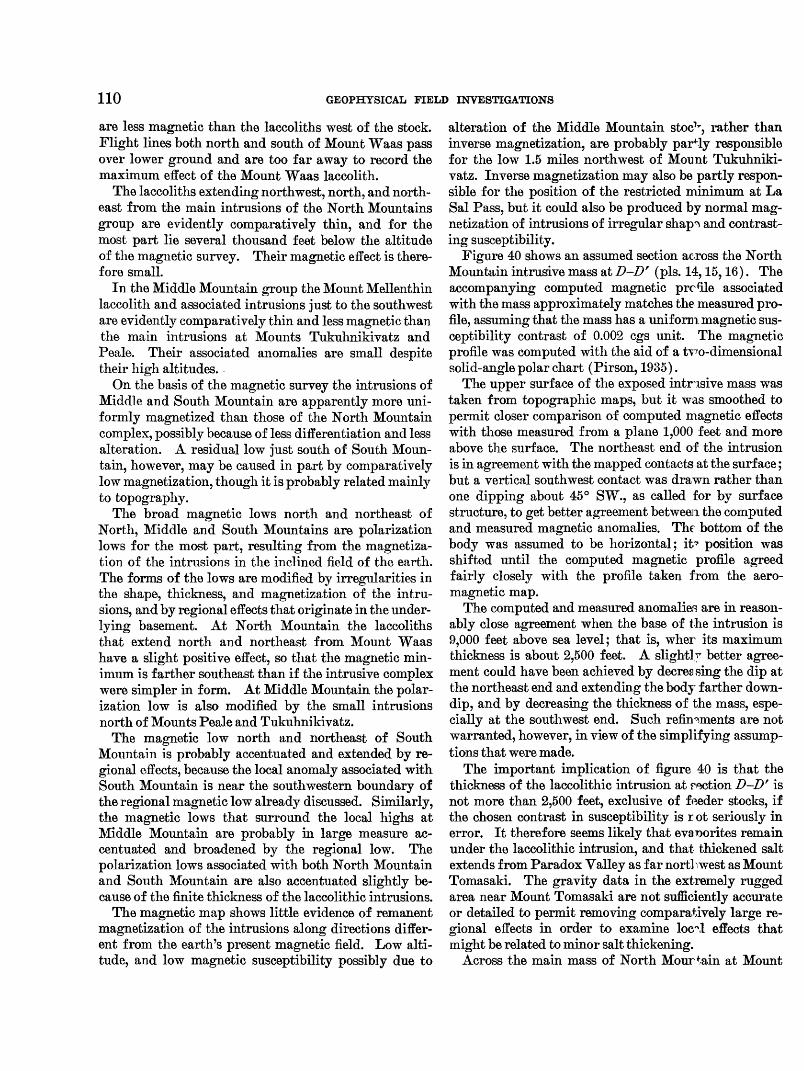
110 GEOPHYSICAL FIELD INVESTIGATIONS
are less magnetic than the laccoliths west of the stock. Flight lines both north and south of Mount Waas pass over lower ground and are too far away to record the maximum effect of the Mount Waas laccolith.
The laccoliths extending northwest, north, and north east from the main intrusions of the North Mountains group are evidently comparatively thin, and for the most part lie several thousand feet below the altitude of the magnetic survey. Their magnetic effect is there fore small.
In the Middle Mountain group the Mount Mellenthin laccolith and associated intrusions just to the southwest are evidently comparatively thin and less magnetic than the main intrusions at Mounts Tukuhnikivatz and Peale. Their associated anomalies are small despite their high altitudes.
On the basis of the magnetic survey the intrusions of Middle and South Mountain are apparently more uni formly magnetized than those of the North Mountain complex, possibly because of less differentiation and less alteration. A residual low just south of South Moun tain, however, may be caused in part by comparatively low magnetization, though it is probably related mainly to topography.
The broad magnetic lows north and northeast of North, Middle and South Mountains are polarization lows for the most part, resulting from the magnetiza tion of the intrusions in the inclined field of the earth. The forms of the lows are modified by irregularities in the shape, thickness, and magnetization of the intru sions, and by regional effects that originate in the under lying basement. At North Mountain the laccoliths that extend north and northeast from Mount Waas have a slight positive effect, so that the magnetic min imum is farther southeast than if the intrusive complex were simpler in form. At Middle Mountain the polar ization low is also modified by the small intrusions north of Mounts Peale and Tukuhnikivatz.
The magnetic low north and northeast of South Mountain is probably accentuated and extended by re gional effects, because the local anomaly associated with South Mountain is near the southwestern boundary of the regional magnetic low already discussed. Similarly, the magnetic lows that surround the local highs at Middle Mountain are probably in large measure ac centuated and broadened by the regional low. The polarization lows associated with both North Mountain and South Mountain are also accentuated slightly be cause of the finite thickness of the laccolithic intrusions.
The magnetic map shows little evidence of remanent magnetization of the intrusions along directions differ ent from the earth's present magnetic field. Low alti tude, and low magnetic susceptibility possibly due to
alteration of the Middle Mountain stocv, rather than inverse magnetization, are probably partly responsible for the low 1.5 miles northwest of Mount Tukuhniki vatz. Inverse magnetization may also be partly respon sible for the position of the restricted minimum at La Sal Pass, but it could also be produced by normal mag netization of intrusions of irregular shap^ and contrast ing susceptibility.
Figure 40 shows an assumed section across the North Mountain intrusive mass at D-D' (pis. 14,15,16). The accompanying computed magnetic profile associated with the mass approximately matches the measured pro file, assuming that the mass has a uniform magnetic sus ceptibility contrast of 0.002 cgs unit. The magnetic profile was computed with the aid of a two-dimensional solid-angle polar chart (Pirson, 1935).
The upper surface of the exposed intnsive mass was taken from topographic maps, but it was smoothed to permit closer comparison of computed magnetic effects with those measured from a plane 1,000 feet and more above the surface. The northeast end of the intrusion is in agreement with the mapped contacts at the surface; but a vertical southwest contact was drawn rather than one dipping about 45° SW., as called for by surface structure, to get better agreement between the computed and measured magnetic anomalies. The bottom of the body was assumed to be horizontal; ifc1 position was shifted until the computed magnetic profile agreed fairly closely with the profile taken from the aero- magnetic map.
The computed and measured anomalies are in reason ably close agreement when the base of the intrusion is 9,000 feet above sea level; that is, wher its maximum thickness is about 2,500 feet. A slightly better agree ment could have been achieved by decreasing the dip at the northeast end and extending the body farther down- dip, and by decreasing the thickness of the mass, espe cially at the southwest end. Such refinements are not warranted, however, in view of the simplifying assump tions that were made.
The important implication of figure 40 is that the thickness of the laccolithic intrusion at rection D-D' is not more than 2,500 feet, exclusive of feeder stocks, if the chosen contrast in susceptibility is i ot seriously in error. It therefore seems likely that evaioorites remain under the laccolithic intrusion, and that thickened salt extends from Paradox Valley as far northwest as Mount Tomasaki. The gravity data in the extremely rugged area near Mount Tomasaki are not sufficiently accurate or detailed to permit removing comparatively large re gional effects in order to examine loc<\l effects that might be related to minor salt thickening.
Across the main mass of North Mourtain at Mount

GEOPHYSICAL INVESTIGATIONS IN THE LA SAL MOUNTAINS 111
Waas, satisfactory agreement between measured and computed magnetic profiles was not possible without making unwarranted assumptions about the shape and dimensions of the intrusive complex. The best general agreement was obtained by computing the magnetic effects of a mass about 4,500 feet thick, with a hori zontal base about 7,000 feet above sea level, and by ig noring the effect of the stock at greater depths. These computations therefore merely imply what has already been inferred from geologic mapping: that the intru sion is thicker at the central stock near Mount Waas than farther southeast. They do not prove the absence of a stock.
Figure 41 shows an assumed section across the South Mountain intrusive mass at E-E' (pis. 14, 15, 16), to gether with measured and computed magnetic profiles. The same assumptions of susceptibility contrast and the same method of computation was used as for the profile on figure 40. The topographic profile of the upper sur face of the intrusive body was smoothed to permit more valid comparison with the aeromagnetic data. The northeast and southeast sides are in agreement with the position and attitude of the intrusive contacts, as indicated by contacts at the surface and the structure of the overlying sedimentary rocks, but the sides arbi
trarily cut off vertically at depth. A two-dimensional mass was assumed, which resulted in a computed ancm- aly about 10 percent larger than that from a thr?-e- dimensional mass. This error is not significant in view of errors that probably result from the other simplify ing assumptions.
The northeastern part of the computed profile devi ates considerably from the measured profile. A better match could have been obtained by flattening the north east contact to about 20° instead of 45°, and by ex tending the mass farther downdip. This would have resulted in raising the computed profile considerably at the highest point of the body and somewhat less at the northeastern end of the body whereas it would hiwe been lowered at the northeastern end of the profile. At the center of the body the profile would have raised or ly slightly and farther southeast it would not have been affected appreciably. Inasmuch as the intrusion is con cordant at the surface, however, it is likely that the northeastern contact continues steeply downward for at least several thousand feet at section E-E'.
The discrepancy between computed and measured magnetic profiles at their northeast ends is most reason ably explained by the complex outline of the South Mountain intrusion and its associated magnetic anomaly
D400 -i
D
Observed magnetic profile
N 4O° E
,Flight level of aeromagnetic survey
surface65° projected inclination
of magnetic field
K =0.002 cgs units
5000i
FIGURE 40. A two-dimensional analysis of the North Mountain magnetic anomaly.
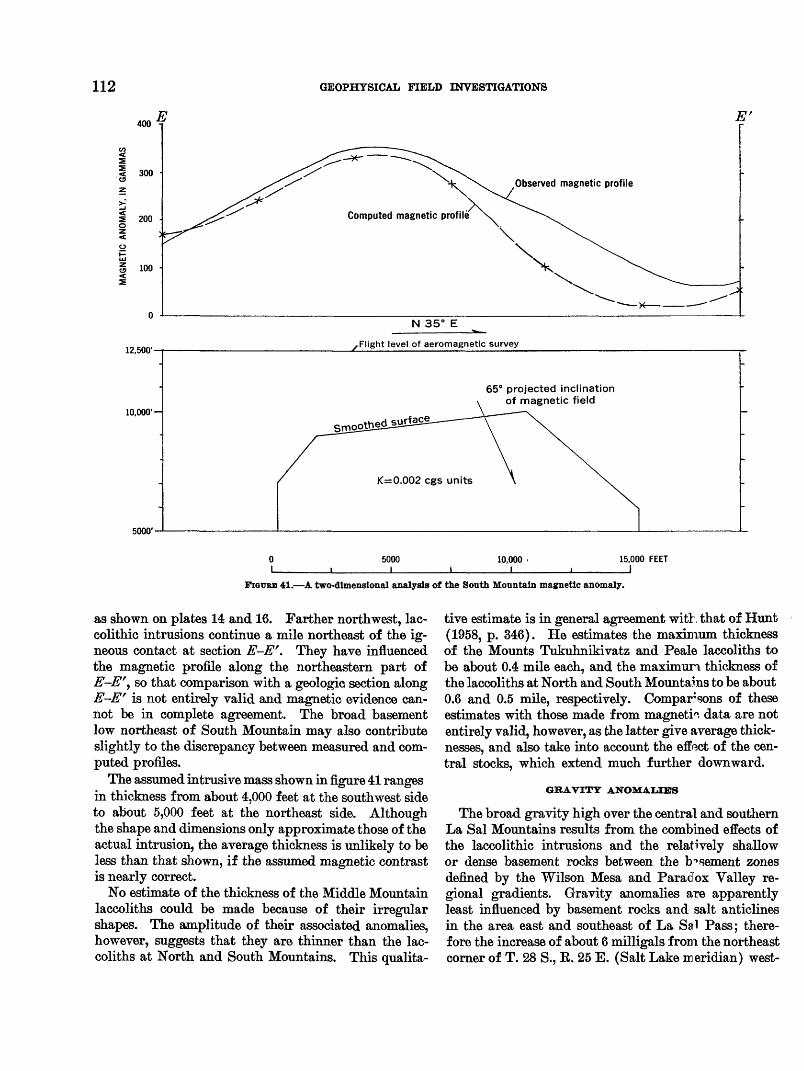
112 GEOPHYSICAL FIELD INVESTIGATIONS
E400 V
Computed magnetic profile \
N 35° E
12,500'
10,000'-
y Flight level of aeromagnetic survey
5000'
65° projected inclination of magnetic field
5000 I
10,000 I
FIGURE 41. A two-dimensional analysis of the South Mountain magnetic anomaly.
15,000 FEET _I
as shown on plates 14 and 16. Farther northwest, lae- colithic intrusions continue a mile northeast of the ig neous contact at section E-E'. They have influenced the magnetic profile along the northeastern part of E-E', so that comparison with a geologic section along E-E' is not entirely valid and magnetic evidence can not be in complete agreement. The broad basement low northeast of South Mountain may also contribute slightly to the discrepancy between measured and com puted profiles.
The assumed intrusive mass shown in figure 41 ranges in thickness from about 4,000 feet at the southwest side to about 5,000 feet at the northeast side. Although the shape and dimensions only approximate those of the actual intrusion, the average thickness is unlikely to be less than that shown, if the assumed magnetic contrast is nearly correct.
No estimate of the thickness of the Middle Mountain laccoliths could be made because of their irregular shapes. The amplitude of their associated anomalies, however, suggests that they are thinner than the lac coliths at North and South Mountains. This qualita
tive estimate is in general agreement with that of Hunt (1958, p. 346). He estimates the maximum thickness of the Mounts Tukuhnikivatz and Peale laccoliths to be about 0.4 mile each, and the maximum thickness of the laccoliths at North and South Mountains to be about 0.6 and 0.5 mile, respectively. Comparisons of these estimates with those made from magnetic data are not entirely valid, however, as the latter give average thick nesses, and also take into account the effect of the cen tral stocks, which extend much further downward.
GRAVITY ANOMALJES
The broad gravity high over the central and southern La Sal Mountains results from the combined effects of the laccolithic intrusions and the relatively shallow or dense basement rocks between the basement zones defined by the Wilson Mesa and Paradox Valley re gional gradients. Gravity anomalies are apparently least influenced by basement rocks and salt anticlines in the area east and southeast of La Sal Pass; there fore the increase of about 6 milligals from the northeast corner of T. 28 S., R. 25 E. (Salt Lake meridian) west-
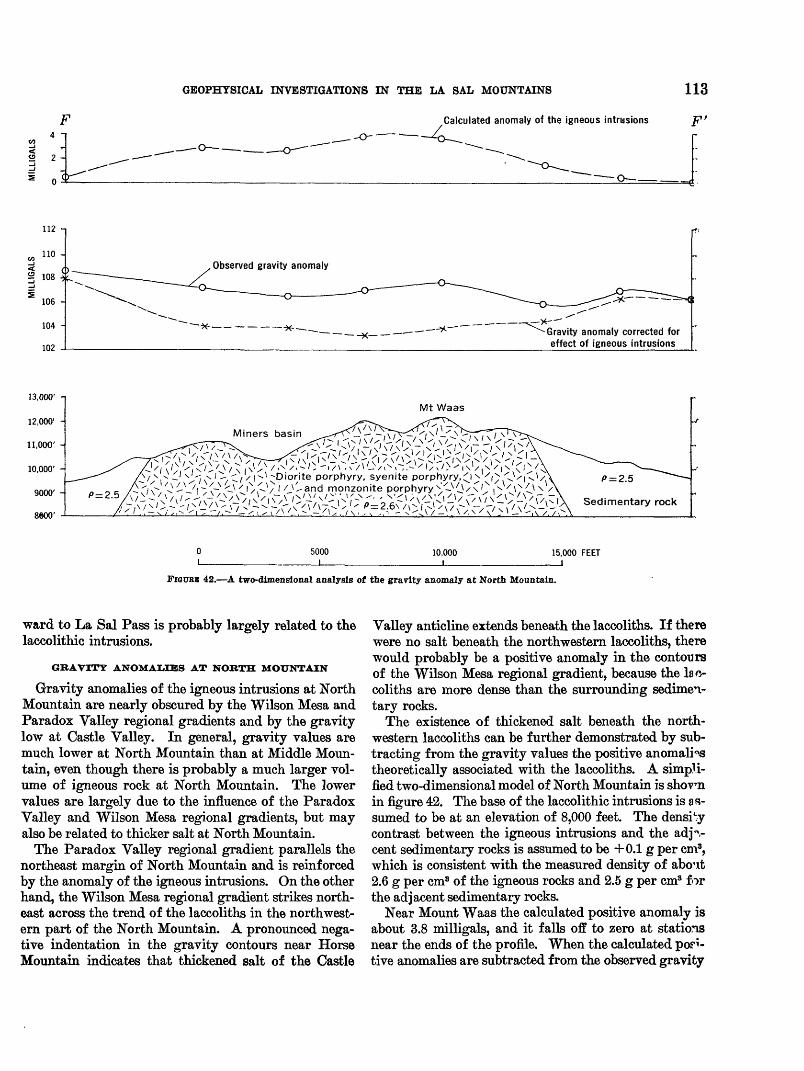
4 I
<s 2 -
GEOPHYSICAL INVESTIGATIONS IN THE LA SAL MOUNTAINS
Calculated anomaly of the igneous intrusions
________ " ' -O -
113
F'
112 n
Gravity anomaly corrected for effect of igneous intrusions
Diorite porphyry, syenite porphyry monzonite porphyry
5000 . I
10,000I
FIOOBB 42. A two-dimensional analysis of the gravity anomaly at North Mountain.
15,000 FEET _I
ward to La Sal Pass is probably largely related to the laccolithic intrusions.
GRAVITY ANOMALIES AT NORTH MOUNTAIN
Gravity anomalies of the igneous intrusions at North Mountain are nearly obscured by the Wilson Mesa and Paradox Valley regional gradients and by the gravity low at Castle Valley. In general, gravity values are much lower at North Mountain than at Middle Moun tain, even though there is probably a much larger vol ume of igneous rock at North Mountain. The lower values are largely due to the influence of the Paradox Valley and Wilson Mesa regional gradients, but may also be related to thicker salt at North Mountain.
The Paradox Valley regional gradient parallels the northeast margin of North Mountain and is reinforced by the anomaly of the igneous intrusions. On the other hand, the Wilson Mesa regional gradient strikes north east across the trend of the laccoliths in the northwest ern part of the North Mountain. A pronounced nega tive indentation in the gravity contours near Horse Mountain indicates that thickened salt of the Castle
Valley anticline extends beneath the laccoliths. If there were no salt beneath the northwestern laccoliths, there would probably be a positive anomaly in the contours of the Wilson Mesa regional gradient, because the lac coliths are more dense than the surrounding sedimen tary rocks.
The existence of thickened salt beneath the north western laccoliths can be further demonstrated by sub tracting from the gravity values the positive anomali^ theoretically associated with the laccoliths. A simpli fied two-dimensional model of North Mountain is shovn in figure 42. The base of the laccolithic intrusions is as sumed to be at an elevation of 8,000 feet. The density contrast between the igneous intrusions and the adja cent sedimentary rocks is assumed to be +0.1 g per cm8, which is consistent with the measured density of abont 2.6 g per cm8 of the igneous rocks and 2.5 g per cm3 for the adjacent sedimentary rocks.
Near Mount Waas the calculated positive anomaly is about 3.8 milligals, and it falls off to zero at stations near the ends of the profile. When the calculated pofi- tive anomalies are subtracted from the observed gravity
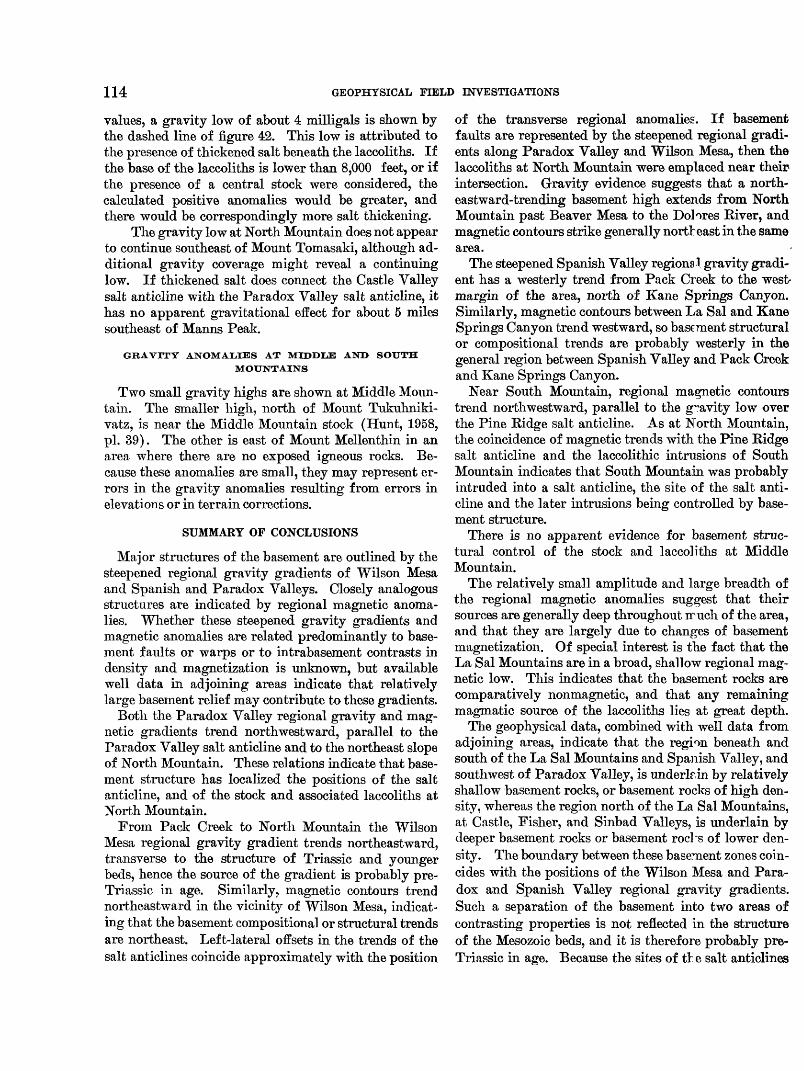
114 GEOPHYSICAL FIELD INVESTIGATIONS
values, a gravity low of about 4 milligals is shown by the dashed line of figure 42. This low is attributed to the presence of thickened salt beneath the laccoliths. If the base of the laccoliths is lower than 8,000 feet, or if the presence of a central stock were considered, the calculated positive anomalies would be greater, and there would be correspondingly more salt thickening.
The gravity low at North Mountain does not appear to continue southeast of Mount Tomasaki, although ad ditional gravity coverage might reveal a continuing low. If thickened salt does connect the Castle Valley salt anticline with the Paradox Valley salt anticline, it has no apparent gravitational effect for about 5 miles southeast of Manns Peak.
GRAVITY ANOMALIES AT MEDDLE AND SOUTH MOUNTAINS
Two small gravity highs are shown at Middle Moun tain. The smaller high, north of Mount Tukuhniki- vatz, is near the Middle Mountain stock (Hunt, 1958, pi. 39). The other is east of Mount Mellenthin in an area where there are no exposed igneous rocks. Be cause these anomalies are small, they may represent er rors in the gravity anomalies resulting from errors in elevations or in terrain corrections.
SUMMARY OF CONCLUSIONS
Major structures of the basement are outlined by the steepened regional gravity gradients of Wilson Mesa and Spanish and Paradox Valleys. Closely analogous structures are indicated by regional magnetic anoma lies. Whether these steepened gravity gradients and magnetic anomalies are related predominantly to base ment faults or warps or to intrabasement contrasts in density and magnetization is unknown, but available well data in adjoining areas indicate that relatively large basement relief may contribute to these gradients.
Both the Paradox Valley regional gravity and mag netic gradients trend northwestward, parallel to the Paradox Valley salt anticline and to the northeast slope of North Mountain. These relations indicate that base ment structure has localized the positions of the salt anticline, and of the stock and associated laccoliths at North Mountain.
From Pack Creek to North Mountain the Wilson Mesa regional gravity gradient trends northeastward, transverse to the structure of Triassic and younger beds, hence the source of the gradient is probably pre- Triassic in age. Similarly, magnetic contours trend northeastward in the vicinity of Wilson Mesa, indicat ing that the basement compositional or structural trends are northeast. Left-lateral offsets in the trends of the salt anticlines coincide approximately with the position
of the transverse regional anomalies. If basement faults are represented by the steepened regional gradi ents along Paradox Valley and Wilson Mesa, then the laccoliths at North Mountain were emplaced near their- intersection. Gravity evidence suggests that a north eastward-trending basement high extends from North Mountain past Beaver Mesa to the Dolores River, and magnetic contours strike generally northeast in the same area.
The steepened Spanish Valley regional gravity gradi ent has a westerly trend from Pack Creek to the west- margin of the area, north of Kane Springs Canyon. Similarly, magnetic contours between La Sal and Kane Springs Canyon trend westward, so basement structural or compositional trends are probably westerly in the general region between Spanish Valley and Pack Creek and Kane Springs Canyon.
Near South Mountain, regional magnetic contours trend northwestward, parallel to the gravity low over the Pine Ridge salt anticline. As at North Mountain, the coincidence of magnetic trends with the Pine Ridge salt anticline and the laccolithic intrusions of South Mountain indicates that South Mountain was probably intruded into a salt anticline, the site of the salt anti cline and the later intrusions being controlled by base ment structure.
There is no apparent evidence for basement struc tural control of the stock and laccoliths at Middle Mountain.
The relatively small amplitude and large breadth of the regional magnetic anomalies suggest that their sources are generally deep throughout iruch of the area, and that they are largely due to changes of basement magnetization. Of special interest is the fact that the La Sal Mountains are in a broad, shallow regional mag netic low. This indicates that the basement rocks are comparatively nonmagnetic, and that any remaining magmatic source of the laccoliths lies at great depth.
The geophysical data, combined with well data from adjoining areas, indicate that the region beneath and south of the La Sal Mountains and Spanish Valley, and southwest of Paradox Valley, is underlfin by relatively shallow basement rocks, or basement rocks of high den sity, whereas the region north of the La Sal Mountains, at Castle, Fisher, and Sinbad Valleys, is underlain by deeper basement rocks or basement rod's of lower den sity. The boundary between these basement zones coin cides with the positions of the Wilson Mesa and Para dox and Spanish Valley regional gravity gradients. Such a separation of the basement into two areas of contrasting properties is not reflected in the structure of the Mesozoic beds, and it is therefore probably pre- Triassic in age. Because the sites of tt e salt anticlines

GEOPHYSICAL INVESTIGATIONS IN THE LA SAL MOUNTAINS 115
of Paradox and Spanish Valleys were probably deter mined by faults or warps delimiting these two base ment zones, they may have originated in late Paleozoic time, accompanying uplift of the ancestral Uncompah- gre Range and the development of the Paradox basin. If this is so, these faults or warps may have influenced the depositional thickness of the Paradox salt; salt thickness may have been greater north of the boundary than south of it. It is also possible that the zone origi nated prior to late Paleozoic time and was subse quently rejuvenated during late Paleozoic deformation.
There is no geophysical evidence that basement struc ture controlled the positions of Castle Valley and Fisher Valley salt anticlines; magnetic contours and regional gravity contours are transverse to these anti clines. The site of Sinbad Valley salt anticline may have been controlled by basement structure, but the geo physical evidence is not strong.
The vertical amplitudes of the salt anticlines of the area are on the order of 7,000 to 10,000 feet, on the basis of analysis of their associated gravity anomalies. Thickened salt of the Castle Valley salt anticline ex tends under the laccoliths of North Mountain, but the extent of salt thickening or elevation of the base of the laccoliths cannot be determined from gravity data.
Correlation is generally good between magnetic anomalies and the positions of the igneous intrusions of the mountains. Analysis of the magnetic anomaly at North Mountain indicates that the average elevation of the base of the laccoliths in the southeastern part is about 9,000 feet, and it is probably lower under the cen tral part. At South Mountain, the average elevation of the base of the laccoliths is estimated to be about 5,000 feet.
REFERENCES CITED
Baker, A. A., 1933, Geology and oil possibilities of the Moab district, Grand and San Juan Counties, Utah: U.S. Geol. Survey Bull. 841, 95 p.
Baker, A. A., Dobbin, C. E. McKnight, E. T., and Reeside, J. B., Jr., 1927, Notes on the stratigraphy of the Moab re gion, Utah: Am. Assoc. Petroleum Geologists Bull., v. 11, p. 785-808.
Balsley, J. R., Jr., 1952, Aeromagnetic surveying : Advances in Geophysics, v. 1, p. 314-349.
Bass, N. W., 1944, Correlation of basal Permian and older rocks in southwestern Colorado, northwestern New Mexico, north eastern Arizona, and southeastern Utah: U.S. Geol. Survey Oil and Gas Inv. Prelim. Chart 7.
Birch, A. F., Schairer, J. F., and Spicer, H. C., eds., 1942, Hand book of physical constants: Geol. Soc. America Spec. Paper 36, 325 p.
Breed, C. B., and Hosmer, G. L., 1953, The principles and prac tice of surveying: New York, John Wiley & Sons, v. 2, p. 178-196.
Byerly, P. E., and Joesting, H. R., 1959, Regional geophysical investigations of the Lisbon Valley area, Utah and Colo rado: U.S. Geol. Survey Prof. Paper 316-C, p. 39-51.
Carter, W. D., 1956, The Burro Canyon-Dakota contact in tin Mount Peale No. 1 quadrangle, western Colorado and east ern Utah, in Intermountain Assoc. Petroleum Geologists Guidebook, 7th Ann. Field Conf., 1956: p. 113-115.
Carter, W. D., and Gualtieri, J. L., 1957a, Preliminary geologic map of the Mount Peale 1 SE quadrangle, Montrose County, Colorado, and San Juan County, Utah: U.S. Geol Survey Mineral Inv. Field Studies MapMF-123.
1957b, Preliminary geologic map of the Mount Peale 1 SW guadrangle, San Juan County, Utah: U.S. Gecl. Survey Mineral Inv. Field Studies Map MF-124.
1958, Preliminary geologic map of the Mount Peale1 NW quadrangle, San Juan County, Utah: U.S. Gecl. Survey Mineral Inv. Field Studies Map MF-140.
Carter, W. D., Gualtieri, J. L., and Shoemaker, E. M., 195^, Preliminary geologic map of the Mount Peale 1 NE quad rangle, Montrose County, Colorado, and San Juan County, Utah: U.S. Geol. Survey Mineral Inv. Field Studies Mep MF-139.
Case, J.E., and Joesting, H. R., 1961, Northeast-trending Pr> cambrian structures in the central Colorado Plateau [abs.]: Geol. Soc. America Bull., Rocky Mountains Sec. Program, p. 13.
Cater, F. W., Jr., 1955, The salt anticlines of southwestern Colorado and southeastern Utah, in Four Corners Geologi cal Society [Guidebook], Geology of parts of Paradox, Black Mesa, and San Juan basins, 1955: p. 125-131.
Cooper, J. C., 1955, Cambrian, Devonian, and Mississippim rocks of the Four Corners area, in Four Corners Geological Society [Guidebook], Geology of parts of Paradox, Black Mesa, and San Juan basins, 1955: p. 59-65.
Craig, L. C., and Dickey, D. D., 1956, Jurassic strata of south eastern Utah and southwestern Colorado, in Intermountain Assoc. Petroleum Geologists Guidebook, 7th Ann. FieM Conf., 1956: p. 93-104.
Dane, C. H., 1935, Geology of the Salt Valley anticline and adja cent areas, Grand County, Utah: U.S. Geol. Survey Bull. 863, 184 p.
Eicher, L. J., Hedlund, D. C., and Miller, G. A., 1957, Preliminary geologic map of sections of the western part of the Gate way district, Colorado and Utah: U.S. Geol. Survey Mineral Inv. Field Studies Map MF-122.
Elston, D. P., and Landis, E. R., 1960, Pre-Cutler unconform ities and early growth of the Paradox Valley and Gypsum Valley salt anticlines, Colorado, in Short papers in the geo logical sciences: U.S. Geol. Survey Prof. Paper 400-B, art. 118, p. B-261 B-265.
Elston, D. P., and Shoemaker, E. M., 1960, Late Paleozoic ard early Mesozoic structural history of the Uncompahg~e front, in Four Corners Geological Society [Guidebook], Geology of the Paradox basin fold and fault belt, 196V. p. 47-55.
Hammer, S. L, 1939, Terrain corrections for gravimeter station'': Geophysics, v. 4, p. 184-194.
Hite, R. J., 1960, Stratigraphy of the saline facies of the Para dox member of the Hermosa formation of southeaster Utah and southwestern Colorado, in Four Corners Geolo.sri- cal Society [Guidebook], Geology of the Paradox basin fold and fault belt, 1960: p. 86-89.
Hubbert, M. K., 1943, A line-integral method of computing the gravimetric effects of two-dimensional masses: Geophys ics, v. 12, no. 2, p. 215-225.
116 GEOPHYSICAL HELD INVESTIGATIONS
Hunt, C. B., 1958, Structural and igneous geology of the La Sal Mountains, Utah: U.S. Geol. Survey Prof. Paper 294-1, p. 305-364.
Joesting, H. R., and Byerly, P. E., 1956, Aeromagnetic and grav ity profiles across the Uravan area, Colorado, in Intermoun- tain Assoc. Petroleum Geologists Guidebook, 7th Ann. Field Conf. 1956: p. 38-41.
1958, Regional geophysical investigations of the Uravan area, Colorado: U.S. Geol. Survey Prof. Paper 316-A, p. 1-17.
Joesting, H. R., and Case, J. E., 1960, Salt anticlines and deep- seated structures in the Paradox basin, Colorado and Utah, in Short papers in the geological sciences: U.S. Geol. Survey Prof. Paper 400-B, art. 114, p. B-252 B-255.
1962, Regional geophysical studies of the Salt Valley- Cisco area, Utah and Colorado: Am. Assoc. Petroleum Geologists Bull., in press.
Joesting, H. R., and Plouff, Donald, 1958, Geophysical studies of the Upheaval Dome area, San Juan County, in Inter- mountain Assoc. Petroleum Geologists Guidebook, 9th Ann. Field Conf. 1958: p. 86-92.
Jones, R. W., 1959, Origin of salt anticlines of Paradox basin: Am. Assoc. Petroleum Geologists Bull., v. 43, no. 8, p. 1869-1895.
Nettleton, L. L., 1940, Geophysical prospecting for oil: 1st ed. New York, McGraw-Hill Book Co., 444 p.
Pirson, S. J., 1935, Polar charts for interpreting magnetic anom alies: Am. Inst. Mining Metall. Engineers Contr. 91, 13 p.; also Geophysics, Am. Inst Mining Metall. Engineers Trans., v. 138, p. 173-185,1940.
Shoemaker, E. M., 1952, Preliminary geologic map of part of the Sinbad Valley-Fisher Valley anticline, Colorado and Utah: U.S. Geol. Survey open-file map, Aug. 25, 1952.
1954, Structural features of southeastern Utah and adja cent parts of Colorado, New Mexico, and Arizona, in Utah Geological Society Guidebook to the Geology of Utah, no. 9: p. 48-69.
1956, Precambrian rocks of the north-central Colorado Plateau, in Intel-mountain Assoc. Petroleum Geologists Guidebook, 7th Ann. Field Conf. 1956: p. 54-57.
Shoemaker, E. M., Case, J. E., and Elston, D. P., 1958, Salt anti clines of the Paradox basin, in Intermountain Assoc. Pe troleum Geologists Guidebook, 9th Ann. Field Conf. 1958: p. 39-59.
Stewart, J. H., 1956, Triassic strata of southeastern Utah and southwestern Colorado, in Intermountain Assoc. Petroleum Geologists Guidebook, 7th Ann. Field Conf. 1956: p. 85-92.
Stokes, W. L., 1948, Geology of the Utah-Cilorado salt dome region, with emphasis on Gypsum Valley, Colorado, in Utah Geological Society Guidebook to the Geology of Utah, no. 3: 50 p.
1956, Nature and origin of Paradox basin salt structures, in Intermountain Assoc. Petroleum GeoMgists Guidebook, 7th Ann. Field Conf. 1956: p. 42-47.
U.S. Coast and Geodetic Survey Chart 3077f: Total intensity magnetic chart of the United States, 1955.0.
Vacquier, Victor, and Affleck, James, 1941, A computation of the average depth to the bottom of the earth's magnetic crust, based on a statistical study of local magnetic anoma lies : Am. Geophys. Union Trans., 22d Ann. Mtg. pt. 2, p. 446-^50.
Weir, G. W., Dodson, C. L., and PuflEett, W. P., 1960, Preliminary geologic map and section of the Mount Peale 2 SE quad rangle, San Juan County, Utah: U.S. Geol. Survey Mineral Inv. Field Studies Map MF-143.
Weir, G. W., and Kennedy, V. C., 1958, Preliminary geologic map of the Mount Peale 2 SW quadrangle, San Juan Coun ty, Utah: U.S. Geol. Survey Mineral r>v. Field Studies Map MF-142.
Weir, G. W., Kennedy, V. C., Puffett, W. P., rnd Dodson, C. L., 1961, Preliminary geologic map and section of the Mount Peale 2 NW quadrangle, San Juan County, Utah: U.S. GeoL Survey Mineral Inv. Field Studies Map MF-152.
Weir, G. W., and PuflEett, W. P., 1960, Preliminary geologic map and sections of the Mount Peale 2 NE qua drangle, San Juan County, Utah: U.S. Geol. Survey Mineral Inv. Field Studies Map MF-141.
Weingerd, S. A., and Strickland, J. W., 19o4, Pennsylvanian stratigraphy of Paradox salt basin, Forr Corners region, Colorado and Utah: Am. Assoc. Petroleum Geologists Bull., v. 38, no. 10, p. 2157-2199.
O