regional inequality of higher education resources in...
TRANSCRIPT

1
Regional Inequality of Higher Education Resources in China
Wan-Hsin Liu*, Kiel Institute for the World Economy
Ru Ma, Graduate School of Chinese Academy of Social Sciences
Preliminary version: 130616
Please do not cite or circulate without permission.
Abstract:
Under the “New Normal” China strives for a more equal and quality-oriented growth model
to support its long-term economic development. Here providing a more equal access to higher
education resources across provinces is expected to be the key. Bickenbach and Liu (2013a)
found that the young in China has obtained more and more equal access to higher education
opportunities over time. This paper goes one step further and analyses whether a more equal
access to higher education “resources” has been provided for registered university students.
Analysis results suggest that higher education resources spanning from teaching personnel to
physical equipment and to financial resources have been by no means equally provided in
relation to different student sizes across Chinese provinces. The unequal distribution has even
become more deteriorated over the research period from 2002 to 2012. The strong increase in
regional inequality is not attributable to the different treatments between regions with
different development states in this regard only. Instead, the strongly rising provincial
difference with respect to the provision of higher education resources to university students
within traditionally assumed to be homogeneous regions, the East or the rich region in
particular, plays a more dominant role.
JEL: I23, I24, R10
Keywords: higher education, regional inequality, education resources, China, Theil index
*corresponding author. Kiel Institute for the World Economy. Kiellinie 66, 24105 Kiel, Germany. wan-

2
1 Introduction
China’s rise to the second largest economic power in the world is an amazing success story in
the recent past. Its strong economic development has been gradually challenged since 2012,
however, with its annual economic growth rate strongly decreasing from an on average two-
digit level to about 7% in the past few years. Against this background, China’s President Xi
Jinping made it clear in 2014 that China needs to adapt itself and gets used to “the New
Normal” of the Chinese economy. Under “the New Normal” the Chinese economy will grow
at lower rates of about 6-7% annually, while at the same time the quality of growth needs to
be enhanced. To do so, the Chinese government turns to encourage related stakeholders to
engage in key innovation activities more strongly than ever. Innovation should help upgrade
Chinese industries to climb up the global value chains to foster economic growth (CPC &
CCSC, 2016).
In addition to innovation, the Chinese government also emphasises that structural reforms in
different aspects are required to support advancing the quality of growth in China. One of
these aspects relates to regional disparity in the economic structure and in the development
level (Chen, 2015). Regional policies should be further continued to support the realisation of
a more equal economic development across regions in China. Linking these two key elements
“innovation and more equal regional development” together, it implies that it is not about
encouraging innovation per se. How to promote innovation that at the same time supports a
more equal regional economic development is a crucial challenge for China.
As highlighted in Nelson and Phelps (1966) one essential determinant of innovation is human
capital. Highly qualified labour force is required to carry out complicated innovation activities
in established firms. Such skilled persons are also advantageous for producing new ideas and
initiating more sophisticated innovation and upgrading activities that go beyond the boundary
of existing firms (Acs et al., 2009; 2013; Aghion et al, 2009). To promote innovation and at
the same time encourage a more equal regional economic development, expanding the
reservoir of human resources with better qualifications in all provinces in China may be
considered as a highly relevant policy instrument. Due to the inevitably crucial role of
universities in human capital development, it is to be expected that policies should lead to a
more equal access to higher education system across provinces in China, if the Chinese
government aims for successes in a more equal interregional distribution of human resources
to support a more comparable innovation-based regional economic development.

3
The regional distribution of higher education opportunities in China has been analysed in
several studies in the past. By applying different analysis methods and using different (short-
period) datasets, previous analyses obtained empirical evidence that indicated different
developing trends of the distribution of higher education opportunities in China over time. For
example, Shen (2007a) found a decreasing trend in regional inequality in terms of the number
of universities over some years between 1949 and 2003, while Shen (2007b) could not
identify a clear developing trend when the analysis was carried out based on the statistics of
new university students from 1989 to 2000. In contrast to Shen (2007b), Liu et al. (2009)
found evidence rather suggesting that the regional inequality of university students decreased
in relation to population size, but for a more recent research period between 2004 and 2006.
One first more comprehensive study on this topic was provided by Liu (2007). By applying
both Gini and Theil index to analyse a dataset for the years from 1998 to 2006, findings of Liu
(2007) suggested a decreasing trend of inequality of higher education proxied by the number
of university students in relation to the provincial young population size but a rebounding of
inequality could be observed in 2006. The analysis of Liu (2007) was extended by
Bickenbach and Liu (2013a) in various aspects: a longer time period for the analysis (1997-
2008), a larger variety of variables to proxy the higher education opportunities on the one
hand and the provincial heterogeneity on the other hand, applying a more generalised
inequality measure and carrying out decomposition analysis to search for sources of
inequality. The analysis showed a decreasing trend of regional inequality of higher education
opportunities relative to the provincial (young) population size over the research period.
Accompanying with this trend, inequality between poor and rich regions actually increased
over the same period – in favour of the poor region.
Bickenbach and Liu (2013a) focused, however, on the quantitative aspect of higher education
opportunities only – number of universities and number of university places. The quality
aspect of the analysis was left for future research. And this is exactly the gap that the current
paper aims to close. More concretely, this paper aims at providing a systematic and
comprehensive analysis of the development of inequality of higher education resources
across provinces in China with focus on the qualitative aspect.1 Similar to Bickenbach and
Liu (2013a), it applies a more generalised inequality measure for the analysis, while the
analysis is based on a regional dataset for a longer and more recent period of time (2002-
2012). It considers the qualitative aspect of higher education opportunities by using various
1 The fact that universities in China are by no means the same in quality is well evidenced by Zhong (2011). Thus it is of high relevance to consider the quality aspect while investigating the issue of equal access to higher education in China.
4
quality variables spanning from teaching personnel to physical assets and further to related
financial investment. The findings of the analysis are expected to add additional insights into
this crucial topic and thus to derive some policy implications for China.2
The remainder of the paper is organised as follows. Section 2 introduces the research concept,
including the methodology applied and data used for the analysis. Section 3 presents key
analysis results that helps one gain more insights into the quality-oriented development of
regional inequality of higher educational resources over the research period. Section 4
concludes with policy implications.
2 Research Concept and Research Data
2.1. Research Concept
Given the findings from Bickenbach and Liu (2013a) as introduced above that the access to
higher education opportunities in China has generally become more and more equally
distributed over time, the analysis here aims at investigating how the distribution of higher
education resources which are expected to be allocated to training university students has
developed over a more recent decade. As this paper aims at extending the analysis provided
by Bickenbach and Liu (2013a) by systematically considering the quality aspect of higher
education, we apply the same inequality measure but consider different variables to proxy
both the higher education resources with quality consideration and the target group to which
the resources are expected to be devoted.
The general inequality measure (weighted relative Theil index) applied is as follows:
Π
Π
Π
Π=
∑∑
∑=
=
=
I
i i
ii
i
iI
iI
i i
ii
i
i Xw
X
Xw
X
wT
1
1
1
1 ln (1)
2 In fact there have been some studies which also analysed regional distribution of higher education resources in China but few of them provided a systematic and comprehensive analysis as did in this paper. Hou and Xue (2008) considered, for example, only the teacher-student ratio for their analysis. Cui (2010) used more related indicators for their study. However, none of these analyses was carried out for a longer time period thus failing to demonstrate the developing trend of reginal inequality of Chinese higher education resources in general and to provide more insights into potential sources of the inequality in particular.

5
where I is the number of observations (provinces) for the analysis and Xi (i = 1, …, I) is the
variable used to proxy higher education resources of the province i. The inequality measure is
calculated for each year of the research period for the analysis. While the traditional Theil
index does not consider provincial differences (neither as reference nor as weight), here we
consider iΠ as province-specific reference, relative to which the regional distribution of
higher education resources are to be analysed and wi as the province-specific weight to
calculate the contribution of each province to overall inequality taking into account provinces’
population size difference. Another advantage of using this measure is its decomposability
property that enables us to gain more insights into sources of the inequality – whether it is
mainly driven by within-group or between-group inequality components.3 In case of equal
distribution of higher education resources (relative to university students), the inequality
measure calculated will be zero and it will be an increasingly positive value with increasing
inequality.
The strategy of the empirical analysis is as follows. It begins with investigating the
distribution development of various higher education resources, using the generalised
inequality measure introduced above (Section 3.1). Firstly, we analyse the development of
distribution of teaching personnel of universities due to their key role as transmitters to bring
knowledge to university students. Taking this analysis as base, we additionally take into
account the heterogeneity of teaching personnel with respect to their education experience and
qualifications (Section 3.1.1). The higher education quality is, however, not determined by the
quality of teaching personnel only. Whether there are sufficient teaching resources to support
an efficient learning process would be a crucial determinant as well. Thus, we move to
analyse the development of distribution of teaching resources in Section 3.1.2. There we
begin with considering two basic types of resources, namely books and computers, for the
analysis. Besides, we consider universities’ educational expenditure and fixed assets to proxy
their potential financial capacity in expanding and improving teaching resources for university
education.
After gaining some insights into the development of distribution of teaching personnel and
teaching resources over the research period, the empirical analysis moves to investigating
whether the observed inequality development has been rather driven by within- or between-
group inequality components with focus on the teaching resources (Section 3.2).
3 For more technical details see Bickenbach and Liu (2013a) and Bickenbach and Bode (2008).

6
2.2. Research Data
The empirical analysis to be presented in Section 3 is based on a provincial panel dataset for
China from 2002 to 2012. It mainly covers variables used to proxy higher education resources,
including (senior) teaching personnel and teaching resources like books, computers, fixed
assets and educational expenditure.4 Moreover, it covers data such as the number of students
and the population size which we consider as base statistics for the reference variable and the
weight variable for the analysis, respectively. We collected these data from three different
statistical yearbooks from China: Educational Statistics Yearbook of China (ME, 2003-2013),
China Educational Finance Statistical Yearbook (ME & NBSC, 2003-2014) and China
Statistical Yearbook (NBSC, 2003-2013).The distribution of higher education resources by
region5in 2002 and 2012 is presented in Table 1. It can be observed that higher education
resources of all kinds in the whole China have increased substantially from 2002 to 2012.
While the total number of teaching personnel in the universities doubled from 2002 to 2012,
the expansion of educational expenditure in the higher education system in China was even
more striking over the same period. The size of the educational expenditure was eight times
higher in 2012 than ten years ago. The increase in higher education resources was reflected in
the regional statistics as well –with different growth rates in different regions, however. As a
result the regional shares in different higher education resources in 2012 were different from
the corresponding shares in 2002. Nevertheless the changes in shares over time seem to be not
substantial, with the East region being the region enjoying the largest shares in all kinds of
higher education resources in both 2002 and 2012, followed by the Central region and the
West region. The Northeast region which consists of only three provinces in China accounted
for the smallest share of higher education resources. Against this background one may easily
conclude that the regional inequality of higher education resources may not be much different
over time – irrespective of the higher education resources considered in the analysis. However,
even against this background a positive or negative development in regional inequality may
be possible due to, for example, the different development in student sizes in different regions
over time on the one hand and due to the changes that occurred at the provincial level on the
4 Since the statistics of the educational expenditure for 2012 are missing, we calculated the average values based on the corresponding statistics for 2011 and 2013 for the missing data in order to have a balanced panel dataset for the analysis. 5 The 31 provinces in China are classified into four regions following the geographic classification of regions officially used for regional policy in China: East, Central, West and Northeast. The East region comprises ten provinces: Beijing, Fujian, Guangdong, Hainan, Hebei, Jiangsu, Shandong, Shanghai, Tianjin, and Zhejiang, The Central region consists of six provinces: Anhui, Henan, Hubei, Hunan, Jiangxi, and Shanxi, and the West region consists of twelve provinces: Chongqing, Gansu, Guangxi, Guizhou, Inner Mongolia, Ningxia, Qinghai, Shaanxi, Sichuan, Tibet, Xinjiang, and Yunnan. There are only three provinces in the Northeast region: Heilongjiang, Jilin, and Liaoning (NBSC, 2005).

7
other hand. To provide more insights in this regard, a systematic analysis using the
generalised Theil indices introduced above is carried out and results are presented in Section 3.
Table 1: Distribution of Higher Educational Resources by Region (2002 and 2012)
(a) Teaching personnel
Teacher (thousand persons)
Senior (thousand persons)
2002 2012 2002 2012 East 296.8 610.3 33.2 84.2
(41.0%) (40.8%) (47.4%) (46.4%) Central 180.4 384.7 14.7 37.7
(24.9%) (25.7%) (21.0%) (20.8%) West 159.0 354.9 12.7 38.1
(21.9%) (23.7%) (18.1%) (21.0%) Northeast 88.4 146.9 9.5 21.5
(12.2%) (9.8%) (13.5%) (11.8%) Total 724.7 1496.9 70.1 181.5
(100%) (100%) (100%) (100%)
(b) Teaching resources
Books (million)
PCs (thousand)
FA (billion RMB)
Eduexp (billion RMB)
2002 2012 2002 2012 2002 2012 2002 2012
East 350.2 938.2 969.7 4476.0 173.7 578.1 40.0 352.9 (41.9%) (42.4%) (44.9%) (47.0%) (48.5%) (42.6%) (46.8%) (50.2%)
Central 204.4 564.2 508.6 2131.2 75.6 306.8 19.0 137.8 (24.4%) (25.5%) (23.6%) (22.4%) (21.1%) (22.6%) (22.2%) (19.6%)
West 187.6 501.1 434.4 1984.1 64.8 322.9 17.3 147.8 (22.4%) (22.6%) (20.1%) (20.9%) (18.1%) (23.8%) (20.2%) (21.0%)
Northeast 94.3 209.5 245.4 923.8 43.9 148.8 9.2 64.8 (11.3%) (9.5%) (11.4%) (9.7%) (12.3%) (11.0%) (10.8%) (9.2%)
Total 836.5 2213.0 2158.2 9515.0 358.0 1356.6 85.5 703.3 (100%) (100%) (100%) (100%) (100%) (100%) (100%) (100%)
Notes: (1)‘Teacher’, ‘Senior’, ‘Books’, ‘PCs’, ‘FA’ and ‘Eduexp’ refer to total full-time teachers, full-time teaching personnel with senior positions, books, computers, fixed assets and educational expenditure, respectively. (2) The value in bracket is the share of each region in national totals. Sources: ME (2003-2013); ME & NBSC (2003-2014). Own calculations
3 Empirical Results
3.1 Inequality Development of Higher Education Resources
3.1.1 Teaching Personnel

8
Starting the empirical analysis with considering full-time teaching personnel who play a key
role as knowledge transmitters in universities, we calculate three Theil indices following Eq.
(1) using different references and weights: unweighted absolute (i.e., traditional), unweighted
relative and weighted relative Theil indices. While for the relative Theil indices provincial
differences in the number of university students are considered as reference mentioned above,
for the absolute Theil index such difference is assumed as if it were not existent. It implies
that an equal distribution of teaching personnel in case of relative Theil indices is realised if
the distribution of teaching personnel across provinces is consistent with the cross-provincial
distribution of university students, while for the absolute Theil index an equal distribution
means that the absolute number of teaching personnel is the same for all provinces. Another
difference between the three indices shown in Figure 1 are the different weights considered in
the index calculation. While for the unweighted Theil indices it is assumed that the
contribution of each province to overall inequality is determined by its deviation from the
average level of teaching personnel (relative to the size of university students) only, for the
weighted Theil index provinces’ population size difference is considered to additionally
weight the contribution that each province has to the overall inequality. For the latter case it
implies that assumed two provinces with the same degree of absolute deviation from the
average level of teaching personnel (relative to the size of university students) the province
with a larger population size is expected to make a larger contribution to the overall inequality
of teaching personnel in China of the year than the province with a smaller population size.
From Figure 1 it can be observed that all three indices have similarly constant developing
trends over the research period, suggesting a relatively constant access to teaching personnel
in that period – either from a province’s or from a university student’s point of view. The
major difference between the absolute and relative measures is that the unweighted absolute
inequality of teaching personnel stayed at a much higher level (almost 0.2) over time,
compared to the unweighted relative inequality (0.007) and the weighted relative inequality
(0.004). 6 The level difference between the absolute inequality and relative inequalities
suggests that different provinces have different amounts of teaching personnel but their
distribution seems to be more equal across provinces if one takes into account the provincial
difference in the size of university students.7 The teaching personnel were rather concentrated
6 While the inequality measures suggest a relatively constant developing trend in terms of teaching personnel in China, the number of teaching personnel in China has more than doubled from almost 725,000 persons in 2002 to 1.5 million persons in 2012. 7 This is, in fact, consistent with related policies in China that the size of students is one of the important critaria considered while determining the size of the teaching personnel (ME, 1986a).

9
in provinces with a larger size of university students. This ensures a more comparable teacher-
student ratio across provinces in China than the case with the same absolute amount of
teaching personnel.8 As to the (slight) level difference between the unweighted and weighted
relative indices with the latter one being lower, it suggests that rather provinces with smaller
population sizes are characterised with larger deviations from the average level in terms of the
teacher-student ratio. 9 In other words the particularly unequal distribution (positive or
negative) of teaching personnel rather concerns a relatively small share of the whole
population in China.
Figure 1: Regional Inequality of Full-time Teaching Personnel
Note: ‘UA_teacher’, ‘UR_teacher’ and ‘WR_teacher’ refer to the unweighted absolute, unweighted relative and population-weighted relative Theil indices based on the statistics for full-time teaching personnel, respectively. Sources: ME (2003-2013); NBSC (2003-2013). Own calculations.
One of the key observations from Figure 1 is the low levels of relative inequalities of teaching
personnel in China. With the relative inequalities almost equal to zero it suggests that the
teaching personnel are actually almost equally distributed relative to university students
across provinces in China. Based on this observation one may easily come to the conclusion
8 A relatively constant comparable teacher-student ratio across provinces over time only implies that students in different provinces have access to a comparable amount of teaching personnel in the research period. It does not automatically mean that the average teacher-student ratio would stay at the same level in the same period. Indeed statistics show the teacher-student ratio has actually been slightly improved in favour of students from 1:23 in 2002 to about 1:21 in 2003 and stayed at the latter level for the other years. 9 For example, the largest deviations from the average level of teacher-student ratio in 2012 were found for Beijing, Shanghai and Qinghai with only about 1.5%, 1.8% and 0.4% of all populations in China, respectively.
0.00
0.02
0.04
0.06
0.08
0.10
0.12
0.14
0.16
0.18
0.20
2002 2003 2004 2005 2006 2007 2008 2009 2010 2011 2012UA_teacher UR_teacher WR_teacher
10
that there is no problem with respect to the distribution of higher education resources and thus
no policy measures are needed in this regard at all. This conclusion is, however, too
premature due to the fact that the teaching personnel in China are not a homogeneous group.
Even if students can access the same amount of teaching personnel for education, the quality
of knowledge that they would obtain depends strongly on the quality of the teaching
personnel that is to some extent determined by their teaching experience and their own
education. In other words, one needs to consider the heterogeneity of teaching personnel in
addition for the inequality analysis.10
For the analysis considering teaching personnel’s difference in teaching experience and
qualification we focus on calculating the relative Theil indices only, to better take into
account provinces’ different sizes of university students, thus different needs for teaching
personnel. The teaching personnel are a heterogeneous group consisting of teaching staff with
different work content, teaching experience and qualifications. One possible way to
differentiate teaching staff from each other is to consider their job titles. There are officially
four different job titles in China that could be given based on related evaluation processes of
teaching personnel – Assistant, Lecturer, Associate Professor and Professor. The individual-
based evaluation takes into account individual teachers’ scientific research quality,
competence and qualifications and teaching quality with more senior positions generally with
higher qualifications in these three aspects accumulated over time (ME, 1986a; SCNPC,
1998). University students with access to a larger size of senior teaching personnel are
expected to have access to not only more accumulated academic knowledge but also have an
easier access to academic knowledge per se due to the fact that senior teaching personnel are
expected to have accumulated more teaching experience than their junior counterparts. We
recalculate the relative inequality indices focusing on the teaching staff with senior positions
(Associate Professor and Professor) only. Results are presented in Figure 2. For comparison,
the two corresponding indices considering teaching staff as a whole are shown in Figure 2 as
well.11
10 Even if students can access the same amount of teaching personnel with comparable quality, it does not mean that no policy measure is needed in this regard, because a comparable access to teaching personnel (or education resources more generally) across provinces does not necessarily mean that the optimal level of higher education resources per student has been achieved. Discussing about what would be the optimal level of education resources per student exceeds, however, the scope of the current study which mainly focuses on analysing the development of the regional distribution of higher education resources over time. 11 About an average share of 6% of all teaching personnel in China have no academic job titles at all. They are either more responsible for administrative affairs of the universities or are not allowed to participate in the evaluation processes for various reasons. The share of teaching personnel without job titles was different for different provinces over the research period. It implies even if two provinces have the same total amount of teaching staff, one cannot compare these two groups of teaching staff with each other directly. Students in the provinces with a larger share of teaching staff without titles are

11
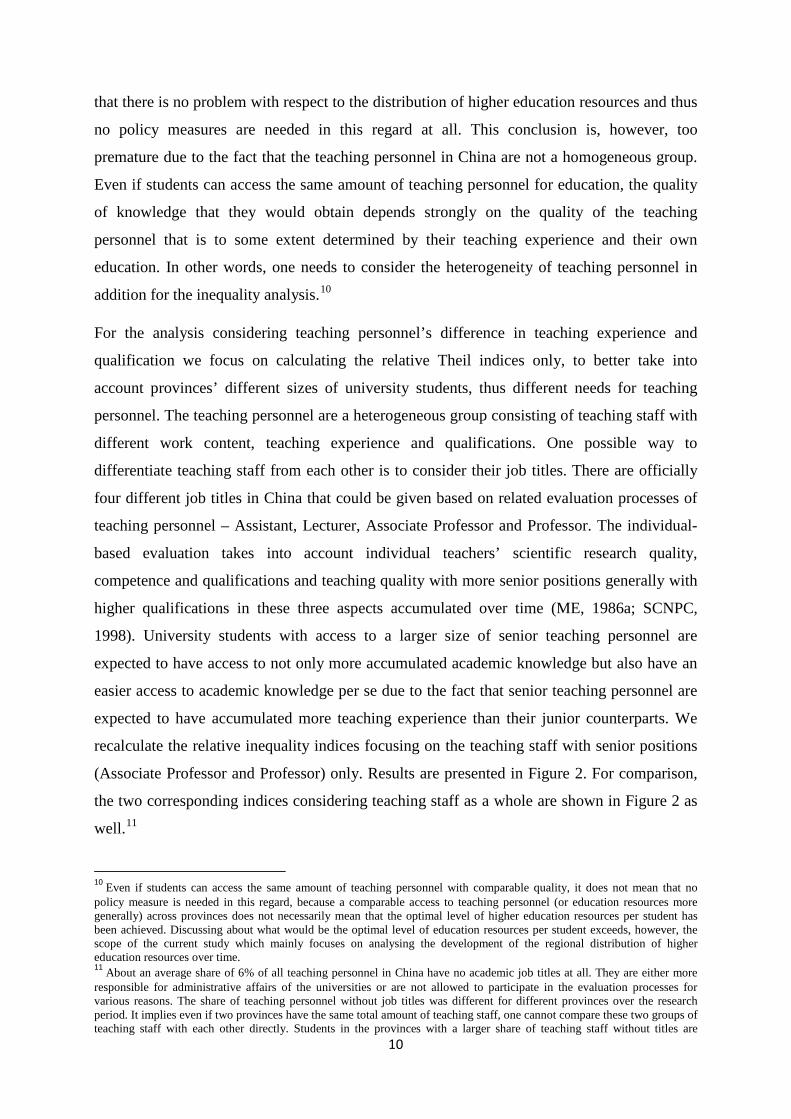
Two major phaenomenon can be observed in Figure 2. First, the relative inequality –
irrespective of weighting the province-deviation with population size or not – considering the
senior teaching personnel had a higher inequality level compared to that of all teaching
personnel.12 Second, we observe a clearly upwards developing trend of the relative inequality
of senior teaching staff across provinces, compared to a relatively constant development for
the case considering all teaching staff. In other words, students’ access to advanced academic
knowledge in China seems to be less equal across provinces than their access to academic
knowledge in general. Moreover, the unequal access of students to advanced academic
knowledge seems to become even worse over the past decade. The result is at the first glance
surprising, given a strong role of the central government in influencing not only the size of
teaching personnel but also the number of senior teaching staff in China (ME, 1986a; SCNPC,
1998). For a more equal access to advanced academic knowledge that is of crucial relevance
for supporting knowledge-based development, one would rather expect that the government
would assign the available number of senior teaching staff positions to universities in different
provinces, referring to the size of university students. The result suggests, however, that the
size of the university students may not be the only criterion considered while the government
made its distribution decision. 13 The other criteria considered such as policy priority in
supporting some university majors to support industrial development and in promoting
universities’ development towards world-class universities14 may lead to such a less equal
distribution of senior teaching staff due to the facts that the top universities which are
normally stronger in the key majors identified and have a higher potential to become world-
class universities are by no means equally distributed across provinces but concentrated
strongly in some selected, economically more advanced provinces (Bickenbach and Liu,
2013b).15 The observed (increasingly) unequal access to advanced knowledge may, however,
be even worse in reality. Although considering job titles and focusing on senior teaching staff actually expected to have a poorer access to academic knowledge than students in the other province. Thus, focusing on the senior teaching personnel also enables us to better avoid this problem as well. 12 Similar to the finding above, the weighted relative inequality has been lower than the unweighted one in this case as well, suggesting that the provinces with smaller population sizes seem to have larger deviations from the average level of senior teaching staff in relation to student sizes. 13 We also calculated the two relative inequality indices considering teaching staff with junior positions only (Assistant and Lecturer) for the research period. Results in numbers are not presented for the sake of brevity. They can be obtained upon request. The regional inequality of junior teaching personnel was lower than that of senior teaching staff over the whole research period. Moreover, different from the latter case the regional inequality of junior teaching personnel decreased strongly over time and in the recent past both the unweighted and weighted inequality were slightly lower than 0.005. This development suggests that the distribution of junior teaching staff seems to be more in line with the size of students in China. Provinces and universities in China may have a stronger autonomy in recruiting junior teaching staff, taking into account their own education need that is strongly determined by the size of students (ME, 1986a). 14 See ME (1986a), ME (1986b) and ME (2006) for more information. 15 Indeed, statistics show, for example, the senior teacher to student ratio was the highest for Beijing (0.046) in 2012. The ratio for Shanghai (0.029) and Tianjin (0.025) was ranked high as well. The only exception among the economically less advanced provinces in China but with a rather high senior teacher to student ratio was Qinghai (0.033).
12
already reduce provincial difference in teaching quality provided by the teaching staff in
general, it does not mean that the quality of advanced academic knowledge that students are
expected to obtain from senior staff is fully comparable across provinces. In fact, the limited
number of senior positions in general and a large supply of qualified university teachers
particularly in top universities concentrated in some selected more advanced provinces result
in a more severe competition among teaching personnel for senior positions in these
provinces.16 As a consequence it is often argued that the teaching and research quality of
university teachers with senior positions in these few provinces where top universities are
more densely located has been much better than that in other provinces. Together with the
finding that university students in more advanced provinces have access to a larger amount of
senior staff, the quality difference means that these students may not just have access to more
but even better academic knowledge that is expected to be provided by senior teaching
personnel.
Figure 2: Regional Inequality of Full-time Teaching Personnel with Senior Positions
Notes: ‘UR_senior’ and ‘WR_senior’ refer to the unweighted relative and population-weighted relative Theil indices of teaching staff with senior positions. For comparison, the unweighted relative (UR_teacher) and population-weighted relative (WR_teacher) Theil indices of full-time teaching personnel as from Figure 1 are presented in this figure as well. Sources: ME (2003-2013); NBSC (2003-2013). Own calculations.
3.1.2 Teaching Resources
Education quality is, however, not solely determined by the teaching quality that is strongly
influenced by the qualifications and experience of the teaching personnel. It is also strongly
determined by the available teaching resources that are expected to support the teaching and 16 All teaching personnel who fulfil the qualification and experience requirements can apply for promotion. The evaluation and selection processes have been carried out either at the provincial level or at the university level subjected to the number of limited free positions determined by the central government and responsible ministries (ME, 1986b; ME, 2016). Due to the more severe competition in the provinces where the top universities are more densely located, the requirements for obtaining senior positions in these universities and provinces are particularly high.
0
0.01
0.02
0.03
0.04
2002 2003 2004 2005 2006 2007 2008 2009 2010 2011 2012
UR_teacher WR_teacher UR_senior WR_senior

13
learning processes in universities. Thus, in this section we move forward by investigating the
development of regional distribution of the following four different (sources of) teaching
resources over time: books, computers, educational expenditure and fixed assets of
universities.
Results of the calculated unweighted relative inequality indices for the four teaching resources
considered are presented in Figure 3. 17 Three major observations are particularly worth
mentioning. First, the level of relative regional inequality of available books in universities
was (much) lower than that for the other three teaching resources. Second, educational
expenditure and fixed assets that are assumed to be spent or potentially disposable for
education purposes in universities have been generally less equally distributed across
provinces than printed and digital teaching resources proxied by books and computers,
respectively. Third, while the regional inequality of available books seems to remain
relatively constant over time, the other three teaching resources considered have become less
and less equally distributed in relation to the size of university students. The strongest
increase in regional inequality among the teaching resources was observed for the educational
expenditure.
The relatively equal distribution of printed publications (books) across provinces in China in
relation to the size of university students gives a first positive impression that at least students
may, to some extent, compensate their different access to academic knowledge provided by
their teachers through accessing available (related) books. The finding that students’ access to
IT facilities like computers was, however, much less equally guaranteed than their access to
books leads to more doubt in the potentially positive compensating effects through a more
equal access to books. This is particularly so nowadays, when more and more materials and
information have actually become (only or more easily) online accessible and some analytical
techniques can only be applied by using computers. In other words, in the current digital age
computers but not books would be the dominant knowledge source and an important
analytical instrument to support their learning processes.
One may argue that nowadays students may have their own computers, thus reducing the need
for public computers in the universities. Nevertheless the provision of (well-functioning)
computers in the universities is necessary particularly for the following two reasons: First,
17 We also calculated the weighted version of inequality. The development is comparable to that shown in Figure 3. The only difference is that the weighted inequality indices had lower values than the unweighted ones, similar to the findings above while considering the teaching staff for the analysis. A comparable interpretation can be thus applied here as well. Results of the weighted inequality can be obtained upon request.

14
students from more disadvantaged family backgrounds may be the ones who are not able to
afford buying their own computers. In order not to be left behind that will otherwise increase
the digital divide among students, it is crucial to provide them at least access to the digital
world via the public computers provided by the universities.
Second, computers alone provide only the necessary but not the sufficient condition for
accessing digital information. For research and advanced learning, adequate software and
access codes need to be installed in computers to ensure access to data sets or journals that are
only available for legal subscribers. Such software and access codes can, normally, be
installed in only a limited number of computers owned by universities against payment to data
providers. Providing public computers with adequate software and access codes at the
universities rather ensure a better access among students to digital materials they need for
advanced learning and research.
Against this background the finding that IT facilities like computers became more and more
unequally distributed among students across provinces – particularly at costs of students from
economically less advanced provinces18 – implies that the access to education of high quality
that enables students to improve their digital skills and advance their knowledge turns to be
more and more unequally provided in favour of the rich. This enhances the risk of widening
digital divide and students with worse access to such device would be rather left behind for
the future challenges in such a digital age.
Combining this finding with the findings regarding the distribution of teaching staff above, it
implies that students in China not only have unequal access to higher education in general.
The unequal distribution has become more in favour of students in economically more
advanced provinces where they do not only have a better access to a greater amount of more
experienced and more qualified teachers but also to more advanced teaching resources like
computers to support their learning processes in the digital age.
Both printed publications like books and IT facilities like computers are only representing a
small part of education resources that students would gain access to in the universities to
support their learning processes. Generally the quality and the extent of education resources
that would be provided to the students are expected to be strongly determined by the financial
resources available or potentially disposable by universities for education purposes. As
18 Taking statistics for 2012 as an example, the top 5 provinces with the highest computer to student ratio were Beijing, Shanghai, Jiangsu, Zhejiang and Tianjin; all are the economically more advanced provinces in China. Economically more advanced provinces were also ranked high in terms of the growth rate of the computer to student ratio over the research period.

15
summarised above, from Figure 3 we observe that both financial capacities of universities
measured in both educational expenditure and fixed assets have become more and more
unequally distributed among students across provinces over time. A particularly strong
increase in such an inequality was observed for the development of the regional distribution
of educational expenditure.
Figure 3: Regional Inequality of Teaching Resources
Note: ‘UR_books’, ‘UR_pcs’, ‘UR_fa’ and ‘UR_eduexp’ refer to the unweighted relative Theil indices of books, computers, fixed assets and educational expenditure and of universities, respectively. Sources: ME (2003-2013); ME & NBSC (2003-2014). Own calculations.
Comparing Figure 3 with Figure 2, one can observe additionally that the regional inequality of
the distribution of computers, fixed assets and educational expenditure was (much) worse than
that of senior researchers. This finding is not surprising, considering the fact universities in
China have been endowed with strongly different amounts of financial resources (from
governments and companies, and through donations or tuition fees) with top universities
being granted with a higher share.19 In contrast, the size of teaching staff in China has been
more concerned by the central government and ministries, keeping a reference teacher-student
ratio in mind.
All these observations further strengthened the concerns raised by the evidence obtained
above that students in China had by no means equal access to higher education of high quality
over the past decade. The not only unequal but also increasingly unequal distribution of
19 Beijing, Shanghai and Tianjin were, for example, found to have the highest educational expenditure to student ratio in 2012. These three provinces were also the ones that were characterized with the strongest growth rate in this regard over the research period.
0.00
0.05
0.10
0.15
2002 2003 2004 2005 2006 2007 2008 2009 2010 2011 2012
UR_books UR_pcs UR_fa UR_eduexp

16
financial resources of universities that determine universities’ investment in education in the
long term further induces one to expect that such unequal access to higher education in China
is likely to become even more deteriorated in the future.
3.2 Sources of Inequality Development of Teaching Resources
The findings above suggest not only that students’ access to higher education of high quality
in China seems to become more and more unequally provided over time. Statistics as
presented above also suggest that the economically more advanced provinces were more
likely the ones where students tend to have a better access to a larger amount of teaching
personnel with more experience and better qualifications and to different kinds of teaching
resources. Against this background one would easily conclude that the increasing overall
inequality regarding students’ access to higher education of high quality has been mainly
attributable to the substantially deteriorating difference in education resource access between
students from the poor and rich regions. This conclusion would be consistent with the general
public concerns in China but it may not be the whole story. Bearing this in mind, in this
section we make use of the decomposability property of the generalised Theil index to gain
more insights into what would be the main sources of the increasing overall inequality. We
focus on the three non-book teaching resources and their unweighted relative inequality
indices for the decomposition analysis for the reason that obviously the related inequality was
much higher in this regard and is expected to be further deteriorated in the future.
For the following decomposition analysis we consider two types of group classifications. First,
we classify the 31 provinces in China into four regions (East, Central, West and Northeast)
following the definition of China’s regional policy.20 In the early 21st century China started to
more intensively deal with the issue of unequal regional development by implementing
several regional policies with focus on supporting the development of the economically
backward regions. Providing a more equal access to higher education is one of the main topics
considered. 21 Bickenbach and Liu (2013a) who analysed the distribution of education
opportunities measured in the number of universities and university places found that the
distribution has become more equal that is consistent with the regional policies implemented.
The findings in the previous section, however, suggested that the situation would be different,
when the quality issue is considered for the inequality analysis. A decomposition analysis 20 See Footnote 5. 21 A summary of related regional policies can be found in Bickenbach and Liu (2013a).

17
using the geographic classification is expected to provide more information about the sources
of inequality in the regional perspective.
The calculation results are presented in Figure 4(a). It shows, firstly, that the levels of the
between-group inequality have been generally low and they were lower than the within-group
inequality for all three teaching resources considered over time. This suggests that the
between-group inequality seems not to be the main component responsible for the rising
overall inequality as expected. The within-component of the overall inequality plays a rather
dominant role in determining the development of the overall inequality as found above.
Secondly, it shows that while the between-group inequality has been gradually increased over
the research period, the increase in within-group inequality, particularly the one for
educational expenditure, was substantially stronger. As a result, the dominant role of the
within-group inequality in determining the development of the overall inequality seems to be
further strengthened in the past decade. Since the within-group inequality is a weighted sum
of within-region inequality for the four regions considered, we are able to further decompose
the corresponding value to investigate which regions have been more responsible for the
strongly increasing within-group inequality. In other words, in so doing we are able to trace
the inequality increase back to the development of heterogeneity between provinces within
each region considered. Using educational expenditure as an example, results of the regional
decomposition of the corresponding within-group inequality are presented in Figure 4(b). It
shows that the provincial difference in educational expenditure in relation to university
students within the East, Central and Northeast regions seemed to be at very low levels at the
beginning years of the research period, while provinces in the West region tended to be more
strongly different from each other in this regard. Over the years, the within-region inequality
underwent, however, different development trends. While the within-region inequality for the
Central, Northeast and even West regions either decreased or at least fluctuated at relatively
low levels, the corresponding inequality for the East region rose substantially to a much
higher level in 2012 compared to the low one in 2002. The strong increase in the provincial
heterogeneity within the East region can thus be identified as the main driver of the
substantial rise of the within-group inequality of educational expenditure shown in Figure
4(a).22
22 The within-region inequality in the East region as a main driver for the increasing within-group inequality can also be identified for the other two teaching resources considered in Figure 4(a). For the sake of brevity, the corresponding results are not presented here. They can be obtained upon request.

18
In sum, results from Figure 4 show that as expected the increasing between-group inequality
seems to play a certain role in backing the increase in the overall inequality found in the past
section. The between-group inequality was neither the only nor the main factor in this regard,
however. Instead, the within-group inequality played a much more dominant role here and the
strongly increasing provincial difference within the East region compared to the other three
regions was the main driver among all factors. All these observations imply that it would be
not sufficient for policies to purely look at the development differences between the four
regions and implement policies to particularly support a much faster development and a better
provision of senior teaching staff and teaching resources in the economically backward
regions. The increasing provincial difference in particularly the East region needs to be dealt
with sophisticatedly as well. In other words, the regional policies (planned to be) carried out
aiming to encourage innovation-driven economic growth across provinces in China cannot be
restricted to dealing with traditional regional inequality at the level of the four geographic
regions only but need to address a more disaggregated provincial level to deal with the
expanding provincial heterogeneity, particularly in the East region, in this regard.
Figure 4: Regional Inequality of Selected Teaching Resources: Decomposed by Four Regions
(a) (b)
Note: (1) ‘bt_pcs’, ‘bt_fa’ and ‘bt_eduexp’ refer to the between-group inequality of computers, fixed assets and educational expenditure of universities, respectively, while ‘wt_pcs’, ‘wt_fa’ and ‘wt_eduexp’ refer to the corresponding within-group inequality. (2) The within-group inequality for the educational expenditure is further decomposed into four within inequalities by region: ‘wt_east’, ‘wt_central’, ‘wt_west’ and ‘wt_northeast’. Sources: ME (2003-2013); ME & NBSC (2003-2014). Own calculations.
0.00
0.02
0.04
0.06
0.08
0.10
0.12
bt_pcs wt_pcs bt_fawt_fa bt_eduexp wt_eduexp
0.00
0.05
0.10
0.15
0.20
0.25
wt_east wt_centralwt_west wt_northeast

19
The decomposition analysis using the geographic four-region classification suggests that the
increasing inequality with respect to the distribution of teaching resources in relation to the
size of university students has been attributable not only to the increasing between-group
inequality but actually even more strongly attributable to the strong deterioration in inequality
within regions, in particular in the East region. In other words, the issue of increasing
inequality of accessing higher education of high quality seems not to be a pure issue between
regions with different development states and economic advancements. Does it mean that the
increasing inequality is not an issue of different treatments between the poor and the rich? In
order to gain more insights into this regard we adopt a second group classification based on
the GDP per capita for another decomposition analysis. 23 Provinces with GDP per capita
lower than the median value in 2002 are grouped into the low-income region, while the others
are considered as belonging to the high-income region. Same decomposition techniques are
applied and results are presented in Figure 5(a). At the first sight it can be observed that the
between-group and within-group inequality indices for the three teaching resources have
similar developing trends as the results shown in Figure 4(a), where the geographic
classification into four regions was applied. The main difference between the two figures is
that the levels of the between-group inequality in the case of two-region classification based
on GDP per capital seem to be generally lower than the corresponding inequality results in the
case of geographic four-region classification, while the results for the within-group inequality
were vice versa. This observation is, however, not surprising, taking into account the higher
overlapping coverage of provinces based on the two group definitions applied. While the
whole East and Northeast region and three more economically advanced provinces in the
West region belong to the rich region, the poor region consists of the whole Central region
and most of the provinces in the West region. In other words, parts of the between-group
inequality observed in the case of four-region classification are now parts of the within-group
inequality using the rich-versus-poor classification. Due to the overlapping regional coverage
in both group classifications and the dominant role of East region in the broadly defined rich
region, it is not surprising, either, that the within-region inequality of the rich region has been
mainly responsible for the strong increase in the within-group inequality in this case (Figure
5(b)).
23 The only difference is the application of another group classification method. Thus, the sums of the between-group and within-group inequality shown in Figure 4(a) and Figure 5(a) are the same and are equal to the corresponding overall inequality shown in Figure 3.

20
Figure 5: Regional Inequality of Selected Teaching Resources: Decomposed by Two Income Groups
(a) (b)
Note: (1) ‘bt_pcs’, ‘bt_fa’ and ‘bt_eduexp’ refer to the between-group inequality of computers, fixed assets and educational expenditure of universities, respectively, while ‘wt_pcs’, ‘wt_fa’ and ‘wt_eduexp’ refer to the corresponding within-group inequality. (2) The within-group inequality for the educational expenditure is further decomposed into two within inequalities by income classification: ‘wt_poor’, and ‘wt_rich’. Sources: ME (2003-2013); ME & NBSC (2003-2014). Own calculations
To go one step further in investigating the rich and poor relevance for providing teaching
resources to students, we focus on the rich region only and reclassify the 16 provinces into
two groups: the richest eight provinces and the second richest eight provinces based on the
GDP per capita in 2002. The same analysis procedure is applied here again. Results24 suggest
that the strong increase in the inequality within the rich region in Figure 5(b) was mainly
attributable to the increasing provincial difference among the richest provinces but not among
the second richest provinces. Additionally, the access difference between the richest and the
second richest also played a non-trivial role in this regard.
All in all, results of the decomposition analysis using the two-region classification based on
the GDP per capital of provinces are consistent with the findings using the four-region
classification. They show that the increasing overall inequality has been mainly driven by the
within-group inequality instead of between-group inequality, suggesting regional policies for
development need to expand their targets going beyond the traditional regional consideration
between the regions with different development states. More attention needs to be paid to the 24 Results are not shown in figures here. They can be obtained upon request.
0.00
0.02
0.04
0.06
0.08
0.10
0.12
bt_pcs wt_pcs bt_fawt_fa bt_eduexp wt_eduexp
0.00
0.03
0.06
0.09
0.12
0.15
0.18
wt_poor wt_rich

21
provincial differences within regions where provinces have been traditionally considered as
being more homogeneous with respect to their development paths. Such attention may be
even more required for the well-developed provinces, where a strongly increasing
heterogeneity with respect to the provision of teaching resources for students was found. It is
never a matter of course that the unequal distribution issues as analysed here are only of high
relevance for economically backward provinces/regions. It is particularly tricky if parts of the
richest provinces are actually the provinces which are becoming less and less preferably
considered compared to their counterparts in the group, because due to their development
success in the past their needs for adequate policy support are more likely to be more easily
ignored.
4 Conclusions
Striving for a more quality-oriented new growth model, China strongly emphasises the crucial
role of innovation in this regard. Innovation should help upgrade Chinese industries to climb
up the global value chains to foster economic growth. To innovate, China needs an adequately
large reservoir of qualified workforce and here higher education plays a key role.
Accompanying with the pursuit of a more quality-oriented new growth model, China
underlines the substantial relevance of a more equal regional development for China’s success
under the “new normal” development mode. In other words, China strives for a more qualify-
oriented new growth model that should benefit a more equal regional development in China in
the future. Against this background, China does not only need good higher education to help
build an adequately large reservoir of qualified workforce. The access to higher education
needs to be more equally provided across provinces in China to ensure a more equal and more
quality-oriented development path in the future.
Among others, Bickenbach and Liu (2013a) analysed the development of the distribution of
higher education opportunities over the past years in China. They found that the distribution
of universities and university places became more and more equally distributed in relation to,
for example, the size of the young population. What matters, however, is not only the number
of universities or university places in this regard. Even if the young are getting more and more
equal opportunities to be accepted for universities, it does not mean that the quality of the
higher education that they receive would be the same or at least become more and more
comparable. Thus, the current paper aimed at investigating this quality issue in more detail by

22
analysing the inequality development of students’ access to higher education resources
measured in teaching personnel as well as teaching resources. While considering the
distribution of the teaching personnel, we additionally took into account teachers’
heterogeneity in their qualifications and experiences. When carrying out the analysis for
teaching resources, we based the analysis on four different types of teaching resources
including different physical resources as well as universities financial capacities for sustaining
good higher education quality. The empirical analysis was carried out by using the
generalised Theil index to measure the inequality over the research period.
Empirical results showed that the unequal distribution of teaching personnel in general
seemed not be a problem for China. However, when focusing on the more experienced and
more qualified teaching personnel, results showed an obviously deteriorating trend in an equal
provision of such teachers in relation to the size of students across provinces in China – in
favour of the economically more advanced provinces. The increasingly unequal distribution
of higher education resources among students was found to be even more severe, when
considering teaching resources measured in the amount of IT facilities such as computers and
universities’ educational expenditure and the size of fixed assets for the analysis – again more
in favour of the economically more advanced regions. Such results suggested that students
from economically more advanced regions do not only have a better access to a greater
amount of more experienced and more qualified teachers but also to more advanced teaching
resources like computers to support their learning processes. Due to the strong increase in
inequality with respect to the distribution of universities’ financial potential in providing
teaching resources to improve higher education equality, one would expect that such regional
differences regarding students’ access to higher education resources of high quality would
become even worse in the future.
In order to investigate whether the increasing inequality in accessing higher education
resources has been indeed mainly driven by rising heterogeneity between regions with
different development states in this regard, we made use of the decomposability property of
the generalised Theil index for a more disaggregated analysis. Results generally found that the
between-group inequality with respect to the provision of teaching resources between regions
with different development backgrounds has indeed played a certain but not a dominant role
in backing the increasing overall inequality. Instead, the main source of increasing overall
inequality came from the strong increase in the within-group inequality in general and from
the substantial increase in provincial heterogeneity in this regard in the East or economically

23
more advanced region in particular. The last decomposition analysis focusing on the rich 16
provinces in China suggested, additionally, that the provincial heteorogeneity within these 16
provinces has not only be determined by the increasing difference between the 8 richest and
the 8 second richest provinces but more by the strongly rising difference even among the 8
richest provinces.
The general inequality analysis and the decomposition analysis here showed that although
Bickenbach and Liu (2013a), for example, found that the young in China have been granted
with more and more equal higher education opportunities, their access to higher education
resources once entering the universities have been not only by no means comparable. Higher
education resources have become actually more and more unequally distributed in relation to
the size of university students. Adequate regional policies are needed here, if China aims for
realising a more equal and more quality-oriented economic development in the long term. The
findings that the unequal development was not just an issue of different treatments between
regions/provinces with different development states but also an issue within traditionally
assumed to be rather homogeneous regions suggested that regional policies need to expand
their targets going beyond the traditional regional consideration between regions with
different development states. More attention needs to be paid to the provincial differences
within regions.
Such attention may be even more required for the well-developed provinces, where a strongly
increasing heterogeneity with respect to the provision of higher education resources for
students was found. It is never a matter of course that the unequal distribution issues as
analysed here are relevant for the economically backward provinces/regions only. It is
particularly tricky if some richest provinces are actually also confronted with such challenges
compared to their traditional counterparts, because due to their development success in the
past their needs for adequate policy support are more likely to be more easily ignored. To
design adequate regional policies to effectively deal with unequally distributed higher
education resources, paying appropriate attention to all groups of provinces concerned is the
key.

24
References
Acs, Z. J., Audretsch, D. B. und Lehmann, E. E. (2013). The Knowledge Spillover Theory of
Entrepreneurship. Small Business Economics, 41(4): 757-774.
Acs, Z. J., Braunerhjelm, P., Audretsch, D. B. und Carlsson, B. (2009). The Knowledge Spillover
Theory of Entrepreneurship. Small Business Economics, 32(1): 15-30.
Aghion, P., Blundell, R., Griffith, R., Howitt, P. und Prantl, S. (2009). The Effects of Entry on
Incumbent Innovation and Productivity. Review of Economics and Statistics, 91(1): 20-32.
Bickenbach, F., & Bode, E. (2008). Disproportionality measures of concentration, specialization, and
localization. International Regional Science Review, 31(4): 259-288.
Bickenbach F. & Liu, W.-H. (2013a). Regional Inequality of Higher Education in China and the Role
of Unequal Eco nomic Development. Frontiers of Education in China, 8(2): 266-302.
Bickenbach F., & Liu, W.-H. (2013b). Gemeinsam stärker? Zur Konzentration von
Innovationsaktivitäten in China, IfW Highlights, 11-13, Kiel Institute for the World Economy.
Chen H.A. (2015) Study on New Normal of Chinese Economy (In Chinese: Zhong Guo Da Lu De
Jing Ji Xin Chang Tai Yan Xi). Taiwan Economic Forum, 13(1): 66-80.
CPC & CCSC [Communist Party of China & Central Committee and the State Council] (2016).
Guideline for China's Innovation-driven Development (In Chinese: Guo Jia Chuang Xin Qu
Dong Fa Zhan Zhan Lue Gang Yao).
Cui Y.P. (2010). Classification and evaluation of China’s regional strength of higher education.
Tsinghua Journal of Education, 31(1): 45-50.
Hou. L.L., & Xue. L. (2008). Changes in the Distribution Higher Education Institutions in China and
its Policy Implications. Tsinghua Journal of Education, 29(6): 56-61.
Liu, F. Z., Zhao, C. H., & Sun, Y. T. (2009). Analysis of regional distribution differences and patterns
of higher education resources in China. Journal of Dalian University of Technology (Social
Sciences), 30(1): 56–61.
Liu, J. M. (2007). Examination of regional disparities of higher education opportunity during the rapid
expansion period, Peking University Education Review, 5(4):142-188.
ME [Ministry of Education of the People’s Republic of China] (2003–2013). Educational Statistics
Yearbook of China, Beijing, China: People’s Education Press.

25
ME & NBSC [Ministry of Education of the People’s Republic of China & National Bureau of
Statistics of China] (2003–2014).China Educational Finance Statistical Yearbook, Beijing,
China: China Statistics Press.
ME [Ministry of Education of the People’s Republic of China] (1986a). PRC Rules on Teaching
Faculty of Higher Education (Trial Implementation) (In Chinese: Gao Deng Xue Xiao Jiao
Shi Zhi Wu Shi Xing Tiao Li).
ME [Ministry of Education of the People’s Republic of China] (1986b). Implementation Suggestions
for PRC Rules on Teaching Faculty of Higher Education (Trial Implementation) (In Chinese:
Guan Yu Gao Deng Xue Xiao Jiao Shi Zhi Wu Shi Xing Tiao Li De Shi Shi Yi Jian).
ME [Ministry of Education of the People’s Republic of China] (2006). Suggestion on Strengthening
the Construction of National Key Disciplines (In Chinese: Jiao Yu Bu Guan Yun Jia Qiang
Guo Jia Zhong Dian Xue Ke Jian She De Yi Jian).
ME [Ministry of Education of the People’s Republic of China] (2016). Suggestions on Deepening
Reform for Talent Development System (In Chinese: Guan Yu Shen Hua Ren Cai Fa Zhan Ti
Zhi Ji Zhi Gai Ge De Yi Jian).
NBSC [National Bureau of Statistics of China] (2003–2013). China Statistical Yearbook, Beijing,
China: China Statistics Press.
Nelson, R. R. & Phelps, E. S. (1966). Investment in Humans, Technological Diffusion, and Economic
Growth. American Economic Review, 56(1/2): 69-75.
SCNPC [Standing Committee of the National People’s Congress] (1998). Higher Education Law of
People’s Republic of China.
Shen, H. M. (2007a). Regional difference in distribution of China’s colleges and universities and its
impact on the equality in access to higher education. Canadian Social Science, 3(1), 74–86.
Shen, H. M. (2007b). An analysis on regional inequality of higher education opportunities: Current
state and its determinants, Tsinghua Journal of Education, 28(3), 22–29.
Zhong, H. (2011). Returns to higher education in China: What is the role of college quality?, China
Economic Review, 22, 260-275.