regional integration, growth and...
TRANSCRIPT

Reshaping Economic Geography
BACKGROUND PAPER
REGIONAL INTEGRATION, GROWTH AND
CONCENTRATION
DIRK WILLEM TE VELDE
ODI
Current version: December 5, 2007

Regional integration, growth and concentration1
Background information 5 December 2007
Overseas Development Institute 111 Westminster Bridge Road
London SE1 7JD, United Kingdom Tel.: +44 (0)20 7922 0300 Fax: +44 (0)20 7922 0399
www.odi.org.uk
1 The study is for the World Bank and is led by Dr Dirk Willem te Velde ([email protected]). He is
grateful to Steven Thompson for research assistance.

Table of contents Table of contents................................................................................................................. 1 1 Introduction................................................................................................................. 2 2 Coverage of regions .................................................................................................... 2 3 Economic performance of regions: summary ............................................................. 5 4 Implementation of the Common External Tariff in African Custom Unions............. 7 5 Convergence and divergence in developing country regions: summary of reviewed studies. .............................................................................................................................. 11 6 Further steps in the research ..................................................................................... 12 Appendices........................................................................................................................ 13 Appendix A Intra-regional exports and imports ............................................................... 14 Appendix B FDI flows and stock as % of developing country total, by region ............... 20 Appendix C GDP Per Capita by members of a region ..................................................... 26 Appendix D FDI and trade as % of GDP.......................................................................... 32 Appendix E Common external tariffs in African Custom Unions, by Country, on the basis of WTO Trade Policy Reviews 1998-2007 ...................................................................... 44 Appendix F Summary of Convergence/Divergence Research ......................................... 52 Appendix G Summary of Africa Specific Research- Convergence/Divergence Continued........................................................................................................................................... 56
1

1 Introduction This study aims to examine the circumstances under which different types of regional integration leads to convergence and growth, and how such integration could best be fostered. It will cover regions across the world, but the empirics will focus on developing country regions and Africa in particular. This paper provides background information for the study which focuses on the following aspects: • Consider representative regions in Africa and other developing country regions and review
their achievements in terms of income levels, trade, FDI and regional cooperation (intra and extra-regional);
• Examine whether regions experience higher/lower inter-country disparities in living standards (divergence or convergence);
• Review the implementation of the common external tariff (CET), especially in the context of the African customs unions; and
• Examine whether certain types of regions lead to better outcomes in terms of growth and convergence
This background paper is structured as follows. Section 2 introduces the regions covered in this research. Section 3 describes the performance of regions on the basis of a number of variables. Section 4 discusses issues surrounding the implementation of the CET. Section 5 summarises key issues and findings in the debate on convergence and divergence in regions. Section 6 suggests the next steps in this research. 2 Coverage of regions Which RTAs will be included? In Africa we include: EAC: Kenya, Tanzania, Uganda (Burundi and Rwanda joined in 2007) CEMAC: Cameroon, Gabon, Central African Republic, Chad, Equatorial Guinea, Congo, Rep. WAEMU: Benin, Burkina Faso, Cote d'Ivoire, Guinea-Bissau, Mali, Niger, Senegal,Togo COMESA: Angola, Burundi, Comoros, Congo, Dem Rep, Djibouti, Egypt, Ethiopia, Kenya, Libya, Madagascar, Malawi, Mauritius, Rwanda, Seychelles, Sudan, Uganda, Zambia, Zimbabwe SADC: Botswana, Lesotho, Namibia, South Africa, Swaziland, Angola, Malawi, Mozambique, Tanzania, Zambia, Zimbabwe, Mauritius, Congo, Dem Rep, Madagascar, Seychelles SACU: Botswana, Lesotho, Namibia, South Africa, Swaziland. In Latin America: MERCOSUR: Brazil, Argentina, Uruguay, Paraguay CARICOM: Bahamas, Belize, Barbados, Jamaica, Guyana, Saint Vincent and the Grenadines, Saint Lucia, Saint Kitts and Nevis, Grenada, Dominica, Trinidad and Tobago, Suriname, Haiti, Grenada, Dominica, Montserrat. NAFTA: United States, Mexico, Canada ANDEAN: Bolivia, Columbia, Ecuador, Peru,
2

In Asia: ASEAN: Brunei, Cambodia, Indonesia, Laos, Malaysia, Myanmar, Philippines, Singapore, Thailand, Vietnam SAARC: Afghanistan, Bangladesh, India, Maldives, Nepal, Pakistan, Sri Lanka And in Europe (we use the EU15 for analysis, but there are now 27 members): EU(15): Austria, Belgium, Denmark, Finland, France, Germany, Greece, Ireland, Italy, Luxembourg, Netherlands, Portugal, Spain, Sweden, United Kingdom Developing country customs unions: Africa EAC: Kenya, Tanzania, Uganda (Burundi and Rwanda joined in 2007) CEMAC: Cameroon, Gabon, Central African Republic, Chad, Equatorial Guinea, Congo, Rep. WAEMU: Benin, Burkina Faso, Cote d'Ivoire, Guinea-Bissau, Mali, Niger, Senegal,Togo SACU: Botswana (not in CU), Lesotho, Namibia, South Africa, Swaziland. Other: MERCOSUR: Brazil, Argentina, Uruguay, Paraguay CARICOM: Bahamas, Belize, Barbados, Jamaica, Guyana, Saint Vincent and the Grenadines, Saint Lucia, Saint Kitts and Nevis, Grenada, Dominica, Trinidad and Tobago, Suriname, Haiti, Grenada, Dominica, Montserrat. ANDEAN: Bolivia, Columbia, Ecuador, Peru. GCC Cooperation Council of Arab States for the Gulf): Baharain, Saudi Arabia, Oman, Kuwait, Qatar , UAE. CACM: Guatamala, El Salvador, Honduras, Nicaragua How do regions differ? Regions differ. In fact no region is the same. In the course of this research we will aim to differentiate amongst regions, e.g. in the way they have implemented a common external tariff or a compensation mechanism to share revenues. This allows us to test for the effects of different forms and functions of regions on growth and convergence. Te Velde (2007) compares trade and investment provisions across seven main regions, as well as for each region over time including investment rules (scope and coverage; national treatment; most favoured nation and fair and equitable treatment; performance requirements; transfers of funds; provisions with respect to expropriation; settlement of disputes) and trade rules (rules of origin; tariff structures; other provisions). Generally, regions differ with respect to trade and investment provisions in two fundamental respects:
• Over time, when regions change or add investment-related provisions; • Across regions, when investment-related provisions differ between regions at one point in
time As an example, table 1 measures trade and investment provisions for the 7 most advanced regions in the developing world regarding the inclusion of trade and investment provisions. The Investment Index captures provisions on trade and investment rules in RTAs and the extent of investment provisions. The Trade Index covers trade rules in RTAs such as MFN tariff status. The following keys were used:
3

Investment Index = 0 if not member of group = 1 if some investment provisions in region (as in COMESA, SADC), = 2 if advanced investment provisions in region (e.g. improved investor protection in ASEAN) = 3 if complete investment provisions in region (e.g. Chapter XI of NAFTA) = -1 if more restrictive provisions (restrictions on foreign investors in ANDEAN in 70s) Trade Index = 0 if not member of group = 1 if some trade provisions (e.g. tariff preferences), = 2 if low MFN tariffs, (close to) zero intra-reg tariffs = 3 if high MFN tariffs , (close to) zero intra-reg tariffs A higher value of the index should lead to further (extra-regional) FDI.
Table 1 Regional Integration Index
Investment provisions
Trade provisions RTA (date of establishment) 1970s 1980s 1990s 1970s 1980s 1990s
NAFTA (1994)
0 0 3 (1994) 0 0 2 (1994) MERCOSUR (1991) 0 0 2 (1994) 0 0 3 (1991) CARICOM (1973) 0 1 (1982) 2 (1997) 1 (1973) 2 3 (1997)
ANDEAN (1969) -1(1970)
1 (1987) 2 (1991) 1 1 2 (1993) ASEAN 0 1 (1987) 2 (1996), 3 (1998) 1 1 1 SADC (1992) 0 0 1 (1992) 0 0 1 (1992) COMESA (1994) 0 0 1 (1994) 0 0 1 (1994) Source: Measurement of provisions described in Te Velde and Fahnbulleh (2007); years between parentheses indicate when certain provisions were announced. Te Velde and Bezemer (2006) estimate a model for the real stock of UK and US FDI in developing countries during 1980-2000 and find that membership of a region as such is not significantly related to inward FDI, but crucially, when a country is a member of a region with a sufficient number and level of the trade and investment provisions (e.g. describing treatment of foreign firms, large trade preferences), this will help to attract more inward FDI to the region. Important for the debate on convergence and divergence within regions, they find that the relative size of a country’s economy within a region matters for attracting additional FDI, as does a central location in relation to the largest market. Countries that have larger economies or are geographically closer to other, larger countries within the region can expect a larger increase in FDI as a result of joining than those of countries that have smaller economies or are located in the periphery. In our future research we can introduce new provisions based on types of policies and test whether these provisions affect incomes and converges of member states of a region.
4
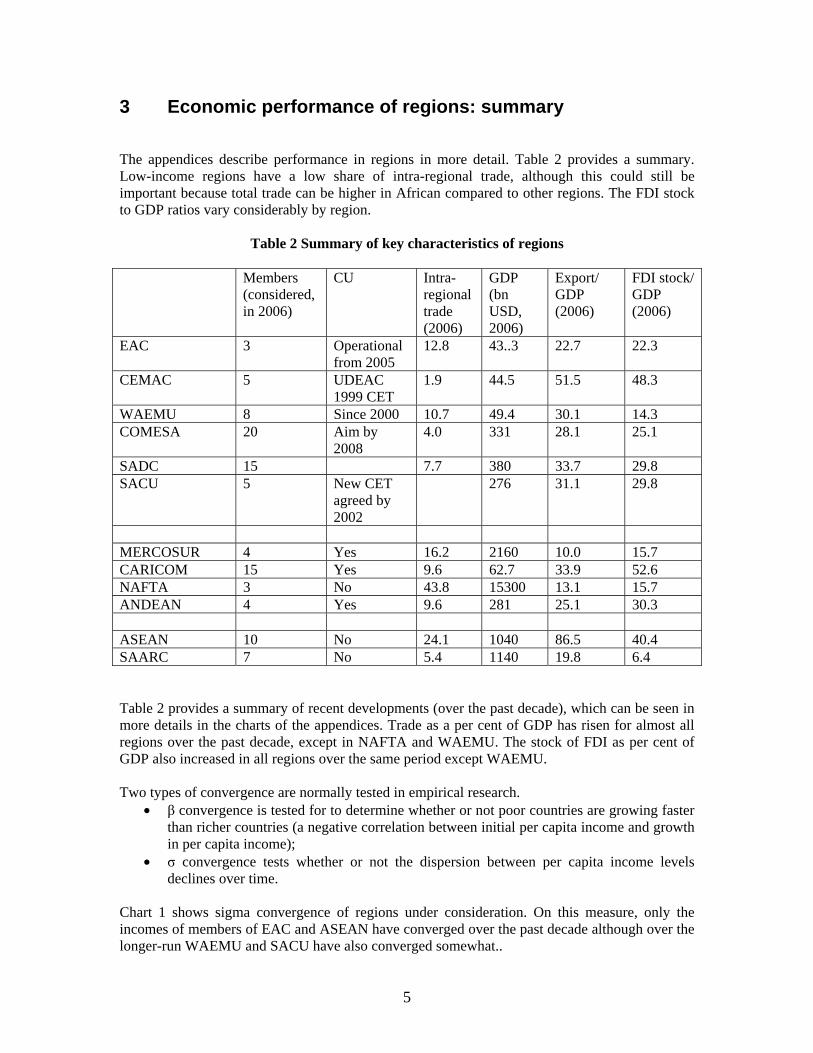
3 Economic performance of regions: summary The appendices describe performance in regions in more detail. Table 2 provides a summary. Low-income regions have a low share of intra-regional trade, although this could still be important because total trade can be higher in African compared to other regions. The FDI stock to GDP ratios vary considerably by region.
Table 2 Summary of key characteristics of regions
Members (considered, in 2006)
CU Intra-regional trade (2006)
GDP (bn USD, 2006)
Export/ GDP (2006)
FDI stock/ GDP (2006)
EAC 3 Operational from 2005
12.8 43..3 22.7 22.3
CEMAC 5 UDEAC 1999 CET
1.9 44.5 51.5 48.3
WAEMU 8 Since 2000 10.7 49.4 30.1 14.3 COMESA 20 Aim by
2008 4.0 331 28.1 25.1
SADC 15 7.7 380 33.7 29.8 SACU 5 New CET
agreed by 2002
276 31.1 29.8
MERCOSUR 4 Yes 16.2 2160 10.0 15.7 CARICOM 15 Yes 9.6 62.7 33.9 52.6 NAFTA 3 No 43.8 15300 13.1 15.7 ANDEAN 4 Yes 9.6 281 25.1 30.3 ASEAN 10 No 24.1 1040 86.5 40.4 SAARC 7 No 5.4 1140 19.8 6.4 Table 2 provides a summary of recent developments (over the past decade), which can be seen in more details in the charts of the appendices. Trade as a per cent of GDP has risen for almost all regions over the past decade, except in NAFTA and WAEMU. The stock of FDI as per cent of GDP also increased in all regions over the same period except WAEMU. Two types of convergence are normally tested in empirical research.
• β convergence is tested for to determine whether or not poor countries are growing faster than richer countries (a negative correlation between initial per capita income and growth in per capita income);
• σ convergence tests whether or not the dispersion between per capita income levels declines over time.
Chart 1 shows sigma convergence of regions under consideration. On this measure, only the incomes of members of EAC and ASEAN have converged over the past decade although over the longer-run WAEMU and SACU have also converged somewhat..
5

Chart 1 Sigma convergence, by region
0
0.1
0.2
0.3
0.4
0.5
0.6
0.7
1980 1982 1984 1986 1988 1990 1992 1994 1996 1998 2000 2002 2004 2006
CARICOM
EAC
ANDEAN
SAFTA
WEAMU
MERCOSUR
SACU
COMESA
CEMAC
ASEAN
SADC
Table 2 Development of economic performance of regions over time (last decade) Convergence
(sigma) (1997-2006)
Did export/GDP
increase (1997-2006)
Did FDI stock /GDP
increase (1997-2006)
Did intra-regional
trade increase
Did regional FDI as % of
developing country FDI
increase? (1997-2006)
EAC √ √ √ - √ CEMAC - √ √ - √ WAEMU - - - √ - COMESA - √ √ - √ SADC - √ √ √ SACU - √ √ √ MERCOSUR - √ √ - - CARICOM - √ √ - √ NAFTA - - √ √ na ANDEAN - √ √ - - ASEAN √ √ √ √ - SAARC - √ √ √ √
6

4 Implementation of the Common External Tariff in African Custom Unions Regional trade agreements can be defined as intergovernmental agreements that manage and promote trade activities in specific regions of the world. The World Trade Organization (WTO) takes stock of regional trade agreements (RTAs) in relation to their trade components. RTAs vary greatly in size and often go beyond ‘tariff-cutting exercises.’ Many developing countries view RTAs as a means to strengthen economic growth, but the WTO warns these agreements can depart from the MFN (Most Favoured Nation) principle, a key component of multilateral trading.2 They also explain that distortions in resource allocation along with trade and investment diversion can undercut potential benefits of joining.2 Despite these concerns, developing countries seek regional stability and quality of life improvements through increased inter and intra regional trade activity. There are several stages of regional economic integration, ranging from the formation of a trade bloc to the establishment of an economic and monetary union. One important step in the integration process is the formation of a customs union which not only eliminates tariffs and quotas on trade between member countries, but also establishes a common external tariff applying to non-members. In Africa, the four major customs unions are divided by region and include the East African Community (EAC), the Economic and Monetary Community of Central Africa (CEMAC), the South African Customs Union (SACU), and the West African Economic and Monetary Union (WAEMU). Just under half of Africa’s fifty three nations are members of a customs union, making these partnerships an important part of the economic and political landscape. The members in WAEMU and in CEMAC share a common currency, and were formed after the devaluation of the CFA franc in 1994. The South African Customs Union is the oldest group dating back to 1910, although it has been altered under revision agreements in 1969 and 1994.3 The latest customs union to form is the EAC on 2002 after the collapse of a similar group in 1977.4 WAEMU When forming a customs union, countries must establish a common external tariff (CET), a tariff which applies to all imports entering the union area. The eight French speaking countries of WAEMU have had a CET since 2000 and are classified as a full customs union by the Economic Commission of Africa, unlike the other economic partnership in the region (ECOWAS), which has experienced difficulties establishing a CET.7 The WAEMU has taken further steps towards regional integration in 1999 with the creation of the Pact of Convergence, Stability, Growth, and Solidarity, which includes macro-economic convergence criteria.5 The CET can act as a compensation mechanism, especially in WAEMU where it can affect how much is transferred from poor to rich countries. Some suggest setting the CET at the level of the country with the lowest initial tariff because there will be no incentive for inefficient producers to 2 WTO website on ‘Regional Integration- The Scope of RIA’s’ http://www.wto.org/english/tratop_e/region_e/scope_rta_e.htm3 The New Southern African Customs Union Agreement By Robert Kirk and Matthew Stern Blackwell Publishing Ltd Oxford; The World Economy 28 (2), 169–190 4 Integration Experience of East African Countries Presentation by Andrew Mullei, Governor of the Central Bank of Kenya May 17th, 2005 Maputo, Mocambique 5 Growth and Convergence in WAEMU Countries By Abdoul Aziz Wane IMF Working Paper – African Department 04-198 October 2004
7
increase production.6 For WAEMU as a whole, the adoption of lower tariffs may lead to a .23% loss of annual GDP, based on model estimates using CET rates in 2000. This loss would require more aid, which the authors argue should be supplied by the EU through an incentive scheme.10
CEMAC In CEMAC, the implementation of a common trading policy began in 1994 and fully took effect in 1999 with the elimination of UDEAC, a previous economic partnership in the region.7 The policy included the introduction of a four rate CET (5% band for essential goods, 10% for equipment and raw materials, 20% for intermediate goods, and 30% for consumer goods)8, the expectation that member countries would eliminate unjustified exemptions, and the establishment of TPG, a tax equal to 20% of the CET on imports from member countries, which would be phased out after five years.6 Implementation of CETs has also led to significant problems. In CEMAC and WAEMU, critics argue partial customs unions have formed because ‘there is no pooling of customs revenue, member countries maintain customs barriers at intra-CU borders, and intra-CU trade is subject to restrictive rules of origin.’9 These unions also face members not implementing the CET and having domestic producers seek Rules of Origin (RoO) protection. CEMAC brought forward problems of implementation in 2005 when the Executive Secretariat commented that excess number of derogations taken by members could lead to a ‘breakdown.’ The Council of Minister is hoping a 2009 goal of free movement of goods and services will reinforce the integration process, but currently the customs union is much stronger on paper than in practice. The problems of CEMAC continue with Cameroon because they have no incentive to cooperate with agreements. While there is evidence the country would gain between .41 and .62% of GDP by implementing CEMAC agreements, including the CET, research suggests they can do better with free trade if partners fail to provide tariff free access to their markets.6 SACU For SACU, a new agreement was signed in 2002 after years of difficult negotiations.10 Through these negotiations, the four small countries sought to eliminate the unfair influence of South Africa and its producers on the CET and bring awareness to their development interests. Under the new agreement, a ‘SACU Tariff Board’ replaced the South African Board of Tariffs and Trade, and every country now has a representative to consider changes to the CET.8 In addition, 6 Asymmetric Regionalism in Sub-Saharan Africa: Where Do We Stand? By Olivier Cadot, Jaime de Malo, and Marcelo Olarrreaga November 8th, 1999 ACP-EU Trade Group Pages 5,9 7 The Economic Effects of Integration in the Central African Economic and Monetary Community: Some General Equilibrium Estimates for Cameroon By Ferdinand Bakoup & David Tarr Volume 12 Issue 2 Pages 161-190 December 2000 African Development Review 8 Economic Partnerships Agreements, Regional Integration in Sub Saharan Africa and AGOA By Olufemi Babarinde and Gerrit Faber Presented at the EUSA Biannial Conference May 2007 *Draft 9 Risks and Rewards of Regional Trading Arrangements in Africa: Economic Partnership Agreements (EPAs) Between the EU and SSA By Lawrence Hinkle and Richard S Newfarmer January 7, 2005 World Bank Working Paper- *Draft Only 10 The New Southern African Customs Union Agreement By Robert Kirk and Matthew Stern Blackwell Publishing Ltd Oxford; The World Economy 28 (2), 169–190
8
CET changes must be approved by the ‘Council of Ministers,’ although the pre-existing CET favouring South Africa was the starting tariff in the new agreement.8 The most recent CET development comes from the EAC, which established a new Customs Protocol in January 2005. Here, the CET has three rates applying to primary/capital goods, intermediate goods, and final goods (0%, 10% and 25% respectively). The agreement also includes the removal of tariffs for Tanzania and Uganda exports to Kenya, although Kenyan exports to the two countries are subject to a reduced tariff. The tariff is supposed to give Tanzania and Uganda extra revenue as they recover from the removal of internal tariffs and should be reduced over five years. While CETs are crucial to the success of any customs union, there are difficulties with implementing the tariffs and fairly compensating members. There are two important compensation mechanisms in regional agreements: income transfers and instruments to change patterns in resource allocation and trade.11 Compensation has been most controversial in SACU where members agreed on a new financial revenue-sharing formula in 2002, a formula which distributes customs revenues based on each country’s share of total intra-SACU imports.8 Further, total excise collections are distributed through a development component (starting at 15%) and a component based on each country’s share of total SACU GDP. Countries will receive near equal shares of the development component, despite South Africa being the only net contributor to the fund.8 The agreement should help smaller countries when external tariff revenue declines, but it remains unclear whether or not an increase in the development component or a more favourable CET policy are likely to occur with added layers of bureaucracy and a reluctant South Africa. Another important limitation on CETs and customs unions is the possibility of overlapping membership between unions, especially between the EAC, COMESA, and SADC. All of these groups may not be full customs unions, but there is movement towards CETs in each one. This overlapping effect would limit the effectiveness of economic partnerships and cause trade diversion, especially when it comes to negotiating with other regions. For example, Tanzania is both a member of the EAC and SADC, and at used to be a member of COMESA. One study demonstrates the problem of overlapping by comparing the possible effect of the COMESA and SADC CET on Tanzania. The research finds the CET for either group would ‘significantly reduce the very high levels of effective protection for regional producers.’12 The difficulties presented on compensation and implementation of CETs have yet to appear in the EAC, even though this customs union is structured similarly to CEMAC and WAEMU, which have experienced significant setbacks. The issues of common external tariffs and compensation mechanisms are not disappearing with the expansion of customs unions in Africa.
11 How can Research and Training Enhance Regional Integration in Africa? By William Lyakurwa African Economic Research Consortium; Presented October 3rd, 2001 at a UNCTAD regional meeting in Mauritius Pages 8-13 12 Overlapping Membership in COMESA, EAC, SACU and SADC Trade Policy Options for the Region and for EPA Negotiations By Jakobeit, C.; Hartzenberg, T.; Charalambides, N. November 2005 Pages 98-113 Commissioned by Federal Ministry from Economic Cooperation and Development-Germany
9

Country experiences of implementing CETs based on WTO TPRs Appendix E discusses issues related to the implementation of CETs in African custom unions on the basis of WTO trade policy reviews. The following points emerge: • The introduction of the CET in WAEMU has narrowed the dispersion of duties (Burkina
Faso) and rationalised tariff structures, and in some limit the maximum customs union (Mali);
• The implementation of the CET has not had a major impact on the structure of trade, but it has increased intra-WAEMU trade (Benin, Togo);
• Many countries apply rates that are lower or higher than the CET in WAEMU. Derogations are sometimes a response to social concerns (Gabon);
• The introduction of the CET often coincides with a lower MFN rate; but this is not always the case (EAC). In Uganda duties went up, and fiscal revenues as well;
• In SACU, countries have used special protection due to infant industry reasons: Botswana (3 times), Swaziland (from time to time) and Namibia (3 times).
10

5 Convergence and divergence in developing country regions: summary of reviewed studies. Appendices F and G review 15 studies related to convergence and divergence of incomes in developing county regions. For each study the tables summarise which regions are covered, evidence on convergence, methods used, factors affecting convergence and divergence and policy suggestions. The research covers a wide variety of regions: SACU, ECOWAS, COMESA, WAEMU, CEMAC, EAC and SADC and covers convergence and divergence in GDP from 1960. The following findings have emerged from the studies:
• Convergence in SADU over 1960-2000 (Holmes, 2005); • No convergence in ECOWAS over 1960-2000 (Holmes, 2005); • Convergence in ECOWAS over 1960-1990 (Jones, 2002); • No convergence in ECOWAS over 1985-2003 (Dufrenor and Sannon, 2005); • No convergence in COMESA over 1980-2002 (Carmignani); • Limited convergence across WAEMU, 1990-2003 (Van de Boogaerde and Tsangarides,
2005); • Convergence across WAEMU, 1965-2002 (Aziz Wane, 2004); • Divergence in EAC, in the 1970s (Venables, 2003).
The methods used are either statistical (describing income levels) and more often econometric (using standard growth models). The following factors appear to affect convergence and divergence of incomes within regions:
• The size of the group does not matter (Holmes, 2005); • Integration of monetary policy, harmonisation policy, different institutions and trading
rules (Carmignani); • Labour mobility (Van de Boogaerde and Tsangarides, 2005; Konseiga, 2005); • Reactions to shocks • Macro economic convergence (Rossouw, 2006); • Competitive advantage (Venables, 2003); and • Homogeneity of the group.
These studies include policy suggestions for addressing convergence and divergence in regions:
• Groups with no convergence require additional regional development policies (Holmes, 2006);
• Design effective mechanisms for monitoring and enforcement; creation of efficient communitarian institutions, including a regional system of central banks; and consideration of institutional and economic factors (Carmignani);
• Greater political drive to address structural rigidities; • Low-income countries should join north-south agreements (Venables, 2003); • Stable governments and pro-poor policies; • Macro economic adjustment • Co-ordination of policies (Dufrenor and Sannon, 2005)
11
6 Further steps in the research This research aims to examine the circumstances under which different types of regional integration leads to convergence and growth, and how such integration could best be fostered. It will cover all world regions, but the empirics will focus on developing country regions. First we need a more systematic review of the issues. This review part will discuss the evidence under which circumstances regional integration may lead to the convergence amongst its members (distinguishing by differences in size, levels of income, type of activity, institutional frameworks, levels of skills, types of goods and services liberalised, cross-border infrastructure available etc). It will also examine how such integration could be fostered? Focusing on cross-border infrastructure and finding new financial mechanisms for this is something we have already mentioned in a regional aid for trade paper.13 We then need a more systematic formulation of hypotheses. Members of functioning regional economic agreements do not always converge. The theory is ambiguous (it could lead to convergence or divergence) and empirics also indicate this: Ireland and the rest of the EU converged mainly thanks to active Irish policies, but incomes of members of the old-style EAC diverged (Kenya vs. others). The question is not whether, but what type of co-operation matters and under what circumstances does this lead to convergence. For instance, services, goods, investment liberalisation, and the type of goods / services? We will review the evidence on this. At a broad level, the hypotheses that we are seeking to test the following key hypotheses
• Regional integration leads to growth for its members • But depending on initial economic conditions and lack of policies divergence may occur • Appropriate policies may help to reduce diverging forces and foster converging forces.
We aim to test these hypotheses on the basis of econometric modeling.
13 Velde te, D.W. (2007), Regional Aid for Trade, ILEAP Negotiation Advisory Brief No. 12, http://www.odi.org.uk/IEDG/Projects/Aid4trade_files/nab12_regional_aid_for_trade_jan_07%5B1%5D.pdf
12

Appendices
13

Appendix A Intra-regional exports and imports (Source of data in the appendix is WTO and IMF DOTS) EAC Kenya, Tanzania, Uganda
0
5
10
15
20
25
1990 1992 1994 1996 1998 2000 2002 2004 2006
Exports
Imports
Trade
CEMAC: Cameroon, Gabon, Central African Republic, Chad, Equatorial Guinea, Congo, Rep.
0.0
0.5
1.0
1.5
2.0
2.5
3.0
3.5
4.0
4.5
5.0
1990 1992 1994 1996 1998 2000 2002 2004 2006
Imports
Trade
Exports
14

WAEMU: Benin, Burkina Faso, Cote d'Ivoire, Guinea-Bissau, Mali, Niger, Senegal Togo
0
2
4
6
8
10
12
14
16
1990 1992 1994 1996 1998 2000 2002 2004 2006
Exports
Trade
Imports
MERCOSUR: Brazil, Argentina, Uruguay, Paraguay
0
5
10
15
20
25
30
1990 1992 1994 1996 1998 2000 2002 2004 2006
Imports
Exports
Trade
15

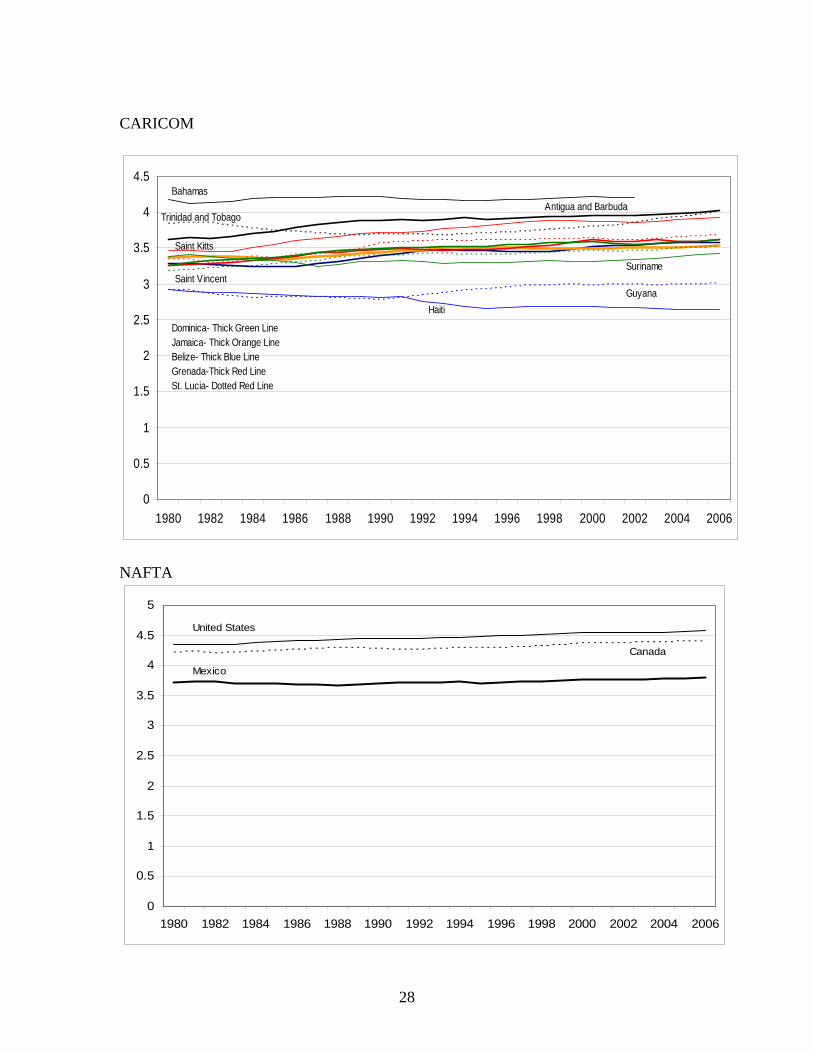
CARICOM: Bahamas, Belize, Barbados, Jamaica, Guyana, Saint Vincent and the Grenadines, Saint Lucia, Saint Kitts and Nevis, Grenada, Dominica, Trinidad and Tobago, Suriname, Haiti, Grenada, Dominica, Montserrat.
0
2
4
6
8
10
12
14
16
18
1990 1992 1994 1996 1998 2000 2002 2004 2006
Exports
Trade
Imports
, NAFTA: United States, Mexico, Canada
0
10
20
30
40
50
60
1990 1992 1994 1996 1998 2000 2002 2004 2006
Exports
Trade
Imports
16
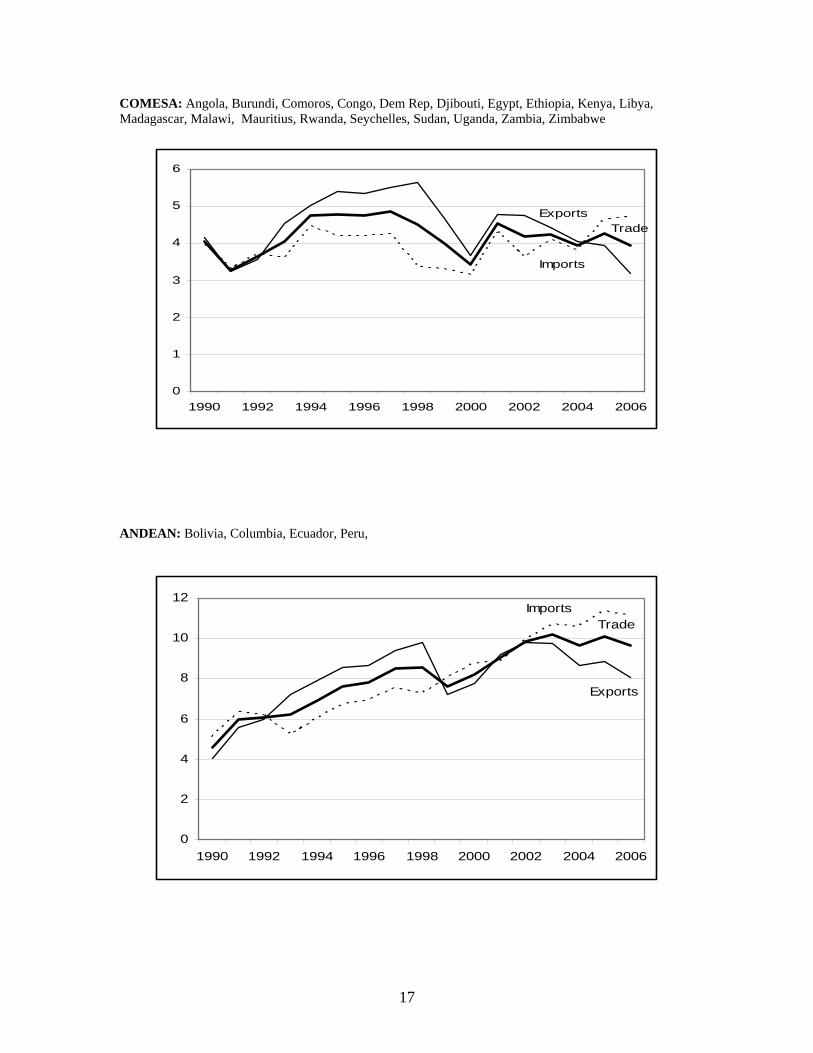
COMESA: Angola, Burundi, Comoros, Congo, Dem Rep, Djibouti, Egypt, Ethiopia, Kenya, Libya, Madagascar, Malawi, Mauritius, Rwanda, Seychelles, Sudan, Uganda, Zambia, Zimbabwe
0
1
2
3
4
5
6
1990 1992 1994 1996 1998 2000 2002 2004 2006
ExportsTrade
Imports
ANDEAN: Bolivia, Columbia, Ecuador, Peru,
0
2
4
6
8
10
12
1990 1992 1994 1996 1998 2000 2002 2004 2006
ImportsTrade
Exports
17

ASEAN: Brunei, Cambodia, Laos, Malaysia, Myanmar, Philippines, Singapore, Thailand, Vietnam
0
5
10
15
20
25
30
1990 1992 1994 1996 1998 2000 2002 2004 2006
ExportsTrade
Imports
SAARC: Afghanistan, Bangladesh, India, Maldives, Nepal, Pakistan, Sri Lanka
0
1
2
3
4
5
6
7
1990 1992 1994 1996 1998 2000 2002 2004 2006
Exports
Trade
Imports
18

EU (15): Austria, Belgium, Denmark, Finland, France, Germany, Greece, Ireland, Italy, Luxembourg, Netherlands, Portugal, Spain, Sweden, United Kingdom
57
58
59
60
61
62
63
64
65
66
67
1990 1992 1994 1996 1998 2000 2002
Exports
Imports
Trade
SADC: Botswana, Lesotho, Namibia, South Africa, Swaziland, Angola, Malawi, Mozambique, Tanzania, Zambia, Zimbabwe, Mauritius, Congo, Dem Rep, Madagascar, Seychelles
0
1
2
3
4
5
6
7
8
9
1965
1967
1969
1971
1973
1975
1977
1979
1981
1983
1985
1987
1989
1991
1993
1995
Imports
Trade
Exports
*Table based on averages of five year intervals (ex. 1965-69, 1970-74).
19

Appendix B FDI flows and stock as % of developing country total, by region Source of data in this appendix is UNCTAD EAC
0
0.1
0.2
0.3
0.4
0.5
0.6
1980 1983 1986 1989 1992 1995 1998 2001 2004
Flows
Stock
CEMAC
-0.5
0
0.5
1
1.5
2
2.5
3
1980 1983 1986 1989 1992 1995 1998 2001 2004
Flows
Stock
20

WAEMU
0
0.1
0.2
0.3
0.4
0.5
0.6
0.7
0.8
1980 1983 1986 1989 1992 1995 1998 2001 2004
Flows
Stock
MERCOSUR
0
5
10
15
20
25
30
35
40
1980 1983 1986 1989 1992 1995 1998 2001 2004
Flows
Stock
21

CARICOM
0
0.5
1
1.5
2
2.5
1980 1983 1986 1989 1992 1995 1998 2001 2004
Stock
FDI
SACU
-4
-2
0
2
4
6
8
10
12
1980 1983 1986 1989 1992 1995 1998 2001 2004
Stock
Flows
22

SADC
0
2
4
6
8
10
12
14
1980 1983 1986 1989 1992 1995 1998 2001 2004
Stock
Flows
COMESA
0
2
4
6
8
10
12
14
1980 1983 1986 1989 1992 1995 1998 2001 2004
Flows
Stock
23

ANDEAN
0
1
2
3
4
5
6
7
8
9
1980 1983 1986 1989 1992 1995 1998 2001 2004
Flows
Stock
ASEAN
0
5
10
15
20
25
30
35
1980 1983 1986 1989 1992 1995 1998 2001 2004
Flows
Stock
24

SAARC
0
1
2
3
4
5
6
7
1980 1983 1986 1989 1992 1995 1998 2001 2004
Flows
Stock
EU (in world)
0
10
20
30
40
50
60
1980 1982 1984 1986 1988 1990 1992 1994 1996 1998 2000 2002
Flows
Stocks
NAFTA(in world)
0
10
20
30
40
50
60
1980 1983 1986 1989 1992 1995 1998 2001 2004
Flows
Stock
25

Appendix C GDP Per Capita by members of a region Source of data in this appendix is World Development Indicators GDP in constant US$, 2000 prices; data are presented in log format EAC
0
0.5
1
1.5
2
2.5
3
1980 1982 1984 1986 1988 1990 1992 1994 1996 1998 2000 2002 2004 2006
KenyaTanzania
Uganda
CEMAC
0
0.5
1
1.5
2
2.5
3
3.5
4
4.5
1980 1982 1984 1986 1988 1990 1992 1994 1996 1998 2000 2002 2004 2006
Gabon
Congo
CameroonEq. Guinea
Central African Rep.
Chad
26

WAEMU
0
0.5
1
1.5
2
2.5
3
3.5
1980 1982 1984 1986 1988 1990 1992 1994 1996 1998 2000 2002 2004 2006
Cote d'Ivoire
Senegal
Guinea-Bissau Niger
Benin
Togo-Thick Red LineBurkina Faso- Dotted Red Line
MERCOSUR
0
0.5
1
1.5
2
2.5
3
3.5
4
4.5
1980 1982 1984 1986 1988 1990 1992 1994 1996 1998 2000 2002 2004 2006
Argentina
Uruguay
BrazilParaguay
27
CARICOM
0
0.5
1
1.5
2
2.5
3
3.5
4
4.5
1980 1982 1984 1986 1988 1990 1992 1994 1996 1998 2000 2002 2004 2006
Bahamas
Trinidad and TobagoAntigua and Barbuda
HaitiGuyana
Suriname
Saint Kitts
Saint Vincent
Dominica- Thick Green LineJamaica- Thick Orange LineBelize- Thick Blue LineGrenada-Thick Red LineSt. Lucia- Dotted Red Line
NAFTA
0
0.5
1
1.5
2
2.5
3
3.5
4
4.5
5
1980 1982 1984 1986 1988 1990 1992 1994 1996 1998 2000 2002 2004 2006
United States
Canada
Mexico
28

SACU
0
0.5
1
1.5
2
2.5
3
3.5
4
1980 1982 1984 1986 1988 1990 1992 1994 1996 1998 2000 2002 2004 2006
Lesotho
Sw aziland
South Africa
Bostw ana
Namibia
SADC
0
0.5
1
1.5
2
2.5
3
3.5
4
4.5
1980 1982 1984 1986 1988 1990 1992 1994 1996 1998 2000 2002 2004 2006
SeychellesSouth Africa
Namibia
Botsw ana
Sw azilandAngola
Congo, Dem Rep
Malaw iMadagascar
Zimbabw e- Green LineMauritius- Dotted Green LineZambia-Think Green LineTanzania- Dotted Blue LineLesotho- Thick Blue Line
Mozambique
29

COMESA
0
0.5
1
1.5
2
2.5
3
3.5
4
4.5
1980 1982 1984 1986 1988 1990 1992 1994 1996 1998 2000 2002 2004 2006
Seychelles
LibyaSw azliand Egypt
Dijibouti
Congo, Dem RepAngola- Blue LineMauritius- Thick Blue LineZambia- Thick Green LineSudan- Dotted Green LineMadagascar- Green LineComoros- Thick Orange LineUganda- Light Green LineBurundi- Thick Light Green Line
Zimbabw e
Malaw i- Thick Brow n LineEthiopia-Dotted Brow n LineKenya- Thick Pink LineRw anda- Dark Grey LineEritrea- Grey Line
ANDEAN
2.6
2.7
2.8
2.9
3
3.1
3.2
3.3
3.4
3.5
1980 1982 1984 1986 1988 1990 1992 1994 1996 1998 2000 2002 2004 2006
Peru
Columbia
Ecuador
Bolivia
30

ASEAN
0
0.5
1
1.5
2
2.5
3
3.5
4
4.5
5
1980 1982 1984 1986 1988 1990 1992 1994 1996 1998 2000 2002 2004 2006
Brunei
Singapore Malaysia
ThailandPhillippines
Indonesia
Vietnam- Thick Orange LineLaos- Thick Blue LineCambodia- Dotted Blue Line
SAARC
0
0.5
1
1.5
2
2.5
3
3.5
4
1980 1982 1984 1986 1988 1990 1992 1994 1996 1998 2000 2002 2004 2006
Maldives
Sri Lanka Pakistan
India
Bangledesh
Nepal
31
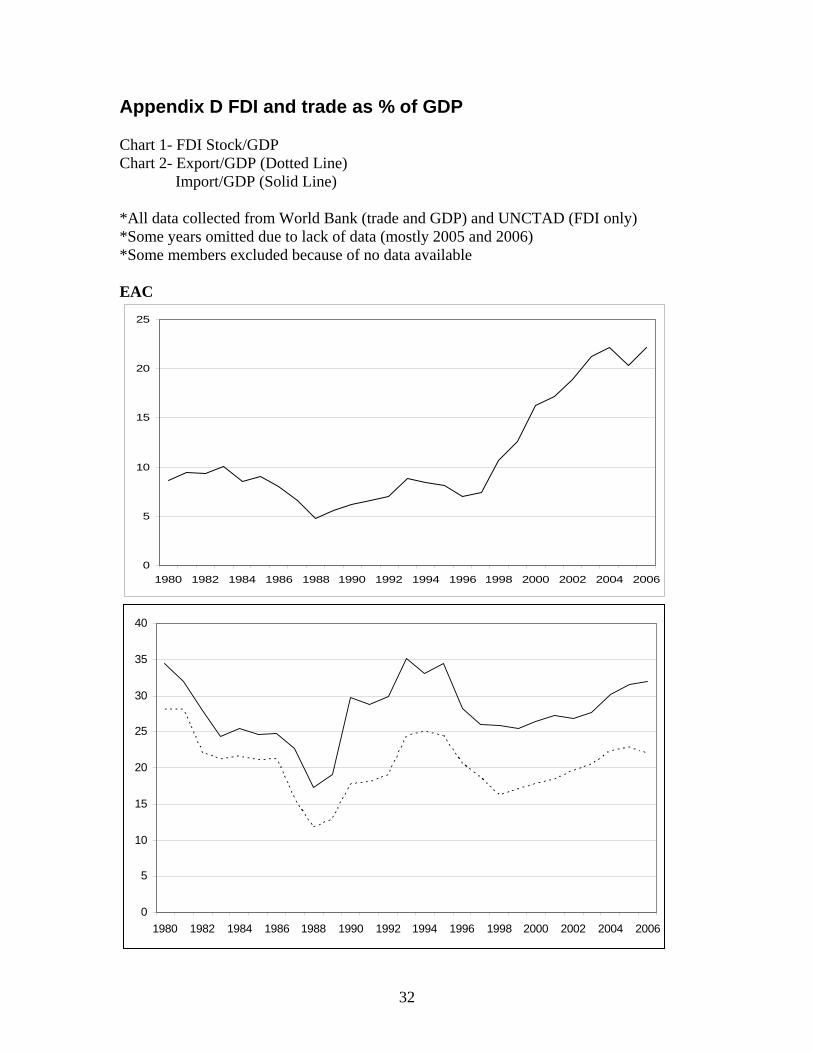
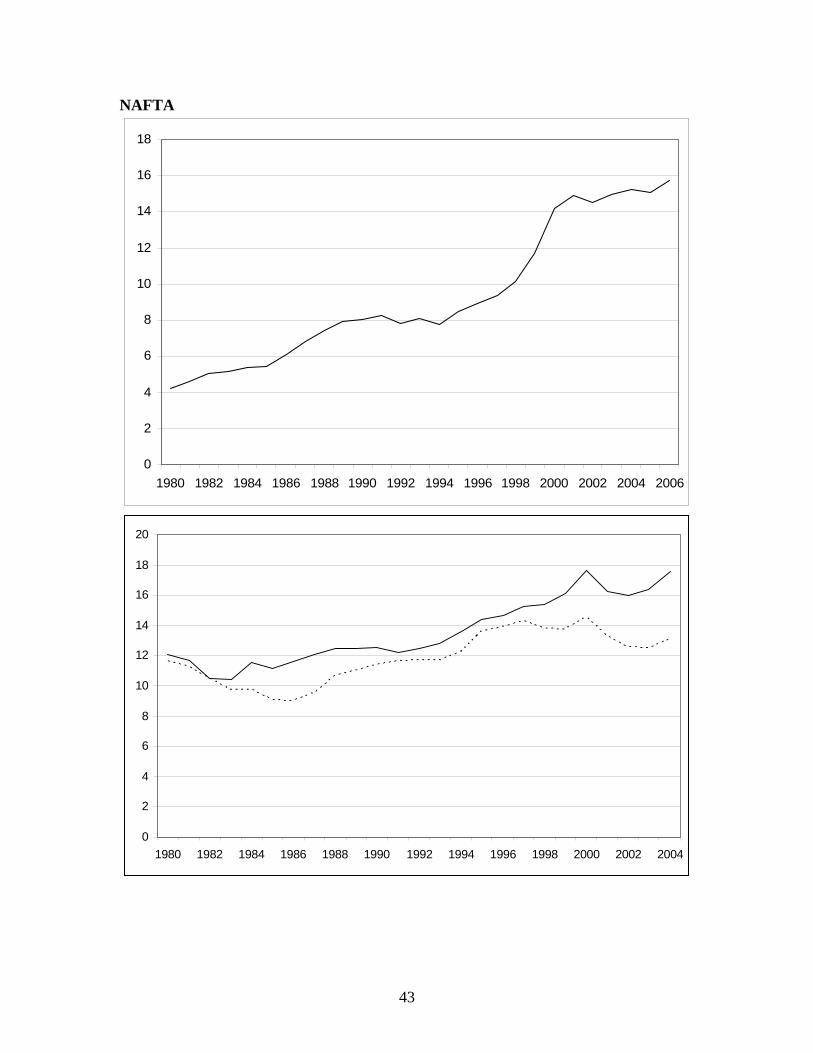
Appendix D FDI and trade as % of GDP Chart 1- FDI Stock/GDP Chart 2- Export/GDP (Dotted Line) Import/GDP (Solid Line) *All data collected from World Bank (trade and GDP) and UNCTAD (FDI only) *Some years omitted due to lack of data (mostly 2005 and 2006) *Some members excluded because of no data available EAC
0
5
10
15
20
25
1980 1982 1984 1986 1988 1990 1992 1994 1996 1998 2000 2002 2004 2006
0
5
10
15
20
25
30
35
40
1980 1982 1984 1986 1988 1990 1992 1994 1996 1998 2000 2002 2004 2006
32
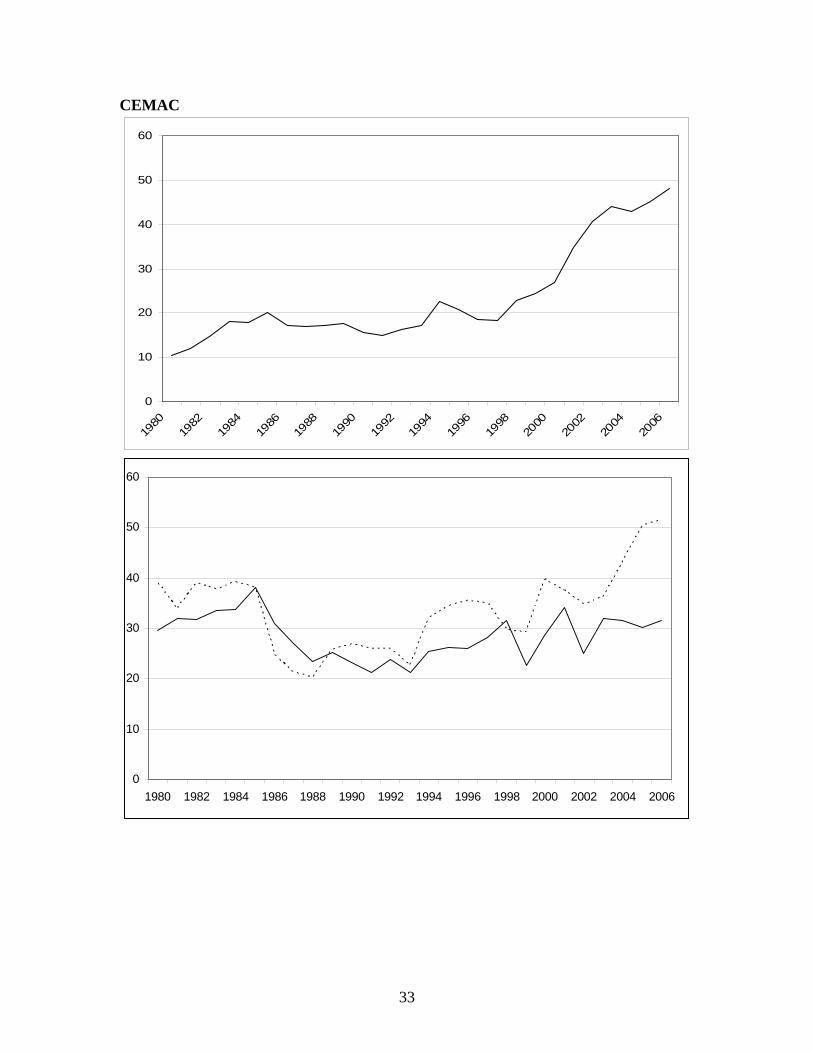
CEMAC
0
10
20
30
40
50
60
1980
1982
1984
1986
1988
1990
1992
1994
1996
1998
2000
2002
2004
2006
0
10
20
30
40
50
60
1980 1982 1984 1986 1988 1990 1992 1994 1996 1998 2000 2002 2004 2006
33

WAEMU
0
2
4
6
8
10
12
14
16
18
1980 1982 1984 1986 1988 1990 1992 1994 1996 1998 2000 2002 2004 2006
0
5
10
15
20
25
30
35
40
45
1980 1982 1984 1986 1988 1990 1992 1994 1996 1998 2000 2002 2004 2006
34

MERCOSUR
0
5
10
15
20
25
30
1980 1982 1984 1986 1988 1990 1992 1994 1996 1998 2000 2002 2004 2006
0
2
4
6
8
10
12
14
1980 1982 1984 1986 1988 1990 1992 1994 1996 1998 2000 2002 2004 2006
35

CARICOM
0
10
20
30
40
50
60
1980 1982 1984 1986 1988 1990 1992 1994 1996 1998 2000 2002 2004 2006
0
5
10
15
20
25
30
35
40
1980 1982 1984 1986 1988 1990 1992 1994 1996 1998 2000 2002 2004
36
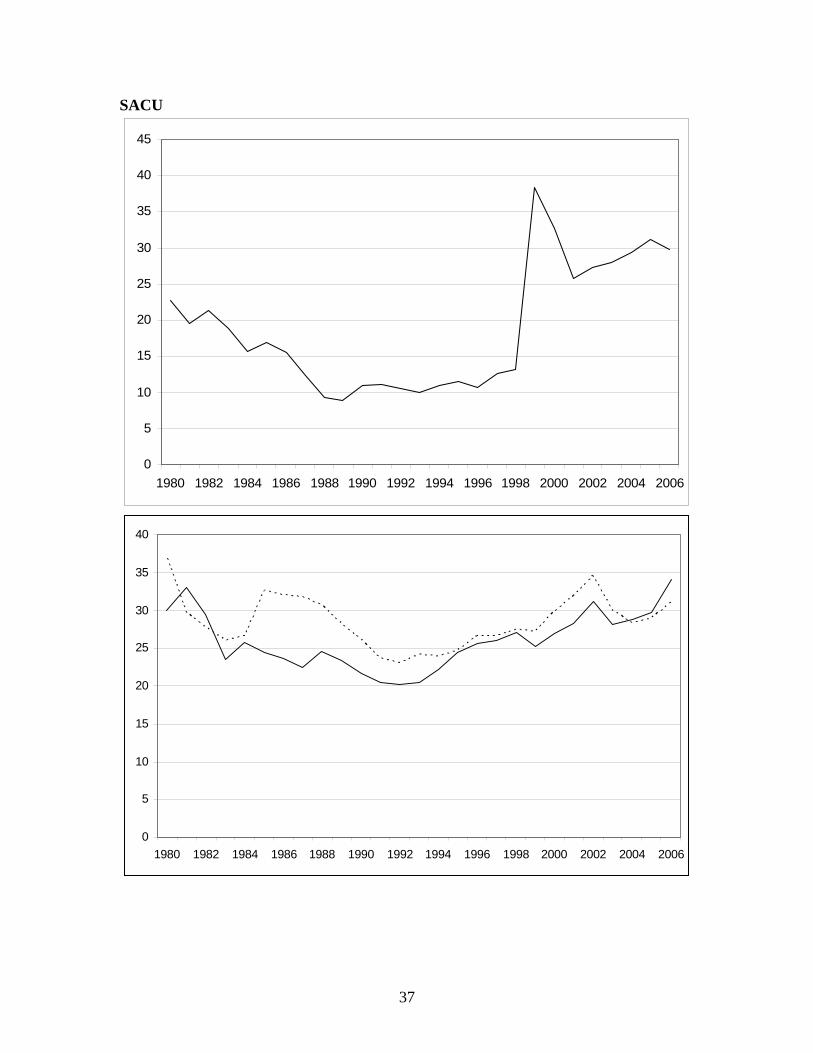
SACU
0
5
10
15
20
25
30
35
40
45
1980 1982 1984 1986 1988 1990 1992 1994 1996 1998 2000 2002 2004 2006
0
5
10
15
20
25
30
35
40
1980 1982 1984 1986 1988 1990 1992 1994 1996 1998 2000 2002 2004 2006
37

SADC
0
5
10
15
20
25
30
35
40
45
1980 1982 1984 1986 1988 1990 1992 1994 1996 1998 2000 2002 2004 2006
0
5
10
15
20
25
30
35
40
1980 1982 1984 1986 1988 1990 1992 1994 1996 1998 2000 2002 2004
38
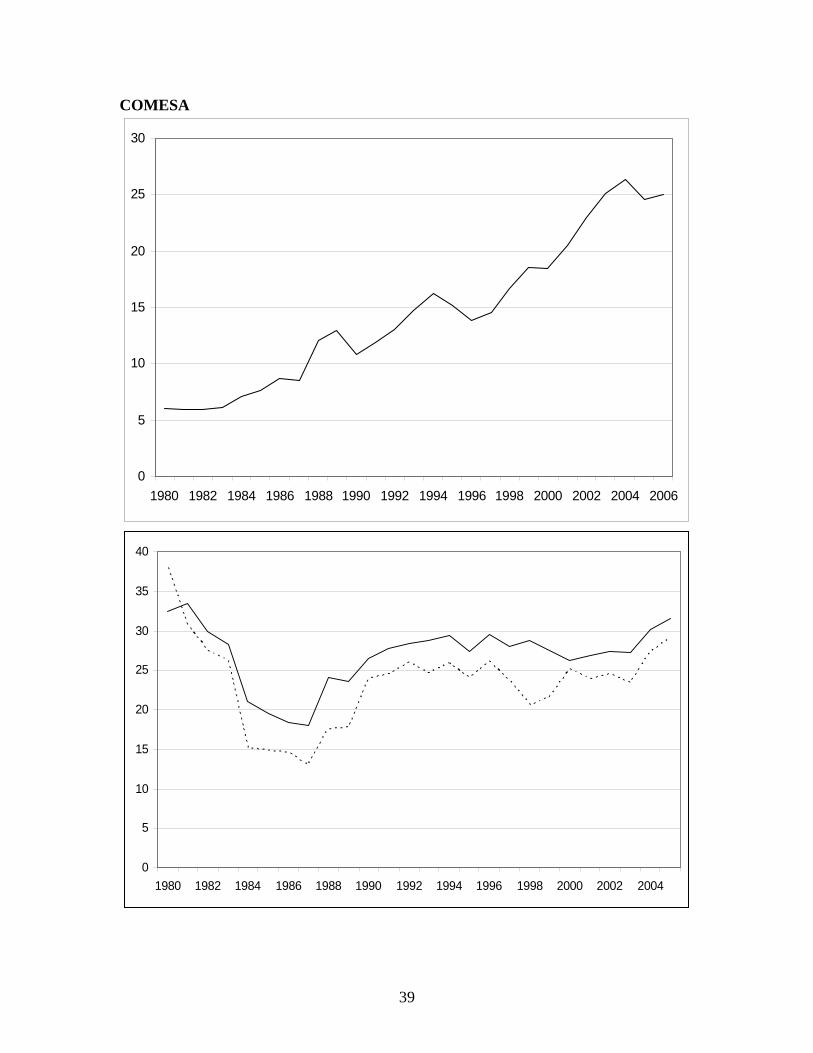
COMESA
0
5
10
15
20
25
30
1980 1982 1984 1986 1988 1990 1992 1994 1996 1998 2000 2002 2004 2006
0
5
10
15
20
25
30
35
40
1980 1982 1984 1986 1988 1990 1992 1994 1996 1998 2000 2002 2004
39

ANDEAN
0
5
10
15
20
25
30
35
1980 1982 1984 1986 1988 1990 1992 1994 1996 1998 2000 2002 2004 2006
0
5
10
15
20
25
30
1980 1982 1984 1986 1988 1990 1992 1994 1996 1998 2000 2002 2004 2006
40

ASEAN
0
10
20
30
40
50
60
1980 1982 1984 1986 1988 1990 1992 1994 1996 1998 2000 2002 2004 2006
0
10
20
30
40
50
60
70
80
90
100
1980 1982 1984 1986 1988 1990 1992 1994 1996 1998 2000 2002 2004
41

SAARC
0
1
2
3
4
5
6
7
1980 1982 1984 1986 1988 1990 1992 1994 1996 1998 2000 2002 2004 2006
0
5
10
15
20
25
1980 1982 1984 1986 1988 1990 1992 1994 1996 1998 2000 2002 2004
42
43
NAFTA
0
2
4
1980 1982 1984 1986 1988 1990 1992 1994 1996 1998
6
8
10
12
14
16
18
2000 2002 2004 2006
0
2
4
6
8
10
12
14
16
18
20
1980 1982 1984 1986 1988 1990 1992 1994 1996 1998 2000 2002 2004

Appendix E Common external tariffs in African Custom Unions, by Country, on the basis of WTO Trade Policy Reviews 1998-2007
Customs Union
Countries Start of CU Level of CET Implementation Issues
WAEMU Benin TPR June 2004
-Signed treaty establishing the WAEMU on 11 January 1994 -CET implemented on 31 January 2000
-Average simple tariff increased from 13.7% in 1997 (actually applied) to 14.6% -MFN simple average is 12.1%. -All 5,641 tariff lines are defined by the WAEMU CET -Does not apply the protection tax or the special imports tax
-“An increase in the CET for agricultural products appears possible in the context of the WAEMU’s common agricultural policy.14” Page 34 -“According to the authorities, an analysis of the structure of products imported since application of the CET shows that it did not have any marked impact on foreign trade and particularly on the breakdown of imports. Between 1999 and 2001, however, it appears to have fostered an increase in intra-WAEMU trade, which achieved annual growth rates of some 23 and 21 per cent respectively.” Page 35
Burkina Faso TPR June 2004
-Average simple tariff has fallen dramatically since the start of the CET from 31.1% to 12.1% MFN -Actual applied rate is 14.6% -Applies an additional WAEMU duty on imports from third world countries (Statistical Fee)
-Burkina Faso applies an addition 5% TDP to agricultural products, reducing the purchasing power of households -Trade is still hampered by non-tariff barriers - “The grouping of products into four major categories under the CET has considerably lessened the dispersion of duties since the first review of Burkina Faso’s trade policy in 1998.” Page 35
- “The authorities note that, as a result of the introduction of the TPC and the CET, “Burkina is one of the countries most vulnerable to tariff reductions both internally and externally”.15 At the time of the first review, the Secretariat had noted that Burkina
14 WTO (2003). 15 Service Note No. 2003 00088/MEF/SG/DGD of 29 January 2003.

Faso’s import duties were among the highest in the WAEMU.16 According to a document provided to the Secretariat, total losses over the period 2000-2002 were estimated to be CFAF 52 billion (US$866.7 million). Burkina Faso has received financial compensation from the WAEMU amounting to CFAF 14.8 billion (US$246.7 million) for the period 1996-2002 to offest the loss of customs revenue as a result of the TPC.17” Page 35
Cote d’Ivoire CET not implemented since last WTO report Mali
TPR June 2004
-Simple average tariff has decreased to 14.6% (actual applied) -12.1% customs duty (MFN) -5,492 10 digit tariff lines are applied, consisting of WAEMU CET guidelines
-Mali still gives a significant level of protection to agricultural products, reducing the purchasing power of households - “The introduction of the WAEMU’s CET has replaced the customs duty and the fiscal import duty with a single DD and, consequently, unified the customs tariff. Another major change since the first review is the decrease in the maximum rate of duty from 35 per cent to 20 per cent (Table AIII.2), which has noticeably narrowed the standard variation. These changes, together with the reclassification of imports, have greatly lowered the average tax on products which are largely imported, particularly cereals (70 per cent less) and sugar and confectionery (60 per cent less). Nevertheless, the CET imposes a maximum customs duty of 20 per cent on food products, as was already the case under the national tariff structure.” Page 32
16 WTO document WT/TPR/S/46, Chapter III, of 23 September 1998, page 26. 17 WAEMU Commission (2003a).
45

Niger TPR September 2003 Niger (cont)
-Simple customs duties at 12.1% -14.6% simple tariff actually applied -5,538 10 digit tariff lines have been applied, all based on the WAEMU CET - “Duty-free entry only applies to around one third of the WAEMU’s intra-community trade.18” Page 30 - “The authorities have estimated that in 2000 the loss of customs revenue due to the introduction of the full CET and the reduction in the RS from 5 per cent to 1 per cent on 1 January 2000 amounted to CFAF 10.8 billion. The taxable value decreased as a result of two factors in particular: the preferences granted to products originating in the WAEMU; and the volume of goods admitted free of duty. The revenue foregone as a result of various duty and tax exemptions in 2002 has been estimated at CFAF 14.8 billion.” Page 38
-Trade-related constraints persist and include a compulsory statistical registration form for all imports and exports, a national administrative values for 868 products, and an import inspection tax - “It should also be noted that for some agricultural products there is a wide gap between the MFN customs duties applied and the ceiling of 200 per cent bound in Schedule LIII annexed to the GATT 1994. This discrepancy could lead to uncertainty and instability in the tariff regime, although this is lessened by the fact that Niger applies the common trade policy of the WAEMU rather than its own tariff policy.” Page 30
Senegal TRP September 2003
-Applied average tariff has dropped from more than 30% in 1994 to 14.7% in 2002 -Simple average customs duty is 12.1% -All 5,546 10 digit tariff lines are defined by the WAEMU CET and have been since 25 July 2002 “Prior to this, Senegal’s tariff differed from the CET in three respects: 786 headings in Senegal’s tariff had no counterpart in the CET; 151 headings in the CET did not appear in Senegal’s tariff; and 146 headings in Senegal’s tariff were not classified in accordance with the CET.2” Footnote Page 37 Later date unique to Senegal
-“Tariffs have been simplified and dispersion of duties has been lessened” after implementation
46

Togo TPR July 2006
-The simple average applied tariff is 12.1% -14.4% is tariff for most agricultural products -5,643 10 digit tariff lines include provisions of the WAEMU CET -A Chamber of Commerce tax and certain income taxes also apply
-Non-tariff barriers still exist, specifically with transportation difficulties between coastal countries (like Togo) and landlocked countries -“The application of the preferential regime has led to a considerable loss of revenue, estimated at CFAF 164.5 billion between 1996 and end 2005, which is being addressed through a Community mechanism for the compensation of shortfalls in customs receipts.” Page 18 WAEMU wide
(WAEMU commission claims preferential regime has increased intra-region trade)
Guinea-Bissau Signed treaty on 1 January 1997
No WTO report available
CEMAC Cameroon TPR October 2007
-On 5 February 1998 Heads of State declared beginning of CEMAC -UDEAC CET began in June 1993 -CET revised in 2001 to comply with the Harmonization System (HS)
-Imposes CET tariff ad valorem -Average Customs Tariff is 19.1% -Applied simple average is 20.6% -Binds tariff at a ceiling rate of 80% for agricultural and 50% for non-agricultural products
-Only CEMAC state to have a significant industrial base -Tariff implemented is called DDI and differs from the CET on 300 tariff headings -“Overall, the tariff structure is not such as to encourage local processing. The heavy taxation on inputs (in particular in non-metal mineral product industries) increases production costs and thereby reduces the competitiveness of the finished products.” Page 38
Gabon TPR October 2007
-Simple average tariff based on the CET is 18.2% -Tariffs bound at 15% for some non-agricultural products and 60% for other goods (includes agricultural products)
- “Gabon applies rates that are lower than those in the CET to many tariff lines19, but also rates that are higher than those for many CET lines.20 These derogations from the CEMAC's CET are a response to social concerns or demands by economic agents.”
19 Medicines, medical appliances and equipment; corrective spectacles; laminated products in iron or steel; minibuses. 20 Wheat flour or meslin; biscuits; various paints and varnishes.
47

Page 31
Central African Republic TPR June 2007
-Simple average tariff applied is 18.2% (2006)
-Absence of a single entry point in CEMAC hurts CAR the most because products come from Cameroon -5,663 eight digit lines of the CET are applied (most things covered)
Chad TPR January 2007
-Average tariff is 18.4%, but the actual tax levied at the border is 21.6% - “Chad lacks an up-to-date published version of its tariff. Every year, the finance laws add or eliminate relevant provisions, but these are not incorporated in the published tariff, the latest version of which dates from 2001.” Page 28
-The DDI is higher or lower than the CET on 23 different tariff headings
-“The range of exit duties and taxes applied by Chad is making the country's products less competitive and discouraging exports” -“In general, customs procedures lack transparency, and the transit procedures for goods bound for Chad are lengthy and expensive, which adds to import costs and encourages informal trade.” Page 25
Equatorial Guinea No information on the WTO Trade Reports Congo -Simple average tariff is 18.7% (MFN)
-Applies CET for the most part, except on 37 tariff lines that are covered as cultural items -Also applies the GPT
-Only country to have complied by paying the internal TPI tax -Government points out that similar economies (agricultural, mining) in CEMAC hamper intra-country trade - “The tariff is characterized by mixed escalation due to the relatively high level of protection accorded to unprocessed agricultural products” Page 26 - “Agricultural products account for a substantial proportion of the expenditure of consumers, especially those on low incomes, and their heavy taxation adds to the cost.” Page 31
EAC Kenya
TPR October 2006
-Treaty for current EAC took effect 7 July 2000 -Permanent Tripartite
-Simple average applied tariff under the new CET is 12.9%, a drop of 4% in two years -Kenya grants tariff preferences to Uganda and Tanzania through reduced bands
-The implementation of a CET has made previous tariff reductions redundant because of the number of 0% band products -Because the CET is new, exceptions have been
48

Rwanda and Burundi joined in 2007
Commission formed on 14 March 1996 between Kenya, Uganda, and Tanzania -Current CET took effect 1 January 2005
- “Tariffs are bound at a ceiling rate of 100% for all agricultural products. For non-agricultural products, Kenya has bound six tariff lines” MFN Tariff Bindings Page A1-53 -Products that enter through Uganda and Tanzania to the Kenyan border are now duty free
granted to each country, including the ability for Kenya to impose lower import tariffs on rice from Pakistan -Harmonization of duty and tax exemptions have been agreed to but have not been implemented into national laws -Members have been slow in reducing tariff barriers for intra-region trade, which should be phased out by 2010
Tanzania TPR October 2006
-The average simple MFN tariff is 13.5% since the CET, slightly higher than the EAC average of 12.9% -Preference is given to Uganda and Kenya
See Kenyan explanation -Tanzania is allowed to impose lower imports on wheat and barley.
Uganda TPR October 2006
- “The move from the national tariff to the EAC common external tariff in January 2005 resulted in an overall increase of average duties on imports into Uganda” Page A3-233 The tariff has gone from 9% to 12.9%. -Grants concessions on 134 tariff lines (Lots of manufacturing products) -Preference is given to Uganda and Kenya
See Kenyan explanation -The abolishment of tariffs on the movement of goods in the EAC has especially helped Uganda because of the large number of goods shipped through Mombasa and the long transport time -Fiscal revenue from imports has increased after the CET - There are indications that corruption, smuggling, falsification of documents, and under-declaring of goods and income have undermined growth in tax revenue.21 Page A3-235
SACU Botswana
-On 1 March 1997 SACU replaced the 1910 Customs Union -On 21 October 2002 a new treaty was signed, changing the SACU agreement
-CET is determined by the Tariff Board under the new agreement of 2002 and may change (started at South Africa level); this makes it harder for producers in each country to seek protection -The average simple tariff across SACU in 2002 was 11.4% -Goods imported to the SACU area may be subject to four types of charges: ordinary customs duties, excise
-In practice, applied customs tariffs, excise duties, valuation methods, origin rules, and contingency trade remedies are, so far, the only trade policy measures harmonized throughout SACU -Botswana has used special protections on three occasions to protect infant industries
21 Ayoki et al (2005).
49

Bostwana/SACU (cont)
duties, levies, and VAT or sales tax - Ad valorem, specific, mixed, compound, and formula duties are all part of the complicated tariff structure -7,090 tariff lines exist, 5,933 of which are ad valorem -Specific duties apply to agricultural products -South Africa represented the Union to the WTO on tariff rates, but countries have varied their bound rates
Lesotho See Botswana explanation -Tariff evasion has been an increasing problem through the misrepresentation of goods or undervaluation -The bureaucracy required for goods to enter Lesotho from South Africa is burdensome. Import permits are required for goods originating in non-SACU countries -Many of Lesotho’s trade provisions are similar to South Africa, including anti-dumping measures
Swaziland See Botswana explanation -Anti-dumping and countervailing duties applied for imports going through South Africa hurt the economy; trade success largely depends on South African policy. -Access to sugar greatly affects trading with external partners such as the EU -“From time to time” Swaziland has used SACU protections to help infant industries
South Africa See Botswana explanation -South Africa also offers reduced tariffs to the EU, Zimbabwe, Milawi, and Mozambique -Various tariff refunds are available if companies can prove they have greatly increased production costs
50

-The focus in the customs area has been on export promotion
Namibia -On 10 July 1990 Nambia became a member after being a de facto member previously
See Botswana explanation -Streamlined custom procedures have made the process easier; just one document is required in most cases -Nambia has protected infant industries on three occasions. -Certain Nambian agricultural imports below an annual quota are duty free
51

Appendix F Summary of Convergence/Divergence Research
Study Regions covered, time period
Evidence on convergence or divergence in regions
Method used to establish this
Factors affecting convergence and divergence in regions
Policy options / suggestions
Winners and Losers from Regional Integration Agreements Anthony J. Venables Pages 747-761 The Economic Journal Volume 113 October 2003
East African Common Market Collapse in 1977; Econ Community of West Africa 1972-1997; Generally includes all low income countries.
Divergence in customs unions with low income countries. An example is given between Kenya and Uganda where one country will gain more than the other. Cote d’Ivoire and Senegal saw a huge increase in manufacturing value added in their agreement over other nations.
Three models with two small countries and the rest of the world are used. 1) Diagrammatic analysis including competitive advantage and trade creation/diversion 2) Multi-good Ricardian trade model 3) Heckscher-Ohlin structure with production differentiation.
-The level of competitive advantage between member countries; a few nations will have an extreme competitive advantage while others will have an intermediate advantage. -Skilled vs. Unskilled labour (ratios)
Low per capita income countries should join customs unions/agreements with more development countries that possess a highly skilled workforce (‘North-South’ Agreements).
Global Trade Integration and Economic Convergence of Developing Countries William Amponsah, Dale Colyer, and Curtis Holly P 1142-48, Vol. 81, No 5 1999 American Journal of Agricultural Economics
Botswana, Kenya, and Ghana mentioned; main focus between developing countries and developed countries since the 1960’s.
Convergence may be occurring between high income/low income nations if the low income nations have a faster growth rate (rather than a higher real GDP/income level). African nations are the exception because there has been little sustainable growth.
-Growth rates, Income levels, and Governing Structures among various regions are referenced. -Limited econometric data is used; paper is a survey of previous literature and is more background information.
-Governance: Stability and transparency are needed for growth and thus convergence with more developed countries -Investment in human capital and a skilled labour force -Financial Market stability- ease of investment -Agriculture a deterrent because of volatile commodity prices
-Developing countries have to establish stable governments and pro-growth policies (open economies) -Integration into the high skill global economy vital
52

Study Regions covered, time period
Evidence on convergence or divergence in regions
Method used to establish this
Factors affecting convergence and divergence in regions
Policy options / suggestions
Regional Integration Agreements: A force for convergence or divergence? AJ Venables World Bank and LSE Prepared for the Annual Bank conference on Development Economics in Paris, June 1999
In general focuses on FTA’s involving different income levels.
Divergence is re-emphasized for FTA’s involving low income nations because of competitive advantage and also agglomeration of economic activity. Graphical evidence is provided to show the benefit of a ‘North-south’ agreement.
-Convergence/divergence is demonstrated through differences in skilled labour and in national income -Agglomeration is based on centripetal and centrifugal forces in industrial economics, and what FTA’s do to the existing model.
See previous sections. Emphasis on FTA’s between rich and poor countries instead of partnerships within poor countries.
*Economic Integration and Convergence of Per Capita Income in West Africa Basil Jones Pages 18-47 Volume 14 Issue 1 June 2002 African Development Review
Convergence is tested in ECOWAS countries between 1960 and 1990, although comparisons to other regions are made.
Convergence is occurring within ECOWAS both in terms of a comparison to rich nations and a look at income equality between the members. However, the speed at which poor countries are catching up to rich countries is slow. A convergence club is forming which ECOWAS represents, but it’s at the lower end of the convergence spectrum.
Two types of convergence are tested based on previous empirical research. β convergence is tested for to determine whether or not poor countries are growing faster than rich countries (a negative correlation between initial per capita income and growth in per capita income). σ convergence tests whether or not the dispersion between per capita income levels declines over time.
The homogenous nature of the countries can affect whether or not convergence occurs. The author explains the population of the country, its economies’ relative size, its natural resources, and its returns on capital all affect the speed of integration. An overview is given of different convergence theories, including the Solow Model and the convergence hypothesis.
Policy makers should look at whether or not real economic convergence is occurring. While the nominal convergence indicators can be justified, it is more difficult to rationalize them on an empirical basis.
53

*Regionalism in West Africa: Do Polar Countries Reap the Benefits? A Role for Migration Adama Konseiga Center for Development Research and IZA Bonn
* Growth and Convergence in WAEMU Countries Abdoul Aziz Wane IMF Working Paper *Views not representing IMF October 2004
Convergence and growth is measured in WAEMU countries between 1965 and 2002.
This study finds convergence occurring across the WAMEU both absolutely and conditionally. When country-specific variables are omitted, the economies tend to converge at 6 percent a year. The growth is even faster when countries have similar investment ratios. The difference between factor accumulation and TFP growth is also explored.
Panel data models are used in this empirical testing because of its advantages over pure cross sections or time-series data. The author explains how estimates are more difficult to establish with panel data, and uses mean group and pooled mean group estimates. The Solow model is also examined and the convergence in the WAEMU does not fit the traditional ‘catch-up’ prediction.
Different convergence groups are explained, including the idea of ‘club convergence’ where the initial conditions of countries are the same. The paper found that investment in human capital is an important determinant of per capita output growth
For countries like Cote d’Ivoire and Senegal, there should be less emphasis on macroeconomic adjustment, and other countries should focus on political stability and sound government spending.
Discussion Paper No. 1516 March 2005
Countries in West Africa are mentioned, specifically Cote D’Ivoire and Burkina Faso. All of the literature cited is recent, and the data covers different parts of the last 30 years.
Convergence is found within the Union and the convergence path benefits more than the polar counties. This paper also focuses on the migration of skilled labour both in and out of the Union and finds that migration out of the Union to France and other developed countries leads to a ‘brain gain,’ while internal migration to Cote d’Ivoire is not as beneficial (‘brain drain’).
A modified version of the Solow growth model is used along with panel data and educational information from each of the member countries. The model is used with and without migration data to see its affect on convergence. The author has taken great care to remove bias through the use of first differences, etc.
Convergence and economic growth are affected by migration of the workforce, and a good background on migration theory is presented. In this background literature it is found that human mobility unambiguously speeds up convergence of product levels. A lot depends on which countries have the educated work force and where it migrates too, as the location greatly affects the benefits.
Poor countries losing parts of their workforce should develop irrigation and agricultural investments that will optimize their rural labour force. Of course, education is important for these countries because most of the brain drain is occurring at the secondary schooling level.
54

African Convergence Clubs: The Effects of Colonialism and Trade Dan Ben-David and Michael W Brandl University of Texas Graduate School for Business July 1996
Africa countries are analyzed in terms of regional blocks, colonial ties, and trading partnerships. Most of the research on convergence is between 1960 and 1988.
There is evidence of convergence among states on some levels. When looking at regions, the authors found statistically significant convergence in pooled results in West Africa and East/Central Africa. There was no significant convergence between countries who shared the same colonial dictator, but countries that open up their trading to multiple partners see more convergence than countries who stick to past colonial powers.
The paper tests convergence using the traditional neoclassical model and time series data. A lot of the regression results do not appear to be statistically significant, although there are enough results to reach general conclusions. All of the hypothesis testing is found in the back tables.
The focus of this paper is the effects of trade on convergence. The author argues there are ‘convergence clubs’ on different levels across Africa. Much emphasis is placed on the history of each region and how that has developed into these convergence clubs of today.
The authors argue that former colonial rulers need to loosen their ties to former states because trading exclusively with these countries makes them too dependent and does not allow for convergence.
Testing Real Convergence in the ECOWAS countries in Presence of Heterogeneous Long-Run Growths: A Panel Data Study Gilles Dufrénot and Gilles Sanon Centre for Research in Economic Development and International Trade, University of Nottingham October 2005
ECOWAS countries are analyzed from 1985-2003 for convergence emphasizing differences between countries.
No real convergence is found among the members, and there is even divergence. The model shows that countries have both short and long term structural heterogeneity, and thus follow their long-run growth paths. This is different from previous studies that assume a homogenous long-run growth path.
Panel data techniques are used in an error correction model that takes into account the latent heterogeneities across countries. Results are compared using the mean group estimator and results obtained with slope heterogeneity only in the long-run.
Niger, Nigeria, and Togo are said to lag behind because of the ‘poverty trap’ issue. Everything from membership in an economic and monetary union to peer pressure and regional surveillance can make countries more homogenous in the short-term, but they are one different growth paths because of different economic structures, aid spending, etc.
The author says the only way to eliminate structural heterogeneity is through a coordination of policies, which is already on the agenda for WAEMU and ECOWAS countries and their conditions for nominal convergence.
55

Appendix G Summary of Africa Specific Research- Convergence/Divergence Continued
Study Regions covered, time period
Evidence on convergence or divergence in regions
Method used to establish this
Factors affecting convergence and divergence in regions
Policy options / suggestions
Is Long-Run Output Convergence Associated with International Cooperation? Some new evidence for selected African countries Mark J. Holmes Waikato University Journal of Economic Development Volume 30, Pg. 67-86, Number 2, December 2005
CFA, SACU, and ECOWAS countries are tested for long run per capita income convergence between 1960 and 2000.
There is strong long-run convergence in both CFA and SACU, with the latter having most convergence. However, there was no evidence of long-run convergence in ECOWAS. It appears that monetary unions did better than trade agreements in convergence. There are also different levels of convergence within the groupings; for example, countries that were originally stationary in the CFA did not experience strong convergence.
This test is based on whether the first largest principal component, based on benchmark deviations from base country output, is stationary or not. The author claims that unit root testing of the first LPC based on income differentials offers a number of advantages over existing tests of convergence because the choice of base country is not as important (where it is using panel data).
The size of the group does not appear to greatly affect convergence; larger groups did just as well as smaller groups. It is important to know whether or not a country was initially stationary, as this affects how great the convergence is. The paper focuses more on the model than on factors surrounding his results.
The groupings that exhibited little or no evidence of convergence may require additional regional development policies aimed at facilitating closer integration among member states. Researchers should also reflect on why some regional agreements are better at producing convergence than others.
The Road to Regional Integration in Africa: Macroeconomic Convergence and Performance in COMESA Fabrizio Carmignani United Nations Economic Commission for Europe Volume 15,
Covers more than a dozen countries that fall within COMESA, an economic agreement attempting a common currency by 2025. Data is from the last 10-20 years (1980-2002).
Generally speaking, there is no evidence of significant convergence in the COMESA countries. In fact, substantial divergence and heterogeneity still exist. There appears to be a group of countries converging near the bottom of the income measurement, making the overall disparity larger. Despite this, there is evidence that business cycles are synchronizing in some member states.
Testing models are based on past literature and include both time-series and panel data. The income convergence is tested to determine the existence of a σ convergence.
There are indications that monetary policy stances are integrating, which should make convergence more likely in the future. The author states that harmonization policy, different institutions, and trading rules all affect convergence among the countries. There is a need to ‘break up’ countries at the bottom of the spectrum.
The author lists four major policy suggestions based on the research. 1) Design effective mechanisms for monitoring and enforcement. 2) Realize a preferred trading area with the elimination of certain barriers. 3) Creation of efficient communitarian institutions, including
56

Number 2, Pages 212-250 Journal of African Economies
a regional system of central banks. 4) Full considering of institutional and economic factors.
Ten Years After the CFA Franc Devaluation: Progress Toward Integration in the WAEMU Pierre van den Boogaerde and Charalambos Tsangarides African Department- IMF Working Paper July 2005
WAEMU countries are investigated in three different sub-periods after the devaluation of the CFA franc to test for convergence and integration. The first period is from 1990 to 1993, the second from 94-98, and the third is from 99-03.
Convergence tests for a number of different indicators show limited convergence across WAEMU countries. Neither the sources of GDP growth nor the uses indicate progress toward convergence. The ‘gravitational pull’ from WAEMU to poorer countries was absent during the periods. In addition, fiscal convergence is also limited, even though the homogeneity of countries’ tax revenues and expenditures have improved.
A wide variety of testing methods are used here, testing for σ convergence, β convergence, and some measure of rank concordance (y convergence). Other ‘co integrating relationships’ among variables are also analyzed.
For the financial variables, a highly divergent evolution in the level of investment outlays and in debt service costs has explained the lack of convergence. The difference between country-specific and regional policies also affects who sees the benefits from the agreements. The decrease in labour mobility has also hindered economic growth and convergence.
The author states that reversing the lack of convergence will be difficult, and the nations in the union will need a significantly stronger political drive to overcome the narrowness of their economies and lessen structural rigidities.
The Economic Effects of Integration in the Central African Economic and Monetary Community: Some General Equilibrium Estimates for Cameroon Ferdinand Bakoup
An analysis of Cameroon before and after the formation of CEMAC, and whether or not they benefit from the partnership/other countries benefit.
Convergence is not specifically tested, but there is evidence that Cameroon has regional market power within the economic group. Because of CEMAC, the author estimates that Cameroon will gain between .41 and .62% of GDP. Improved Access to partner markets and a reduction of the external tariff account for most of the gain.
Three aspects of CEMAC agreements are analyzed, including improved access to CEMAC markets, preferential tariff reduction and reduction of external tariffs through implementation of the common external tariff of CEMAC. Estimates are done with a comparative statistics model, although estimated gains from free trade will be larger in a
Further preferential tariff reduction by Cameroon will have a negligible quantitative impact. The author also finds that Cameroon would gain even more from free trade if it implemented a unilateral trade agreement instead of CEMAC because of regional market power.
The policy implications are not described, but it appears the importance of Cameroon to the CEMAC must be taken into account when deciding on further agreements; otherwise, they may decide to go it alone.
57

and David Tarr Volume 12 Issue 2 Pages 161-290 December 2000 African Development Group
dynamic model with endogenous growth. The quantitative analysis incorporates the welfare changes of all goods.
Banking Sector Integration and Competition in CEMAC Samar Saab and Jerome Vacher IMF Working Paper January 1st 2007
Retail banking integration in the CEMAC is considered in this paper and whether or not convergence is occurring there. Data are from 2000 to 2004/5.
There is some evidence of price convergence in average interest rate spreads. However, the empirical evidence is not supposed by an increase of cross-border flows in retails loans and deposits. Price convergence may merely reflect excess liquidity in the region. Bank competition in CEMAC is limited, which limits further integration.
Various methods allow a quantitative assessment of the degree of financial integration and are based on interest rate data, bank structure data, mergers and acquisitions data, and bank concentration data. σ convergence is tested for in the interest rate spreads.
A number of factors could affect convergence in the financial markets. 1) Increase in bank deposits because of settlement of government arrears. 2) A scarcity of investment opportunities has lead to high liquidity. 3) Limited lending opportunities exist.
Price convergence implies that price differentials for the same financial service should be reduced, down to a level explained mostly by the existence of arbitrage or transportation costs.
Is the Proposed East African Monetary Union an Optimal Currency Area? A Structural Vector Auto regression Analysis Steven Buigut and Neven Valev Andrew Young School of Policy Studies- Working Paper 04-07 September 2004
Factors to measure economic integration are analyzed for countries in the EAC from 1970 to 2001. Countries are specifically mentioned when it comes to discussing economic shocks and whether they are uniform between countries.
Convergence is not directly measured, but factors leading to convergence are analyzed. The paper concludes that forming a currency union would be the wrong decision right now, although increased integration is a positive step in the process. While the variability of real output after supply shocks is low among countries, there is high variation when there is a demand shock. In general, shocks are mostly asymmetric.
The paper uses a two variable VAR model to identify supply and demand shocks for East African countries.
Here, the main factor to explain convergence is the countries’ reaction to different shocks on the market. Only the contemporaneous supply shocks for Kenya and Burundi are positively and significantly correlated. The author does mention that symmetry of shocks though important is only one aspect forming a monetary union.
Further integration is suggested in order to reach a monetary union. More research must be conducted to estimate the welfare effects of a union that includes a multi-country theoretical framework with some of the region’s key economic and political features.
58

An Analysis of Macro-Economic Convergence in SADC Jannie Rossouw University of Pretoria/ SA Reserve Bank September 2006
Countries in SADC are analyzed to determine whether or not a monetary union can exist if all of the macro-convergence criteria are not met. The author compares the current situation to that of the EU.
It appears that SADC countries have mixed results in meeting their goals for a monetary union, which must be met by 2008. Some countries achieved their goals in 2004 and have maintained this progress, while others have not been as successful. The author argues that meeting these criteria are not vital to establishing the union, and cites the EU as an example.
Simple data on inflation rates and GDP are presented and compared to the required benchmarks.
The author argues that macro-economic convergence goals have to be viewed properly in order for true convergence to occur. Instead of thinking of them as a condition to enter an agreement, they should be viewed as a constant goal, even in the EU.
A monetary union is still possible in SADC even if all the countries do not need their goals.
59