regional overview: latin america and the caribbean · pdf file... and particularly in central...
TRANSCRIPT

Persistent inequalities hinderprogress towards EFA
Early childhood care and education
The path towards EFA starts long before primary school.
Adequate nutrition, good health and an emotionally secure,
language-rich home environment during the earliest years
are vital for later success in education and life. Rapid progress
towards UPE cannot be sustained while progress in tackling
child health problems remains slow. High levels of child
mortality and malnutrition – a formidable development
challenge in their own right – are also symptomatic of wider
problems directly affecting education.
Indicators of child well-being are much better for
Latin America and the Caribbean than for other developing
regions, although strong disparities exist between and
within countries.
Estimates for 2005–2010 put the under-5 mortality rate
at 27‰, a third of the developing-country average (81‰).
If the decline observed between 1990 and 2006 continues,
the region will meet the Millennium Development Goal
pertaining to child mortality. Cuba and Chile have already
reduced under-5 mortality to levels similar to those
observed in developed countries. Other countries are
lagging behind, including Bolivia (61‰), Haiti (72‰)
and other Caribbean countries. Child mortality
disproportionately affects the poor. For instance, in Bolivia
and Nicaragua, child death rates are twice as high among
the poorest 20% of households as they are among the
wealthiest 20%.
Undernutrition is relatively infrequent in the region.
Among children under 5, 7% are underweight, 2% suffer
from wasting and 16% from stunting. However, under-
nutrition remains an issue in several countries. In Bolivia,
Ecuador, Haiti, Honduras and Peru, the rate of moderate
and severe stunting is well above 20%, and in Guatemala
it is 49%. Early stunting is associated with deficits in
literacy, numeracy and educational attainment at age 18.
Latin America and the Caribbean1 stands ahead of other developing regions in Education for All. Most countries in the region have achieveduniversal primary education (UPE) and arewitnessing a rapid expansion of both pre-primaryeducation, and secondary and tertiary education.However, learning achievement levels remain low by international standards. Moreover, whilethere is little evidence of gender disparities atprimary level, massive underparticipation of boysexists in secondary and tertiary education.
The EFA Global Monitoring Report 2009 findsthat disparities based on wealth, location, genderand disability deny millions of children a good-quality education. Focusing on those being leftbehind, the Report explores current approachesto education governance reform. It finds that, all too often, these approaches fail the poor and disadvantaged.
Regionaloverview:Latin Americaand theCaribbean
1. This is according to the EFA classification. See Table 3 for countries in the region.
lac_eng_2009_bat 02 5/12/08 11:49 Page 1

2 L A T I N A M E R I C A A N D T H E C A R I B B E A NR E G I O N A L O V E R V I E W
In Latin America and the Caribbean, care programmes
for children below age 3 exist in most countries.
Day care centres are widely used to deliver nutritional
support to vulnerable households. In addition several
governments have expanded social protection programmes
with early childhood components. Sometimes these provide
conditional cash transfers: eligible households receive
payments if they meet conditions such as presenting their
children for growth monitoring and vaccinations, and
assuring their attendance in school. The largest such
programme, Oportunidades in Mexico, had a budget of
US$3.7 billion in 2007 and reached 5 million families. Other
social protection programmes provide unconditional cash
transfers. An example is Ecuador’s Bono de Desarrollo
Humano, which provides cash transfers to women in
difficult circumstances.
Research points to high returns on investment in
good-quality early childhood care and education (ECCE).
Evaluations of the Bono de Desarrollo Humano programme
have identified a range of positive effects on fine motor
control, long-term memory and physical well-being.
Children of participants in the poorest quartile measure
25% higher in cognitive outcomes than the average for
a control group. For the poorest half of these families,
the transfer – amounting to US$15 per month – increases
school enrolment from 75% to 85% and reduces child
labour by seventeen percentage points. These benefits
have long-term cumulative effects, as they facilitate
further school participation and learning.
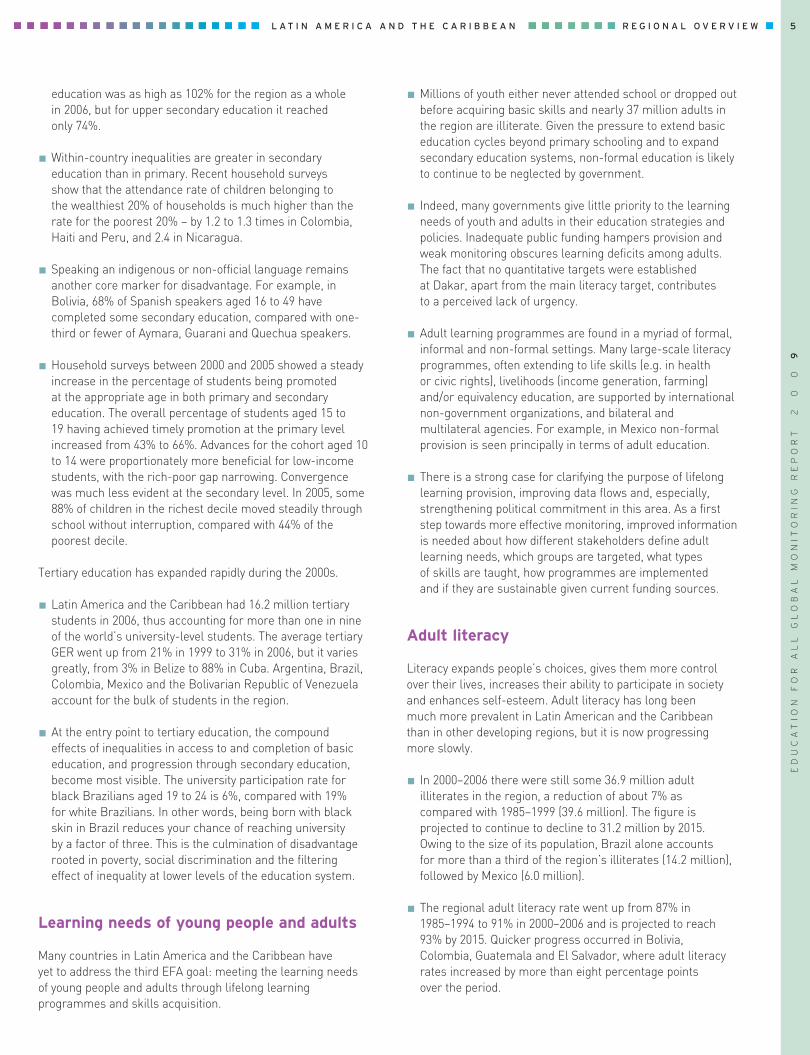
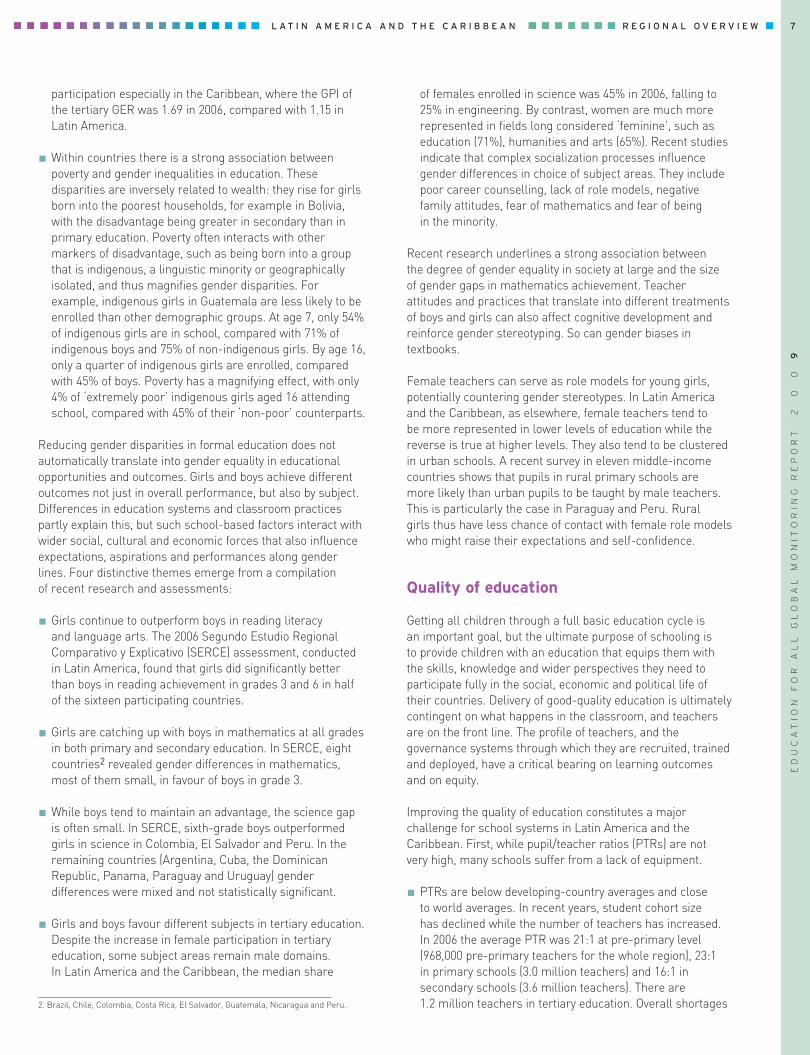
Pre-primary education has developed rapidly over
the past decade (Figure 1).
Between 1999 and 2006, the number of children enrolled
in pre-primary schools increased from 16.4 million
to 20.3 million; the gross enrolment ratio (GER)
correspondingly rose from 56% to 65%. The ratio increased
by more than twenty-five percentage points in Ecuador,
Mexico, Panama, and Trinidad and Tobago.
Pre-primary school participation is now nearly universal
in Mexico, Cuba and several Caribbean island states,
but remains underdeveloped in Bolivia, Chile and Colombia
(GER below 60%), and particularly in Central America
(Guatemala 29%, Honduras 38%), as well as in Belize (34%),
the Dominican Republic (32%) and Paraguay (34%).
Provision of pre-primary education can be constrained
by insufficient resources in low-income countries, but
government commitment, or a lack thereof, plays a major
part. In 2006, despite being having much lower per capita
income, Bolivia had a higher pre-school GER than Colombia
(50% vs 40%). Within countries, vulnerable children from
poor households are the least likely to have access to
early childhood programmes, yet international evidence
indicates that they would benefit most from them. In Brazil,
the average enrolment rate in pre-school is 29% among
children belonging to the poorest 20% of households, but
above 50% for the wealthiest 20%, whose children also
attend better-resourced, often private facilities.
Research has shown that participating in ECCE helps
equip children with cognitive, behavioural and social skills
that improve access, retention and learning outcomes in
primary education. In Argentina, pre-school attendance
from ages 3 to 5 was found to increase grade 3 performance
in language and mathematics (by 0.23 to 0.33 standard
deviation). The effect was twice as large for students from
poorer backgrounds. In Uruguay, pre-school attendance
was found to have a positive effect on completed years of
schooling, repetition rates and age-grade distortion. By age
10, children who had attended pre-school had an advantage
of about a third of a year over other children. By age 16 they
had accumulated 1.1 additional years of schooling
and were 27% more likely to have remained in school.
ED
UC
AT
IO
N
FO
R
AL
L
GL
OB
AL
M
ON
IT
OR
IN
G
RE
PO
RT
02
09
GuatemalaDominican Rep.
ParaguayHondurasColombia
BoliviaEl SalvadorNicaragua
ChileVenezuela, B.R.
ArgentinaPanama
PeruBrazil
Costa RicaUruguayEcuadorMexico
Cuba
BelizeSaint Lucia
DominicaGrenada
SurinameTrinidad/Tobago
St Vincent/Grenad.Montserrat
JamaicaBr. Virgin Is
BarbadosAruba
St Kitts/NevisGuyana
AnguillaTurks/Caicos Is
Latin America
Caribbean
0 25 50 75 100 125
Gross enrolment ratios (%)
1999
2006 (decrease since 1999)
2006 (increase since 1999) Stable
Figure 1: Changes in pre-primary education gross enrolment ratios
between 1999 and 2006
lac_eng_2009_bat 02 5/12/08 11:49 Page 2
ED-2008/W S/63

3R E G I O N A L O V E R V I E WL A T I N A M E R I C A A N D T H E C A R I B B E A N
Universal primary education
Free education is legally guaranteed in most countries
(major exceptions being Colombia, Haiti and Jamaica) and
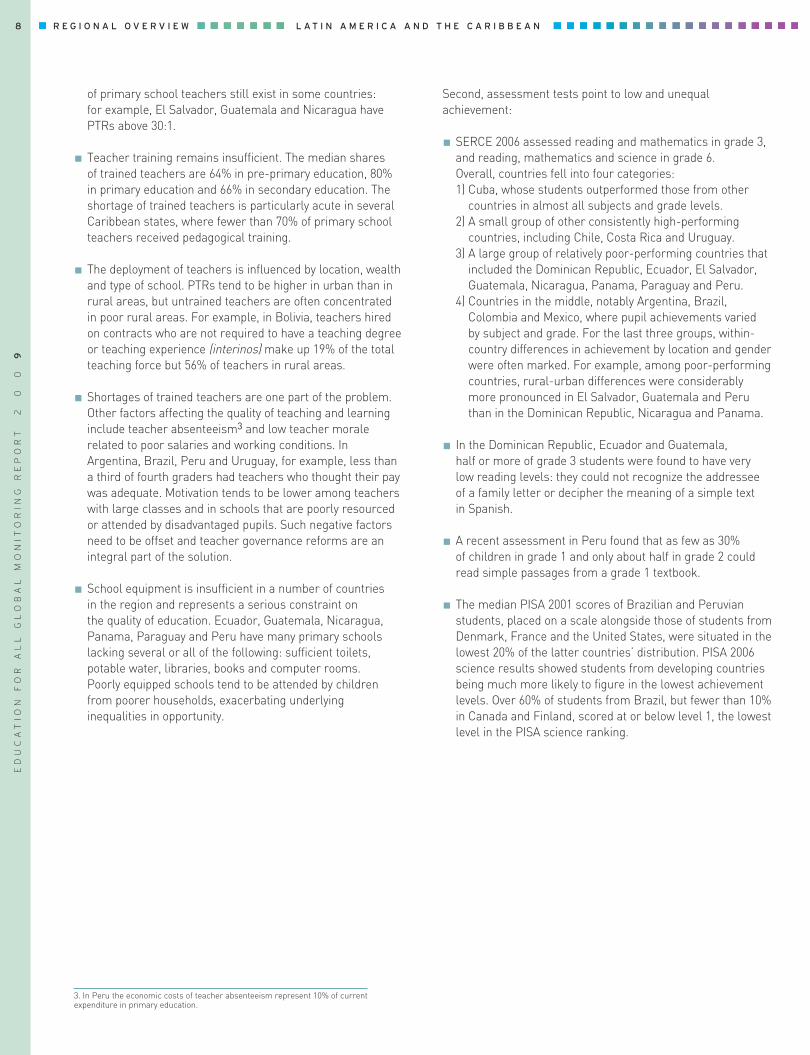
the region as a whole is close to achieving UPE.
Some 68.6 million children were enrolled in primary
education in 2006; the GER was 118%. The net enrolment
ratio (NER) was 94%, well above the developing country
average (85%) (Figure 2). Two countries with lower
enrolment ratios in 1999, Guatemala and Nicaragua, had
caught up with the rest of the region by 2006 with GERs
that had increased by more than twelve percentage points.
The situation in the Caribbean is more problematic: in
Dominica and the Dominican Republic enrolment ratios
have significantly declined since Dakar.
With 2.6 million children of primary school-going age
not enrolled in 2006, Latin America and the Caribbean
accounted for 3.5% of the world’s out-of-school children.
Brazil, the only country with more than 500,000 out-of-
school children in 2006, is nonetheless on track to achieve
UPE by 2015. There is evidence that a majority of the
region’s out-of-school children (57%) will enrol late; 21%
drop out early and the same percentage is unlikely to enrol
without specific incentives. This suggests that tackling
the out-of-school problem requires policy responses that
address particular structures of disadvantage.
School life expectancy is higher than the developing
country average and has increased by a year since 1999
to thirteen years for males and fourteen for females.
However, it is unevenly distributed, both between countries
(from ten years in Guatemala to between thirteen and
fifteen years in large countries such as Argentina, Brazil
and Mexico, with a high of seventeen in the British Virgin
Islands) and within countries: in 1999, 17- to 22-year-olds
belonging to the poorest 20% of households in Guatemala
had received only 1.9 years of education on average, as
opposed to 8.3 years for those belonging to the richest
20% of households. Corresponding figures were 2.5 and
9.2 years in Nicaragua in 2001, and 6.5 and 11.1 years
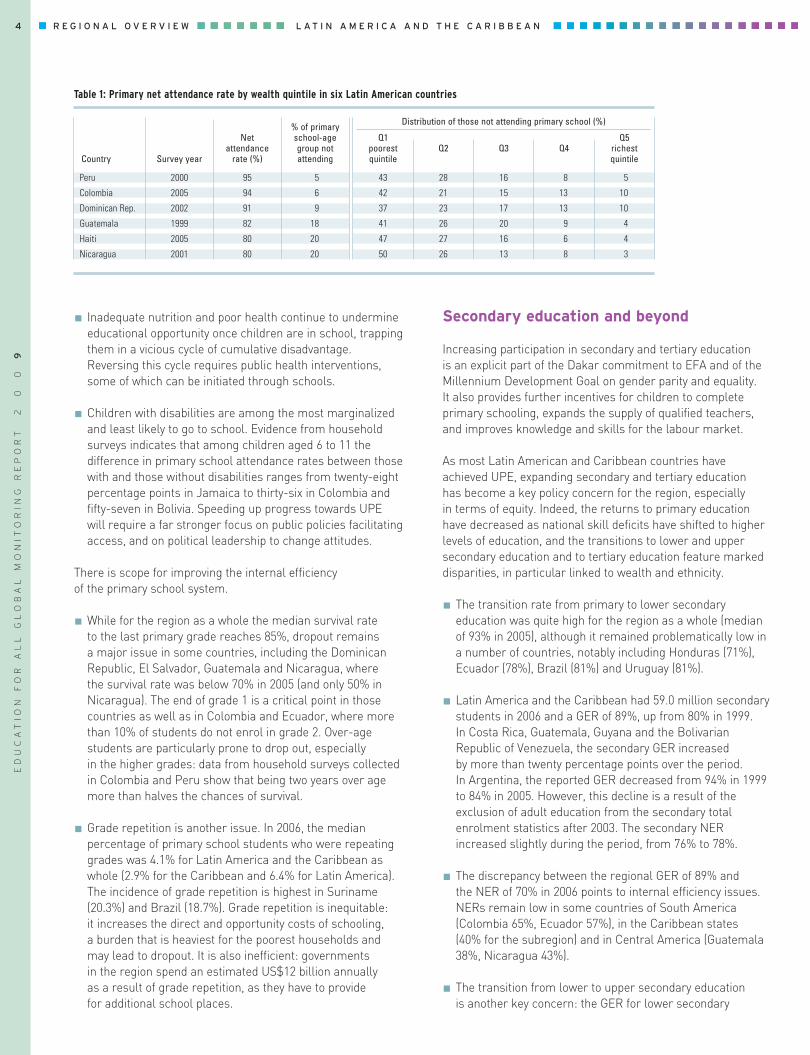
in Peru in 2000. Inequalities in attendance at the primary
school level contribute to those disparities (Table 1).
Income-based disparities interact with wider inequalities
and markers for disadvantage related to gender, location,
language and other factors. For example, rural children
are less likely to attend school and more likely to drop out
than their urban counterparts. Living in slums also
carries a marked handicap in terms of school attendance.
In Guatemala, attendance rates for children in slums
were lower even than average rates in rural areas.
Cultural factors such as religion and ethnicity can affect
both the demand for schooling and the supply. There are
large differences in school attendance and completion
among linguistic groups in some countries in Central
America. Overall, reaching UPE will require policies
targeting the poor and marginalized. This means
targeting hard-to-reach households in remote rural
areas and slums that face multiple disadvantages,
including chronic poverty, high mortality, and poor health
and nutrition.
Child labour, ill health and disability are barriers to UPE.
Among developing regions, Latin America and the
Caribbean has witnessed the most rapid decli+ne in the
incidence of child labour since 2000. However, household
survey data show that in countries including Honduras,
Mexico, Nicaragua and Panama, working children face
an attendance disadvantage of at least 30%. Practical
measures are needed to reduce the pressures that force
poor households to augment their income or labour supply
through child work as well as to strengthen incentives
for sending children to school.
ED
UC
AT
IO
N
FO
R
AL
L
GL
OB
AL
M
ON
IT
OR
IN
G
RE
PO
RT
02
09
Dominican Rep.Colombia
NicaraguaVenezuela, B.R.
El SalvadorParaguay
BrazilGuatemala
BoliviaPeru
HondurasCuba
EcuadorMexicoPanama
ArgentinaUruguay
St Kitts/NevisDominica
Turks/Caicos IsGrenada
Trinidad/TobagoBahamasJamaica
St Vincent/Grenad.Anguilla
BermudaBr. Virgin Is
BarbadosSuriname
BelizeSaint LuciaMontserrat
Aruba
Latin America
Caribbean
70 80 90 100
Net enrolment ratios (%)
1999
2006 (decrease since 1999)
2006 (increase since 1999) Stable
Figure 2: Changes in primary education net enrolment ratios
between 1999 and 2006
lac_eng_2009_bat 02 5/12/08 11:49 Page 3
4 L A T I N A M E R I C A A N D T H E C A R I B B E A NR E G I O N A L O V E R V I E W
Inadequate nutrition and poor health continue to undermine
educational opportunity once children are in school, trapping
them in a vicious cycle of cumulative disadvantage.
Reversing this cycle requires public health interventions,
some of which can be initiated through schools.
Children with disabilities are among the most marginalized
and least likely to go to school. Evidence from household
surveys indicates that among children aged 6 to 11 the
difference in primary school attendance rates between those
with and those without disabilities ranges from twenty-eight
percentage points in Jamaica to thirty-six in Colombia and
fifty-seven in Bolivia. Speeding up progress towards UPE
will require a far stronger focus on public policies facilitating
access, and on political leadership to change attitudes.
There is scope for improving the internal efficiency
of the primary school system.
While for the region as a whole the median survival rate
to the last primary grade reaches 85%, dropout remains
a major issue in some countries, including the Dominican
Republic, El Salvador, Guatemala and Nicaragua, where
the survival rate was below 70% in 2005 (and only 50% in
Nicaragua). The end of grade 1 is a critical point in those
countries as well as in Colombia and Ecuador, where more
than 10% of students do not enrol in grade 2. Over-age
students are particularly prone to drop out, especially
in the higher grades: data from household surveys collected
in Colombia and Peru show that being two years over age
more than halves the chances of survival.
Grade repetition is another issue. In 2006, the median
percentage of primary school students who were repeating
grades was 4.1% for Latin America and the Caribbean as
whole (2.9% for the Caribbean and 6.4% for Latin America).
The incidence of grade repetition is highest in Suriname
(20.3%) and Brazil (18.7%). Grade repetition is inequitable:
it increases the direct and opportunity costs of schooling,
a burden that is heaviest for the poorest households and
may lead to dropout. It is also inefficient: governments
in the region spend an estimated US$12 billion annually
as a result of grade repetition, as they have to provide
for additional school places.
Secondary education and beyond
Increasing participation in secondary and tertiary education
is an explicit part of the Dakar commitment to EFA and of the
Millennium Development Goal on gender parity and equality.
It also provides further incentives for children to complete
primary schooling, expands the supply of qualified teachers,
and improves knowledge and skills for the labour market.
As most Latin American and Caribbean countries have
achieved UPE, expanding secondary and tertiary education
has become a key policy concern for the region, especially
in terms of equity. Indeed, the returns to primary education
have decreased as national skill deficits have shifted to higher
levels of education, and the transitions to lower and upper
secondary education and to tertiary education feature marked
disparities, in particular linked to wealth and ethnicity.
The transition rate from primary to lower secondary
education was quite high for the region as a whole (median
of 93% in 2005), although it remained problematically low in
a number of countries, notably including Honduras (71%),
Ecuador (78%), Brazil (81%) and Uruguay (81%).
Latin America and the Caribbean had 59.0 million secondary
students in 2006 and a GER of 89%, up from 80% in 1999.
In Costa Rica, Guatemala, Guyana and the Bolivarian
Republic of Venezuela, the secondary GER increased
by more than twenty percentage points over the period.
In Argentina, the reported GER decreased from 94% in 1999
to 84% in 2005. However, this decline is a result of the
exclusion of adult education from the secondary total
enrolment statistics after 2003. The secondary NER
increased slightly during the period, from 76% to 78%.
The discrepancy between the regional GER of 89% and
the NER of 70% in 2006 points to internal efficiency issues.
NERs remain low in some countries of South America
(Colombia 65%, Ecuador 57%), in the Caribbean states
(40% for the subregion) and in Central America (Guatemala
38%, Nicaragua 43%).
The transition from lower to upper secondary education
is another key concern: the GER for lower secondary
ED
UC
AT
IO
N
FO
R
AL
L
GL
OB
AL
M
ON
IT
OR
IN
G
RE
PO
RT
02
09
2000 95 5 43 28 16 8 5
2005 94 6 42 21 15 13 10
2002 91 9 37 23 17 13 10
1999 82 18 41 26 20 9 4
2005 80 20 47 27 16 6 4
2001 80 20 50 26 13 8 3
Peru
Colombia
Dominican Rep.
Guatemala
Haiti
Nicaragua
Table 1: Primary net attendance rate by wealth quintile in six Latin American countries
Survey yearCountry
Net attendance
rate (%)
% of primaryschool-agegroup notattending
Q1 poorestquintile
Q2 Q3 Q4Q5
richestquintile
Distribution of those not attending primary school (%)
lac_eng_2009_bat 02 5/12/08 11:49 Page 4
5R E G I O N A L O V E R V I E WL A T I N A M E R I C A A N D T H E C A R I B B E A N
education was as high as 102% for the region as a whole
in 2006, but for upper secondary education it reached
only 74%.
Within-country inequalities are greater in secondary
education than in primary. Recent household surveys
show that the attendance rate of children belonging to
the wealthiest 20% of households is much higher than the
rate for the poorest 20% – by 1.2 to 1.3 times in Colombia,
Haiti and Peru, and 2.4 in Nicaragua.
Speaking an indigenous or non-official language remains
another core marker for disadvantage. For example, in
Bolivia, 68% of Spanish speakers aged 16 to 49 have
completed some secondary education, compared with one-
third or fewer of Aymara, Guarani and Quechua speakers.
Household surveys between 2000 and 2005 showed a steady
increase in the percentage of students being promoted
at the appropriate age in both primary and secondary
education. The overall percentage of students aged 15 to
19 having achieved timely promotion at the primary level
increased from 43% to 66%. Advances for the cohort aged 10
to 14 were proportionately more beneficial for low-income
students, with the rich-poor gap narrowing. Convergence
was much less evident at the secondary level. In 2005, some
88% of children in the richest decile moved steadily through
school without interruption, compared with 44% of the
poorest decile.
Tertiary education has expanded rapidly during the 2000s.
Latin America and the Caribbean had 16.2 million tertiary
students in 2006, thus accounting for more than one in nine
of the world’s university-level students. The average tertiary
GER went up from 21% in 1999 to 31% in 2006, but it varies
greatly, from 3% in Belize to 88% in Cuba. Argentina, Brazil,
Colombia, Mexico and the Bolivarian Republic of Venezuela
account for the bulk of students in the region.
At the entry point to tertiary education, the compound
effects of inequalities in access to and completion of basic
education, and progression through secondary education,
become most visible. The university participation rate for
black Brazilians aged 19 to 24 is 6%, compared with 19%
for white Brazilians. In other words, being born with black
skin in Brazil reduces your chance of reaching university
by a factor of three. This is the culmination of disadvantage
rooted in poverty, social discrimination and the filtering
effect of inequality at lower levels of the education system.
Learning needs of young people and adults
Many countries in Latin America and the Caribbean have
yet to address the third EFA goal: meeting the learning needs
of young people and adults through lifelong learning
programmes and skills acquisition.
Millions of youth either never attended school or dropped out
before acquiring basic skills and nearly 37 million adults in
the region are illiterate. Given the pressure to extend basic
education cycles beyond primary schooling and to expand
secondary education systems, non-formal education is likely
to continue to be neglected by government.
Indeed, many governments give little priority to the learning
needs of youth and adults in their education strategies and
policies. Inadequate public funding hampers provision and
weak monitoring obscures learning deficits among adults.
The fact that no quantitative targets were established
at Dakar, apart from the main literacy target, contributes
to a perceived lack of urgency.
Adult learning programmes are found in a myriad of formal,
informal and non-formal settings. Many large-scale literacy
programmes, often extending to life skills (e.g. in health
or civic rights), livelihoods (income generation, farming)
and/or equivalency education, are supported by international
non-government organizations, and bilateral and
multilateral agencies. For example, in Mexico non-formal
provision is seen principally in terms of adult education.
There is a strong case for clarifying the purpose of lifelong
learning provision, improving data flows and, especially,
strengthening political commitment in this area. As a first
step towards more effective monitoring, improved information
is needed about how different stakeholders define adult
learning needs, which groups are targeted, what types
of skills are taught, how programmes are implemented
and if they are sustainable given current funding sources.
Adult literacy
Literacy expands people’s choices, gives them more control
over their lives, increases their ability to participate in society
and enhances self-esteem. Adult literacy has long been
much more prevalent in Latin American and the Caribbean
than in other developing regions, but it is now progressing
more slowly.
In 2000–2006 there were still some 36.9 million adult
illiterates in the region, a reduction of about 7% as
compared with 1985–1999 (39.6 million). The figure is
projected to continue to decline to 31.2 million by 2015.
Owing to the size of its population, Brazil alone accounts
for more than a third of the region’s illiterates (14.2 million),
followed by Mexico (6.0 million).
The regional adult literacy rate went up from 87% in
1985–1994 to 91% in 2000–2006 and is projected to reach
93% by 2015. Quicker progress occurred in Bolivia,
Colombia, Guatemala and El Salvador, where adult literacy
rates increased by more than eight percentage points
over the period.
ED
UC
AT
IO
N
FO
R
AL
L
GL
OB
AL
M
ON
IT
OR
IN
G
RE
PO
RT
02
09
lac_eng_2009_bat 02 5/12/08 11:49 Page 5
6 L A T I N A M E R I C A A N D T H E C A R I B B E A NR E G I O N A L O V E R V I E W
While universal adult literacy has been achieved in
countries including Argentina, Cuba and Uruguay, adult
literacy rates remain low (below 90%) in several Central
American countries (as low as 72% in Guatemala). The
situation in the Caribbean is especially difficult: the adult
literacy rate was 74% and the number of adult illiterates
was 2.8 million in 2000–2006, with projections showing
it as unlikely to decline by 2015.
The near achievement of UPE implies that youth literacy
is spreading very quickly. The youth literacy rate is 97%,
and the number of youth illiterates should decline from
its present level of 3.3 million to 2.2 million by 2015.
With such exceptions as Guatemala, where 61% of
1.9 million adult illiterates are women, the gender gap in
literacy is moderate in Latin America and the Caribbean
(women represent 55% of all adult illiterates).
In addition to gender, disparities in adult literacy revolve
around other markers of disadvantage: poverty, place
of residence, ethnicity, language and age. The national
literacy rate in Ecuador, for example, was 91% in 2001
but that of indigenous groups was 72%. Achieving the EFA
adult literacy goal implies paying sustained attention
to inequalities. It also means developing the literate
environment – promoting the availability and use of
multilingual written materials and new technology, which
encourage literacy acquisition, a reading culture, improved
literacy retention and access to information.
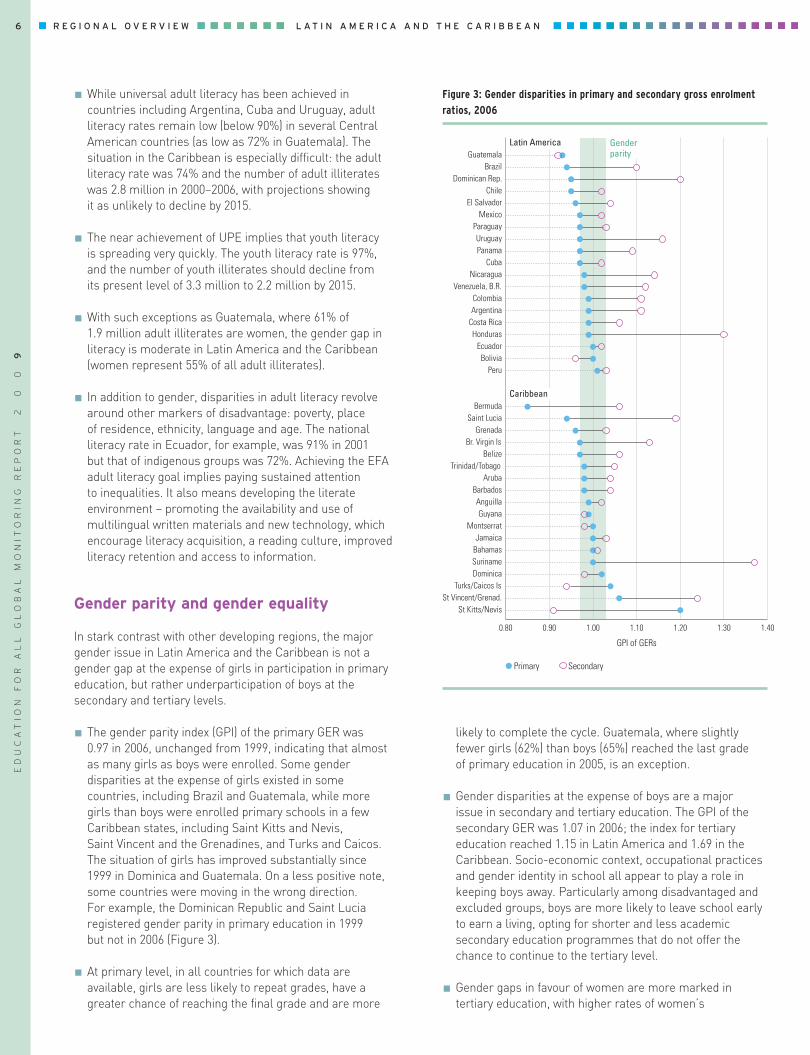
Gender parity and gender equality
In stark contrast with other developing regions, the major
gender issue in Latin America and the Caribbean is not a
gender gap at the expense of girls in participation in primary
education, but rather underparticipation of boys at the
secondary and tertiary levels.
The gender parity index (GPI) of the primary GER was
0.97 in 2006, unchanged from 1999, indicating that almost
as many girls as boys were enrolled. Some gender
disparities at the expense of girls existed in some
countries, including Brazil and Guatemala, while more
girls than boys were enrolled primary schools in a few
Caribbean states, including Saint Kitts and Nevis,
Saint Vincent and the Grenadines, and Turks and Caicos.
The situation of girls has improved substantially since
1999 in Dominica and Guatemala. On a less positive note,
some countries were moving in the wrong direction.
For example, the Dominican Republic and Saint Lucia
registered gender parity in primary education in 1999
but not in 2006 (Figure 3).
At primary level, in all countries for which data are
available, girls are less likely to repeat grades, have a
greater chance of reaching the final grade and are more
likely to complete the cycle. Guatemala, where slightly
fewer girls (62%) than boys (65%) reached the last grade
of primary education in 2005, is an exception.
Gender disparities at the expense of boys are a major
issue in secondary and tertiary education. The GPI of the
secondary GER was 1.07 in 2006; the index for tertiary
education reached 1.15 in Latin America and 1.69 in the
Caribbean. Socio-economic context, occupational practices
and gender identity in school all appear to play a role in
keeping boys away. Particularly among disadvantaged and
excluded groups, boys are more likely to leave school early
to earn a living, opting for shorter and less academic
secondary education programmes that do not offer the
chance to continue to the tertiary level.
Gender gaps in favour of women are more marked in
tertiary education, with higher rates of women’s
ED
UC
AT
IO
N
FO
R
AL
L
GL
OB
AL
M
ON
IT
OR
IN
G
RE
PO
RT
02
09
GuatemalaBrazil
Dominican Rep.Chile
El SalvadorMexico
ParaguayUruguayPanama
CubaNicaragua
Venezuela, B.R.ColombiaArgentina
Costa RicaHonduras
EcuadorBolivia
Peru
BermudaSaint Lucia
GrenadaBr. Virgin Is
BelizeTrinidad/Tobago
ArubaBarbadosAnguillaGuyana
MontserratJamaica
BahamasSurinameDominica
Turks/Caicos IsSt Vincent/Grenad.
St Kitts/Nevis
Latin America
Caribbean
0.80 0.90 1.00 1.201.10 1.30 1.40
GPI of GERs
SecondaryPrimary
Gender parity
Figure 3: Gender disparities in primary and secondary gross enrolment
ratios, 2006
lac_eng_2009_bat 02 5/12/08 11:49 Page 6
7R E G I O N A L O V E R V I E WL A T I N A M E R I C A A N D T H E C A R I B B E A N
participation especially in the Caribbean, where the GPI of
the tertiary GER was 1.69 in 2006, compared with 1.15 in
Latin America.
Within countries there is a strong association between
poverty and gender inequalities in education. These
disparities are inversely related to wealth: they rise for girls
born into the poorest households, for example in Bolivia,
with the disadvantage being greater in secondary than in
primary education. Poverty often interacts with other
markers of disadvantage, such as being born into a group
that is indigenous, a linguistic minority or geographically
isolated, and thus magnifies gender disparities. For
example, indigenous girls in Guatemala are less likely to be
enrolled than other demographic groups. At age 7, only 54%
of indigenous girls are in school, compared with 71% of
indigenous boys and 75% of non-indigenous girls. By age 16,
only a quarter of indigenous girls are enrolled, compared
with 45% of boys. Poverty has a magnifying effect, with only
4% of ‘extremely poor’ indigenous girls aged 16 attending
school, compared with 45% of their ‘non-poor’ counterparts.
Reducing gender disparities in formal education does not
automatically translate into gender equality in educational
opportunities and outcomes. Girls and boys achieve different
outcomes not just in overall performance, but also by subject.
Differences in education systems and classroom practices
partly explain this, but such school-based factors interact with
wider social, cultural and economic forces that also influence
expectations, aspirations and performances along gender
lines. Four distinctive themes emerge from a compilation
of recent research and assessments:
Girls continue to outperform boys in reading literacy
and language arts. The 2006 Segundo Estudio Regional
Comparativo y Explicativo (SERCE) assessment, conducted
in Latin America, found that girls did significantly better
than boys in reading achievement in grades 3 and 6 in half
of the sixteen participating countries.
Girls are catching up with boys in mathematics at all grades
in both primary and secondary education. In SERCE, eight
countries2 revealed gender differences in mathematics,
most of them small, in favour of boys in grade 3.
While boys tend to maintain an advantage, the science gap
is often small. In SERCE, sixth-grade boys outperformed
girls in science in Colombia, El Salvador and Peru. In the
remaining countries (Argentina, Cuba, the Dominican
Republic, Panama, Paraguay and Uruguay) gender
differences were mixed and not statistically significant.
Girls and boys favour different subjects in tertiary education.
Despite the increase in female participation in tertiary
education, some subject areas remain male domains.
In Latin America and the Caribbean, the median share
of females enrolled in science was 45% in 2006, falling to
25% in engineering. By contrast, women are much more
represented in fields long considered ‘feminine’, such as
education (71%), humanities and arts (65%). Recent studies
indicate that complex socialization processes influence
gender differences in choice of subject areas. They include
poor career counselling, lack of role models, negative
family attitudes, fear of mathematics and fear of being
in the minority.
Recent research underlines a strong association between
the degree of gender equality in society at large and the size
of gender gaps in mathematics achievement. Teacher
attitudes and practices that translate into different treatments
of boys and girls can also affect cognitive development and
reinforce gender stereotyping. So can gender biases in
textbooks.
Female teachers can serve as role models for young girls,
potentially countering gender stereotypes. In Latin America
and the Caribbean, as elsewhere, female teachers tend to
be more represented in lower levels of education while the
reverse is true at higher levels. They also tend to be clustered
in urban schools. A recent survey in eleven middle-income
countries shows that pupils in rural primary schools are
more likely than urban pupils to be taught by male teachers.
This is particularly the case in Paraguay and Peru. Rural
girls thus have less chance of contact with female role models
who might raise their expectations and self-confidence.
Quality of education
Getting all children through a full basic education cycle is
an important goal, but the ultimate purpose of schooling is
to provide children with an education that equips them with
the skills, knowledge and wider perspectives they need to
participate fully in the social, economic and political life of
their countries. Delivery of good-quality education is ultimately
contingent on what happens in the classroom, and teachers
are on the front line. The profile of teachers, and the
governance systems through which they are recruited, trained
and deployed, have a critical bearing on learning outcomes
and on equity.
Improving the quality of education constitutes a major
challenge for school systems in Latin America and the
Caribbean. First, while pupil/teacher ratios (PTRs) are not
very high, many schools suffer from a lack of equipment.
PTRs are below developing-country averages and close
to world averages. In recent years, student cohort size
has declined while the number of teachers has increased.
In 2006 the average PTR was 21:1 at pre-primary level
(968,000 pre-primary teachers for the whole region), 23:1
in primary schools (3.0 million teachers) and 16:1 in
secondary schools (3.6 million teachers). There are
1.2 million teachers in tertiary education. Overall shortages 2. Brazil, Chile, Colombia, Costa Rica, El Salvador, Guatemala, Nicaragua and Peru.
ED
UC
AT
IO
N
FO
R
AL
L
GL
OB
AL
M
ON
IT
OR
IN
G
RE
PO
RT
02
09
lac_eng_2009_bat 02 5/12/08 11:50 Page 7
8 L A T I N A M E R I C A A N D T H E C A R I B B E A NR E G I O N A L O V E R V I E W
of primary school teachers still exist in some countries:
for example, El Salvador, Guatemala and Nicaragua have
PTRs above 30:1.
Teacher training remains insufficient. The median shares
of trained teachers are 64% in pre-primary education, 80%
in primary education and 66% in secondary education. The
shortage of trained teachers is particularly acute in several
Caribbean states, where fewer than 70% of primary school
teachers received pedagogical training.
The deployment of teachers is influenced by location, wealth
and type of school. PTRs tend to be higher in urban than in
rural areas, but untrained teachers are often concentrated
in poor rural areas. For example, in Bolivia, teachers hired
on contracts who are not required to have a teaching degree
or teaching experience (interinos) make up 19% of the total
teaching force but 56% of teachers in rural areas.
Shortages of trained teachers are one part of the problem.
Other factors affecting the quality of teaching and learning
include teacher absenteeism3 and low teacher morale
related to poor salaries and working conditions. In
Argentina, Brazil, Peru and Uruguay, for example, less than
a third of fourth graders had teachers who thought their pay
was adequate. Motivation tends to be lower among teachers
with large classes and in schools that are poorly resourced
or attended by disadvantaged pupils. Such negative factors
need to be offset and teacher governance reforms are an
integral part of the solution.
School equipment is insufficient in a number of countries
in the region and represents a serious constraint on
the quality of education. Ecuador, Guatemala, Nicaragua,
Panama, Paraguay and Peru have many primary schools
lacking several or all of the following: sufficient toilets,
potable water, libraries, books and computer rooms.
Poorly equipped schools tend to be attended by children
from poorer households, exacerbating underlying
inequalities in opportunity.
Second, assessment tests point to low and unequal
achievement:
SERCE 2006 assessed reading and mathematics in grade 3,
and reading, mathematics and science in grade 6.
Overall, countries fell into four categories:
1) Cuba, whose students outperformed those from other
countries in almost all subjects and grade levels.
2) A small group of other consistently high-performing
countries, including Chile, Costa Rica and Uruguay.
3) A large group of relatively poor-performing countries that
included the Dominican Republic, Ecuador, El Salvador,
Guatemala, Nicaragua, Panama, Paraguay and Peru.
4) Countries in the middle, notably Argentina, Brazil,
Colombia and Mexico, where pupil achievements varied
by subject and grade. For the last three groups, within-
country differences in achievement by location and gender
were often marked. For example, among poor-performing
countries, rural-urban differences were considerably
more pronounced in El Salvador, Guatemala and Peru
than in the Dominican Republic, Nicaragua and Panama.
In the Dominican Republic, Ecuador and Guatemala,
half or more of grade 3 students were found to have very
low reading levels: they could not recognize the addressee
of a family letter or decipher the meaning of a simple text
in Spanish.
A recent assessment in Peru found that as few as 30%
of children in grade 1 and only about half in grade 2 could
read simple passages from a grade 1 textbook.
The median PISA 2001 scores of Brazilian and Peruvian
students, placed on a scale alongside those of students from
Denmark, France and the United States, were situated in the
lowest 20% of the latter countries’ distribution. PISA 2006
science results showed students from developing countries
being much more likely to figure in the lowest achievement
levels. Over 60% of students from Brazil, but fewer than 10%
in Canada and Finland, scored at or below level 1, the lowest
level in the PISA science ranking.
3. In Peru the economic costs of teacher absenteeism represent 10% of currentexpenditure in primary education.
ED
UC
AT
IO
N
FO
R
AL
L
GL
OB
AL
M
ON
IT
OR
IN
G
RE
PO
RT
02
09
lac_eng_2009_bat 02 5/12/08 11:50 Page 8

9R E G I O N A L O V E R V I E WL A T I N A M E R I C A A N D T H E C A R I B B E A N
The EFA Development Index
The EFA Development Index (EDI) is a composite measure that
captures overall progress. Ideally, it should include all six EFA
goals, but due to data constraints, it currently focuses only on
the four most easily quantified goals, attaching equal weight to
each: UPE (goal 2), adult literacy (goal 4), gender parity and
equality (goal 5), and quality (goal 6), each proxied by a relevant
indicator.4
For the school year ending in 2006, the EDI could be computed
for twenty-four countries in Latin America and the Caribbean.
Two countries have achieved EFA as a whole and three are
close to achieving it. These countries have made balanced
progress on the four goals included in the EDI.
Consistent with other statistics situating the region between
developed and other developing regions, eighteen countries
are in an intermediate position, with EDI values between 0.80
and 0.94. Participation in primary education is often high,
with deficits in other areas such as education quality as
measured by survival rate to grade 5. This is particularly the
case of the Dominican Republic, Ecuador and El Salvador.
As regards Guatemala, low adult literacy and survival rates
contribute to pull down the EDI.
Only Nicaragua is really far from the four quantifiable goals,
with an EDI value of 0.799, driven down by a low survival rate
to grade 5 (54%).
EDI values could be computed for both 1999 and 2006 for
thirteen countries. The index has improved in ten of them,
especially Guatemala (+12%) and Nicaragua (+7%), driven by
increases in school enrolment and retention. On the other
hand, the index decreased significantly in the Dominican
Republic (Table 2).
The EDI provides a snapshot based on national averages.
But progress towards EFA, as the word ‘all’ implies, should
be shared equally across the whole of society. One drawback
of the standard EDI is that it does not capture variation based
on wealth and others indicators of disadvantage.
To address this shortcoming, an EFA Inequality Index
for Income Groups (EIIIG) was constructed for thirty-five
developing countries, including six Latin American and
Caribbean countries (Bolivia, Colombia, the Dominican
Republic, Haiti, Nicaragua and Peru), using household
survey data. The EIIIG illustrates the strong disparities that
persist in the region between wealth quintiles and between
urban and rural areas.5
The EIIIG shows large disparities in overall EFA achievement
between wealth groups in most countries. Wealth disparities
are greater in Bolivia, Haiti and Nicaragua than in the three
other countries, which also have higher overall EFA
achievement.
Overall EFA achievement is greater in urban than in rural
areas, whatever the income group. However, poor rural
residents are particularly disadvantaged in Haiti and
Nicaragua, with the EIIIG ratio of richest to poorest close
to 2 in rural areas.
5. The EIIIG uses a different set of indicators to provide a measure similar to the EDI,showing distribution of overall EFA achievement within countries by wealth and byrural/urban location. The EIIIG differs from the EDI in three main ways. The total primarynet attendance rate is used rather than the total primary NER. As many householdsurveys do not include literacy rates, this EIIIG component is based on the proportion of15- to 25-year-olds with five or more years of education. Finally, the survival rate for theEIIIG is defined as the proportion of 17- to 27-year-olds who report having at least fiveyears of education among those that reported having at least one year of education.
4. UPE is proxied by the total primary NER (the ratio of the number of children of primaryschool-going age enrolled in either primary or secondary education to the total numberof children of primary school-going age); adult literacy by the literacy rate of personsaged 15 and above; gender parity and equality by a gender-specific EFA index (GEI), an average of the GPIs for primary and secondary GERs and for the adult literacy rate;and education quality by the survival rate to grade 5. The EDI value for a given country isan arithmetic mean of these four indicators. It falls between 0 and 1, with 1 representingachievement of EFA.
ED
UC
AT
IO
N
FO
R
AL
L
GL
OB
AL
M
ON
IT
OR
IN
G
RE
PO
RT
02
09
Table 2: Mean distance from the four EFA goals included in the EDI, 2006
EFA achieved(EDI between 0.97 and 1.00)
Aruba, Cuba
(2)
Close to EFA(EDI between 0.95 and 0.96)
Argentina, Mexico, Uruguay
(3)
Far from EFA(EDI below 0.80)
Nicaragua
(1)
Intermediate position(EDI between 0.80 and 0.94)
Bahamas, Barbados, Belize, Bolivia, Brazil, Colombia, DominicanRepublic, Ecuador, El Salvador,Guatemala, Honduras, Panama,Paraguay, Peru, Saint Lucia, Trinidadand Tobago, Bolivarian Republic of Venezuela, Saint Vincent and the Grenadines (18)
lac_eng_2009_bat 02 5/12/08 11:50 Page 9
10 L A T I N A M E R I C A A N D T H E C A R I B B E A NR E G I O N A L O V E R V I E W
Raising quality andstrengthening equity:why governance matters
Education governance is not an abstract concept. It is about
ensuring that children have access to well-resourced schools
that are responsive to local needs. It is also concerned with
ensuring that teachers are trained and motivated, and that
teachers and schools are accountable to parents and
communities for raising learning outcomes. Education
governance is about how policies are formulated, priorities
identified, resources allocated and reforms implemented
and monitored.
Governance reform is a prominent part of the EFA agenda.
The Dakar Framework for Action set out broad principles,
which include creating responsive, accountable and
participatory education systems. The widely held conviction is
that moving decision-making away from remote government
agencies and making the process more local and transparent
will make education service providers more responsive to the
needs and concerns of the poor. However, experience in both
the developed and developing world point to highly variable
results. Two key findings emerge. First, there is no blueprint
for good governance: each country has to develop its own
national and local solutions to governance problems. Second,
governments across the world have attached insufficient
weight to equity in the design of governance reforms. There
is an urgent need to ensure that the interests of the poor,
marginalized and vulnerable are placed firmly at the centre
of the governance agenda.
The Report focuses on four areas that highlight some of
the most important currents in governance reform. Latin
American and Caribbean countries show great inequality in
socio-economic and educational conditions. Yet they have also
experimented with many reforms in each of the four areas,
submitting these to more rigorous evaluations than in many
other countries.
Financing education for equity
Additional funding is needed if the world is to achieve the
Dakar goals. But increasing funding is part of a broader set
of education policy challenges. Countries also need to improve
efficiency and develop strategies addressing inequalities in
education finance if EFA is to be achieved.
Increased public spending is not guaranteed to improve
access, equity or learning outcomes. But chronic and
sustained underfinancing is a sure route to limited,
poor-quality provision.
Technical efficiency provides an indicator of the cost
associated with turning finance into quantitative and
qualitative outcomes. In many countries, corruption is
a major source of inefficiency and inequity – the former
because it means more public money provides fewer inputs
and the latter because the costs of corruption invariably fall
most heavily on the poor:
In Nicaragua, monitoring of six major school upgrade
and repair projects undertaken by the education ministry
demonstrates how corrupt practices diminish resource
flows to education. Comparison of the buildings before and
after project completion revealed widespread irregularities.
Substandard materials and overpricing contributed to
substantial financial losses.
In Brazil, the otherwise highly effective FUNDEF
programme (Fundo de Manutenção e Desenvolvimento
do Ensino Fundamental e de Valorização do Magistério)
was affected in the past by illegal appropriation of funds
meant for teacher salaries and training. On average,
around 13% of the total was lost in the course of transfer
from the federal budget to municipal bank accounts, rising
to 55% for some municipalities. The governance problem
was linked to the inability of local councils charged with
monitoring the grants to ensure that they were properly
received and used.
In Mexico, every two years the National Survey on
Corruption and Good Governance records informal
payments by households for thirty-eight public services
in all thirty-two federal states, making it possible to
quantify what amounts to a tax. Estimates based on the
survey indicate that households pay almost US$10 million
in bribes to secure access to public education, which
is legally free. In 2003 households paid an average of
US$30 each to meet illegal demands from service providers.
In a country where around one-quarter of the population
was living on less than US$2 per day, this is a significant
financial burden. There are also indications that informal
payments for access to basic services may be charged
more frequently to poor households.
Monitoring the use of funds through public expendituretracking can help reduce corruption. However, not all public
expenditure tracking has been successful. When corruption
is deeply entrenched and political leaders do not create
conditions for strengthened accountability, such exercises
can deliver limited results. The public expenditure tracking
survey on education conducted in Peru in 2002 is an example.
Opaque budget planning made it impossible to establish
real allocation levels, providing extensive opportunities
for corruption. Over 90% of the resources earmarked
for education were devoted to payroll, but data lapses on
teacher numbers limited the scope for assessing delivery.
Public spending on education has the potential to redress
inequalities but often reinforces them instead. Governments
have developed various approaches aimed at making spending
more equitable, such as school grants and formula fundinglinked to need. However, outcomes have been mixed.
ED
UC
AT
IO
N
FO
R
AL
L
GL
OB
AL
M
ON
IT
OR
IN
G
RE
PO
RT
02
09
lac_eng_2009_bat 02 5/12/08 11:50 Page 10
11R E G I O N A L O V E R V I E WL A T I N A M E R I C A A N D T H E C A R I B B E A N
The decentralization of education from federal to provincial
governments was an important feature of institutional reform
in Latin America and the Caribbean during the 1990s. Yet
financial decentralization can exacerbate the gaps between
rich and poor areas. Central governments need to retain a
strong role in redistributing financial resources from richer to
poorer areas, or financing gaps in education are likely to widen:
In Argentina, the transfer of responsibility for secondary
schools from federal to provincial level was accompanied
by a system of federal tax transfers. Detailed evaluations
of the decentralization process have identified many benefits.
Nationally, decentralization appears to have improved local
participation, strengthened monitoring and improved
learning standards. However, the results have not been
uniform. Test scores point to a widening gap between
wealthier provinces with strong government capacity and
poorer provinces with low administrative and institutional
capacity; the latter performed worse under decentralization.
In other words, national efficiency has improved, but at the
expense of equity.
When Brazil devolved authority from a highly centralized
system to states and municipalities in the mid-1990s, it
created FUNDEF to reduce the large national inequalities
in per-student spending. State and municipal governments
were required to transfer a proportion of their tax revenue
to FUNDEF, which redistributed it to state and municipal
governments that could not meet specified minimum levels
of per-student expenditure. FUNDEF has not prevented
wealthier regions from increasing their overall spending
more rapidly than poorer regions, but it has played a highly
redistributive role. It has also increased both the absolute
level of spending and the predictability of transfers, notably
for poor states and municipalities in the north and north-
east. There is strong evidence that FUNDEF has been
instrumental in reducing class size, improving the supply
and quality of teachers, and expanding enrolment. At
municipal level, data show that the 20% of municipalities
receiving the most funds from FUNDEF were able to double
per-pupil expenditure between 1996 and 2002 in real terms.
In Colombia, decentralization of government finance in the
1990s significantly improved the equity of intergovernment
transfers. Before decentralization, transfers from central
government were based on historical transfer patterns that
favoured wealthier provinces. Under the reforms, historical
allocations were replaced by a formula that allocated
resources on the basis of population, with adjustments
for health and education provision.
Choice, competition and voice: school governance reform and EFA
School governance reforms aim to strengthen the voices of the
poor and increase their choices by transferring responsibility
to communities, parents and private providers. An overarching
lesson from this experience is that such reforms are not a
substitute for governments’ taking responsibility to ensure
that the public education system is of good quality.
School-based management describes a range of reforms
aimed at giving teachers, parents and communities more
autonomy over decision-making in schools. In some cases
these reforms have improved learning achievements and
strengthened equity. More often, though, there is limited
evidence of improvement in either learning outcomes or
teaching practices.
The most detailed school-based management evaluations
come from Latin America. Regional evidence points to some
positive effects on attainment. Some studies have found an
association between delegation of management functions
and reduction of school repetition and dropout. Learning
outcomes are more variable, with marked differences
among countries. A study of mathematics and language
performance among grade 3 students found that EDUCO
schools in El Salvador appeared to score lower than tradi-
tional schools. However, after controlling for background,
the differences disappeared and EDUCO pupils scored
slightly higher in language tests, on average. On the other
hand, evaluations in Honduras of schools in the Programa
Hondureño de Educación Comunitaria (PROHECO)
concluded that delegation of decision-making was not
associated with significant changes in learning achievement.
Findings from Latin America show that school-based
management reforms can result in improved teacher
motivation, as indicated by reduced absenteeism, more time
meeting with parents and more hours spent at school.
However, evidence from a wide range of country experiences
suggests that teaching practices in schools with more
autonomy do not differ significantly from those in other
schools. This is sometimes because central authorities
maintain de facto control over decisions.
School-based management initiatives are likely to be most
successful when they are driven by demand from below.
However, community participation can be a double-edged
sword from an equity perspective, especially when it involves
competition for resources. Schools with committed
principals and organized communities are in a stronger
position to exploit opportunities than those without. Evidence
from Mexico’s Programa Escuelas de Calidad (PEC)
illustrates the point: voluntary participation by itself resulted
in a selection of schools that were neither located in the
poorest communities nor among the lowest performers.
An important lesson is that voluntary participation has
to be supported by measures that strengthen equity.
ED
UC
AT
IO
N
FO
R
AL
L
GL
OB
AL
M
ON
IT
OR
IN
G
RE
PO
RT
02
09
lac_eng_2009_bat 02 5/12/08 11:50 Page 11

12 L A T I N A M E R I C A A N D T H E C A R I B B E A NR E G I O N A L O V E R V I E W
Encouraging the participation of parents and communities in decision-making can make schools more responsive to
local needs. However, it does not follow that this will overcome
wider inequalities. In reality, local power structures associated
with poverty and social inequality can still limit the influence
of the poor and marginalized.
Expanding school choice is widely viewed as an incentive for
improved school performance. Some governments are using
vouchers and other instruments to facilitate transfers from
public to private providers, or contracting out the managementof government schools to non-state providers. However, these
reforms have not unambiguously raised academic achievement
standards. Often, they have widened inequalities.
Chile’s case is instructive. Increased competition between
schools has been just one element in Chile’s extensive
education governance reforms. A partial list of wider measures
includes devolution to municipal level in many areas of
management, increased use of exams and assessment to
monitor performance, increased funding (since the return
of democracy in 1990), performance-related incentives for
teachers and the lengthening of the school day. The reforms
have led to large gains in education coverage, especially at
secondary level, and they have led to Chile being widely cited
as a model for governance reform. Outcomes for learning
achievement and equity have been far less impressive,
however. Private schools receiving public subsidies do register
an advantage over municipal schools on the yardstick provided
by fourth-grade standardized tests. However, the findings are
reversed when the socio-economic characteristics of schools
are taken into account. In other words, there is no equalizing
effect. Municipal schools do a better job than private schools
of lifting the achievement of students in the lowest group. Only
among students in the middle socio-economic group do private
subsidized schools have higher associated test scores.
Analysis of international assessment data over time also calls
into question Chile’s credentials as a governance success
story. Governance reforms have certainly done little to close
the gap between Chile and the developed world. And Chile
retains some of the starkest education disparities in Latin
America. While Chile’s experience with education governance
reform is often held up as a model, Chileans themselves have
been more circumspect. The government is embarking on a
new wave of reforms with a more explicit focus on equity. Past
efforts at reform have not been enthusiastically received by
secondary school students, who have responded with street
protests over poor quality and highly unequal education
provision. After more than fifteen years of education reform
under a democratic government and ten years before that
under the military government, Chile remains a weak
advertisement for the governance reform blueprint favoured
by many governments and aid donors.
Low-fee private schools are changing the education landscape
in some parts of the world. Their rapid growth is a symptom
of failure in the availability or quality of government schools.
They risk widening the gap between those who can and
cannot afford to pay, and there are questions about the quality
of education they provide.
Strengthening teacher governance and monitoring
Many school systems fail to provide an education that
meets even the most basic standards of quality and equity.
To address this, attention needs to be paid to teacher
recruitment, deployment and motivation, together with
effective use of information from learning assessments
and school supervision.
From one perspective, teacher salaries are viewed as
crowding out spending on learning materials and other
aspects of education provision. From an alternative
perspective, they are seen as too low, even near or below
the poverty line in some countries, with obvious implications
for teacher motivation and standards. In Latin America,
teacher salaries are generally well above the poverty
threshold, but compare unfavourably with pay in similar
professional and technical occupations.
Hiring contract teachers can help address teacher
shortages at lower cost. However, relying on contract
teachers can weaken quality by lowering the standard
of the teaching staff or generally reducing teacher morale.
Teacher deployment is often inequitable within countries,
which can exacerbate inequality in learning. Prioritizing
training of teachers from under-represented groups,
together with local recruitment, can make a difference.
Some countries in the region have developed national
programmes aimed at overcoming disparities in teacher
allocation through financing mechanisms to support teacher
recruitment in undeserved areas. One particularly striking
example comes from Brazil. During the 1990s, high levels
of inequality in education attainment and achievement in the
country were linked to big disparities in teacher allocation.
The FUNDEF programme used national education financing
strategies to change the picture. Under FUNDEF, a share of
subnational tax revenue was pooled and used to supplement
spending per student in poor states. Around 60% of these
resources were used to hire and train teachers or to
increase teacher salaries. The highest salary increases were
in the poorer states of the north-east with the greatest
education needs. After FUNDEF began in 1998, the
percentage of teachers having completed more than a
primary education rose sharply, especially in poor areas.
Some governments see performance-related pay as a
strategy to improve teacher performance, including by
reducing teacher absenteeism. But there is little evidence
that it produces positive results – and some evidence that
it has perverse effects such as encouraging teachers to
focus on the best-performing students. In Chile a national
ED
UC
AT
IO
N
FO
R
AL
L
GL
OB
AL
M
ON
IT
OR
IN
G
RE
PO
RT
02
09
lac_eng_2009_bat 02 5/12/08 11:50 Page 12
13R E G I O N A L O V E R V I E WL A T I N A M E R I C A A N D T H E C A R I B B E A N
performance-related pay system, the Sistema Nacional de
Evaluación del Desempeño, rewards the schools that show
the greatest progress in student achievement, giving them
a financial bonus for teachers equivalent to about half a
month’s salary. Schools are stratified within regions by
socio-economic status and other external factors that affect
school performance. This ensures that competition is among
comparable establishments. However, the design has some
inherent flaws. It rewards schools that are already doing
well rather than those that are improving yet still need to
do better. Similar problems have emerged in Mexico.
In this case, a long-standing programme, the Carrera
Magisterial, allows teachers to move up in pay level based
on assessment of a range of criteria, including their
students’ performance. Unfortunately, the approach has
encouraged teachers to focus on the best-performing
students. The experience of Chile and Mexico is instructive
in other ways, too. While the introduction of performance-
related pay was highly controversial in both countries, the
impact of the pay incentives on learning achievement has
been minimal. This is partly because only a small minority
of teachers has any real likelihood of receiving a reward,
whether a bonus in Chile or a promotion in Mexico.
Using information from learning assessments to monitorquality standards and equity is one of the keys to improved
learning outcomes. Increasingly, information from learning
assessments is being used to identify problems and inform
policy, with encouraging results. For instance, Uruguay has
managed to improve learning outcomes rapidly in recent
years. Its quality improvement efforts have been informed
by sample-based assessments aimed at strengthening
pedagogical management in schools. By combining the
assessments with cluster-based teacher training and
support, spread over the whole school year, education
authorities have turned information into policy practice.
Evidence suggests that learning outcomes in certain grades
improved by 30% over six years. Special measures have
been taken to improve the functioning of weaker schools.
Important moves towards redressing learning disparities
have included targeting financial resources primarily on
the basis of poverty rather than test results, and using test
results to provide targeted support to teachers in weaker
schools and districts.
School supervision is an essential aspect of monitoring,
not only to oversee teacher and school performance but
also to identify and support needed quality improvements.
An integrated approach to education and poverty reduction
Sustained progress towards EFA depends on the effective
integration of education planning into wider poverty reduction
strategies, for an obvious reason: poverty, poor nutrition and
ill health are formidable barriers to success in education.
Poverty reduction strategy papers (PRSPs) are failing to
make the connection between education and poverty reduction
because of their weak link to the EFA agenda, limited
consideration for equity in target-setting, a disconnect
with broader governance reform and poor integration
of cross-sectoral approaches.
Social protection programmes are making a strong
contribution to education by addressing problems in health,
nutrition and child labour. Part of the success of social
protection programmes in improving educational outcomes
for the poor and disadvantaged comes from their effectiveness
in channelling resources to target groups. A recent study on
programmes in Brazil (Bolsa Família), Chile (Solidario) and
Mexico (Oportunidades) found that about 60% of transfer funds
flowed to the poorest 20% of the population. Conditional cash
transfers have materially increased equity in the income
distribution. The success of social protection programmes
is increasingly recognized. Oportunidades even offers a rare
example of policy transfer from a developing country to a
developed country: New York City, in an effort to help some
of its most deprived people escape poverty traps that cross
generations, is experimenting with a model based on the
Mexican programme.
Political commitment, together with consultation processesthat provide opportunities for civil society organizations
to participate in policy discussions, is crucial. The challenge
is to extend participation to make sure the voices of the poor
and vulnerable are heard.
ED
UC
AT
IO
N
FO
R
AL
L
GL
OB
AL
M
ON
IT
OR
IN
G
RE
PO
RT
02
09
lac_eng_2009_bat 02 5/12/08 11:50 Page 13
14 L A T I N A M E R I C A A N D T H E C A R I B B E A NR E G I O N A L O V E R V I E W
Financing educationin Latin Americaand the Caribbean
National financing
Total public expenditure on education as a share of GNP
in the region varies between 1.2% (Bermuda) and 10.8%
(Saint Kitts and Nevis), the median being 4.1%, below both
the developing country median of 4.4% and the developed
country median of 5.3%. The share varies considerably
even among the larger countries, between 3.0% in Uruguay
and 6.6% in Bolivia and up to 9.3% in Cuba, reflecting both
diverse levels of economic development and varying
degrees of commitment to education.
Between 1999 and 2006, the share increased in eleven
of the twenty countries with data for both years, including
Bolivia, Cuba and Mexico; it declined in nine countries,
including Argentina, Paraguay and Peru.
At US$614 in 2006 (in constant 2005 dollars on a purchasing
power parity basis), median public expenditure per primary
pupil in Latin America was much higher than in poorer
regions such as sub-Saharan Africa (US$167), but remained
well below that of North America and Western Europe
(US$5,584). The highest figure in the region was US$1,703
in Argentina, followed by Costa Rica (US$1,623) and Mexico
(US$1,604). The lowest levels were in poorer countries such
as Bolivia (US$435), Guatemala (US$390) and Nicaragua
(US$331).
In 2006, median per-pupil expenditure in secondary
education was actually slightly lower, at US$594 (again
in constant 2005 dollars on a PPP basis), as against
US$376 in sub-Saharan Africa and US$7,753 in North
America and Western Europe.
Latin America and the Caribbean accounts for about 9%
of the world’s school-age population and 8% of its global
educational expenditure, with Brazil alone accounting for
3% (2004 figures).
International aid for education
In 2006 Latin America and the Caribbean received aid to
education worth US$785 million (in constant 2006 dollars),
more than the 2005 figure (US$703 million) and the
1999–2000 annual average (US$592 million). This
represented 9% of total official development assistance
received by the region, up from 6% in 1999–2000.
US$280 million, or 36% of total aid to education (down
from 45% in 1999–2000), went to basic education in 2006,
amounting to US$5 per primary school-age child.
Aid for education in the region is targeted to a few countries.
In 2006, the five largest recipients received 48% of the total:
Nicaragua (US$113 million, including US$81 to basic
education), the Dominican Republic (US$88 million,
including US$41 to basic education), Peru (US$66 million),
Brazil (US$62 million) and Haiti (US$53 million).
While Brazil, because of its population size, received only
US$1 of aid to basic education per primary school-aged child
in 2006, some of the poorest countries did receive large
amounts, notably the Dominican Republic (US$32),
Guyana (US$52) and Nicaragua (US$97).
ED
UC
AT
IO
N
FO
R
AL
L
GL
OB
AL
M
ON
IT
OR
IN
G
RE
PO
RT
02
09
lac_eng_2009_bat 02 5/12/08 11:50 Page 14
15R E G I O N A L O V E R V I E WL A T I N A M E R I C A A N D T H E C A R I B B E A N
ED
UC
AT
IO
N
FO
R
AL
L
GL
OB
AL
M
ON
IT
OR
IN
G
RE
PO
RT
02
09
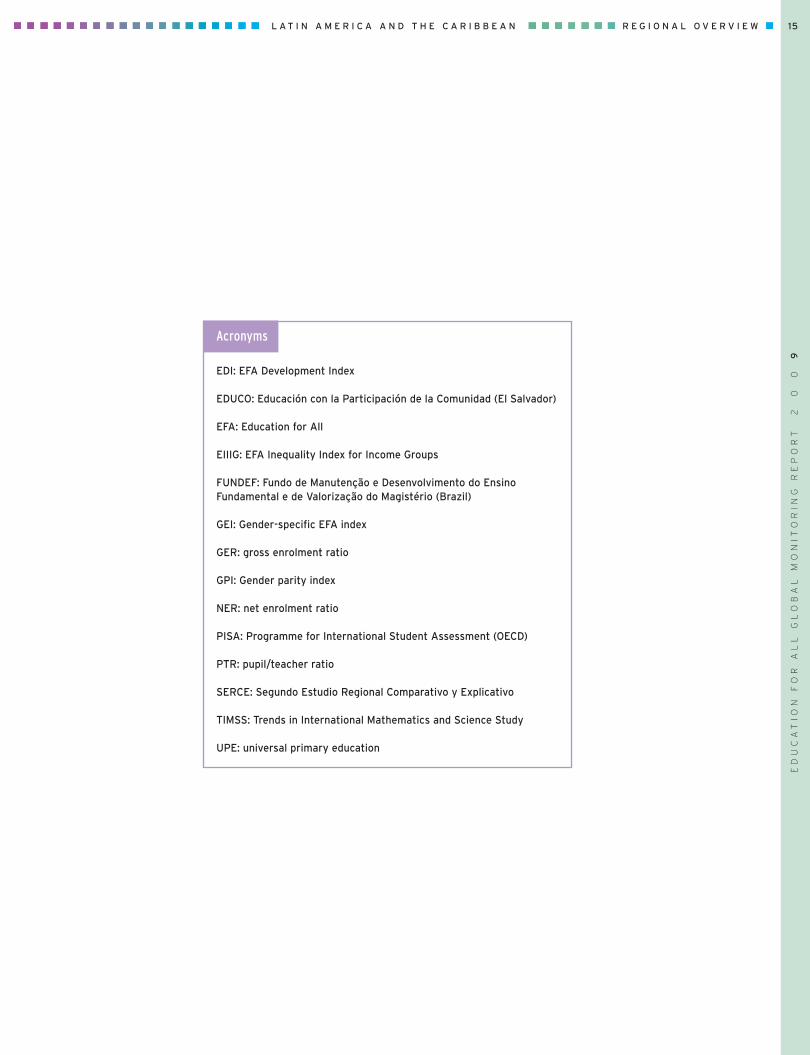
EDI: EFA Development Index
EDUCO: Educación con la Participación de la Comunidad (El Salvador)
EFA: Education for All
EIIIG: EFA Inequality Index for Income Groups
FUNDEF: Fundo de Manutenção e Desenvolvimento do EnsinoFundamental e de Valorização do Magistério (Brazil)
GEI: Gender-specific EFA index
GER: gross enrolment ratio
GPI: Gender parity index
NER: net enrolment ratio
PISA: Programme for International Student Assessment (OECD)
PTR: pupil/teacher ratio
SERCE: Segundo Estudio Regional Comparativo y Explicativo
TIMSS: Trends in International Mathematics and Science Study
UPE: universal primary education
Acronyms
lac_eng_2009_bat 02 5/12/08 11:50 Page 15

12 5-17 … … … … … … … … 10384 5-16 … … … … … … … … …
104 6-16 0.981 … … 98 1.00 20 … 99 99327 5-16 0.921 … … … … 17 … 12 …
293 5-16 0.943 … … … … 11 … 74 94282 5-14 0.913 70 1.00 … … 20 18 27 3464 5-16 … … … … … … … … …
22 5-16 … … … … … … … 62 9346 5-16 … … … … … … … … …
68 5-16 … … … … … … … 80 77106 5-16 … … … … … 41 … 93 81739 6-15 … … … … … 57 11 124 99
9 446 6-11 … … … … … 72 24 … …
2 699 6-11 … … … 85 1.13 17 3 78 926 5-16 … … … … … … … … 91
189 6-15 … 95 1.00 96 1.00 17 … 111 …
50 5-16 … … … … … … … … 99163 5-15 0.942 … … … … 16 … 70 69120 5-15 0.901 … … … … 28 … … 88455 6-12 … … … 90 0.95 35 10 … 84
1 328 5-11 0.941 97 0.98 99 0.99 18 4 58 8525 4-16 … … … … … … … … 118
39 134 5-14 0.956 96 1.00 98 1.00 16 4 57 669 354 6-13 0.915 80 0.82 90 0.89 61 27 45 50
189 323 7-14 0.901 … … 90 1.01 29 11 58 6916 465 6-13 … 94 0.99 96 1.00 9 1 77 5545 558 5-14 0.905 81 1.00 92 1.00 26 12 37 404 399 6-15 … … … 96 1.00 11 6 84 70
11 267 6-14 0.981 … … 100 1.00 7 5 109 1139 615 5-13 0.824 … … 89 1.01 33 7 32 32
13 202 5-14 0.919 88 0.95 92 0.98 26 23 64 906 762 7-15 0.867 74 0.92 84 0.93 29 19 43 51
13 029 7-15 0.819 64 0.80 72 0.86 39 49 46 296 969 6-11 0.887 … … 83 1.01 42 25 … 38
105 342 6-15 0.956 88 0.94 92 0.96 20 13 74 1065 532 6-12 0.799 … … 80 1.02 26 20 27 523 288 6-11 0.941 89 0.99 93 0.99 24 18 39 676 016 6-14 0.935 90 0.96 94 0.98 38 14 29 34
27 589 6-16 0.931 87 0.88 89 0.89 29 24 55 683 331 6-15 0.963 95 1.01 98 1.01 16 11 60 79
27 191 6-15 0.934 90 0.98 93 0.99 22 13 45 60
559 994 … … 87 0.98 91 0.98 27 16 56 65
16 628 … … 66 1.02 74 1.05 56 … 65 79
543 365 … … 87 0.97 91 0.98 26 … 55 64
5 284 165 … … 68 0.77 79 0.85 81 32 27 36
6 578 149 … … 76 0.85 84 0.89 74 31 33 41
AnguillaAntigua and BarbudaArubaBahamasBarbadosBelizeBermudaBritish Virgin IslandsCayman IslandsDominicaGrenadaGuyana4
HaitiJamaicaMontserratNetherlands AntillesSaint Kitts and NevisSaint LuciaSt Vincent/Grenad.SurinameTrinidad and TobagoTurks and Caicos Islands
Argentina5
BoliviaBrazilChileColombiaCosta RicaCubaDominican RepublicEcuadorEl SalvadorGuatemalaHonduras4
MexicoNicaragua4
PanamaParaguayPeruUruguayVenezuela, B. R.
Latin America/Caribbean
Caribbean
Latin America
Developing countries
World
Table 3: Latin america and the Caribbean, selected education indicators
Total population
(000)
Compulsoryeducation
(age group)
EFADevelopment
Index(EDI) 1985–19941 2000–20061
2006Country or territory 2006Total(%)
GPI(F/M)
Total(%)
GPI(F/M) 2005–2010
Under-5mortality rate
(‰)
Child survival and well-being
1996–20061Total(%)
Total(%)
Moderate andsevere stunting
(%) 1999 2006
GER
Pre-primary education
Adult literacy rate(15 and over) Early childhood care and education
The Caribbean
Latin America
16 L A T I N A M E R I C A A N D T H E C A R I B B E A NR E G I O N A L O V E R V I E WE
DU
CA
TI
ON
F
OR
A
LL
G
LO
BA
L
MO
NI
TO
RI
NG
R
EP
OR
T0
20
9
Source: EFA Global Monitoring Report 2009, statistical tables; UNESCO Institute for Statistics; CRS online database (OECD-DAC, 2008).
Sum Weighted average Weighted average Weighted average
lac_eng_2009_bat 02 5/12/08 11:50 Page 16
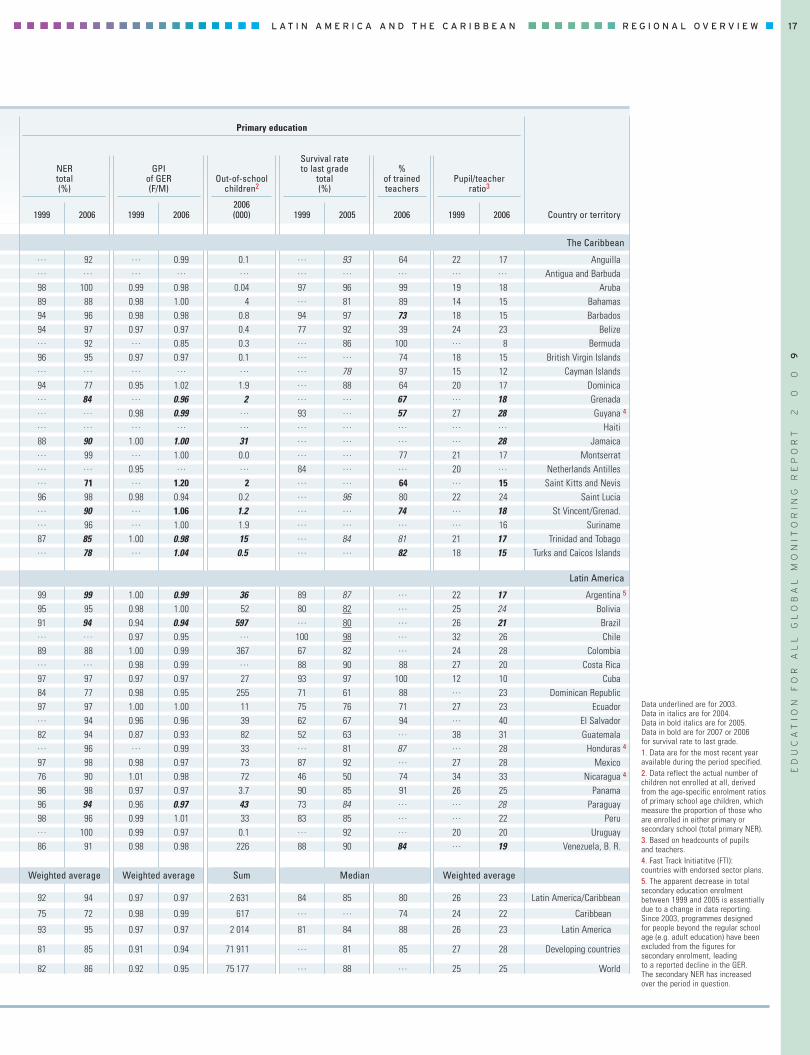
… 92 … 0.99 0.1 … 93 64 22 17… … … … … … … … … …
98 100 0.99 0.98 0.04 97 96 99 19 1889 88 0.98 1.00 4 … 81 89 14 1594 96 0.98 0.98 0.8 94 97 73 18 1594 97 0.97 0.97 0.4 77 92 39 24 23… 92 … 0.85 0.3 … 86 100 … 896 95 0.97 0.97 0.1 … … 74 18 15… … … … … … 78 97 15 1294 77 0.95 1.02 1.9 … 88 64 20 17… 84 … 0.96 2 … … 67 … 18… … 0.98 0.99 … 93 … 57 27 28… … … … … … … … … …
88 90 1.00 1.00 31 … … … … 28… 99 … 1.00 0.0 … … 77 21 17… … 0.95 … … 84 … … 20 …… 71 … 1.20 2 … … 64 … 1596 98 0.98 0.94 0.2 … 96 80 22 24… 90 … 1.06 1.2 … … 74 … 18… 96 … 1.00 1.9 … … … … 1687 85 1.00 0.98 15 … 84 81 21 17… 78 … 1.04 0.5 … … 82 18 15
99 99 1.00 0.99 36 89 87 … 22 1795 95 0.98 1.00 52 80 82 … 25 2491 94 0.94 0.94 597 … 80 … 26 21… … 0.97 0.95 … 100 98 … 32 2689 88 1.00 0.99 367 67 82 … 24 28… … 0.98 0.99 … 88 90 88 27 2097 97 0.97 0.97 27 93 97 100 12 1084 77 0.98 0.95 255 71 61 88 … 2397 97 1.00 1.00 11 75 76 71 27 23… 94 0.96 0.96 39 62 67 94 … 4082 94 0.87 0.93 82 52 63 … 38 31… 96 … 0.99 33 … 81 87 … 2897 98 0.98 0.97 73 87 92 … 27 2876 90 1.01 0.98 72 46 50 74 34 3396 98 0.97 0.97 3.7 90 85 91 26 2596 94 0.96 0.97 43 73 84 … … 2898 96 0.99 1.01 33 83 85 … … 22… 100 0.99 0.97 0.1 … 92 … 20 2086 91 0.98 0.98 226 88 90 84 … 19
92 94 0.97 0.97 2 631 84 85 80 26 23
75 72 0.98 0.99 617 … … 74 24 22
93 95 0.97 0.97 2 014 81 84 88 26 23
81 85 0.91 0.94 71 911 … 81 85 27 28
82 86 0.92 0.95 75 177 … 88 … 25 25
AnguillaAntigua and Barbuda
ArubaBahamasBarbados
BelizeBermuda
British Virgin IslandsCayman Islands
DominicaGrenadaGuyana 4
HaitiJamaica
MontserratNetherlands AntillesSaint Kitts and Nevis
Saint LuciaSt Vincent/Grenad.
SurinameTrinidad and Tobago
Turks and Caicos Islands
Argentina 5
BoliviaBrazilChile
ColombiaCosta Rica
CubaDominican Republic
EcuadorEl SalvadorGuatemala
Honduras 4
MexicoNicaragua 4
PanamaParaguay
PeruUruguay
Venezuela, B. R.
Latin America/Caribbean
Caribbean
Latin America
Developing countries
World
Country or territory1999 2006 1999 20062006(000) 1999 2006 1999 20062005
NERtotal(%)
GPIof GER(F/M)
Out-of-schoolchildren2
%of trainedteachers
Survival rateto last grade
total(%)
Pupil/teacherratio3
Primary education
The Caribbean
Latin America
17R E G I O N A L O V E R V I E WL A T I N A M E R I C A A N D T H E C A R I B B E A N
ED
UC
AT
IO
N
FO
R
AL
L
GL
OB
AL
M
ON
IT
OR
IN
G
RE
PO
RT
02
09
Data underlined are for 2003. Data in italics are for 2004. Data in bold italics are for 2005. Data in bold are for 2007 or 2006 for survival rate to last grade.1. Data are for the most recent yearavailable during the period specified.2. Data reflect the actual number ofchildren not enrolled at all, derivedfrom the age-specific enrolment ratiosof primary school age children, whichmeasure the proportion of those whoare enrolled in either primary orsecondary school (total primary NER).3. Based on headcounts of pupils and teachers.4. Fast Track Initiatitve (FTI): countries with endorsed sector plans.5. The apparent decrease in totalsecondary education enrolmentbetween 1999 and 2005 is essentiallydue to a change in data reporting.Since 2003, programmes designed for people beyond the regular schoolage (e.g. adult education) have beenexcluded from the figures forsecondary enrolment, leading to a reported decline in the GER. The secondary NER has increased over the period in question.
Weighted average Weighted average Sum Median Weighted average
lac_eng_2009_bat 02 5/12/08 11:50 Page 17
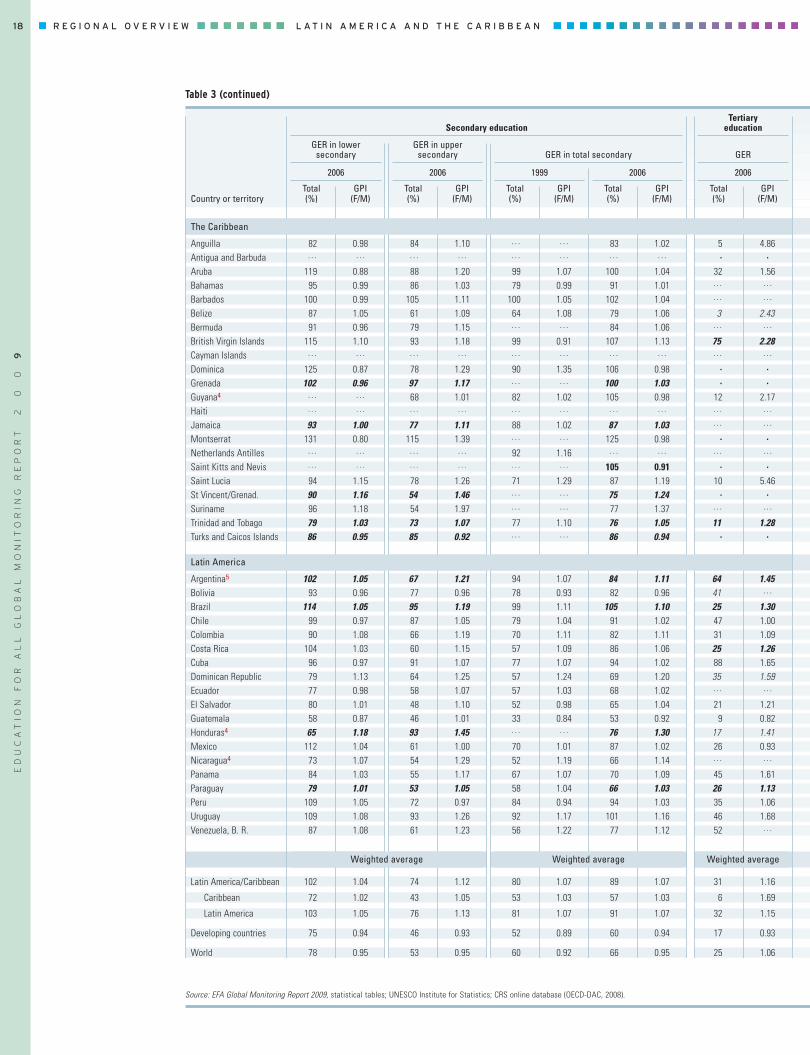
18 L A T I N A M E R I C A A N D T H E C A R I B B E A NR E G I O N A L O V E R V I E WE
DU
CA
TI
ON
F
OR
A
LL
G
LO
BA
L
MO
NI
TO
RI
NG
R
EP
OR
T0
20
9
82 0.98 84 1.10 … … 83 1.02 5 4.86… … … … … … … … . .
119 0.88 88 1.20 99 1.07 100 1.04 32 1.5695 0.99 86 1.03 79 0.99 91 1.01 … …
100 0.99 105 1.11 100 1.05 102 1.04 … …
87 1.05 61 1.09 64 1.08 79 1.06 3 2.4391 0.96 79 1.15 … … 84 1.06 … …
115 1.10 93 1.18 99 0.91 107 1.13 75 2.28… … … … … … … … … …
125 0.87 78 1.29 90 1.35 106 0.98 . .
102 0.96 97 1.17 … … 100 1.03 . .
… … 68 1.01 82 1.02 105 0.98 12 2.17… … … … … … … … … …
93 1.00 77 1.11 88 1.02 87 1.03 … …
131 0.80 115 1.39 … … 125 0.98 . .
… … … … 92 1.16 … … … …… … … … … … 105 0.91 . .
94 1.15 78 1.26 71 1.29 87 1.19 10 5.4690 1.16 54 1.46 … … 75 1.24 . .
96 1.18 54 1.97 … … 77 1.37 … …
79 1.03 73 1.07 77 1.10 76 1.05 11 1.2886 0.95 85 0.92 … … 86 0.94 . .
102 1.05 67 1.21 94 1.07 84 1.11 64 1.4593 0.96 77 0.96 78 0.93 82 0.96 41 …
114 1.05 95 1.19 99 1.11 105 1.10 25 1.3099 0.97 87 1.05 79 1.04 91 1.02 47 1.0090 1.08 66 1.19 70 1.11 82 1.11 31 1.09
104 1.03 60 1.15 57 1.09 86 1.06 25 1.2696 0.97 91 1.07 77 1.07 94 1.02 88 1.6579 1.13 64 1.25 57 1.24 69 1.20 35 1.5977 0.98 58 1.07 57 1.03 68 1.02 … …
80 1.01 48 1.10 52 0.98 65 1.04 21 1.2158 0.87 46 1.01 33 0.84 53 0.92 9 0.8265 1.18 93 1.45 … … 76 1.30 17 1.41
112 1.04 61 1.00 70 1.01 87 1.02 26 0.9373 1.07 54 1.29 52 1.19 66 1.14 … …
84 1.03 55 1.17 67 1.07 70 1.09 45 1.6179 1.01 53 1.05 58 1.04 66 1.03 26 1.13
109 1.05 72 0.97 84 0.94 94 1.03 35 1.06109 1.08 93 1.26 92 1.17 101 1.16 46 1.68
87 1.08 61 1.23 56 1.22 77 1.12 52 …
102 1.04 74 1.12 80 1.07 89 1.07 31 1.16
72 1.02 43 1.05 53 1.03 57 1.03 6 1.69
103 1.05 76 1.13 81 1.07 91 1.07 32 1.15
75 0.94 46 0.93 52 0.89 60 0.94 17 0.93
78 0.95 53 0.95 60 0.92 66 0.95 25 1.06
AnguillaAntigua and BarbudaArubaBahamasBarbadosBelizeBermudaBritish Virgin IslandsCayman IslandsDominicaGrenadaGuyana4
HaitiJamaicaMontserratNetherlands AntillesSaint Kitts and NevisSaint LuciaSt Vincent/Grenad.SurinameTrinidad and TobagoTurks and Caicos Islands
Argentina5
BoliviaBrazilChileColombiaCosta RicaCubaDominican RepublicEcuadorEl SalvadorGuatemalaHonduras4
MexicoNicaragua4
PanamaParaguayPeruUruguayVenezuela, B. R.
Latin America/Caribbean
Caribbean
Latin America
Developing countries
World
Table 3 (continued)
2006 2006 1999 2006 2006
Country or territoryTotal(%)
GPI(F/M)
Total(%)
GPI(F/M)
Total(%)
GPI(F/M)
Total(%)
GPI(F/M)
Total(%)
GPI(F/M)
GER in lowersecondary
GER in uppersecondary GER in total secondary GER
Secondary educationTertiary
education
The Caribbean
Latin America
Source: EFA Global Monitoring Report 2009, statistical tables; UNESCO Institute for Statistics; CRS online database (OECD-DAC, 2008).
Weighted average Weighted average Weighted average
lac_eng_2009_bat 02 5/12/08 11:50 Page 18

19R E G I O N A L O V E R V I E WL A T I N A M E R I C A A N D T H E C A R I B B E A N
ED
UC
AT
IO
N
FO
R
AL
L
GL
OB
AL
M
ON
IT
OR
IN
G
RE
PO
RT
02
09
… 4.0 0 03.5 … 0 0… 5.1 0 0… … … …
5.3 7.2 0.0 0.45.7 5.8 0.4 9… 1.2 … …… 4.0 … …… 2.9 … …
5.5 … 0.1 8… 6.0 6 3469.3 8.6 3 27… … 17 12… 5.6 5 13… … 0 0.0… … … …
5.6 10.8 0 0.08.0 7.1 0.5 247.2 8.8 0.1 9… … 3 603.9 … 0.0 0.1… … 0.9 149
4.6 4.0 9 25.8 6.6 28 204.0 4.1 10 0.74.0 3.6 2 14.5 4.9 7 15.5 4.9 1 27.7 9.3 0.5 0.6… 3.9 23 192.0 … 8 42.4 3.2 7 8… 2.6 20 10… … 30 274.5 5.6 4 0.34.0 3.3 58 695.1 4.1 0.5 15.1 4.1 6 73.4 2.7 12 32.8 3.0 0.6 2… 3.7 0.7 0.2
4.9 4.1 279 5… 5.8 … …
4.5 4.0 … …
4.5 4.4 3 595 6
4.5 4.9 4 376 8
AnguillaAntigua and Barbuda
ArubaBahamasBarbados
BelizeBermuda
British Virgin IslandsCayman Islands
DominicaGrenadaGuyana 4
HaitiJamaica
MontserratNetherlands AntillesSaint Kitts and Nevis
Saint LuciaSt Vincent/Grenad.
SurinameTrinidad and Tobago
Turks and Caicos Islands
Argentina 5
BoliviaBrazilChile
ColombiaCosta Rica
CubaDominican Republic
EcuadorEl SalvadorGuatemala
Honduras 4
MexicoNicaragua 4
PanamaParaguay
PeruUruguay
Venezuela, B. R.
Latin America/Caribbean
Caribbean
Latin America
Developing countries
World
Total public expenditureon education as %
of GNP
Total aid to basic education
(constant 2006 US$ millions)
Total aid to basiceducation per primary
school-age child(constant 2006 US$)
Country or territory1999 20062005–2006
annual average2005–2006
annual average
Education finance
The Caribbean
Latin America
Data underlined are for 2003. Data in italics are for 2004. Data in bold italics are for 2005. Data in bold are for 2007 or 2006 for survival rate to last grade.1. Data are for the most recent yearavailable during the period specified.2. Data reflect the actual number ofchildren not enrolled at all, derivedfrom the age-specific enrolment ratiosof primary school age children, whichmeasure the proportion of those whoare enrolled in either primary orsecondary school (total primary NER).3. Based on headcounts of pupils and teachers.4. Fast Track Initiatitve (FTI): countries with endorsed sector plans.5. The apparent decrease in totalsecondary education enrolmentbetween 1999 and 2005 is essentiallydue to a change in data reporting.Since 2003, programmes designed for people beyond the regular schoolage (e.g. adult education) have beenexcluded from the figures forsecondary enrolment, leading to a reported decline in the GER. The secondary NER has increased over the period in question.
Weighted averageMedian Sum
lac_eng_2009_bat 02 5/12/08 11:50 Page 19