regional - xinhua08.comupload.xinhua08.com/2012/0824/1345790746945.pdf& regional team p5 food...
TRANSCRIPT

SEE APPENDIX I FOR IMPORTANT DISCLOSURES AND ANALYST CERTIFICATIONS
24 August 2012
Regional Daily
Top Views RG: Consumer Staples Ong Chee Ting
& Regional Team
P5
Food Inflation Focus: Wheat, Corn & Soy - American farmers are facing one of the worst droughts since the 1950s.
The devastation of the key Corn Belt in the United States has led to tight grain supplies, causing corn, wheat, and soybean prices to rally +44.8%, +42.8% and +24.3%, respectively since June.
- While wheat and corn prices may continue to stay high over the next 4-6 months, we anticipate that soybean futures could diverge soon if El Nino materializes.
- Food price impact on segment performance mixed. Key sectors impacted by higher wheat, corn and soy prices are animal feed / poultry /aquaculture producers (corn/soybean), food processors (wheat/palm oil) and CPO plantation (soybean/palm oil). Our analysts favor animal feedmills and food retailing (Siam Makro, Charoen Pokphand Foods and Charoen Pokphand Indonesia); are mildly neutral on CPO planters (First Resources and Sarawak Oil Plantation) but are cognizant that a strong El Nino event could be a rerating trigger because of stronger CPO prices; and, see the highest risk for food processors (Indofood CBP and Universal Robina Corp).
VN: Strategy Michael Kokalari 6 Banker’s Arrest Sends Stocks Plunging - The VN-Index has plunged 10% so far this week because of the arrest of
Nguyen Duc Kien, the founder of Asia Commercial Bank (ACB), for as-yet unspecified crimes related to “illegal trading activities”.
- ACB is the leading private sector bank in Vietnam and 15%-owned by Standard Chartered. According to a bank spokesman, Kien currently owns less than 5% of the bank’s outstanding shares and has no official position at the bank and no influence on its operations. That said, the police have detained ACB’s current CEO for questioning.
- Some observers view the arrest as political theatre between different factions within the government, and believe the current market dip is a buying opportunity because the underlying macro situation is steadily improving. Foreign investors in particular have been fairly actively buying the market this week.
- A more pessimistic interpretation of events is that this arrest is the beginning of more serious trouble ahead for the market due to the intertwined nature of the key players in the banking system. Representatives of Eximbank (EIB), Sacombank (STB), Kien Long Bank and Southern Bank all made announcements to the effect that Kien has no influence over their operations.
P K Basu [email protected] (65) 6432 1821 ONG Seng Yeow [email protected] (852) 2268 0644 Jeremy TAN [email protected] (852) 2268 0635
Today’s Content… Country Regional Agriculture Vietnam Strategy Singapore Land Transport Sector Malaysia Kossan Rubber Industries India Bharat Forge Philippines Philex Mining Corp Vietnam Kinh Do Corporation Philippines July Government Budget
Top Buys…
Company Ticker Spot Target Upside (%)
LICHF LICHF IN 249.80 332.00 32.91 Siam Makro MAKRO TB 364.00 478.00 31.32 B. Armada BAB MK 3.78 4.88 29.10 China State Construction 3311 HK 8.43 10.80 28.11 First Philippine Holdings FPH PM 76.60 97.80 27.68 Venture Corp VMS SP 7.65 9.65 26.14 Yes Bank YES IN 351.70 434.00 23.40 SembMarine SMM SP 5.06 6.20 22.53 Kiatnakin Bank KK TB 40.25 49.00 21.74 KLCC Property KLCC MK 5.48 6.38 16.42 Vinamilk VNM VN 102000 118000 15.69 P. Chem PCHEM MK 6.50 7.50 15.38
Top Sells…
Company Ticker Spot Target Downside (%)
Jai Prakash Associates JPA IN 76.90 47.00 38.88 Ayala Land ALI PM 22.00 15.00 31.82 GMA Network Inc GMAP PM 10.00 6.90 31.00 Uni-President 220 HK 7.64 5.60 26.70
Maybank-KE Events Date Event Location 27-28 Aug Singapore REITs Analyst roadshow HK 18-19 Sep Philippines Strategy roadshow SG/KL 20-21 Sep Philippines Strategy roadshow HK
24 August 2012
Regional Daily
SG: Land Transport Sector Bernard Chin 7 Industrials | Still More to be Made from this Pair Trade - Our Long-ComfortDelGro (CDG), Short-SMRT pair trade has reaped
plump rewards for investors executing our recommendation since our 5 April report with a 15% differential emerging between both stocks for a period of barely four months. Our call remains valid as of today: BUY CDG, SELL SMRT.
- SMRT’s new CEO Mr Desmond Kuek (wef 1 Oct 2012), with deep-seated experience in the Singapore Armed Forces (SAF) should be seen as a natural choice for SMRT’s executive hot seat. We think he will mark his era of leadership with a more regimented approach to operations and maintenance, and in the process spare no expense to fill the gaps left by the previous management regime.
- Earlier this month, CDG announced the AUD53m acquisition of Deane’s Bus Lines Pty Ltd and Transborder Express which will cement CDG’s position as the largest private bus operator in Australia. Management views Australia’s strong economy and continued population growth as growth drivers for transport services, and we are similarly optimistic about its prospects.
SMID Caps 2Q12 REVIEW Mcap USD340M ADTV USD0.2m MY: Kossan Rubber Industries (KRI MK) Lee Yen Ling 8 Industrials | Falling Latex Yet to Play Out | BUY | Upside 14% - 2Q12 net profit of MYR24m (+8% QoQ, +13% YoY) lifted 1H12 net profit
to MYR46m (+4% YoY). - Though 1H12 made up only 45% of our full-year forecast and 42% of
street’s estimates, we consider this to be within expectations as we foresee a stronger 2H12 on lower input costs and contribution from new capacity.
- We think the long-term soft latex price story has yet to play out, given its relatively flattish share price performance and cheap fwd PER of 8.8x. Maintain forecasts, BUY rating and TP of MYR3.75 (10x 2013 PER).
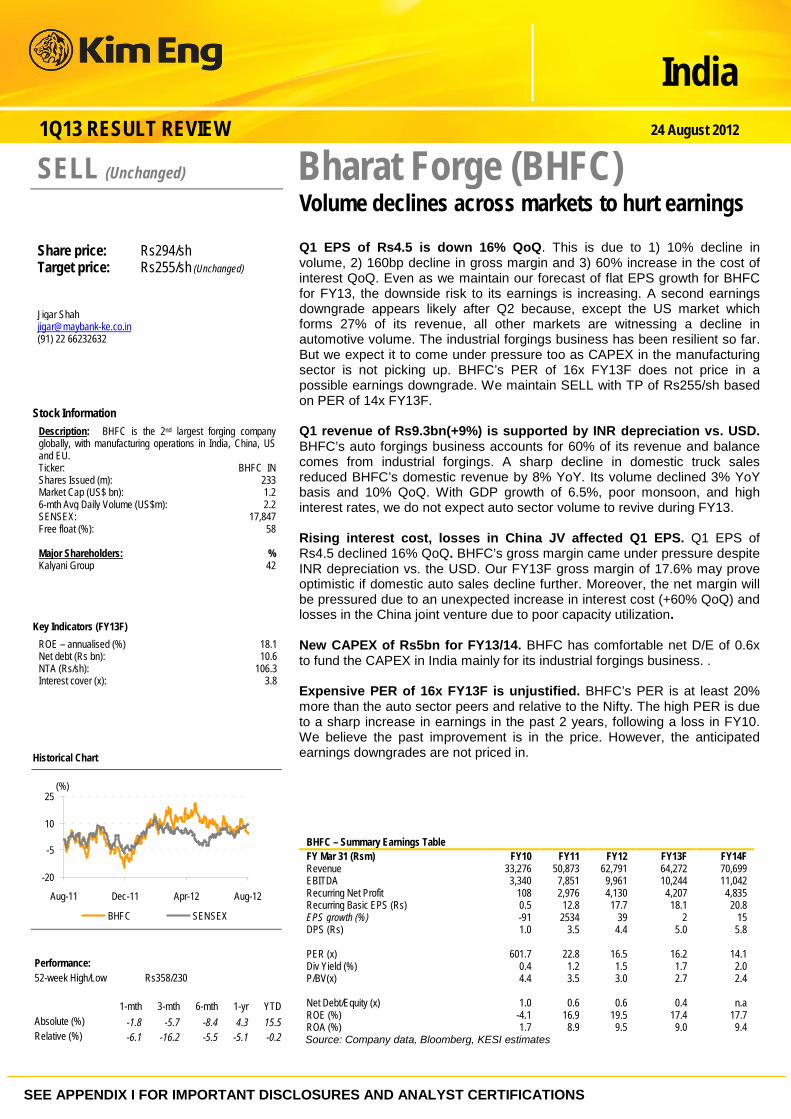
Company Notes 1Q13 REVIEW Mcap USD1.2b ADTV USD2.2m IN: Bharat Forge (BHFC IN) Jigar Shah 9 Industrials | Volume Declines Across Markets to Hurt Earnings | SELL | Upside 13% - Q1 EPS of Rs4.5 is down 16% QoQ. This is due to 1) 10% decline in
volume, 2) 160bp decline in gross margin and 3) 60% increase in the cost of interest QoQ.
- Even as we maintain our forecast of flat EPS growth for BHFC for FY13, the downside risk to its earnings is increasing. A second earnings downgrade appears likely after Q2 because, except the US market which forms 27% of its revenue, all other markets are witnessing a decline in automotive volume. The industrial forgings business has been resilient so far. But we expect it to come under pressure too as CAPEX in the manufacturing sector is not picking up.
- BHFC’s PER of 16x FY13F does not price in a possible earnings downgrade. We maintain SELL with TP of Rs255/sh based on PER of 14x FY13F.

24 August 2012
Regional Daily
2Q12 REVIEW Mcap USD2.2b ADTV USD1.6m PH: Philex Mining Corp (PX PB) Ramon Adviento 10 Mining | Lower Prices Lead to Expected Profit Dip | HOLD | Upside 63.86% - 1H12 reported net income stood at PHP2.04b, a 36.7% drop while profit
to common shareholders declined 34.4% to PHP2.09b, 53% of our full-year forecast of PHP3.92b. Copper prices dropped 13.6% YoY in 1H12 (USD368/lb vs USD426) while gold was relatively flat at USD1,651/oz.
- Continuous rains in a span of two weeks churned the tailings dam of Padcal mine and carried tails over the penstock. The Mines and Geosciences Bureau suspended operations from 1 Aug, and possibly may last for a month or more, depending on when the report is released.
- PX believes that the Silangan copper-gold project points to amenability of the deposit to the block caving mining method, which could change the value of Silangan as mining costs will go down while higher grades will enlarge the deposit.
- We will review our forecasts and valuation for PX. Meanwhile our HOLD rating and PHP30.61/sh target price remain until there is clarity on the suspension order. If operations remain suspended for the year, our NAV would be cut by PHP0.40/sh resulting in PHP30.21/sh.
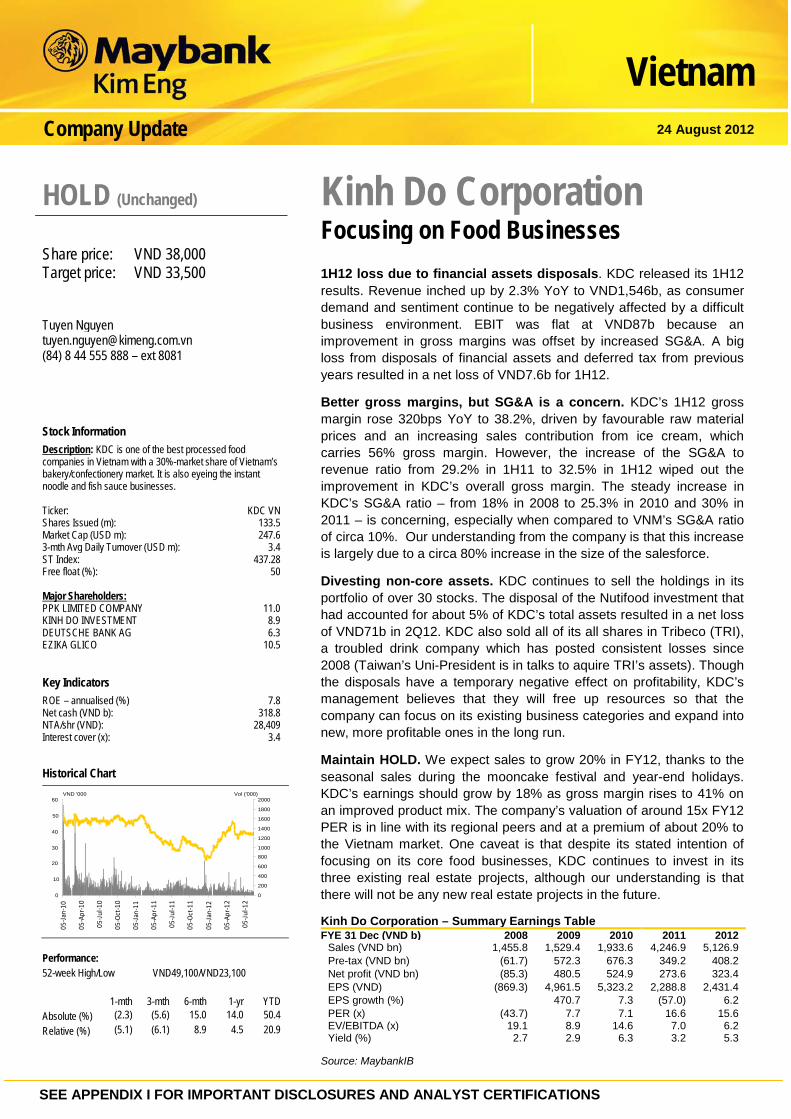
1H12 REVIEW Mcap USD0.23b ADTV USD0.16m VN: Kinh Do Corporation (KDC VN) Tuyen Nguyen 11 Cons. Staples. | Focusing on Food Businesses | HOLD | Downside 6% - KDC’s 1H12 revenue inched up by 2.3% as sales of the company’s
confectionary products were impacted by the economic slowdown in Vietnam. Gross margins improved because of falling input costs but write-downs from asset disposals and rising SG&A costs tipped the company into a net loss of VND1.6b for 1H12.
- Kinh Do’s first half results were disappointing but the losses from asset disposals are part of the company’s efforts to re-focus on its core food business while the steady increase in the company’s SG&A over the last few years is related to its efforts to dramatically expand its sales and distribution capability. Those efforts should eventually lead to a much stronger platform through which the company will be able to sell new food products in the future, although it is clearly taking some time for the new, expanded sales force to start working efficiently.
- We continue to rate the stock a “Hold”, primarily based on valuation of 15x expected F12 earnings versus an expected 6% EPS growth, driven by strong seasonal sales for the rest of the year.

24 August 2012
Regional Daily
Economics PH: July Government Budget Luz Lorenzo 12 Government’s Spending Spree Continues - Total spending by the national government grew 21.8% YoY in July, the
fastest rate this year. Net of interest payments, spending reached PHP756.7b in 7M12, up 15.2%.
- Despite robust spending, the budget deficit for the year is only PHP73.7b. It is likely the annual deficit this year will be lower than the official target of PHP280b (2.6% of GDP) as well as our forecast of PHP257b as the government realizes further revenue from the sale of the Food Terminal Inc complex of PHP24.3b.
- We expect sustained government spending to bolster overall economic activity for the rest of the year even as the economy faces headwinds from stagnant global economic growth that is likely to weigh down on exports. The caveat though is that as government spending started to pick up in 2H11, YoY growth rates for public expenditures in 2H12 may slow when compared with 1H12.

SEE APPENDIX I FOR IMPORTANT DISCLOSURES AND ANALYST CERTIFICATIONS
Sector Update 24 August 2012
PP16832/01/2013 (031128)
Regional
Agriculture Food Inflation: Wheat, Corn & Soybeans
US drought the worst since the 1950s. The devastation of the key Corn Belt in the United States has led to tight grain supplies, causing corn, wheat, and soybean prices to rally +44.8%, +42.8% and +24.3%, respectively since June. The price trends for corn and soybean has even surpassed the previous peak cycle in 2008. Weather patterns are only expected to improve marginally but the situation remains dire until South American crops come to harvest in early 2013.
El Nino may bring some respite to America’s farmers. A developing El Nino weather pattern has been picked up by key meteorological bureaus including the US Climate Prediction Center, a part of NOAA. El Nino can increase rainfall to the Americas and raise the prospect of a bumper harvest in South America. Because of better grain economics, we believe that South American farmers will likely favor soybean over other grain types in the upcoming planting season which begins in earnest in Sep/Oct.
Wheat, corn & soy prices to diverge. While wheat and corn prices may continue to stay high over the next 4-6 months, we anticipate that soybean futures could diverge soon if El Nino materializes. El Nino however tends to be inflationary for CPO as the drier weather in Asia curtails production output and crimps supply. Food price impact on segment performance mixed. Key sectors impacted by higher wheat, corn and soy prices are animal feed / poultry /aquaculture producers (corn/soybean), food processors (wheat/palm oil) and CPO plantation (soybean/palm oil). Our analysts favor animal feedmills and food retailing (Siam Makro, Charoen Pokphand Foods and Charoen Pokphand Indonesia), are mildly neutral on CPO planters (First Resources and Sarawak Oil Plantation) but are cognizant that a strong El Nino can be a catalyst for stronger CPO prices, and see the highest risk for food processors (Indofood CBP and Universal Robina Corp).
Mkt Cap Current Px Target Px PE (x) EPS Growth PB (x) ROE (%) Yield (%)
Company Rec (USD m) (local curr) (local curr) Current Fwd 2012F 2013F 2012 2012 2012 Winners Charoen Pokphand Foods BUY 8,173 33.25 38.00 15.4 20.1 (23.7) 54.7 2.5 24.8 3.9 Siam Makro BUY 2,644 345.0 478.00 31.8 25.0 36.2 18.7 8.3 30.0 3.6 Charoen Pokphand Indonesia BUY 5,093 2,950 3,500 16.2 14.8 26.9 9.7 5.9 36.4 1.9 Sarawak Oil Palms BUY 1,670 6.9 8 12.2 13.2 58.9 (8.0) 2.1 17.0 0.5 First Resources BUY 2,750 2.10 2.15 15.5 20.3 54.4 (0.3) 2.4 16.5 2.2 Losers Indofood CBP SELL 4,015 6,350 7,050 14.4 12.1 34.4 19.3 3.1 21.7 2.1 China Yurun SELL 1,302 5.57 4.33 N/A N/A N/A N/A 0.6 N/A N/A Jollibee Foods Corp HOLD 2,386 96.75 101.00 25.3 21.9 23.0 15.7 4.7 19.3 1.3 Universal Robina Corp HOLD 3,132 61.2 63.50 19.3 15.8 11.4 22.0 2.6 14.5 3.1
Analysts
ONG Chee Ting [email protected] (603) 2297 8678 ONG Seng Yeow [email protected] (852) 2268 0644 Maria LAPIZ [email protected] (66) 2257 0250 Katarina SETIAWAN [email protected] (62) 21 2557 1125 Edward FUNG [email protected] (852) 2268 0632 Lovell SARREAL [email protected] (63) 2 849 8841 Adi Wicaksono [email protected] (62) 21 2557 1130
SEE APPENDIX I FOR IMPORTANT DISCLOSURES AND ANALYST CERTIFICATIONS
Strategy 24 August 2012
Vietnam
Banker’s Arrest Sends Stocks Plunging
ACB founder arrested. The arrest on Monday evening of Nguyen Duc Kien, the founder of Asia Commercial Bank (ACB), caused the VN-Index to decline 10% from Tuesday to Thursday this week. The following is a summary of information in the local Vietnamese press. In addition to this officially-sanctioned information, a considerable number of unpublished rumours are circulating around the stock market in Vietnam, some of which seem implausible.
Leading private sector bank. ACB is the leading private sector bank in Vietnam by assets, widely considered to be the best-managed bank and 15%-owned by Standard Chartered. The perception of ACB’s high quality has caused the stock to trade at about a 30% valuation premium to the rest of the private sector banks.
Arrest details not fully released yet. The Police Ministry and the central bank have said that Kien’s arrest is not related to ACB, but police have held ACB’s current CEO Ly Xuan Hai for questioning. An ACB spokesman said that the matter is a “personal issue of Kien’s”, that Kien holds less than 5% of ACB’s outstanding shares and that he is no longer a member of the board of directors. SBV governor Binh said that “three companies founded by Kien were detected to have conducted illegal trading activities”, the penalty for which could be two years in jail.
SBV provides liquidity support. The central bank has pledged to support ACB’s liquidity “in the event of a run on the bank”. Also, ACB’s branch directors and deputy directors were instructed not to leave their branches to bolster depositor confidence. We estimate that about USD400m was withdrawn from ACB in the first two days following Kien’s arrest. Our understanding is that the central bank has injected nearly USD1b into the banking system this week, about USD330m of which went to ACB.
Market impact – the benign case. Some observers view Kien’s arrest as political theatre between different factions within the government. Over the last few months, those factions have taken their infighting public by issuing statements in the local news media. One theory is that the arrest is an escalation of that infighting, and that the matter will be cleared up within weeks. In that case, the market’s current dip is a buying opportunity because the underlying macro situation is steadily improving, although stock prices will probably be somewhat constrained by these concerns for the rest of the year. Foreign investors, who have been buying stocks fairly aggressively this week, presumably take this view. An even more positive interpretation of events is that this is the beginning of a concerted crackdown on corruption to reassure Vietnam’s citizens that “wealth does not buy power”.
Market impact – the malign case. A more pessimistic interpretation is that this arrest is the beginning of more serious trouble ahead for the market due to the intertwined nature of the key players in the banking system. This view is best summarised by Harvard professor Jonathan Pincus’ comments: “It’s like a spaghetti bowl… It’s very difficult to untangle the relationships… [which] presents a very difficult governance problem for the financial system”. Representatives of Eximbank (EIB), Sacombank (STB), Kien Long Bank and Southern Bank all made announcements to the effect that Kien has no influence over their operations.
Michael Kokalari, CFA [email protected] (84) 8 3838 6647

SEE APPENDIX I FOR IMPORTANT DISCLOSURES AND ANALYST CERTIFICATIONS
Sector Update 24 August 2012
Singapore
Co. Reg No: 198700034E MICA (P) : 099/03/2012
Land Transport Sector Still More to be Made from this Pair Trade
Pair trade still going strong. Our Long-ComfortDelGro (CDG), Short-SMRT pair trade has reaped plump rewards for investors executing our recommendation since our 5 April report with a 15% differential emerging between both stocks for a period of barely four months. Our call remains valid as we stand by our SELL call for SMRT on operating cost and cashflow concerns crimping dividends. CDG remains our pick in the land transport sector, led by their overseas businesses.
SMRT: Ushering in a new era. SMRT’s new CEO Mr Desmond Kuek (wef 1 Oct 2012), with deep-seated experience in the Singapore Armed Forces (SAF) should be seen as a natural choice for SMRT’s executive hot seat. We think he will mark his era of leadership with a more regimented approach to operations and maintenance, and in the process spare no expense to fill the gaps left by the previous management regime. This reaffirms our expectation that dividends would be further cut from the previous year to manage the weight of an increased maintenance burden on profitability and cashflow.
CDG: Australian buy points the way overseas. Earlier this month, CDG announced the AUD53m acquisition of Deane’s Bus Lines Pty Ltd and Transborder Express which will cement CDG’s position as the largest private bus operator in Australia. Management views Australia’s strong economy and continued population growth as growth drivers for transport services, and we are similarly optimistic about its prospects.
Latest quarter nothing to shout about. There were few surprises in SMRT and CDG’s latest 1QFY3/13 and 2Q2012 results respectively. The common theme was a challenging environment for Singapore-based operations, mainly hampered by losses in core bus segments which suffered from higher staff costs. On a more positive note, the taxi businesses were highlights for both companies.
Pick CDG the global leader, SELL SMRT. We see recent events not moving the needle as yet: SMRT’s new CEO will likely take swift action, but his moves will take time to show results, while CDG’s Deane’s acquisition reinforces our expectations of overseas growth. We maintain our preference for CDG based on its global operations’ diversification and growth while SMRT’s business remains largely domestic, and public pressure on maintenance and fare increases continue to pose a drag on profitability. BUY CDG, SELL SMRT.
Sector Summary Company ------ EPS ----- --- EPS Growth --- Rec Price TP Y+1 Y+2 Y+1 Y+2 PE Div Yield (SGD) (SGD) (SG cts) (SG cts) (%) (%) (x) (%)
SMRT Corp SELL 1.670 1.38 9.2 9.2 16.6 -0.5 18.3 4.0 ComfortDelGro BUY 1.680 1.94 12.1 12.8 5.0 5.3 13.8 3.9 Sector Average 16.1 4.0 Source: Bloomberg, Maybank KE
Bernard Chin [email protected] (65) 6433 5726

SEE APPENDIX I FOR IMPORTANT DISCLOSURES AND ANALYST CERTIFICATIONS
Results Review 24 August 2012
PP16832/01/2013 (031128)
Malaysia
Kossan Rubber Industries Falling latex yet to play out
Good results. 2Q12 net profit of MYR24m (+8% QoQ, +13% YoY) lifted 1H12 net profit to MYR46m (+4% YoY). Though 1H12 made up 45% of our full-year forecast and 42% of street’s estimates, we consider this to be within expectations as we foresee a stronger 2H12 on lower input costs and contribution from new capacity. We think the long-term soft latex price story has yet to play out, given its relatively flattish share price performance and cheap fwd PER of 8.8x. Maintain forecasts, BUY rating and TP of MYR3.75 (10x 2013 PER).
Driven by higher sales volume, lower latex cost. Stronger net profit of MYR24m (+8% QoQ, +13% YoY) was derived from: (i) higher sales volume of 2.6b pcs (+5% QoQ, +27% YoY); (ii) slightly higher EBIT margin of 11% (+0.2-ppt QoQ, +0.4-ppt YoY) on lower latex input cost (-12% QoQ) and stronger USD:MYR (+3% QoQ); and (iii) clean-room division remained in a minor loss of MYR0.3m owing to development cost. The sales volume product mix between latex:nitrile gloves is 53:47.
Expect stronger earnings in 2H on: (i) enhanced margins on lower input costs. Both latex and NBR costs have dropped 15% QoQ and 23% QoQ respectively in 3Q12; and (ii) higher sales volume from new capacities. The new 1.25b pcs nitrile capacity (+11% to existing total capacity) is currently under trial run and full commercialization is expected by Sep 2012. Additionally, Kossan also aims to commence 700m pcs surgical capacity by Nov 2012.
Softer latex price outlook. Despite the intervention scheme by Thai government since May 2012 (bought 80,000 tonnes rubber sheets from farmers), latex price continued to slide to RM5.50/kg now (-36% YoY). Going forward, Thai government is looking to spend another USD476m on buying rubber sheets from farmers, indicating 187,500 tonnes of rubber sheet (or c.2% of global production). We continue to think that it is inefficient to fight market forces and believe latex price will remain soft owing to weaker global demand and rising rubber output.
Kossan – Summary Earnings Table FYE (MYR m) 2010A 2011A 2012F 2013F 2014F Revenue 1,046.9 1,092.1 1,204.2 1,305.7 1,325.9 EBITDA 181.7 161.7 178.3 204.6 204.3 Recurring Net Profit 113.4 91.4 100.5 119.4 121.1 Recurring Basic EPS (cents) 35.5 28.6 31.4 37.4 37.9 EPS growth (%) (5.2) (19.4) 10.0 18.8 1.4 DPS (cents) 8.0 4.0 6.0 7.0 8.0 PER 9.3 11.5 10.5 8.8 8.7 EV/EBITDA (x) 6.3 7.2 6.3 5.1 4.7 Div Yield (%) 2.4 1.2 1.8 2.1 2.4 P/BV(x) 2.4 2.1 1.8 1.6 1.4 Net Gearing (%) 19.5 21.6 11.0 (0.3) (10.9) ROE (%) 25.6 18.3 17.3 17.6 15.7 ROA (%) 14.6 11.2 11.2 12.1 11.7 Consensus Net Profit (MYR m) - - 109.3 122.2 136.0
Source: Maybank KE
BUY (Unchanged) Share price: MYR3.29 Target price: MYR3.75 (unchanged) Lee Yen Ling [email protected] (03) 2297 8691
Stock Information Description: Balanced latex and nitrile glove OEM Ticker: KRI MK Shares Issued (m): 319.7 Market Cap (MYR m): 1,051.9 3-mth Avg Daily Turnover (USD m): 0.19 KLCI: 1,651.61 Free float (%): 34.9 Major Shareholders: % KOSSAN HOLDINGS SDN 51.8 KUMPULAN WANG PERSAR 7.6 EMPLOYEES PROVIDENT 5.0
Key Indicators Net cash / (debt) (MYR m): (98.1) NTA/shr (MYR): 1.68 Net gearing (x): 0.2
Historical Chart
0.00.51.01.52.02.53.03.54.0
Aug-10 Dec-10 Apr-11 Aug-11 Dec-11 Apr-12
KRI MK Equity
Performance: 52-week High/Low MYR3.67/MYR2.48 1-mth 3-mth 6-mth 1-yr YTD Absolute (%) 5.8 2.8 19.2 18.3 1.2 Relative (%) 4.6 (1.5) 5.3 5.9 (6.7)
SEE APPENDIX I FOR IMPORTANT DISCLOSURES AND ANALYST CERTIFICATIONS
1Q13 RESULT REVIEW 24 August 2012
India
Bharat Forge (BHFC) Volume declines across markets to hurt earnings
Q1 EPS of Rs4.5 is down 16% QoQ. This is due to 1) 10% decline in volume, 2) 160bp decline in gross margin and 3) 60% increase in the cost of interest QoQ. Even as we maintain our forecast of flat EPS growth for BHFC for FY13, the downside risk to its earnings is increasing. A second earnings downgrade appears likely after Q2 because, except the US market which forms 27% of its revenue, all other markets are witnessing a decline in automotive volume. The industrial forgings business has been resilient so far. But we expect it to come under pressure too as CAPEX in the manufacturing sector is not picking up. BHFC’s PER of 16x FY13F does not price in a possible earnings downgrade. We maintain SELL with TP of Rs255/sh based on PER of 14x FY13F. Q1 revenue of Rs9.3bn(+9%) is supported by INR depreciation vs. USD. BHFC’s auto forgings business accounts for 60% of its revenue and balance comes from industrial forgings. A sharp decline in domestic truck sales reduced BHFC’s domestic revenue by 8% YoY. Its volume declined 3% YoY basis and 10% QoQ. With GDP growth of 6.5%, poor monsoon, and high interest rates, we do not expect auto sector volume to revive during FY13. Rising interest cost, losses in China JV affected Q1 EPS. Q1 EPS of Rs4.5 declined 16% QoQ. BHFC’s gross margin came under pressure despite INR depreciation vs. the USD. Our FY13F gross margin of 17.6% may prove optimistic if domestic auto sales decline further. Moreover, the net margin will be pressured due to an unexpected increase in interest cost (+60% QoQ) and losses in the China joint venture due to poor capacity utilization. New CAPEX of Rs5bn for FY13/14. BHFC has comfortable net D/E of 0.6x to fund the CAPEX in India mainly for its industrial forgings business. . Expensive PER of 16x FY13F is unjustified. BHFC’s PER is at least 20% more than the auto sector peers and relative to the Nifty. The high PER is due to a sharp increase in earnings in the past 2 years, following a loss in FY10. We believe the past improvement is in the price. However, the anticipated earnings downgrades are not priced in.
BHFC – Summary Earnings Table FY Mar 31 (Rsm) FY10 FY11 FY12 FY13F FY14F Revenue 33,276 50,873 62,791 64,272 70,699 EBITDA 3,340 7,851 9,961 10,244 11,042 Recurring Net Profit 108 2,976 4,130 4,207 4,835 Recurring Basic EPS (Rs) 0.5 12.8 17.7 18.1 20.8 EPS growth (%) -91 2534 39 2 15 DPS (Rs) 1.0 3.5 4.4 5.0 5.8 PER (x) 601.7 22.8 16.5 16.2 14.1 Div Yield (%) 0.4 1.2 1.5 1.7 2.0 P/BV(x) 4.4 3.5 3.0 2.7 2.4 Net Debt/Equity (x) 1.0 0.6 0.6 0.4 n.a ROE (%) -4.1 16.9 19.5 17.4 17.7 ROA (%) 1.7 8.9 9.5 9.0 9.4 Source: Company data, Bloomberg, KESI estimates
SELL (Unchanged) Share price: Rs294/sh Target price: Rs255/sh (Unchanged) Jigar Shah [email protected] (91) 22 66232632
Stock Information Description: BHFC is the 2nd largest forging company globally, with manufacturing operations in India, China, US and EU. Ticker: BHFC IN Shares Issued (m): 233 Market Cap (US$ bn): 1.2 6-mth Avg Daily Volume (US$m): 2.2 SENSEX: 17,847 Free float (%): 58 Major Shareholders: % Kalyani Group 42
Key Indicators (FY13F) ROE – annualised (%) 18.1 Net debt (Rs bn): 10.6 NTA (Rs/sh): 106.3 Interest cover (x): 3.8
Historical Chart
-20
-5
10
25
Aug-11 Dec-11 Apr-12 Aug-12
(%)
BHFC SENSEX
Performance: 52-week High/Low Rs358/230 1-mth 3-mth 6-mth 1-yr YTD Absolute (%) -1.8 -5.7 -8.4 4.3 15.5 Relative (%) -6.1 -16.2 -5.5 -5.1 -0.2

SEE APPENDIX I FOR IMPORTANT DISCLOSURES AND ANALYST CERTIFICATIONS
Philippines
Interim results
24 August 2012
Philex Mining Corp Lower prices lead to expected profit dip
1H12 profit down 37%. Copper prices dropped 13.6% YoY in 1H12 (USD368/lb vs USD426) while gold was relatively flat at USD1,651/oz. Production hikes by Philiex Mining Corp (PX) did not compensate for the drop in revenues/tonne as prices declined. As a result, gold revenues were lower 7.5% and copper by 1.8%. 1H12 reported net income stood at PHP2.04b, a 36.7% drop while profit to common shareholders declined 34.4% to PHP2.09b, 53% of our full-year forecast of PHP3.92b. Exacerbating the situation were lower grades encountered in 1H12. Copper was hitting grade of 0.215% instead of 0.225% achieved in 1H11 and gold was below 0.5 gpt. However, the start of 2H12 saw grades starting to move up. Two typhoons and monsoon rains inundate tailings dam. In a span of two weeks, continuous rains brought about by two typhoons and the southwest monsoon churned the tailings dam of Padcal mine and carried tails over the penstock. The Mines and Geosciences Bureau (MGB) suspended operations from 1 Aug and will lift the order after repair of the leak and, possibly, preliminary results from desilting operations. The duration of work stoppage may be a month or more, depending on when the report is released. Work is now focused on clean-up operations. Exploration work on schedule. After a problematic start in the down ramp access to the Boyongan deposit of the Silangan copper-gold project, the drive has been steady and continuous. PX is confident their target for SRK Consulting to validate the mining method and thus the mineral resources and mineable reserves come December to January is on track. PX believes the material being encountered points to amenability of the deposit to the block caving mining method. That potentially could change the value of Silangan as mining costs will go down while higher grades as compared with Padcal will enlarge the deposit to 1.0b tonnes from 200m. Meanwhile, drills in the Kalayaan mining tenement are rumored to be yielding good results. Forecast review. With weak commodity prices and Padcal operations still suspended, we will review our forecasts and valuation for PX. Meanwhile our HOLD rating stays until there is clarity on the suspension order. Should operations remain suspended for the year we expect 2012 profit to range between PHP2.176b to PHP2.2b, which could cut by about PHP0.40/sh our NAV resulting in PHP30.21/sh. Philex Mining Corp– Summary Earnings Table FY 31 Dec (PHPm) 2009A 2010A 2011A 2012F 2013F Revenue 9,055 13,394 16,134 11,915 12,626 EBITDA 3,102 6,953 8,886 6,602 7,219 Net Profit to Common 2,830 3,963 5,771 3,923 4,350 EPS (PHP) 0.58 0.81 1.17 0.80 0.89 EPS growth (%) (12.7) 38.7 45.6 (32.0) 10.9 DPS (PHP) 0.00 0.13 0.33 0.29 0.20 PER 32.4 23.4 16.1 23.6 21.3 EV/EBITDA (x) 28.7 12.8 10.0 12.8 11.4 Div Yield (%) 0.0 0.7 1.8 1.6 1.1 P/BV(x) 5.4 4.5 3.5 3.2 2.9 Net Gearing (%) (16.3) (17.5) (13.3) (28.6) (32.5) ROE (%) 20.3 21.2 24.6 14.2 14.3 ROA (%) 14.3 16.9 19.8 11.6 11.9 Consensus Net Profit (PHPm) na na na 5,131 4,662 Source: PX, Maybank ATR Kim Eng Securities, Inc
HOLD (Unchanged) Share price: PHP18.86 Target price: PHP30.61 Ramon Adviento [email protected] (632) 849 8842
Stock Information Description: PX is the largest listed mining company in the Philippines. It is primarily engaged in mining and oil and gas exploration. Ticker: PX PM / PX.PS Shares Issued (m): 4,933 Market Cap (PHPm): 93,036 Market Cap (USDm): 2,209 3-mth Avg Daily Value (USDm): 1.62 PSEi: 5,202.84 Free float (%): 32.00 Major Shareholders: % FIRST PACIFIC CO. 21.57 SOCIAL SECURITY SYSTEM 21.07 TWO RIVERS PACIFIC HOLDINGS 14.98 Key Indicators ROE – annualised (%) 14.2 Net debt (PHPm): (8,466.5) NTA/shr (PHP): 5.8 Interest cover (x): 342.6
Historical Chart
PX PM
911131517192123252729
Aug-10 Dec-10 Apr-11 Aug-11 Dec-11 Apr-12 Aug-12 Source: Bloomberg
Performance: 52-week High/Low PHP28.50/ PHP18.40 1-mth 3-mth 6-mth 1-yr YTD Absolute (%) (12.69) (23.95) (11.25) (33.36) (8.45) Relative (%) (13.92) (29.52) (17.57) (52.27) (26.77)
SEE APPENDIX I FOR IMPORTANT DISCLOSURES AND ANALYST CERTIFICATIONS
Company Update 24 August 2012
Vietnam
Kinh Do Corporation Focusing on Food Businesses
1H12 loss due to financial assets disposals. KDC released its 1H12 results. Revenue inched up by 2.3% YoY to VND1,546b, as consumer demand and sentiment continue to be negatively affected by a difficult business environment. EBIT was flat at VND87b because an improvement in gross margins was offset by increased SG&A. A big loss from disposals of financial assets and deferred tax from previous years resulted in a net loss of VND7.6b for 1H12.
Better gross margins, but SG&A is a concern. KDC’s 1H12 gross margin rose 320bps YoY to 38.2%, driven by favourable raw material prices and an increasing sales contribution from ice cream, which carries 56% gross margin. However, the increase of the SG&A to revenue ratio from 29.2% in 1H11 to 32.5% in 1H12 wiped out the improvement in KDC’s overall gross margin. The steady increase in KDC’s SG&A ratio – from 18% in 2008 to 25.3% in 2010 and 30% in 2011 – is concerning, especially when compared to VNM’s SG&A ratio of circa 10%. Our understanding from the company is that this increase is largely due to a circa 80% increase in the size of the salesforce.
Divesting non-core assets. KDC continues to sell the holdings in its portfolio of over 30 stocks. The disposal of the Nutifood investment that had accounted for about 5% of KDC’s total assets resulted in a net loss of VND71b in 2Q12. KDC also sold all of its all shares in Tribeco (TRI), a troubled drink company which has posted consistent losses since 2008 (Taiwan’s Uni-President is in talks to aquire TRI’s assets). Though the disposals have a temporary negative effect on profitability, KDC’s management believes that they will free up resources so that the company can focus on its existing business categories and expand into new, more profitable ones in the long run.
Maintain HOLD. We expect sales to grow 20% in FY12, thanks to the seasonal sales during the mooncake festival and year-end holidays. KDC’s earnings should grow by 18% as gross margin rises to 41% on an improved product mix. The company’s valuation of around 15x FY12 PER is in line with its regional peers and at a premium of about 20% to the Vietnam market. One caveat is that despite its stated intention of focusing on its core food businesses, KDC continues to invest in its three existing real estate projects, although our understanding is that there will not be any new real estate projects in the future.
Kinh Do Corporation – Summary Earnings Table FYE 31 Dec (VND b) 2008 2009 2010 2011 2012
Sales (VND bn) 1,455.8 1,529.4 1,933.6 4,246.9 5,126.9 Pre-tax (VND bn) (61.7) 572.3 676.3 349.2 408.2 Net profit (VND bn) (85.3) 480.5 524.9 273.6 323.4 EPS (VND) (869.3) 4,961.5 5,323.2 2,288.8 2,431.4 EPS growth (%) 470.7 7.3 (57.0) 6.2 PER (x) (43.7) 7.7 7.1 16.6 15.6 EV/EBITDA (x) 19.1 8.9 14.6 7.0 6.2 Yield (%) 2.7 2.9 6.3 3.2 5.3
Source: MaybankIB
HOLD (Unchanged) Share price: VND 38,000 Target price: VND 33,500 Tuyen Nguyen [email protected] (84) 8 44 555 888 – ext 8081 Stock Information Description: KDC is one of the best processed food companies in Vietnam with a 30%-market share of Vietnam’s bakery/confectionery market. It is also eyeing the instant noodle and fish sauce businesses. Ticker: KDC VN Shares Issued (m): 133.5 Market Cap (USD m): 247.6 3-mth Avg Daily Turnover (USD m): 3.4 ST Index: 437.28 Free float (%): 50 Major Shareholders: PPK LIMITED COMPANY 11.0 KINH DO INVESTMENT 8.9 DEUTSCHE BANK AG 6.3 EZIKA GLICO 10.5 Key Indicators ROE – annualised (%) 7.8 Net cash (VND b): 318.8 NTA/shr (VND): 28,409 Interest cover (x): 3.4
Historical Chart
0
10
20
30
40
50
60
05-Ja
n-10
05-A
pr-1
0
05-Ju
l-10
05-O
ct-1
0
05-Ja
n-11
05-A
pr-1
1
05-Ju
l-11
05-O
ct-1
1
05-Ja
n-12
05-A
pr-1
2
05-Ju
l-12
VND '000
0
200
400
600
800
1000
1200
1400
1600
1800
2000Vol ('000)
Performance: 52-week High/Low VND49,100/VND23,100 1-mth 3-mth 6-mth 1-yr YTD Absolute (%) (2.3) (5.6) 15.0 14.0 50.4 Relative (%) (5.1) (6.1) 8.9 4.5 20.9

SEE APPENDIX I FOR IMPORTANT DISCLOSURES AND ANALYST CERTIFICATIONS
Philippines Economics 24 August 2012
Economic Focus Government’s spending spree continues
July expenditures increased 21%. Spending by the national government has been robust this year in contrast with 2011. The trend was sustained in July as total expenditures grew 21.8% YoY to PHP162.6b, the fastest rate this year. More importantly, net of interest payments, expenditures rose 20.6% to PHP111.3b, second only to March’s increase of 25.6%. This brought spending less interest payments in 7M12 to PHP756.7b, up 15.2% compared with a decline of 10.7% in 7M11 (Figure 1). According to the budget secretary, infrastructure spending for the year jumped over 60% while maintenance and other operating expenditures climbed more than 30%.
Budget deficit remains a non-issue. Despite robust spending, the budget deficit for July of PHP39.2b brought the national government’s 7M12 total deficit to only PHP73.7b, way below the target PHP183.3b for 9M12. This was because revenues grew 15.3% in July to PHP123.3b and 12.1% PHP884.2b in 7M12. The official target deficit this year is 2.6% of GDP or PHP280b. But given the progress thus far on collections and expenditures, it is likely the actual deficit this year will be lower than the official target as well as our forecast of PHP257b or 2.4% of GDP. In 2011, the budget deficit was PHP197.8b, 2% of GDP.
First asset sale in Aquino administration. The probability of a lower-than-expected budget deficit is heightened by the favorable outcome of the Aquino government’s first asset sale. This was the auction in mid-August of 74 hectares in the Food Terminal Inc complex which was awarded to blue chip property developer Ayala Land Inc (ALI – HOLD). The winning bid of PHP24.3b was more than double the reserve price of PHP10.2b. The government likely will receive PHP19.5b in October and the balance a year after. The property sale was notable not only for the substantial surplus over the government’s minimum price but also that a winner emerged after two failed auctions, the last in 2009. Proceeds of the sale will go to the Department of Agrarian Reform and the Department of Agriculture.
Government spending to bolster domestic demand. In 1Q12, real GDP growth of 6.4% YoY was aided by government spending, up a nominal 14.6%. Although 2Q12 nominal spending was slightly slower at 13.5%, we believe it will continue to contribute to healthy 2Q12 GDP growth, which we forecast at 6%. We expect sustained government spending to bolster overall economic activity for the rest of the year even as the economy faces headwinds from stagnant global economic growth that is likely to weigh down on exports. Already, merchandise exports in nominal US dollars slowed to 4.2% YoY in June to USD4.3b, slower than the 19.7% spike in May. The caveat though is that as government spending started to pick up in 2H11 (Figure 2), YoY growth rates for public expenditures in 2H12 may slow when compared with 1H12.
Luz Lorenzo [email protected] +63 2 849 8836

24 August 2012
Regional Daily
RESEARCH OFFICES REGIONAL
P K BASU Regional Head, Research & Economics (65) 6432 1821 [email protected]
WONG Chew Hann, CA Acting Regional Head of Institutional Research (603) 2297 8686 [email protected]
THAM Mun Hon Regional Strategist (852) 2268 0630 [email protected]
ONG Seng Yeow Regional Products & Planning (852) 2268 0644 [email protected]
ECONOMICS Suhaimi ILIAS Chief Economist Singapore | Malaysia (603) 2297 8682 [email protected]
Luz LORENZO Economist Philippines | Indonesia (63) 2 849 8836 [email protected]
MALAYSIA WONG Chew Hann, CA Head of Research (603) 2297 8686 [email protected] Strategy Construction & Infrastructure Desmond CH’NG, ACA (603) 2297 8680 [email protected] Banking - Regional LIAW Thong Jung (603) 2297 8688 [email protected] Oil & Gas Automotive Shipping ONG Chee Ting (603) 2297 8678 [email protected] Plantations Mohshin AZIZ (603) 2297 8692 [email protected] Aviation Petrochem Power YIN Shao Yang, CPA (603) 2297 8916 [email protected] Gaming – Regional Media Power WONG Wei Sum, CFA (603) 2297 8679 [email protected] Property & REITs LEE Yen Ling (603) 2297 8691 [email protected] Building Materials Manufacturing Technology
LEE Cheng Hooi Head of Retail [email protected] Technicals
HONG KONG / CHINA Edward FUNG Head of Research (852) 2268 0632 [email protected] Construction Ivan CHEUNG, CFA (852) 2268 0634 [email protected] Property Industrial Ivan LI, CFA (852) 2268 0641 [email protected] Banking & Finance Jacqueline KO, CFA (852) 2268 0633 [email protected] Consumer Staples Andy POON (852) 2268 0645 [email protected] Telecom & equipment Alex YEUNG (852) 2268 0636 [email protected] Industrial
INDIA Jigar SHAH Head of Research (91) 22 6623 2601 [email protected] Oil & Gas Automobile Cement Anubhav GUPTA (91) 22 6623 2605 [email protected] Metal & Mining Capital goods Property Ganesh RAM (91) 226623 2607 [email protected] Telecom Contractor
SINGAPORE Stephanie WONG Head of Research (65) 6432 1451 [email protected] Strategy Small & Mid Caps Gregory YAP (65) 6432 1450 [email protected] Technology & Manufacturing Telcos - Regional Wilson LIEW (65) 6432 1454 [email protected] Hotel & Resort Property & Construction James KOH (65) 6432 1431 [email protected] Logistics Resources Consumer Small & Mid Caps YEAK Chee Keong, CFA (65) 6433 5730 [email protected] Healthcare Offshore & Marine Alison FOK (65) 6433 5745 [email protected] Services S-chips Bernard CHIN (65) 6433 5726 [email protected] Transport (Land, Shipping & Aviation) ONG Kian Lin (65) 6432 1470 [email protected] REITs / Property Wei Bin (65) 6432 1455 [email protected] S-chips Small & Mid Caps
INDONESIA Katarina SETIAWAN Head of Research (62) 21 2557 1125 [email protected] Consumer Strategy Telcos Lucky ARIESANDI, CFA (62) 21 2557 1127 [email protected] Base metals Coal Oil & Gas Rahmi MARINA (62) 21 2557 1128 [email protected] Banking Multifinance Pandu ANUGRAH (62) 21 2557 1137 [email protected] Auto Heavy equipment Plantation Toll road Adi N. WICAKSONO (62) 21 2557 1130 [email protected] Generalist Anthony YUNUS (62) 21 2557 1134 [email protected] Cement Infrastructure Property Arwani PRANADJAYA (62) 21 2557 1129 [email protected] Technicals
PHILIPPINES Luz LORENZO Head of Research +63 2 849 8836 [email protected] Strategy Laura DY-LIACCO (63) 2 849 8840 [email protected] Utilities Conglomerates Telcos Lovell SARREAL (63) 2 849 8841 [email protected] Consumer Media Cement Kenneth NERECINA (63) 2 849 8839 [email protected] Conglomerates Property Ports/ Logistics Katherine TAN (63) 2 849 8843 [email protected] Banks Construction Ramon ADVIENTO (63) 2 849 8842 [email protected] Mining
THAILAND Mayuree CHOWVIKRAN Head of Research (66) 2658 6300 ext 1440 [email protected] Strategy
Maria BRENDA SANCHEZ LAPIZ Co-Head of Research Dir (66) 2257 0250 | (66) 2658 6300 ext 1399 [email protected] Consumer/ Big Caps
Andrew STOTZ Strategist (66) 2658 6300 ext 5091 [email protected]
Suttatip PEERASUB (66) 2658 6300 ext 1430 [email protected] Media Commerce Sutthichai KUMWORACHAI (66) 2658 6300 ext 1400 [email protected] Energy Petrochem Termporn TANTIVIVAT (66) 2658 6300 ext 1520 [email protected] Property Woraphon WIROONSRI (66) 2658 6300 ext 1560 [email protected] Banking & Finance Jaroonpan WATTANAWONG (66) 2658 6300 ext 1404 [email protected] Transportation Small cap. Suchot THIRAWANNARAT (66) 2658 6300 ext 1550 [email protected] Automotive Construction Materials Soft commodity Pongrat RATANATAVANANANDA (66) 2658 6300 ext 1398 [email protected] Services/ Small Caps
VIETNAM Michael KOKALARI, CFA Head of Research +84 838 38 66 47 [email protected] Strategy Nguyen Thi Ngan Tuyen +84 844 55 58 88 x 8081 [email protected] Food and Beverage Oil and Gas Ngo Bich Van +84 844 55 58 88 x 8084 [email protected] Banking Nguyen Quang Duy +84 844 55 58 88 x 8082 [email protected] Rubber Dang Thi Kim Thoa +84 844 55 58 88 x 8083 [email protected] Consumer Nguyen Trung Hoa +84 844 55 58 88 x 8088 [email protected] Steel Sugar Macro

24 August 2012
Regional Daily
APPENDIX I: TERMS FOR PROVISION OF REPORT, DISCLAIMERS AND DISCLOSURES DISCLAIMERS This research report is prepared for general circulation and for information purposes only and under no circumstances should it be considered or intended as an offer to sell or a solicitation of an offer to buy the securities referred to herein. Investors should note that values of such securities, if any, may fluctuate and that each security’s price or value may rise or fall. Opinions or recommendations contained herein are in form of technical ratings and fundamental ratings. Technical ratings may differ from fundamental ratings as technical valuations apply different methodologies and are purely based on price and volume-related information extracted from the relevant jurisdiction’s stock exchange in the equity analysis. Accordingly, investors’ returns may be less than the original sum invested. Past performance is not necessarily a guide to future performance. This report is not intended to provide personal investment advice and does not take into account the specific investment objectives, the financial situation and the particular needs of persons who may receive or read this report. Investors should therefore seek financial, legal and other advice regarding the appropriateness of investing in any securities or the investment strategies discussed or recommended in this report. The information contained herein has been obtained from sources believed to be reliable but such sources have not been independently verified by Maybank Investment Bank Berhad, its subsidiary and affiliates (collectively, “MKE”) and consequently no representation is made as to the accuracy or completeness of this report by MKE and it should not be relied upon as such. Accordingly, MKE and its officers, directors, associates, connected parties and/or employees (collectively, “Representatives”) shall not be liable for any direct, indirect or consequential losses or damages that may arise from the use or reliance of this report. Any information, opinions or recommendations contained herein are subject to change at any time, without prior notice. This report may contain forward looking statements which are often but not always identified by the use of words such as “anticipate”, “believe”, “estimate”, “intend”, “plan”, “expect”, “forecast”, “predict” and “project” and statements that an event or result “may”, “will”, “can”, “should”, “could” or “might” occur or be achieved and other similar expressions. Such forward looking statements are based on assumptions made and information currently available to us and are subject to certain risks and uncertainties that could cause the actual results to differ materially from those expressed in any forward looking statements. Readers are cautioned not to place undue relevance on these forward-looking statements. MKE expressly disclaims any obligation to update or revise any such forward looking statements to reflect new information, events or circumstances after the date of this publication or to reflect the occurrence of unanticipated events. MKE and its officers, directors and employees, including persons involved in the preparation or issuance of this report, may, to the extent permitted by law, from time to time participate or invest in financing transactions with the issuer(s) of the securities mentioned in this report, perform services for or solicit business from such issuers, and/or have a position or holding, or other material interest, or effect transactions, in such securities or options thereon, or other investments related thereto. In addition, it may make markets in the securities mentioned in the material presented in this report. MKE may, to the extent permitted by law, act upon or use the information presented herein, or the research or analysis on which they are based, before the material is published. One or more directors, officers and/or employees of MKE may be a director of the issuers of the securities mentioned in this report. This report is prepared for the use of MKE’s clients and may not be reproduced, altered in any way, transmitted to, copied or distributed to any other party in whole or in part in any form or manner without the prior express written consent of MKE and MKE and its Representatives accepts no liability whatsoever for the actions of third parties in this respect. This report is not directed to or intended for distribution to or use by any person or entity who is a citizen or resident of or located in any locality, state, country or other jurisdiction where such distribution, publication, availability or use would be contrary to law or regulation. This report is for distribution only under such circumstances as may be permitted by applicable law. The securities described herein may not be eligible for sale in all jurisdictions or to certain categories of investors. Without prejudice to the foregoing, the reader is to note that additional disclaimers, warnings or qualifications may apply based on geographical location of the person or entity receiving this report. Malaysia Opinions or recommendations contained herein are in the form of technical ratings and fundamental ratings. Technical ratings may differ from fundamental ratings as technical valuations apply different methodologies and are purely based on price and volume-related information extracted from Bursa Malaysia Securities Berhad in the equity analysis. Singapore
This report has been produced as of the date hereof and the information herein may be subject to change. Maybank Kim Eng Research Pte. Ltd. (“Maybank KERPL”) in Singapore has no obligation to update such information for any recipient. For distribution in Singapore, recipients of this report are to contact Maybank KERPL in Singapore in respect of any matters arising from, or in connection with, this report. If the recipient of this report is not an accredited investor, expert investor or institutional investor (as defined under Section 4A of the Singapore Securities and Futures Act), Maybank KERPL shall be legally liable for the contents of this report, with such liability being limited to the extent (if any) as permitted by law. Thailand The disclosure of the survey result of the Thai Institute of Directors Association (“IOD”) regarding corporate governance is made pursuant to the policy of the Office of the Securities and Exchange Commission. The survey of the IOD is based on the information of a company listed on the Stock Exchange of Thailand and the market for Alternative Investment disclosed to the public and able to be accessed by a general public investor. The result, therefore, is from the perspective of a third party. It is not an evaluation of operation and is not based on inside information. The survey result is as of the date appearing in the Corporate Governance Report of Thai Listed Companies. As a result, the survey may be changed after that date. Maybank Kim Eng Securities (Thailand) Public Company Limited (“MBKET”) does not confirm nor certify the accuracy of such survey result. Except as specifically permitted, no part of this presentation may be reproduced or distributed in any manner without the prior written permission of MBKET. MBKET accepts no liability whatsoever for the actions of third parties in this respect. US
This research report prepared by MKE is distributed in the United States (“US”) to Major US Institutional Investors (as defined in Rule 15a-6 under the Securities Exchange Act of 1934, as amended) only by Maybank Kim Eng Securities USA Inc (“Maybank KESUSA”), a broker-dealer registered in the US (registered under Section 15 of the Securities Exchange Act of 1934, as amended). All responsibility for the distribution of this report by Maybank KESUSA in the US shall be borne by Maybank KESUSA. All resulting transactions by a US person or entity should be effected through a registered broker-dealer in the US. This report is not directed at you if MKE is prohibited or restricted by any legislation or regulation in any jurisdiction from making it available to you. You should satisfy yourself before reading it that Maybank KESUSA is permitted to provide research material concerning investments to you under relevant legislation and regulations. UK This document is being distributed by Maybank Kim Eng Securities (London) Ltd (“Maybank KESL”) which is authorized and regulated, by the Financial Services Authority and is for Informational Purposes only. This document is not intended for distribution to anyone defined as a Retail Client under the Financial Services and Markets Act 2000 within the UK. Any inclusion of a third party link is for the recipients convenience only, and that the firm does not take any responsibility for its comments or accuracy, and that access to such links is at the individuals own risk. Nothing in this report should be considered as constituting legal, accounting or tax advice, and that for accurate guidance recipients should consult with their own independent tax advisers.

24 August 2012
Regional Daily
DISCLOSURES Legal Entities Disclosures Malaysia: This report is issued and distributed in Malaysia by Maybank Investment Bank Berhad (15938-H) which is a Participating Organization of Bursa Malaysia Berhad and a holder of Capital Markets and Services License issued by the Securities Commission in Malaysia. Singapore: This material is issued and distributed in Singapore by Maybank KERPL (Co. Reg No 197201256N) which is regulated by the Monetary Authority of Singapore. Indonesia: PT Kim Eng Securities (“PTKES”) (Reg. No. KEP-251/PM/1992) is a member of the Indonesia Stock Exchange and is regulated by the BAPEPAM LK. Thailand: MBKET (Reg. No.0107545000314) is a member of the Stock Exchange of Thailand and is regulated by the Ministry of Finance and the Securities and Exchange Commission. Philippines: MATRKES (Reg. No.01-2004-00019) is a member of the Philippines Stock Exchange and is regulated by the Securities and Exchange Commission. Vietnam: Kim Eng Vietnam Securities Company (“KEVS”) (License Number: 71/UBCK-GP) is licensed under the State Securities Commission of Vietnam. Hong Kong: KESHK (Central Entity No AAD284) is regulated by the Securities and Futures Commission. India: Kim Eng Securities India Private Limited (“KESI”) is a participant of the National Stock Exchange of India Limited (Reg No: INF/INB 231452435) and the Bombay Stock Exchange (Reg. No. INF/INB 011452431) and is regulated by Securities and Exchange Board of India. KESI is also registered with SEBI as Category 1 Merchant Banker (Reg. No. INM 000011708) US: Maybank KESUSA is a member of/ and is authorized and regulated by the FINRA – Broker ID 27861. UK: Maybank KESL (Reg No 2377538) is authorized and regulated by the Financial Services Authority. Disclosure of Interest Malaysia: MKE and its Representatives may from time to time have positions or be materially interested in the securities referred to herein and may further act as market maker or may have assumed an underwriting commitment or deal with such securities and may also perform or seek to perform investment banking services, advisory and other services for or relating to those companies. Singapore: As of 24 August 2012, Maybank KERPL does not have any interest in the companies mentioned in this report. The covering analysts have positions in CapitaMalls Asia. CWT Ltd, Cosco, Global Logistics Properties, SingTel, SPH & Singapore Exchange.Thailand: MBKET may have a business relationship with or may possibly be an issuer of derivative warrants on the securities /companies mentioned in the research report. Therefore, Investors should exercise their own judgment before making any investment decisions. MBKET, its associates, directors, connected parties and/or employees may from time to time have interests and/or underwriting commitments in the securities mentioned in this report. Hong Kong: KESHK may have financial interests in relation to an issuer or a new listing applicant referred to as defined by the requirements under Paragraph 16.5(a) of the Hong Kong Code of Conduct for Persons Licensed by or Registered with the Securities and Futures Commission.
As of 24 August 2012, KESHK and the authoring analyst do not have any interest in any companies recommended in this research report. MKE may have, within the last three years, served as manager or co-manager of a public offering of securities for, or currently may make a primary market in issues of, any or all of the entities mentioned in this report or may be providing, or have provided within the previous 12 months, significant advice or investment services in relation to the investment concerned or a related investment. OTHERS Analyst Certification of Independence The views expressed in this research report accurately reflect the analyst’s personal views about any and all of the subject securities or issuers; and no part of the research analyst’s compensation was, is or will be, directly or indirectly, related to the specific recommendations or views expressed in the report. Reminder Structured securities are complex instruments, typically involve a high degree of risk and are intended for sale only to sophisticated investors who are capable of understanding and assuming the risks involved. The market value of any structured security may be affected by changes in economic, financial and political factors (including, but not limited to, spot and forward interest and exchange rates), time to maturity, market conditions and volatility and the credit quality of any issuer or reference issuer. Any investor interested in purchasing a structured product should conduct its own analysis of the product and consult with its own professional advisers as to the risks involved in making such a purchase. No part of this material may be copied, photocopied or duplicated in any form by any means or redistributed without the prior consent of MKE.
Definition of Ratings Maybank Kim Eng Research uses the following rating system: BUY Total return is expected to be above 15% in the next 12 months HOLD Total return is expected to be between -15% to +15% in the next 12 months SELL Total return is expected to be below -15% in the next 12 months
Applicability of Ratings The respective analyst maintains a coverage universe of stocks, the list of which may be adjusted according to needs. Investment ratings are only applicable to the stocks which form part of the coverage universe. Reports on companies which are not part of the coverage do not carry investment ratings as we do not actively follow developments in these companies.
Some common terms abbreviated in this report (where they appear): Adex = Advertising Expenditure FCF = Free Cashflow PE = Price Earnings BV = Book Value FV = Fair Value PEG = PE Ratio To Growth CAGR = Compounded Annual Growth Rate FY = Financial Year PER = PE Ratio Capex = Capital Expenditure FYE = Financial Year End QoQ = Quarter-On-Quarter CY = Calendar Year MoM = Month-On-Month ROA = Return On Asset DCF = Discounted Cashflow NAV = Net Asset Value ROE = Return On Equity DPS = Dividend Per Share
NTA = Net Tangible Asset ROSF = Return On Shareholders’ Funds EBIT = Earnings Before Interest And Tax P = Price WACC = Weighted Average Cost Of Capital EBITDA = EBIT, Depreciation And Amortisation P.A. = Per Annum YoY = Year-On-Year EPS = Earnings Per Share PAT = Profit After Tax YTD = Year-To-Date EV = Enterprise Value PBT = Profit Before Tax

24 August 2012
Regional Daily
Malaysia Maybank Investment Bank Berhad (A Participating Organisation of Bursa Malaysia Securities Berhad) 33rd Floor, Menara Maybank, 100 Jalan Tun Perak, 50050 Kuala Lumpur Tel: (603) 2059 1888; Fax: (603) 2078 4194
Singapore Maybank Kim Eng Securities Pte Ltd Maybank Kim Eng Research Pte Ltd 9 Temasek Boulevard #39-00 Suntec Tower 2 Singapore 038989 Tel: (65) 6336 9090 Fax: (65) 6339 6003
London Maybank Kim Eng Securities (London) Ltd 6/F, 20 St. Dunstan’s Hill London EC3R 8HY, UK Tel: (44) 20 7621 9298 Dealers’ Tel: (44) 20 7626 2828 Fax: (44) 20 7283 6674
New York Maybank Kim Eng Securities USA Inc 777 Third Avenue, 21st Floor New York, NY 10017, U.S.A. Tel: (212) 688 8886 Fax: (212) 688 3500
Stockbroking Business: Level 8, Tower C, Dataran Maybank, No.1, Jalan Maarof 59000 Kuala Lumpur Tel: (603) 2297 8888 Fax: (603) 2282 5136
Hong Kong Kim Eng Securities (HK) Ltd Level 30, Three Pacific Place, 1 Queen’s Road East, Hong Kong Tel: (852) 2268 0800 Fax: (852) 2877 0104
Indonesia PT Kim Eng Securities Plaza Bapindo Citibank Tower 17th Floor Jl Jend. Sudirman Kav. 54-55 Jakarta 12190, Indonesia
Tel: (62) 21 2557 1188 Fax: (62) 21 2557 1189
India Kim Eng Securities India Pvt Ltd 2nd Floor, The International 16, Maharishi Karve Road, Churchgate Station, Mumbai City - 400 020, India Tel: (91).22.6623.2600 Fax: (91).22.6623.2604
Philippines Maybank ATR Kim Eng Securities Inc. 17/F, Tower One & Exchange Plaza Ayala Triangle, Ayala Avenue Makati City, Philippines 1200 Tel: (63) 2 849 8888 Fax: (63) 2 848 5738
Thailand Maybank Kim Eng Securities (Thailand) Public Company Limited 999/9 The Offices at Central World, 20th - 21st Floor, Rama 1 Road Pathumwan, Bangkok 10330, Thailand Tel: (66) 2 658 6817 (sales) Tel: (66) 2 658 6801 (research)
Vietnam In association with Kim Eng Vietnam Securities Company 1st Floor, 255 Tran Hung Dao St. District 1 Ho Chi Minh City, Vietnam Tel : (84) 838 38 66 36 Fax : (84) 838 38 66 39
Saudi Arabia In association with Anfaal Capital Villa 47, Tujjar Jeddah Prince Mohammed bin Abdulaziz Street P.O. Box 126575 Jeddah 21352 Tel: (966) 2 6068686 Fax: (966) 26068787
South Asia Sales Trading Connie TAN [email protected] Tel: (65) 6333 5775 US Toll Free: 1 866 406 7447
North Asia Sales Trading Eddie LAU [email protected] Tel: (852) 2268 0800 US Toll Free: 1 866 598 2267
www.maybank-ke.com | www.kimengresearch.com