regional wastewater treatment plant
TRANSCRIPT
Operations Management and Facilities Services
Traverse City, Michigan Regional Wastewater Treatment Plant
2017-2018 Annual Report

i
Contents
Introduction . . . . . . . . . . . . . . . . . . . . . . . . . . . . . . . . . . . . . . . . . . . . . . . . . . . . . . . . . . . . . . . . . .1
Plant Performance . . . . . . . . . . . . . . . . . . . . . . . . . . . . . . . . . . . . . . . . . . . . . . . . . . . . . . . . . . . .2
Carbonaceous Biochemical Oxygen Demand and Total Suspended Solids
Plant Percent Removals and Effluent Concentrations . . . . . . . . . . . . . . . . . . . . . . . .2
Total Phosphorus and Ammonia Nitrogen Concentrations . . . . . . . . . . . . . . . . . . .3
Dissolved Oxygen (mg/L), and pH [standard units (S .U .)] . . . . . . . . . . . . . . . . . . . .3
Fecal Coliform . . . . . . . . . . . . . . . . . . . . . . . . . . . . . . . . . . . . . . . . . . . . . . . . . . . . . . . . . . .4
Total Silver, Ag [micrograms/Liter, (ug/L)] . . . . . . . . . . . . . . . . . . . . . . . . . . . . . . . . . .4
Michigan Department of Environmental Quality Facility Inspection . . . . . . . . . . . . . . .5
National Pollution Discharge Elimination System Permit Reporting . . . . . . . . . . . . . . .5
IPP Overview . . . . . . . . . . . . . . . . . . . . . . . . . . . . . . . . . . . . . . . . . . . . . . . . . . . . . . . . . . . . . . . .6
Township Biochemical Oxygen Demand Loadings . . . . . . . . . . . . . . . . . . . . . . . . . . .9
Operations and Maintenance Highlights . . . . . . . . . . . . . . . . . . . . . . . . . . . . . . . . . . . . . . 10
Maintenance Work Orders . . . . . . . . . . . . . . . . . . . . . . . . . . . . . . . . . . . . . . . . . . . . . . . 13
Corrective Maintenance Highlights . . . . . . . . . . . . . . . . . . . . . . . . . . . . . . . . . . . . . . . 15
Safety . . . . . . . . . . . . . . . . . . . . . . . . . . . . . . . . . . . . . . . . . . . . . . . . . . . . . . . . . . . . . . . . . . . . . . 19
Community Involvement Summary . . . . . . . . . . . . . . . . . . . . . . . . . . . . . . . . . . . . . . . . . . 20
Fiscal Summary . . . . . . . . . . . . . . . . . . . . . . . . . . . . . . . . . . . . . . . . . . . . . . . . . . . . . . . . . . . . . 21
Base Fee/Direct Cost Overview . . . . . . . . . . . . . . . . . . . . . . . . . . . . . . . . . . . . . . . . . . 21
Jacobs TCRWWTP Staff Overview . . . . . . . . . . . . . . . . . . . . . . . . . . . . . . . . . . . . . . . . . . . . 22
Summary . . . . . . . . . . . . . . . . . . . . . . . . . . . . . . . . . . . . . . . . . . . . . . . . . . . . . . . . . . . . . . . . . . 23
ii Traverse City 2017 Annual Report BI0926181141DEN
ExhibitsExhibit 1 2017-2018 TCRWWTP Percent Removals versus
NPDES Permit Requirements . . . . . . . . . . . . . . . . . . . . . . . . . . . . . . . . . . . . . . . .2
Exhibit 2 2017-2018 TCRWWTP Percent Removals versus
NPDES Permit Requirement . . . . . . . . . . . . . . . . . . . . . . . . . . . . . . . . . . . . . . . . .2
Exhibit 3 2017-2018 Plant Effluent Maximum Monthly Average CBOD
and TSS Concentrations versus NPDES Permit Monthly Average
Concentration Requirements . . . . . . . . . . . . . . . . . . . . . . . . . . . . . . . . . . . . . . . . .2
Exhibit 4 2017-2018 Plant Effluent Maximum Monthly Average Nutrient
Concentrations versus NPDES Permit Monthly Average
Concentration Requirements . . . . . . . . . . . . . . . . . . . . . . . . . . . . . . . . . . . . . . . . .3
Exhibit 5 Plant Effluent Minimum Dissolved Oxygen Concentration
versus NPDES Permit Requirement . . . . . . . . . . . . . . . . . . . . . . . . . . . . . . . . . . . .3
Exhibit 6 2017-2018 Plant Effluent Maximum and Minimum pH Values versus
NPDES Permit Limits . . . . . . . . . . . . . . . . . . . . . . . . . . . . . . . . . . . . . . . . . . . . . . . .3
Exhibit 7 2017-2018 Plant Effluent Maximum 7-day Geomean versus
NPDES Permit Effluent Requirement . . . . . . . . . . . . . . . . . . . . . . . . . . . . . . . . . .4
Exhibit 8 2017-2018 Plant Effluent Maximum Silver Concentration versus
NPDES Permit Silver Concentration Requirement . . . . . . . . . . . . . . . . . . . . . .4
Exhibit 9 2017-2018 SIUs and CIU Meetings/Inspections . . . . . . . . . . . . . . . . . . . . . . . .7
Exhibit 10 2017-2018 General IPP Inspections/Activities . . . . . . . . . . . . . . . . . . . . . . . . .7
Exhibit 11 2017-2018 Notice of Violations Issued to Dischargers . . . . . . . . . . . . . . . . . .8
Exhibit 12 Total Daily Average BOD Loadings . . . . . . . . . . . . . . . . . . . . . . . . . . . . . . . . . . .9
Exhibit 13 Completed Maintenance Work Orders . . . . . . . . . . . . . . . . . . . . . . . . . . . . . . 13
Exhibit 14 2017-2018 Repair Expenses Over $2,000 . . . . . . . . . . . . . . . . . . . . . . . . . . . . 14
Exhibit 15 Jacobs Local Donations . . . . . . . . . . . . . . . . . . . . . . . . . . . . . . . . . . . . . . . . . . . 20
Exhibit 16 Contract Year 28 Reconciliation Summary . . . . . . . . . . . . . . . . . . . . . . . . . . 21
Exhibit 17 TCRWWTP Organizational Chart . . . . . . . . . . . . . . . . . . . . . . . . . . . . . . . . . . . 22
1
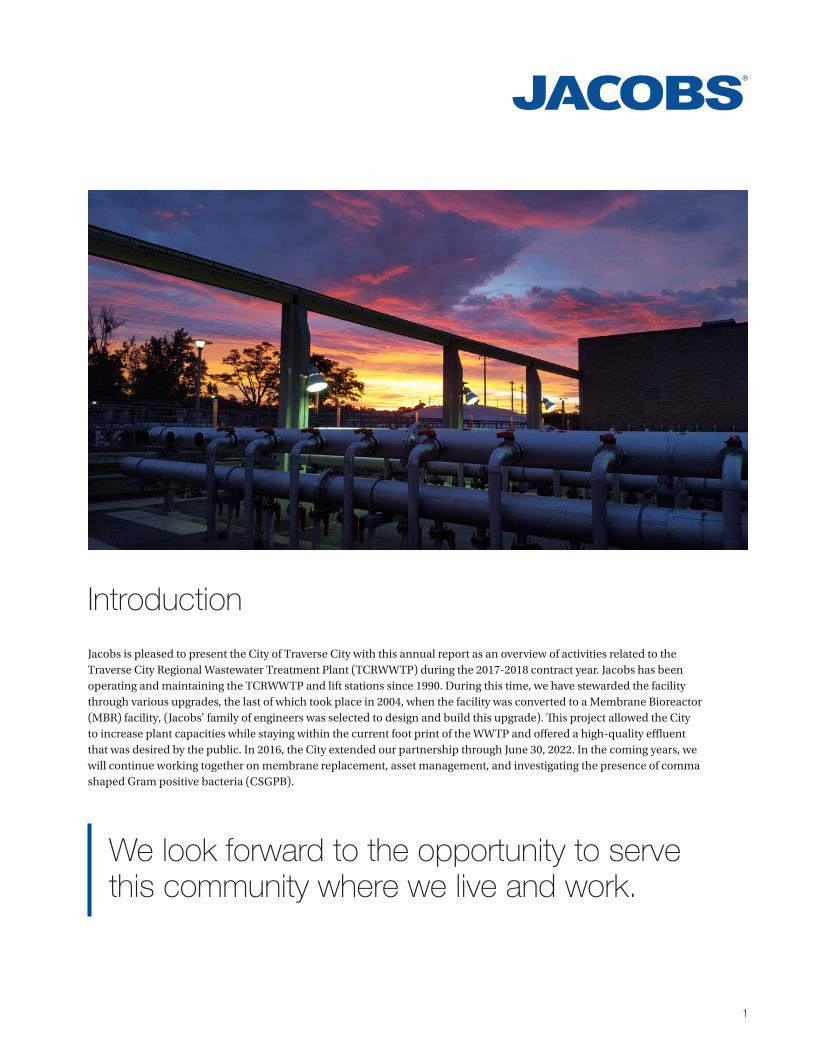
Jacobs is pleased to present the City of Traverse City with this annual report as an overview of activities related to the Traverse City Regional Wastewater Treatment Plant (TCRWWTP) during the 2017-2018 contract year. Jacobs has been operating and maintaining the TCRWWTP and lift stations since 1990. During this time, we have stewarded the facility through various upgrades, the last of which took place in 2004, when the facility was converted to a Membrane Bioreactor (MBR) facility, (Jacobs’ family of engineers was selected to design and build this upgrade). This project allowed the City to increase plant capacities while staying within the current foot print of the WWTP and offered a high-quality effluent that was desired by the public. In 2016, the City extended our partnership through June 30, 2022. In the coming years, we will continue working together on membrane replacement, asset management, and investigating the presence of comma shaped Gram positive bacteria (CSGPB).
Introduction
We look forward to the opportunity to serve this community where we live and work.

2 Traverse City 2017 Annual Report BI0926181141DEN
Plant Performance
The TCRWWTP operates under a National Pollutant Discharge Elimination System (NPDES) permit that is issued by the Michigan Department of Environmental Quality (MDEQ). The NPDES permit contains limits (requirements) for certain parameters within the plant effluent to protect the receiving waters.
Carbonaceous Biochemical Oxygen Demand and Total Suspended Solids Plant Percent Removals and Effluent ConcentrationsThe plant is required to remove, at a minimum, 85 percent of the influent carbonaceous biochemical oxygen demand (CBOD) and total suspended solids (TSS). Exhibits 1 and 2, illustrate the plant’s minimum percent removals for 2017-2018. Exhibit 3, contains NPDES permit effluent concentration [milligrams per liter (mg/L)] limits compared to the effluent maximum monthly average concentrations for 2017-2018.
Exhibit 1 2017-2018 TCRWWTP Percent Removals versus NPDES Permit Requirements
NPDES Minimum Percent Removal Requirement
TCRWWTP Minimum Percent CBOD Removal
TCRWWTP Minimum Percent TSS Removal
85 95.6 98.7
Exhibit 22017-2018 TCRWWTP Percent Removals versus NPDES Permit Requirement
Exhibit 32017-2018 Plant Effluent Maximum Monthly Average CBOD and TSS Concentrations versus NPDES Permit Monthly Average Concentration Requirements
CBOD Concentration
(mg/L)TSS Concentration
(mg/L)
NPDES Permit Monthly Average Concentration Requirement 25 30
Plant Effluent Maximum Monthly Average Concentration <2.66 <1.08
75
80
85
90
95
100
NPDES Minimum %
Removal Requirement
TCRWWTP Minimum %
CBOD Removal
TCRWWTP Minimum %
TSS Removal
3
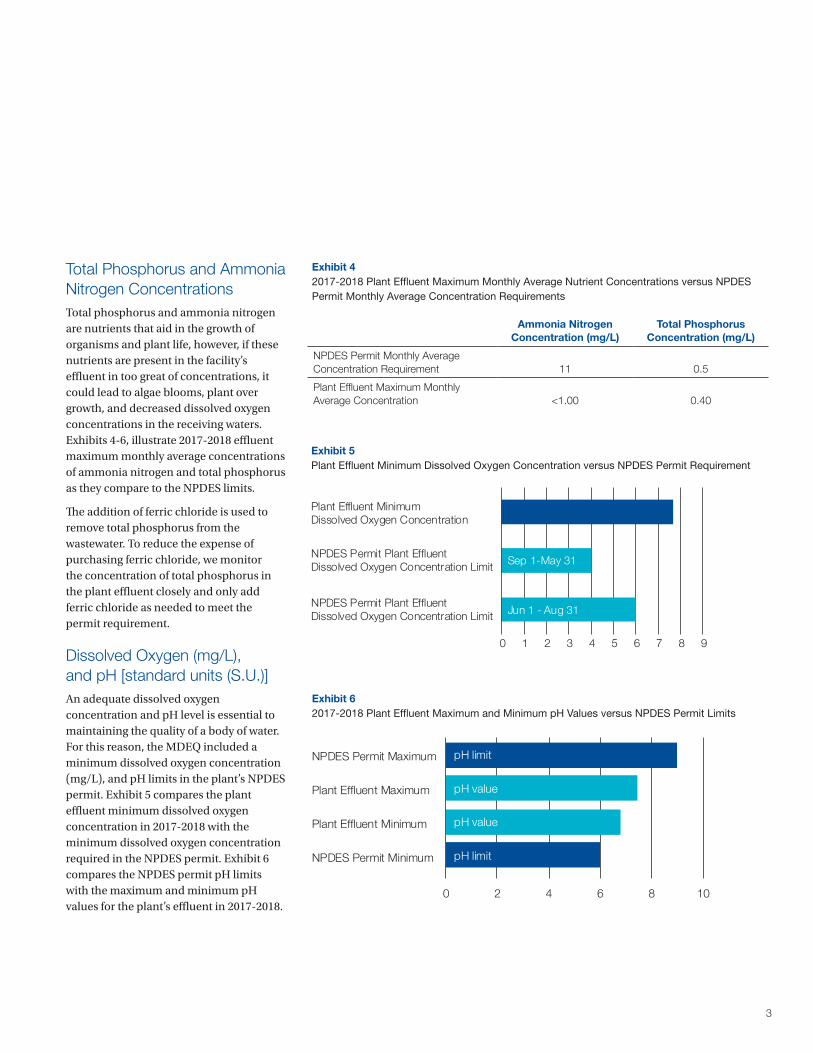
Total Phosphorus and Ammonia Nitrogen Concentrations Total phosphorus and ammonia nitrogen are nutrients that aid in the growth of organisms and plant life, however, if these nutrients are present in the facility’s effluent in too great of concentrations, it could lead to algae blooms, plant over growth, and decreased dissolved oxygen concentrations in the receiving waters. Exhibits 4-6, illustrate 2017-2018 effluent maximum monthly average concentrations of ammonia nitrogen and total phosphorus as they compare to the NPDES limits.
The addition of ferric chloride is used to remove total phosphorus from the wastewater. To reduce the expense of purchasing ferric chloride, we monitor the concentration of total phosphorus in the plant effluent closely and only add ferric chloride as needed to meet the permit requirement.
Dissolved Oxygen (mg/L), and pH [standard units (S.U.)]An adequate dissolved oxygen concentration and pH level is essential to maintaining the quality of a body of water. For this reason, the MDEQ included a minimum dissolved oxygen concentration (mg/L), and pH limits in the plant’s NPDES permit. Exhibit 5 compares the plant effluent minimum dissolved oxygen concentration in 2017-2018 with the minimum dissolved oxygen concentration required in the NPDES permit. Exhibit 6 compares the NPDES permit pH limits with the maximum and minimum pH values for the plant’s effluent in 2017-2018.
Exhibit 42017-2018 Plant Effluent Maximum Monthly Average Nutrient Concentrations versus NPDES Permit Monthly Average Concentration Requirements
Ammonia Nitrogen
Concentration (mg/L)Total Phosphorus
Concentration (mg/L)
NPDES Permit Monthly Average Concentration Requirement 11 0.5
Plant Effluent Maximum Monthly Average Concentration <1.00 0.40
Exhibit 5Plant Effluent Minimum Dissolved Oxygen Concentration versus NPDES Permit Requirement
Exhibit 62017-2018 Plant Effluent Maximum and Minimum pH Values versus NPDES Permit Limits
0 1 2 3 4 5 6 7 8 9
NPDES Permit Plant Ef�uent Dissolved Oxygen Concentration Limit
NPDES Permit Plant Ef�uent Dissolved Oxygen Concentration Limit
Plant Ef�uent Minimum Dissolved Oxygen Concentration
Sep 1-May 31
Jun 1 - Aug 31
0 2 4 6 8 10
NPDES Permit Minimum
Plant Ef�uent Minimum
Plant Ef�uent Maximum
NPDES Permit Maximum pH limit
pH value
pH value
pH limit

4 Traverse City 2017 Annual Report BI0926181141DEN
Fecal Coliform To protect the City’s water ways and ultimately the public from harmful pathogens that are present in wastewater, the MDEQ requires disinfection of WWTP effluent. Disinfection destroys or deactivates pathogenic microorganisms resulting in the termination of their growth and reproduction. The plant’s NPDES permit limits the monthly geomean for fecal coliform to 200 counts (cts)/ 100 milliliters (mls). Exhibit 7 compares the NPDES permit effluent requirement with the plant effluent maximum 7-day geomean for 2017-2018.
Total Silver, Ag [micrograms/Liter, (ug/L)]Silver, among other uses, is a byproduct of traditional photography found in photo fixer. While the effects of silver in the environment vary greatly based on the form of silver, it can be toxic to both plants and animals. In order to protect the aquatic life in the receiving stream, the Boardman River, the NPDES permit limits the amount of silver allowed in the plant effluent to a concentration of 5.3 ug/L. Exhibit 8 compares the NPDES plant effluent silver concentration limit to the actual plant effluent maximum silver concentration for 2017-2018.
Plant Performance
Exhibit 72017-2018 Plant Effluent Maximum 7-day Geomean versus NPDES Permit Effluent Requirement
Exhibit 82017-2018 Plant Effluent Maximum Silver Concentration versus NPDES Permit Silver Concentration Requirement
0 20 40 60 80 100 120 140 160 180 200
NPDES Permit Plant Ef�uentFecal Coliform 7-day Geomean Limit
Plant Ef�uent Fecal ColiformMaximum 7-day Geomean
0 1 2 3 4 5 6
NPDES Permit Average Concentration Requirement
Plant Ef�uent Maximum Concentration

5
Michigan Department of Environmental Quality Facility Inspection
The MDEQ inspected the facility in 2017-2018, below is an excerpt from the follow-up report.
The results of the water sampling are included with this letter and were found to be in compliance with the facilities permit. The facility was well maintained and operated with knowledgeable and properly trained staff and was found to be in compliance of their NPDES discharge permit.
National Pollution Discharge Elimination System Permit Reporting
In accordance with the NPDES permit for the TCRWWTP, Jacobs completed and submitted the following reports to the MDEQ:
■ Monthly Discharge Monitoring Reports
■ Asset Management Annual Report
■ Annual Biosolids Report
■ Annual Federal Industrial Pretreatment Program (IPP) Report
■ Additional Monitoring Data Report
■ IPP per and polyfluoroalkyl substances (PFAS) Interim Report
■ Sara Title III Tier II

6 Traverse City 2017 Annual Report BI0926181141DEN
IPP Overview
Jacobs is responsible for administering the City’s, and through jurisdictional agreements, the Townships’ IPP program as spelled out in their approved Sewer Use Ordinances (SUO). Jacobs monitors Significant Industrial Users (SIU), responds to and investigates reported collection system interferences, reports non-compliance to the control authority (the City Manager) promptly, and prepares documents for the control authority as needed to fulfill his duties as spelled out in the SUO. (For compliance purposes the IPP “year” is based on the calendar year from January 1- December 31). Below is the definition, the MDEQ offers on their website, for SIU:
An industrial user (IU) will be classified as an SIU if it meets any of the following:
(A) Is subject to categorical pretreatment standards under 40 CFR 403.6 and 40 CFR chapter I, subchapter N;
(B) Discharges an average of 25,000 gallons per day (gpd) or more of process wastewater to the Publicly Owned Treatment Works (POTW) (excluding sanitary, noncontact cooling, and boiler blowdown wastewater);
(C) contributes a process waste stream that makes up 5 percent or more of the average dry-weather hydraulic or organic capacity of the POTW treatment plant;
(D) Is designated as such by the POTW on the basis that the IU has a reasonable potential for adversely affecting the POTW’s operation or for violating any pretreatment standard or requirement [in accordance with 40 CFR 403.8(f)(6)].
A categorical industrial user (CIU) is an SIU [see (A) above], but an SIU is not always a CIU. Categorical users have specific limits and requirements that are determined by the Federal government. States and local governments can develop requirements that are more restrictive, but not less restrictive.
SIUs are required to have discharge permits to operate on the system. They are required to perform self-monitoring tests on their discharges and report those results to Jacobs as outlined in their permit. Jacobs facilitates the Control Authority sampling and analyses of the SIUs once per year. We inspect the SIUs twice per year; once on short notice (less than 24 hours) and once for a longer visit (one to two-week notice).
All industrial users, or non-domestic users, that don’t meet the definition of a SIU are inspected as needed to ensure compliance with the SUO, each user is required to have a Slug Control Plan, and an IPP Inspection Manhole.

7
Traverse City has one CIU, three SIUs. CRM is considered a Categorical User because of the metal finishing process that occurs at their site. The three SIUs are: Munson Medical Center, Munson Support Services, and Hillshire Food. Exhibit 9 is a summary of inspections and meetings at the CIU and SIU locations in the last year. In addition to inspecting the CIU, and the SIUs, Jacobs conducted in-field inspections, distributed and evaluated Industrial User Surveys, and responded to collection system issues. These activities are summarized in Exhibit 10.
Exhibit 92017-2018 SIUs and CIU Meetings/Inspections
Date Discharger
7/25/2017 Munson Support Services
7/27/2017 Tyson Foods
8/3/2017 CRM, Inc.
8/16/2017 Munson Medical Center
11/27/2017 Hillshire Brands
12/4/2017 Munson Medical Center
12/7/2017 CRM, Inc
12/11/2017 Munson Support Services
1/31/2018 Field work to gather global positioning system (GPS) coordinates for SIU permits.
4/6/2018 Meeting at CRM to discuss flow meter installation.
4/16/2018 Meeting at Munson Medical Center to discuss new permit and flow meter installation.
Exhibit 102017-2018 General IPP Inspections/Activities
Date Discharger
7/5/2017 Observation of Randy’s Diner Inspection Manhole (IMH).
7/5/2017 Observation of Centre Street Café IMH.
7/5/2017 Observation of Agave Mexican Grill IMH.
7/5/2017 Inspected 8th Street Oil Change, related to high oil in the sewer.
7/11/2017 Inspected SOS Analytical for sample disposal.
7/13/2017 In field Industrial User Survey follow-up visits.
7/19/2017 Right Brain Brewery
8/29/2017 AlcoTech Wire
9/6/2017 Observation of SOS Analytical sampling procedures.
9/7/2017 Observation of SOS Analytical sampling procedures.
9/8/2017 Observation of SOS Analytical sampling procedures.
9/19/2017 Observation of AlcoTech IMH.
9/20/2017 Investigation of high grease levels near Horizon’s Center.
10/5/2017 Observation of Olive Garden’s IMH.
10/5/2017 Meeting at SOS Analytical about laboratory practices.
12/6/2017 Field observation of SOS Analytical sampling procedures.
12/7/2017 Field observation of SOS Analytical sampling procedures.
12/26/2017 Observation of Northpeak IMH.
1/24/2018 Monkey Fist Brewing
1/24/2018 Great Lakes Malting
1/25/2018 Earthen Ales
6/7/2018 Field sampling of Coast Guard Lift Station for PFAS.
6/25/2018 Field sampling of Coast Guard Lift Station for PFAS.
6/26/2018 Observation of Park Place Hotel IMH.
8 Traverse City 2017 Annual Report BI0926181141DEN
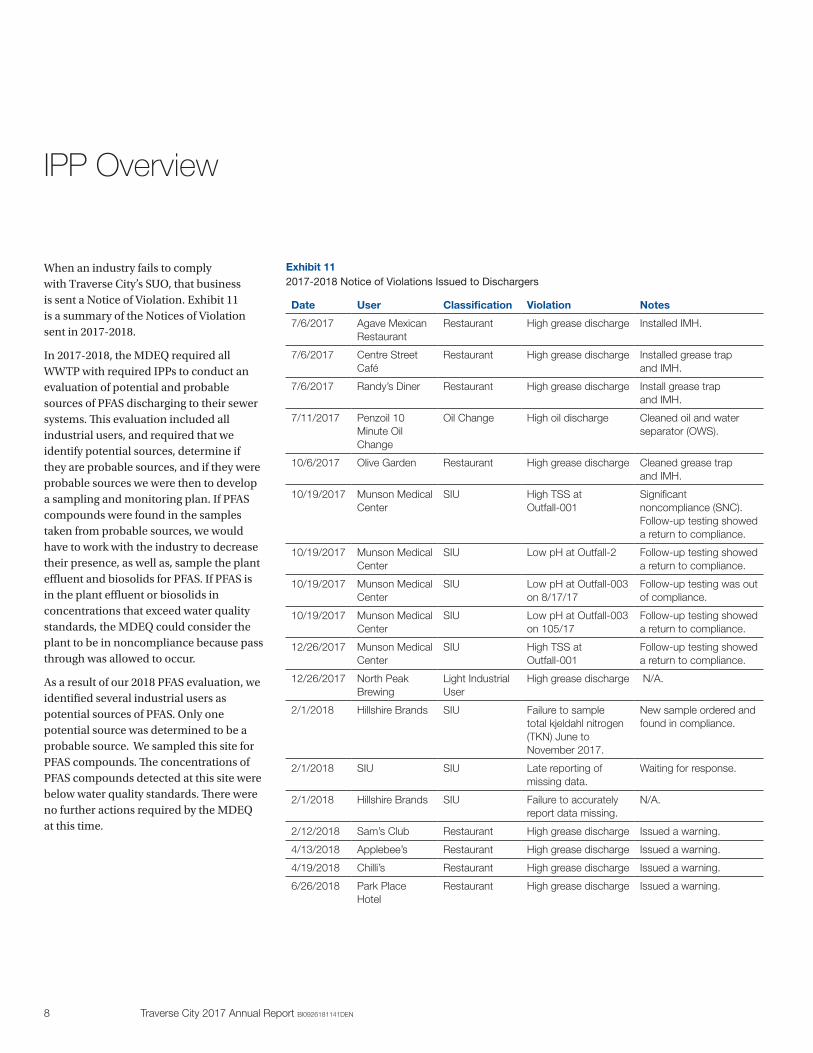
When an industry fails to comply with Traverse City’s SUO, that business is sent a Notice of Violation. Exhibit 11 is a summary of the Notices of Violation sent in 2017-2018.
In 2017-2018, the MDEQ required all WWTP with required IPPs to conduct an evaluation of potential and probable sources of PFAS discharging to their sewer systems. This evaluation included all industrial users, and required that we identify potential sources, determine if they are probable sources, and if they were probable sources we were then to develop a sampling and monitoring plan. If PFAS compounds were found in the samples taken from probable sources, we would have to work with the industry to decrease their presence, as well as, sample the plant effluent and biosolids for PFAS. If PFAS is in the plant effluent or biosolids in concentrations that exceed water quality standards, the MDEQ could consider the plant to be in noncompliance because pass through was allowed to occur.
As a result of our 2018 PFAS evaluation, we identified several industrial users as potential sources of PFAS. Only one potential source was determined to be a probable source. We sampled this site for PFAS compounds. The concentrations of PFAS compounds detected at this site were below water quality standards. There were no further actions required by the MDEQ at this time.
IPP Overview
Exhibit 112017-2018 Notice of Violations Issued to Dischargers
Date User Classification Violation Notes
7/6/2017 Agave Mexican Restaurant
Restaurant High grease discharge Installed IMH.
7/6/2017 Centre Street Café
Restaurant High grease discharge Installed grease trap and IMH.
7/6/2017 Randy’s Diner Restaurant High grease discharge Install grease trap and IMH.
7/11/2017 Penzoil 10 Minute Oil Change
Oil Change High oil discharge Cleaned oil and water separator (OWS).
10/6/2017 Olive Garden Restaurant High grease discharge Cleaned grease trap and IMH.
10/19/2017 Munson Medical Center
SIU High TSS at Outfall-001
Significant noncompliance (SNC). Follow-up testing showed a return to compliance.
10/19/2017 Munson Medical Center
SIU Low pH at Outfall-2 Follow-up testing showed a return to compliance.
10/19/2017 Munson Medical Center
SIU Low pH at Outfall-003 on 8/17/17
Follow-up testing was out of compliance.
10/19/2017 Munson Medical Center
SIU Low pH at Outfall-003 on 105/17
Follow-up testing showed a return to compliance.
12/26/2017 Munson Medical Center
SIU High TSS at Outfall-001
Follow-up testing showed a return to compliance.
12/26/2017 North Peak Brewing
Light Industrial User
High grease discharge N/A.
2/1/2018 Hillshire Brands SIU Failure to sample total kjeldahl nitrogen (TKN) June to November 2017.
New sample ordered and found in compliance.
2/1/2018 SIU SIU Late reporting of missing data.
Waiting for response.
2/1/2018 Hillshire Brands SIU Failure to accurately report data missing.
N/A.
2/12/2018 Sam’s Club Restaurant High grease discharge Issued a warning.
4/13/2018 Applebee’s Restaurant High grease discharge Issued a warning.
4/19/2018 Chilli’s Restaurant High grease discharge Issued a warning.
6/26/2018 Park Place Hotel
Restaurant High grease discharge Issued a warning.

9
Township Biochemical Oxygen Demand LoadingsAs part of Jacobs’ contractual obligation to the City, we operate and maintain eight automatic flow proportioned samplers strategically placed throughout the collection system, in order to obtain representative samples from each of the following townships: Garfield, East Bay, Acme, Elmwood, and Peninsula. We collect three samples per week, and each sample is analyzed to determine its biochemical oxygen demand (BOD) concentration. These concentrations are used to calculate a monthly average BOD concentration. The monthly average BOD concentration for each township and monthly township flow values (provided by the City and the County) are used to calculate the BOD loadings from each of the fore mentioned townships, and the City. Together the five Townships own 45 percent of the facility’s organic loading capacity amounting to 9,090 pounds per day of BOD. The City owns the remaining 55 percent of the facility’s organic loading capacity or 11,110 pounds per day of BOD. (Exhibit 12 summarizes the 2017-2018 BOD loadings versus owned capacities.)
Exhibit 12Total Daily Average BOD Loadings
Jul Aug Sep Oct Nov Dec Jan Feb Mar Apr May Jun
Total Township BOD Loadings
Township Owned BOD Capacity
City BOD Loadings
City Owned BOD Capacity
0
2,000
4,000
6,000
8,000
10,000
12,000
lbs/
day
9,090
11,110
5,831 5,9044,927
5,735
4,601 4,4984,935
5,543
3,922
4,611 4,959 5,238
4,242 3,914 3,539
2,2693,052
3,493 3,5302,734
4,980
2,8443,635 3,558
10 Traverse City 2017 Annual Report BI0926181141DEN
As part of the Jacobs culture we are always looking for opportunities to improve our performance by reducing compliance vulnerabilities, operational costs, and the facility’s carbon footprint; achieving operational excellence; acquiring and maintaining a highly-qualified staff; and demonstrating a high standard of safety. Itemized below are this year’s accomplishments:
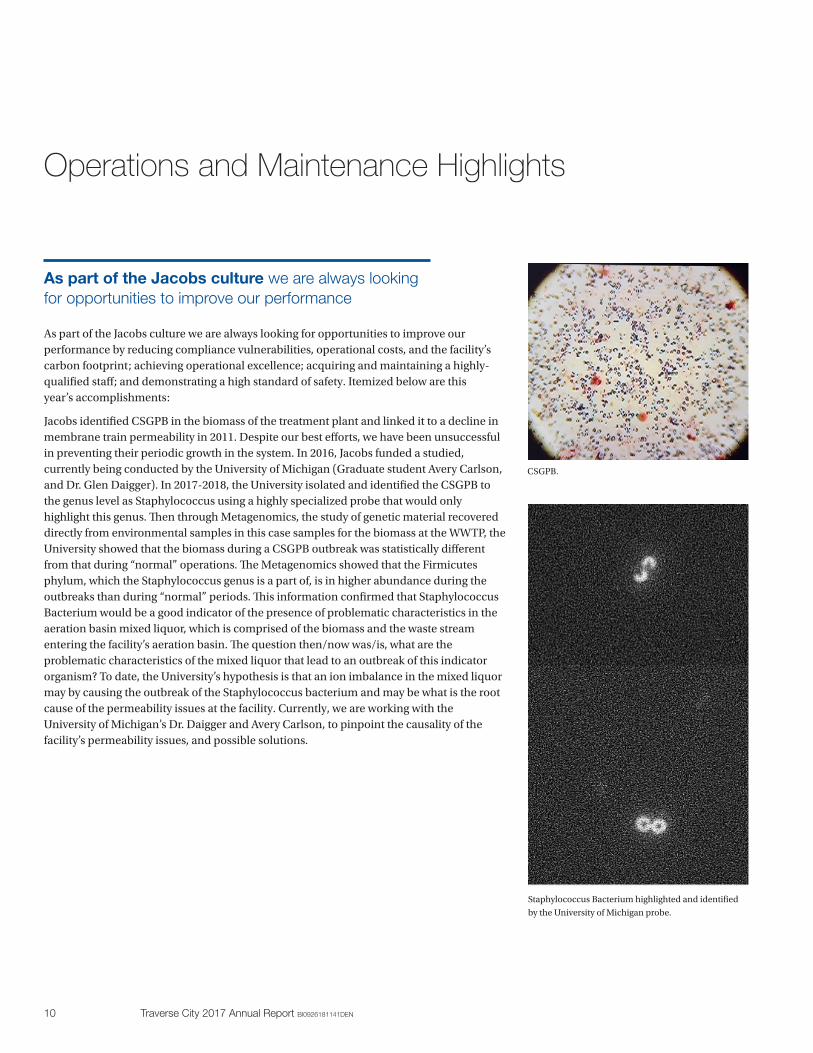
Jacobs identified CSGPB in the biomass of the treatment plant and linked it to a decline in membrane train permeability in 2011. Despite our best efforts, we have been unsuccessful in preventing their periodic growth in the system. In 2016, Jacobs funded a studied, currently being conducted by the University of Michigan (Graduate student Avery Carlson, and Dr. Glen Daigger). In 2017-2018, the University isolated and identified the CSGPB to the genus level as Staphylococcus using a highly specialized probe that would only highlight this genus. Then through Metagenomics, the study of genetic material recovered directly from environmental samples in this case samples for the biomass at the WWTP, the University showed that the biomass during a CSGPB outbreak was statistically different from that during “normal” operations. The Metagenomics showed that the Firmicutes phylum, which the Staphylococcus genus is a part of, is in higher abundance during the outbreaks than during “normal” periods. This information confirmed that Staphylococcus Bacterium would be a good indicator of the presence of problematic characteristics in the aeration basin mixed liquor, which is comprised of the biomass and the waste stream entering the facility’s aeration basin. The question then/now was/is, what are the problematic characteristics of the mixed liquor that lead to an outbreak of this indicator organism? To date, the University’s hypothesis is that an ion imbalance in the mixed liquor may by causing the outbreak of the Staphylococcus bacterium and may be what is the root cause of the permeability issues at the facility. Currently, we are working with the University of Michigan’s Dr. Daigger and Avery Carlson, to pinpoint the causality of the facility’s permeability issues, and possible solutions.
Operations and Maintenance Highlights
Staphylococcus Bacterium highlighted and identified
by the University of Michigan probe.
CSGPB.
As part of the Jacobs culture we are always looking for opportunities to improve our performance

11
We purchased and installed a new odor canister for the vent stack at the Front Street lift station. We created a preventive maintenance (PM) work order (WO) for changing the carbon in the canister on a quarterly basis. In addition, when the hatch had to be replaced at the Front Street lift station, we facilitated the installation of a gas tight hatch with safety netting for fall protection.
To optimize the efficiency of the aeration system in the aeration basin, as well as, to optimize the detention time of the waste stream in the basin, we took the north aeration basin out of service to clean the aeration grid diffusers, make the necessary repairs to the system, and remove any grit that had built up in the basin. This task is performed on one side of the basin or the other every year.
New Front Street hatch with safety netting.
Top view of new Front Street hatch.
North basin being taken out of service for cleaning and maintenance.
12 Traverse City 2017 Annual Report BI0926181141DEN
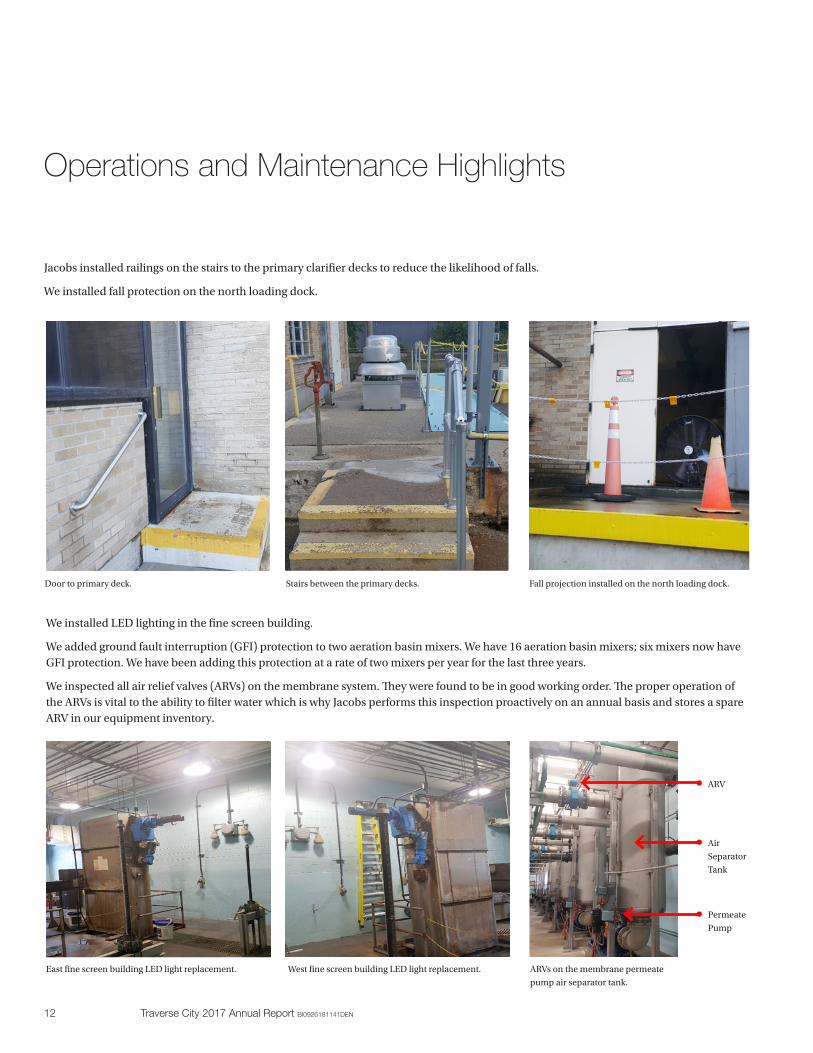
Jacobs installed railings on the stairs to the primary clarifier decks to reduce the likelihood of falls.
We installed fall protection on the north loading dock.
Operations and Maintenance Highlights
Door to primary deck. Stairs between the primary decks.
We installed LED lighting in the fine screen building.
We added ground fault interruption (GFI) protection to two aeration basin mixers. We have 16 aeration basin mixers; six mixers now have GFI protection. We have been adding this protection at a rate of two mixers per year for the last three years.
We inspected all air relief valves (ARVs) on the membrane system. They were found to be in good working order. The proper operation of the ARVs is vital to the ability to filter water which is why Jacobs performs this inspection proactively on an annual basis and stores a spare ARV in our equipment inventory.
Fall projection installed on the north loading dock.
East fine screen building LED light replacement. West fine screen building LED light replacement. ARVs on the membrane permeate
pump air separator tank.
ARV
Air
Separator
Tank
Permeate
Pump

13
Maintenance Work OrdersJacobs performed 4,085 WOs in 2017-2018. Ninety-five percent of the WOs were proactive in nature falling under the category of PM activities or predictive maintenance (PDM) activities. Jacobs maintenance program is centered around equipment capacity assurance through proper asset management, a focus that prolongs the life expectancy of the City’s assets, minimizes the likelihood of compliance issues related to asset failures, reduces safety vulnerabilities, optimizes staff labor hours, and curtails the cost of repairs with the use of proper planning and scheduling. Our proactively robust maintenance program is geared toward decreasing the need for emergency and corrective maintenance (CM) repairs, which accounted for only 5 percent of our maintenance WOs in 2017-2018. Exhibit 13 highlights our maintenance WO activity through the last year.
Five percent of our completed WOs consisted of CM, or unscheduled maintenance activities. A partial list of work is included below in Exhibit 14 (on the next page) which highlights repairs expenses over $2,000. Jacobs obtains multiple bids for repair expenses greater than $2,000, and unless there are extenuating circumstances, we choose the low bid. Any repair expense more than $9,000 requires prior Commission approval.
Exhibit 13Completed Maintenance Work Orders
3,586
203286
10
Preventive MaintenanceCorrective MaintenancePredictive MaintenanceEmergency Maintenance (Callouts)

14 Traverse City 2017 Annual Report BI0926181141DEN
Operations and Maintenance Highlights
Exhibit 142017-2018 Repair Expenses Over $2,000
Repair Contractor Cost
Installed a new hot water booster pump (east) for boiler room. Kerr Pump $2,140.00
Installed fall protection for North loading dock. Fastenal $2,307.93
Installed a spare level transmitter for the membrane trains. Endress & Hauser Inc $2,363.75
Rebuilt kit for digester 3’s recirculation pump. JGM $2,464.87
Installed a new grit hopper for the East grit chamber. Ace Welding $2,617.78
Installed a spare processor. One Stop Shop Resource Inc. $2,700.00
Troubleshot the main plant programmable logic controller (PLC). The controls were out of service.
Windemuller $2,700.75
Installed a new grit hopper for grit chambers. Ace Welding $2,708.30
Repaired the HVAC in the Administration building. Hurst Mechanical $2,835.34
Installation of two GFI protectors for two separate aeration basin mixers. Windemuller $2,940.00
Removed grease from the Front Street lift station. Northern A-1 $3,000.75
Installed a scour air blower pressure relief valve. Aerzen $3,018.98
Installed a new check arm for pump #3 at Front Street lift station. Hydrodynamic $3,172.00
Installed Four new flow measuring devices for the influent and primary effluent partial flumes. Endress Hauser $3,323.52
Installed a new drip trap for methane gas system. Water Works Systems & Equipment Inc. $3,404.00
Installed a spare motor contactor for pump motors at the Front Street lift station. Southland Electric $3,559.61
Installed a new motor contactor for pump #4 at the Front Street lift station. Southland Electric $3,727.99
Replaced the screen for the West sieve drum concentrator. Graphic Equipment/Charter Machine Company $3,764.00
Purchased four new flow measuring devices. Endress Hauser $4,226.12
Installed a new gas mixer for digester 4. Carotek Inc $4,304.97
Replaced the permeate pump for the variable frequency drive (VFD). Topline Electric $4,477.07
Received repair parts for primary tanks #1 and #3 North. Amwell $4,577.55
Installed a new vacuum pump. JEM Fluid Power INC $5,329.33
Installed a new level transducer for digester 5. Endress Hauser $5,453.98
Received repair parts for the fine screen compactor. Ovivo USA $6,112.91
Replaced the UV system ballasts. Radiant UV $6,779.70
Conducted construction at Grand Traverse. Front Street Lift Station Hatch Replacement $7,515.00
Installed a new motor for scour air blower A. Graham Electric $7,572.93
Installed new East grit chamber doors. Grand Traverse Garage Door $8,108.00
Replaced pulsar 25 hp pump with motor for pumping ferric chloride. Professional Pump $8,297.00
Replaced the leaking backpulse piping with schedule 80 pvc piping. ABI Mechanical $8,300.00
Installed new flow measuring devices for influent and primary effluent flow measuring. Topline Electric $8,820.00
Removed and installed the scour air blower A’s new motor. ABI $9,200.00
Rebuilt the motor/pump for pump 2 at Front Street. Hydrodynamics $14,718.00
Rebuilt the motor/pump for pump 3 at Front Street. Hydrodynamics $15,418.00
Provided bypass pumping while screw pump 2 had gear box installed. Elmer’s $27,685.40
Pump around pump set up and one-month rental for Front Street lift station. Mercino $29,650.00
Total of repairs over $2,000 $239,295.53

15
Corrective Maintenance HighlightsWe repaired the classifier arm for the east grit chamber. A new classifier arm, from the sole-source distributor, was quoted to cost $9,180. We fabricated and coated a classifier arm for $3,500, saving $5,680.
The Front Street lift station was last upgraded over 18 years ago. In 2017-2018, we had planned for the refurbishing of the pumps, as well as, the upgrade of the programmable logic controls (PLCs). With the City Commission’s approval, Jacobs purchased and installed a new rotating assembly in pump 3, however, the pump was not keeping up with the flow demand. While we were troubleshooting the cause of pump 3’s capacity limitations, pump 2 failed. This left pump 4 as the only fully operational pump, as pump 1 was decommissioned after the last upgrade, and eliminated the lift station’s operational redundancy and reliability. Jacobs initiated the emergency response plan(ERP) we created for such scenarios. We modified the discharge line for pump 1 so that a pump around pump could be used at the lift station to keep up with the flow demand, commissioned the setup of a pump around pump at the station, and expedited the repairs for pumps 2 and 4; all was completed with the support of the City Commission. With the pump around pump in place, Jacobs regained the full capacity of pump 3 and repaired pump 2. When pump 2 and 3 were back in service at full capacity the pump around pump was decommissioned. While we were onsite monitoring the pump around pump at the lift station, we painted the pumps, piping, and handrails; replaced and painted the inside wet well cover; installed new gauges on the pumps’ discharge lines; installed guards around the pump shafts; and installed LED lighting.
East rake arm replacement. Front Street lift station pumps 2 and 3 refurbished.
Pump 2- repaired rotating assembly installed.
Pump 3- new rotating assembly installed.

16 Traverse City 2017 Annual Report BI0926181141DEN
We replaced the gas compressor, motor, gas line, and isolation valves for digester #4.
We facilitated the replacement of the ductile iron discharge piping for the membrane system back pulse pumps with new schedule 80 PVC piping.
Operations and Maintenance Highlights
Old gas compressor and motor. New gas compressor and motor. New gas line isolation valves.
New schedule 80 PVC discharge piping for the
membrane back pulse pumps.
17
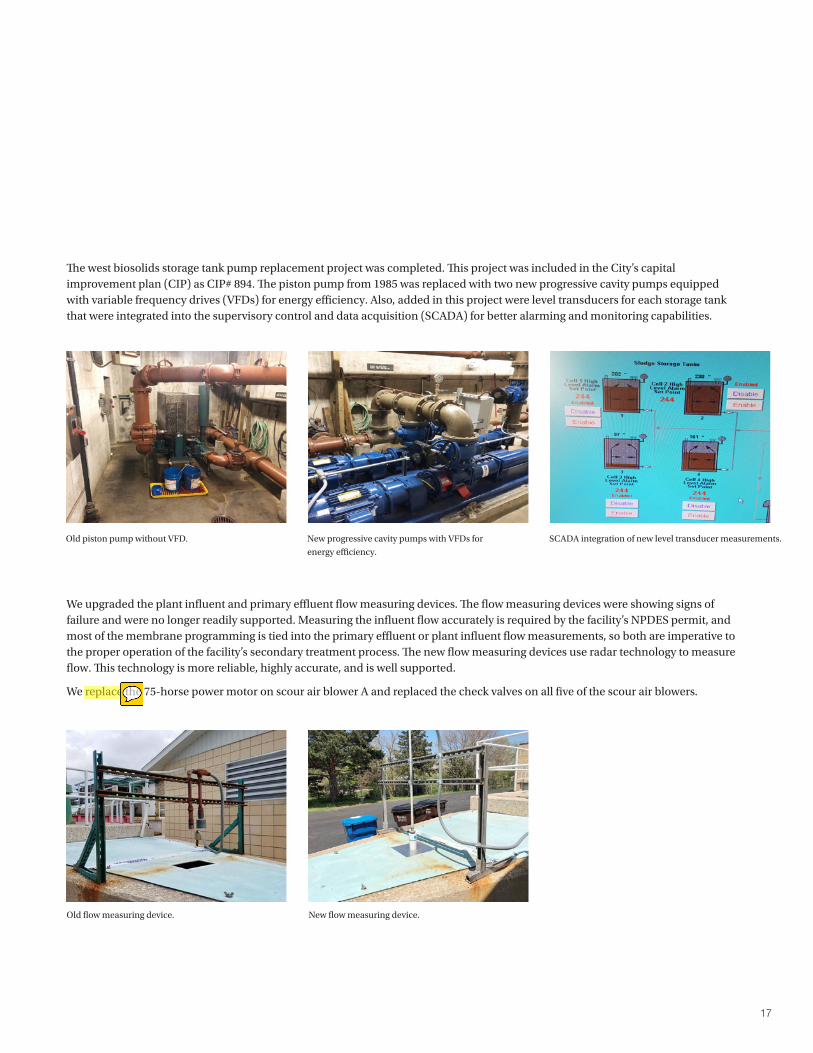
The west biosolids storage tank pump replacement project was completed. This project was included in the City’s capital improvement plan (CIP) as CIP# 894. The piston pump from 1985 was replaced with two new progressive cavity pumps equipped with variable frequency drives (VFDs) for energy efficiency. Also, added in this project were level transducers for each storage tank that were integrated into the supervisory control and data acquisition (SCADA) for better alarming and monitoring capabilities.
Old piston pump without VFD. New progressive cavity pumps with VFDs for
energy efficiency.
SCADA integration of new level transducer measurements.
We upgraded the plant influent and primary effluent flow measuring devices. The flow measuring devices were showing signs of failure and were no longer readily supported. Measuring the influent flow accurately is required by the facility’s NPDES permit, and most of the membrane programming is tied into the primary effluent or plant influent flow measurements, so both are imperative to the proper operation of the facility’s secondary treatment process. The new flow measuring devices use radar technology to measure flow. This technology is more reliable, highly accurate, and is well supported.
We replace the 75-horse power motor on scour air blower A and replaced the check valves on all five of the scour air blowers.
Old flow measuring device. New flow measuring device.

18 Traverse City 2017 Annual Report BI0926181141DEN
The boilers, used to burn methane gas produced by the digesters to heat water that maintains the temperatures of the digesters and the administration building at the facility, were overhauled.
We completed the replacement of four of the aluminum gates on the membrane trains with four new stainless-steel gates. This project is in the City’s CIP as #786. Twelve of the 16 aluminum gates on the membrane system have now been replaced.
We replaced the east grit chamber doors.
Operations and Maintenance Highlights
Facility boilers. Inside the boiler heat exchange. New stainless steel gate installed.
New door on east grit chamber. Membrane gate replacement map.
19
Safety is a priority for Jacobs. Some of the safety measures implemented in 2017-2018 to reduce risk to our employees were featured in the previous section. In addition to these items, we perform safety inspections weekly, hold safety meetings daily, and safety training is ongoing for our staff. Jacobs has accumulated 1,000 days and counting- without a loss time injury, or an injury requiring treatment beyond first aid. This number represents zero loss time injuries from September 2015 to 2018.
Safety
Zero loss time injuries from September 2015 to 2018.

20 Traverse City 2017 Annual Report BI0926181141DEN
It’s important to us to give back to the communities in which we live and work. We strive to make an impact that extends even further than exemplary delivery of our contractual obligations. In addition to the many tours we gave throughout the year, we participated as shore ambassadors for Paddle Antrim, and made donations to groups, and organizations that, like Jacobs, strive to preserve our environment for future generations. Exhibit 15 summarizes the donations we contributed in 2017-2018.
Community Involvement Summary
Exhibit 15Jacobs Local Donations
Group Organization Amount
Water Shed Center- Grand Traverse Bay (Swing Shift with the Stars Sponsor) $7,500
Paddle Antrim $1,000
Traverse City - water bottle filling station $7,000
Michigan Society of Professional Engineers (MiSPE) Sponsor/Participants to benefit a local scholarship fund and MATHCOUNTS competition. $650
MiSPE golf tournament in August 2017. Water bottle filling station in honor of Cynthia Mehigh.
A great friend, colleague, and lover of downtown
Traverse City.
Paddle Antrim 2017.
21
We strive to provide the best quality of service we can day in and day out. We understand that the City has lots of fiscal demands and are focused on minimizing the financial impact operating and maintaining the WWTP and the related lift stations has on the City’s fiscal budget.
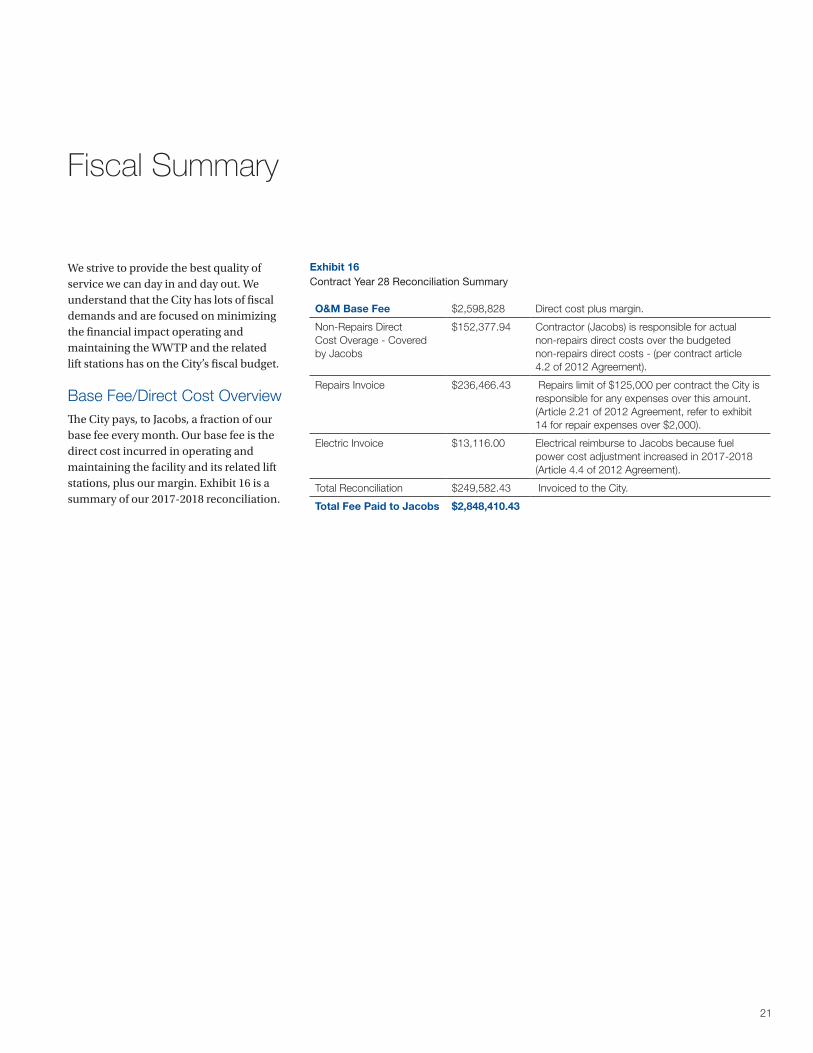
Base Fee/Direct Cost OverviewThe City pays, to Jacobs, a fraction of our base fee every month. Our base fee is the direct cost incurred in operating and maintaining the facility and its related lift stations, plus our margin. Exhibit 16 is a summary of our 2017-2018 reconciliation.
Fiscal Summary
Exhibit 16Contract Year 28 Reconciliation Summary
O&M Base Fee $2,598,828 Direct cost plus margin.
Non-Repairs Direct Cost Overage - Covered by Jacobs
$152,377.94 Contractor (Jacobs) is responsible for actual non-repairs direct costs over the budgeted non-repairs direct costs - (per contract article 4.2 of 2012 Agreement).
Repairs Invoice $236,466.43 Repairs limit of $125,000 per contract the City is responsible for any expenses over this amount. (Article 2.21 of 2012 Agreement, refer to exhibit 14 for repair expenses over $2,000).
Electric Invoice $13,116.00 Electrical reimburse to Jacobs because fuel power cost adjustment increased in 2017-2018 (Article 4.4 of 2012 Agreement).
Total Reconciliation $249,582.43 Invoiced to the City.
Total Fee Paid to Jacobs $2,848,410.43

22 Traverse City 2017 Annual Report BI0926181141DEN
Twelve Jacobs employees operate and maintain the TCRWWTP 24 hours per day, 7 days per week, operate and maintain the City’s lift stations, and administer the City’s IPP. Jacobs has four additional full-time staff members supporting the Traverse City-based staff. Exhibit 17 highlights our team.
Jacobs TCRWWTP Staff Overview
Exhibit 17TCRWWTP Organizational Chart
Project Manager
Joe BrownLead OperatorTC and Shorts
Nathan CallisionLead Operator
Northern Satellites
Ken StawowyLead OperatorGTSF/TC IPP
OperatorsScott Brinks
Lane PetersonJosh Lycka
Troy VedrodeZachary Niec
Andrew WaldronMaintenance Supervisor
MechanicsShane Wyatt
(Safety Team Leader)Kerry Gensler
Rick Shaw
Mechanics in TrainingJacob Lamble
Laboratory TechinicianJustin Straub
Elizabeth Hart
Mark HuggardAssistant Project Manager
24 hours per day, 7 days per week

23
It is our goal to exceed your expectations. Jacobs and the City of Traverse City have worked to create a partnership where we reduce risk, exceed performance expectations, and apply our institutional knowledge gained while working together for more than 29 years.
We appreciate the opportunity to serve Traverse City and its citizens.
Summary
We look forward to our continued partnership for many years to come.

www.jacobs.com
BI0926181141DEN