regional workshop on migration statistics, 26 - 27 october 2011, antalya, turkey pablo lattes...
TRANSCRIPT
Regional workshop on migration statisticsRegional workshop on migration statistics, , 26 - 27 October 2011, Antalya, Turkey26 - 27 October 2011, Antalya, Turkey
Pablo LattesPablo LattesMigration Section, Population Division - DESAMigration Section, Population Division - DESA
United Nations, New YorkUnited Nations, New York
The global migration debate: What data The global migration debate: What data do we need to close the evidence-gap?do we need to close the evidence-gap?

International migration and development at the United Nations

Milestones on international migration and Milestones on international migration and development at the United Nationsdevelopment at the United Nations
International Conference on Population and International Conference on Population and Development, Cairo, 1994 (PoA, Chapter X)Development, Cairo, 1994 (PoA, Chapter X)
High-level Dialogue on International Migration High-level Dialogue on International Migration and Development, 2006and Development, 2006• Global Forum on Migration and Development Global Forum on Migration and Development • Global Migration Group (14 UN agencies plus IOM and Global Migration Group (14 UN agencies plus IOM and
World Bank)World Bank)• Special Representative of the Secretary-GeneralSpecial Representative of the Secretary-General
Informal thematic debate on International Informal thematic debate on International Migration and Development, 19 May 2011Migration and Development, 19 May 2011
High-Level Dialogue on International Migration High-Level Dialogue on International Migration and Development, 2013and Development, 2013
Informal thematic debateInformal thematic debate
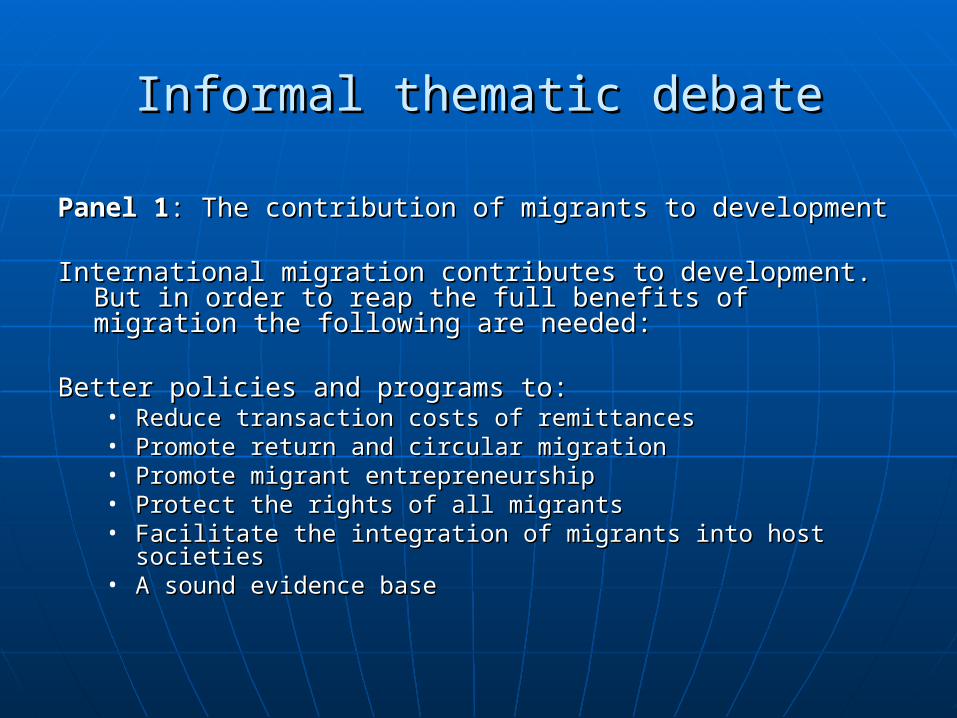
Panel 1Panel 1: The contribution of migrants to development : The contribution of migrants to development
International migration contributes to development. But in International migration contributes to development. But in order to reap the full benefits of migration the following are order to reap the full benefits of migration the following are needed:needed:
Better policies and programs to:Better policies and programs to:• Reduce transaction costs of remittancesReduce transaction costs of remittances• Promote return and circular migrationPromote return and circular migration• Promote migrant entrepreneurshipPromote migrant entrepreneurship• Protect the rights of all migrantsProtect the rights of all migrants• Facilitate the integration of migrants into host societiesFacilitate the integration of migrants into host societies• A sound evidence baseA sound evidence base

Informal thematic debate (2)Informal thematic debate (2)
Panel 2Panel 2: Improving international cooperation on migration : Improving international cooperation on migration and development and development
Maximizing migrant contributions to development requires Maximizing migrant contributions to development requires cooperation at all levelscooperation at all levels
• At the bilateral and regional levels progress has been made in At the bilateral and regional levels progress has been made in strengthening cooperation strengthening cooperation
• The GFMD has successfully promoted dialogue, but it is still a The GFMD has successfully promoted dialogue, but it is still a fragile process, with insufficient support from Member Statesfragile process, with insufficient support from Member States
• The GMG has an important role to play in fostering better The GMG has an important role to play in fostering better coordination and supporting the activities of Member States coordination and supporting the activities of Member States (for example, collaboration between UNHCR and IOM to (for example, collaboration between UNHCR and IOM to evacuate foreign workers from Libya)evacuate foreign workers from Libya)

The Global Migration Group (GMG) The Global Migration Group (GMG)
16 members, including the 14 United Nations 16 members, including the 14 United Nations entities (…), IOM and the World Bankentities (…), IOM and the World Bank
Created by United Nations Secretary-General in Created by United Nations Secretary-General in context of the 2006 High Level Dialoguecontext of the 2006 High Level Dialogue
Objectives:Objectives:• Apply international instruments and norms on Apply international instruments and norms on
international migration international migration • Promote coherent, comprehensive and coordinated Promote coherent, comprehensive and coordinated
approach to international migrationapproach to international migration
Global Migration Group (GMG), 2011Global Migration Group (GMG), 2011

Global Forum on Migration and Global Forum on Migration and Development (GFMD)Development (GFMD)
ObjectiveObjective• to advance understanding and cooperation on the nexus to advance understanding and cooperation on the nexus
between migration and development and foster practical and between migration and development and foster practical and action-oriented outcomesaction-oriented outcomes
CharacterCharacter• voluntary, informal, participatory, non-binding and voluntary, informal, participatory, non-binding and
Government-led processGovernment-led process
ParticipationParticipation• open to all members and observers of the UN open to all members and observers of the UN
Past MeetingsPast Meetings• Belgium (2007), Philippines (2008), Greece (2009) and Mexico Belgium (2007), Philippines (2008), Greece (2009) and Mexico
(2010)(2010)
Future MeetingsFuture Meetings• Switzerland (2011), Mauritius (2012), Sweden (2014)Switzerland (2011), Mauritius (2012), Sweden (2014)
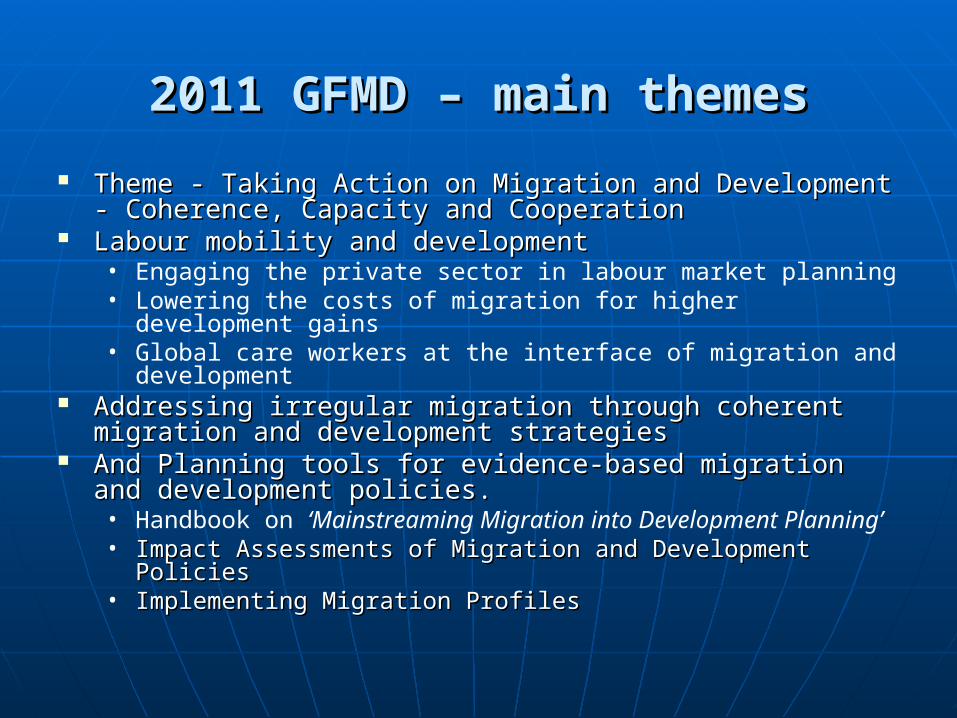
2011 GFMD – main themes2011 GFMD – main themes
Theme - Taking Action on Migration and Development - Theme - Taking Action on Migration and Development - Coherence, Capacity and CooperationCoherence, Capacity and Cooperation
Labour mobility and developmentLabour mobility and development• Engaging the private sector in labour market planning • Lowering the costs of migration for higher development gains • Global care workers at the interface of migration and
development Addressing irregular migration through coherent migration Addressing irregular migration through coherent migration
and development strategiesand development strategies And Planning tools for evidence-based migration and And Planning tools for evidence-based migration and
development policies.development policies.• Handbook on ‘Mainstreaming Migration into Development
Planning’ • Impact Assessments of Migration and Development PoliciesImpact Assessments of Migration and Development Policies• Implementing Migration ProfilesImplementing Migration Profiles

2013 High-level Dialogue on International 2013 High-level Dialogue on International Migration and Development processMigration and Development process
(UNGA resolution 65/170)(UNGA resolution 65/170)
Resolution on theme and modalities: UNGA 67th Resolution on theme and modalities: UNGA 67th session (Oct 2012) session (Oct 2012)
Regional commissions and other relevant entities Regional commissions and other relevant entities (IOM, etc.): regional preparations (IOM, etc.): regional preparations
High-level Dialogue: Sep (?) 2013High-level Dialogue: Sep (?) 2013
Resolution on HLD outcomes and future (?)Resolution on HLD outcomes and future (?)

Data sources for policy issuesData sources for policy issuesKey policy levelsKey policy levels Data sourcesData sources
Levels, trends and characteristicsLevels, trends and characteristics UN DESAUN DESA
Remittances levels and costsRemittances levels and costs The World BankThe World Bank
Circular and return migrationCircular and return migration ? Surveys? Surveys
Labour export (incl. highly-skilled Labour export (incl. highly-skilled migration [brain drain])migration [brain drain])
OECD, WHO, The World OECD, WHO, The World BankBank
Migrant entrepreneurshipMigrant entrepreneurship ? Surveys? Surveys
Portability of pensions Portability of pensions ? bilateral agreements? bilateral agreements
Transferability of education Transferability of education certificates / skillscertificates / skills
UNESCO, bilateral UNESCO, bilateral agreementsagreements
Irregular migrationIrregular migration Admin. Records, SurveysAdmin. Records, Surveys
Social and economic integration of Social and economic integration of migrantsmigrants
Census, SurveysCensus, Surveys
Protection of rights of migrantsProtection of rights of migrants Special Rapporteur on Special Rapporteur on Human Rights, ILOHuman Rights, ILO

Recommended stock tabulations by Recommended stock tabulations by United Nations Statistical OfficeUnited Nations Statistical Office
Native and foreign-born population by age and Native and foreign-born population by age and sexsex
Foreign-born population by country of birth, age Foreign-born population by country of birth, age and sexand sex
Foreigners by country of citizenship, age and sexForeigners by country of citizenship, age and sex Foreign-born 15+ years and over by educational Foreign-born 15+ years and over by educational
attainment and sexattainment and sex Foreigners 15+ years of age by educational Foreigners 15+ years of age by educational
attainment and sexattainment and sex Population by citizenship status, age and sexPopulation by citizenship status, age and sex Economically active foreign-born by occupationEconomically active foreign-born by occupation
Source: Migrant stock tables of United Nations Statistics Division Source: Migrant stock tables of United Nations Statistics Division Population census questionnaire 2011Population census questionnaire 2011
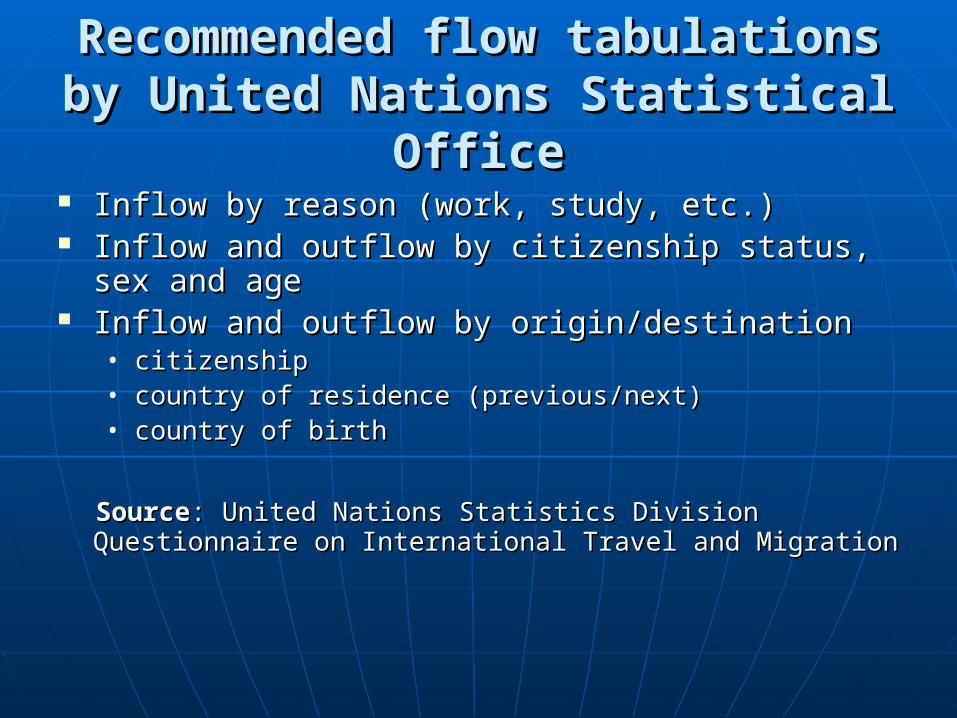
Recommended flow tabulations by Recommended flow tabulations by United Nations Statistical OfficeUnited Nations Statistical Office
Inflow by reason (work, study, etc.)Inflow by reason (work, study, etc.) Inflow and outflow by citizenship status, sex and Inflow and outflow by citizenship status, sex and
ageage Inflow and outflow by origin/destinationInflow and outflow by origin/destination
• citizenshipcitizenship• country of residence (previous/next)country of residence (previous/next)• country of birthcountry of birth
SourceSource: United Nations Statistics Division Questionnaire on : United Nations Statistics Division Questionnaire on International Travel and MigrationInternational Travel and Migration
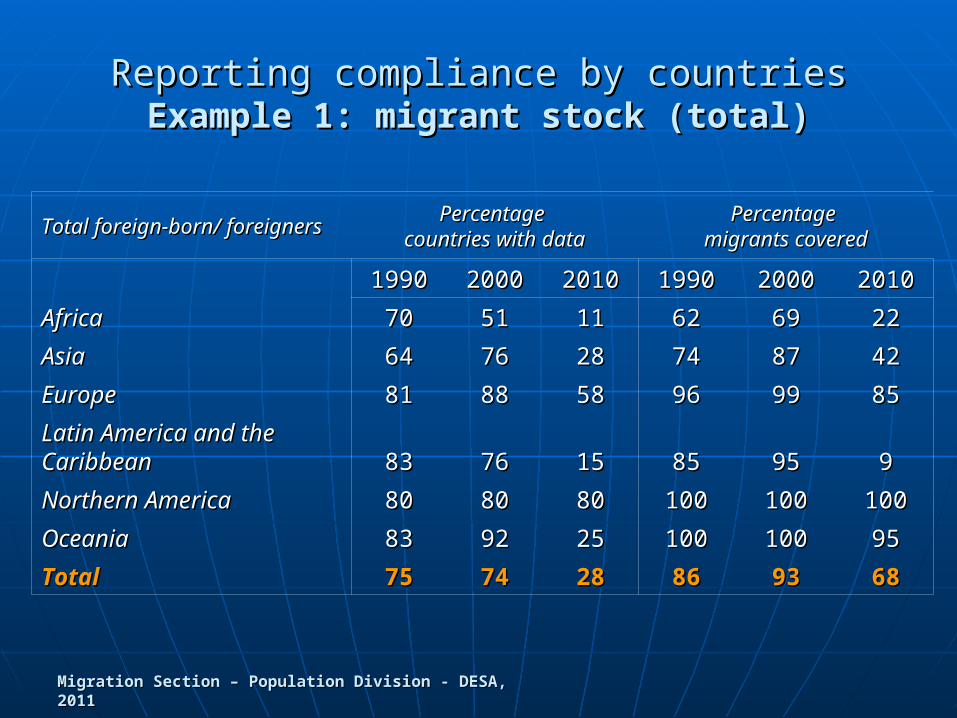
Reporting compliance by countriesReporting compliance by countriesExample 1: migrant stock (total)Example 1: migrant stock (total)
Total foreign-born/ Total foreign-born/ foreignersforeigners
Percentage Percentage countries with datacountries with data
Percentage Percentage migrants coveredmigrants covered
19901990 20002000 20102010 19901990 20002000 20102010
AfricaAfrica 7070 5151 1111 6262 6969 2222
AsiaAsia 6464 7676 2828 7474 8787 4242
EuropeEurope 8181 8888 5858 9696 9999 8585
Latin America and the Latin America and the CaribbeanCaribbean 8383 7676 1515 8585 9595 99
Northern AmericaNorthern America 8080 8080 8080 100100 100100 100100
OceaniaOceania 8383 9292 2525 100100 100100 9595
TotalTotal 7575 7474 2828 8686 9393 6868
Migration Section – Population Division - DESA, 2011Migration Section – Population Division - DESA, 2011
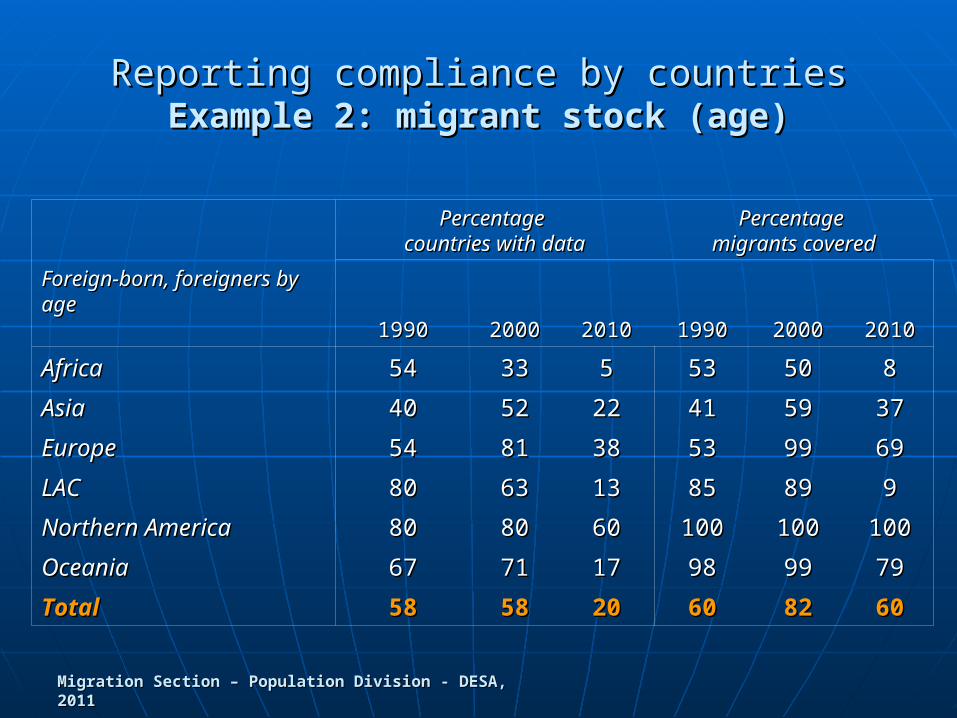
Reporting compliance by countriesReporting compliance by countriesExample 2: migrant stock (age)Example 2: migrant stock (age)
Foreign-born, foreigners Foreign-born, foreigners by ageby age
Percentage Percentage countries with datacountries with data
Percentage Percentage migrants coveredmigrants covered
19901990 20002000 20102010 19901990 20002000 20102010
AfricaAfrica 5454 3333 55 5353 5050 88
AsiaAsia 4040 5252 2222 4141 5959 3737
EuropeEurope 5454 8181 3838 5353 9999 6969
LACLAC 8080 6363 1313 8585 8989 99
Northern AmericaNorthern America 8080 8080 6060 100100 100100 100100
OceaniaOceania 6767 7171 1717 9898 9999 7979
TotalTotal 5858 5858 2020 6060 8282 6060
Migration Section – Population Division - DESA, 2011Migration Section – Population Division - DESA, 2011

Reporting compliance by countriesReporting compliance by countriesExample 3: migrant stock (origin)Example 3: migrant stock (origin)
Foreign-born, Foreigners Foreign-born, Foreigners by country of birth / by country of birth / citizenshipcitizenship
Percentage Percentage countries with datacountries with data
Percentage Percentage migrants coveredmigrants covered
19901990 20002000 20102010 19901990 20002000 20102010
AfricaAfrica 6565 4646 55 3333 8888 77
AsiaAsia 5050 6262 1616 5252 7575 1818
EuropeEurope 7979 8888 5656 8282 100100 8585
LACLAC 8383 7474 77 8181 100100 66
Northern AmericaNorthern America 8080 8080 8080 100100 100100 100100
OceaniaOceania 7575 7979 2525 9898 100100 9595
TotalTotal 7070 6868 2222 7171 9191 6060
Migration Section – Population Division - DESA, 2011Migration Section – Population Division - DESA, 2011

Reporting on migration flowsReporting on migration flows
CountryCountry FromFrom CountryCountry FromFrom CountryCountry FromFrom
ArmeniaArmenia 20002000 GermanyGermany 19651965 PolandPoland 19991999
AustraliaAustralia 19761976 GreeceGreece 20072007 PortugalPortugal 19921992
AustriaAustria 19961996 HungaryHungary 19951995 Rep. of MoldovaRep. of Moldova 19931993
AzerbaijanAzerbaijan 19951995 IcelandIceland 19861986 RomaniaRomania 19941994
BelarusBelarus 20002000 IrelandIreland 19871987 Russian Fed.Russian Fed. 19911991
BelgiumBelgium 19601960 IsraelIsrael 19951995 SlovakiaSlovakia 19931993
BulgariaBulgaria 20072007 ItalyItaly 19861986 SloveniaSlovenia 19961996
CanadaCanada 19641964 KazakhstanKazakhstan 20002000 SpainSpain 19831983
CroatiaCroatia 19921992 KyrgyzstanKyrgyzstan 19901990 SwedenSweden 19601960
CyprusCyprus 20022002 LatviaLatvia 19951995 SwitzerlandSwitzerland 19911991
Czech RepublicCzech Republic 19931993 LithuaniaLithuania 20002000 UkraineUkraine 20002000
DenmarkDenmark 19801980 Luxembourg dLuxembourg d 19801980 United KingdomUnited Kingdom 19601960
EstoniaEstonia 20042004 NetherlandsNetherlands 20002000 United StatesUnited States 20002000
FinlandFinland 19801980 New ZealandNew Zealand 19791979
FranceFrance 19941994 NorwayNorway 19801980
Migration Section – Population Division - DESA, 2011Migration Section – Population Division - DESA, 2011

Remittances (inflows US dollars)Remittances (inflows US dollars)
Source: World Bank, 2011
Remittances Inflows (US$ Remittances Inflows (US$ million)million)
20002000 20052005 20082008 20092009 2010e2010e Share of GDP, Share of GDP, 20092009
ArmeniaArmenia 8787 498498 10621062 769769 832832 8.8%8.8%
AzerbaijanAzerbaijan 5757 693693 15541554 12741274 14041404 3.0%3.0%
BelarusBelarus 139139 255255 443443 358358 375375 0.7%0.7%
GeorgiaGeorgia 274274 346346 732732 714714 808808 6.6%6.6%
KazakhstanKazakhstan 122122 178178 192192 124124 132132 0.1%0.1%
Kyrgyz RepublicKyrgyz Republic 99 322322 12321232 992992 11601160 21.7%21.7%
MoldovaMoldova 179179 920920 18971897 12111211 13061306 22.4%22.4%
Russian FederationRussian Federation 12751275 30123012 60336033 53595359 54775477 0.4%0.4%
TajikistanTajikistan .... 467467 25442544 17481748 20322032 35.1%35.1%
TurkmenistanTurkmenistan .... .... .... .... ....
UkraineUkraine 3333 595595 57695769 50735073 55955595 4.5%4.5%
UzbekistanUzbekistan .... .... .... .... ....

The cost of transferring remittances differs greatly across migration The cost of transferring remittances differs greatly across migration corridorscorridors
$6.6
$6.3
$4.8
$4.5
$3.2
$47.3
$39.2
$38.1
$36.5
$32.5
Saudi Arabia → Nepal
Qatar → India
Singapore → Philippines
Russian Federation → Azerbaijan
UAE → Pakistan
Tanzania → Kenya
Australia → PNG
Japan → Republic of Korea
Germany → Croatia
Ghana → Nigeria
Cost of sending US$ 200 in US$, third quarter 2010
Some of the least
expensivecorridors
Some of the most
expensive corridors
Source: World Bank, 2011Source: World Bank, 2011
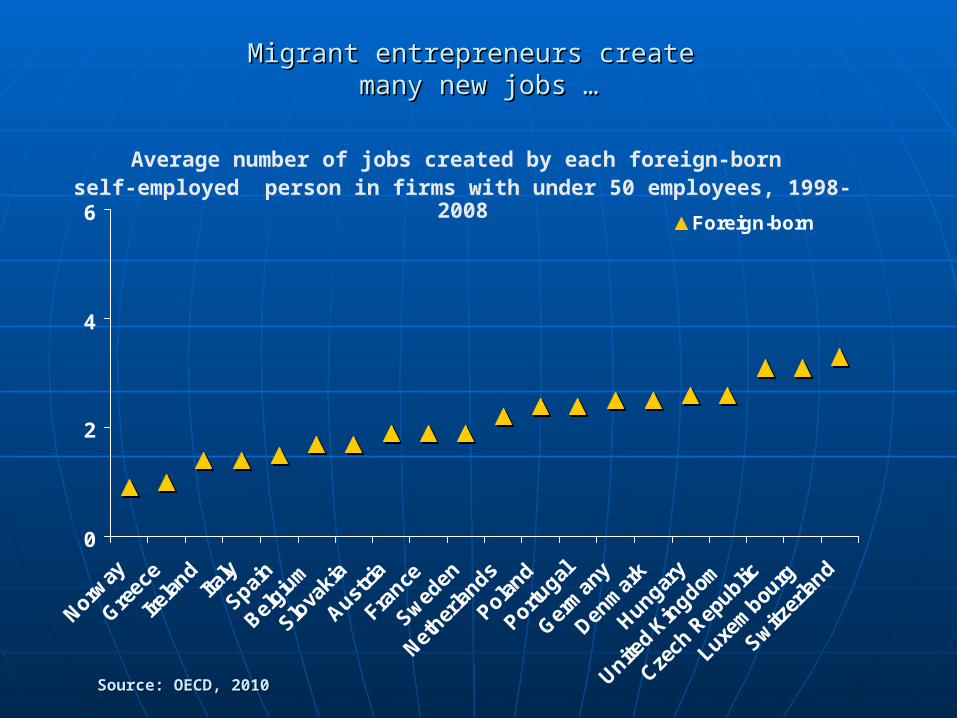
Migrant entrepreneurs create Migrant entrepreneurs create many new jobs …many new jobs …
0
2
4
6
Norway
Greec
e
Irela
ndIta
ly
Spain
Belgiu
m
Slova
kia
Austria
France
Sweden
Nether
lands
Poland
Portugal
Germ
any
Denm
ark
Hungary
United
Kingdom
Czech
Rep
ublic
Luxem
bourg
Switzer
land
Foreign-born
Average number of jobs created by each foreign-born self-employed person in firms with under 50 employees, 1998-2008
Source: OECD, 2010Source: OECD, 2010

… … almost as many as native-born entrepreneursalmost as many as native-born entrepreneurs
0
2
4
6
Norway
Greec
e
Irela
ndIta
ly
Spain
Belgiu
m
Slova
kia
Austria
France
Sweden
Nether
lands
Poland
Portugal
Germ
any
Denm
ark
Hungary
United
Kingdom
Czech
Rep
ublic
Luxem
bourg
Switzer
land
Foreign-born
Native-born
Average number of jobs created by each foreign- and native-born self-employed person in firms with under 50 employees, 1998-2008
Source: OECD, 2010Source: OECD, 2010
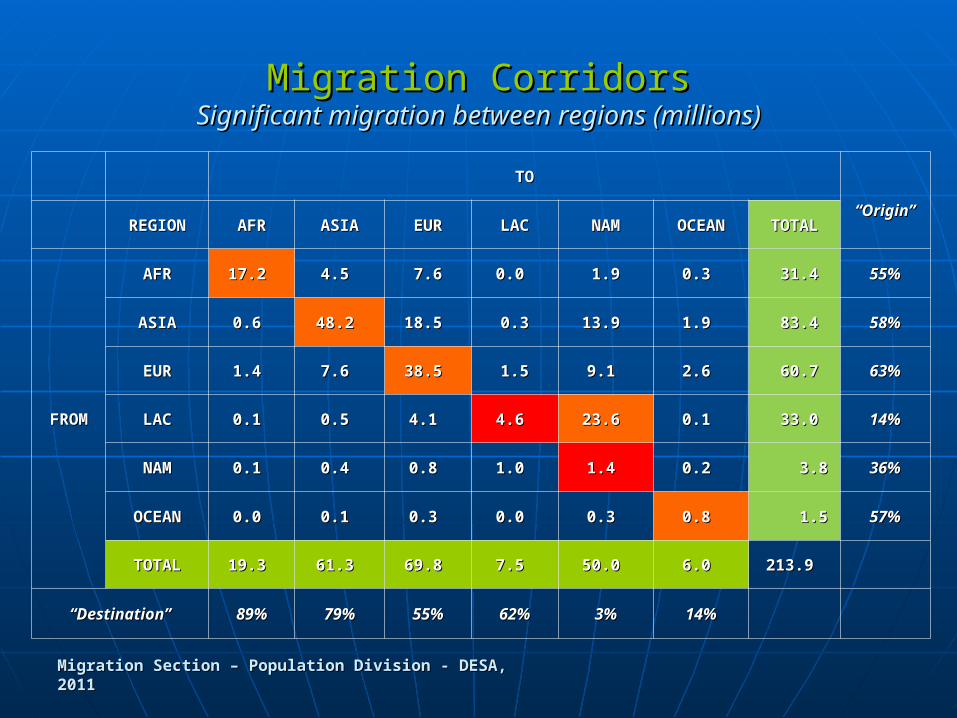
TOTO
““OriginOrigin”” REGIONREGION AFRAFR ASIAASIA EUREUR LACLAC NAMNAM OCEANOCEAN TOTALTOTAL
FROMFROM
AFRAFR 17.2 17.2 4.5 4.5 7.6 7.6 0.0 0.0 1.9 1.9 0.3 0.3 31.4 31.4 55%55%
ASIAASIA 0.6 0.6 48.2 48.2 18.5 18.5 0.30.3 13.9 13.9 1.9 1.9 83.4 83.4 58%58%
EUREUR 1.4 1.4 7.6 7.6 38.5 38.5 1.5 1.5 9.1 9.1 2.6 2.6 60.7 60.7 63%63%
LACLAC 0.1 0.1 0.5 0.5 4.1 4.1 4.6 4.6 23.6 23.6 0.1 0.1 33.0 33.0 14%14%
NAMNAM 0.1 0.1 0.4 0.4 0.8 0.8 1.0 1.0 1.4 1.4 0.2 0.2 3.8 3.8 36%36%
OCEANOCEAN 0.0 0.0 0.1 0.1 0.3 0.3 0.0 0.0 0.3 0.3 0.8 0.8 1.5 1.5 57%57%
TOTALTOTAL 19.3 19.3 61.3 61.3 69.8 69.8 7.5 7.5 50.0 50.0 6.0 6.0 213.9 213.9
““Destination”Destination” 89%89% 79%79% 55%55% 62%62% 3%3% 14%14%
Migration CorridorsMigration CorridorsSignificant migration between regions (millions)Significant migration between regions (millions)
Migration Section – Population Division - DESA, 2011Migration Section – Population Division - DESA, 2011

Migrant Stock by Age and SexMigrant Stock by Age and Sex Migrants in the ‘North’: older and a balanced sex ratio Migrants in the ‘North’: older and a balanced sex ratio
Migrants in the ‘South’: younger and males of working ageMigrants in the ‘South’: younger and males of working age
More developed regions Less developed regions
Males Females
0-45-9
10-1415-1920-2425-2930-3435-3940-4445-4950-5455-5960-64
65+
Males Females
0-45-9
10-1415-1920-2425-2930-3435-3940-4445-4950-5455-5960-64
65+
Migration Section – Population Division - DESA, 2011Migration Section – Population Division - DESA, 2011