regressive taxation and the welfare statecatdir.loc.gov/catdir/samples/cam041/2002035180.pdf ·...
TRANSCRIPT

P1: GCVCY231/Kato 0 521824524 June 28, 2003 1:39
Regressive Taxation and theWelfare State
PATH DEPENDENCE ANDPOLICY DIFFUSION
JUNKO KATOUniversity of Tokyo
v

P1: GCVCY231/Kato 0 521824524 June 28, 2003 1:39
PUBLISHED BY THE PRESS SYNDICATE OF THE UNIVERSITY OF CAMBRIDGEThe Pitt Building, Trumpington Street, Cambridge, United Kingdom
CAMBRIDGE UNIVERSITY PRESSThe Edinburgh Building, Cambridge CB2 2RU, UK40 West 20th Street, New York, NY 10011-4211, USA477 Williamstown Road, Port Melbourne, VIC 3207, AustraliaRuiz de Alarcon 13, 28014 Madrid, SpainDock House, The Waterfront, Cape Town 8001, South Africa
http://www.cambridge.org
c© Junko Kato 2003
This book is in copyright. Subject to statutory exceptionand to the provisions of relevant collective licensing agreements,no reproduction of any part may take place withoutthe written permission of Cambridge University Press.
First published 2003
Printed in the United States of America
Typeface Janson Text Roman 10/13 pt. System LATEX 2ε [TB]
A catalog record for this book is available from the British Library.
Library of Congress Cataloging in Publication Data
Kato, Junko, 1961–Regressive taxation and the welfare state : path dependence and policy diffusion /Junko Kato.
p. cm. – (Cambridge studies in comparative politics)Includes bibliographical references and index.ISBN 0-521-82452–41. Taxation. 2. Public welfare. 3. Expenditures, Public. I. Title. II. Series.
HJ2305.K28 2003330.12′6 – dc21
2002035180
ISBN 0 521 82452 4 hardback
vi
P1: GCVCY231/Kato 0 521824524 June 28, 2003 1:39
Contents
Preface page ix
1 ARGUMENT: PATH DEPENDENCY AND THEDIFFUSION OF A REGRESSIVE TAX 1The Funding Base of the Welfare State and a Progressive Tax:
A Cross-National Variation 3Policy Diffusion as a Case of Path Dependency 18Quantitative Evidence: Qualifying the Effects of
Globalization and Government Partisanship 34Conclusion 51
2 EUROPEAN VARIATION: SWEDEN,THE UNITED KINGDOM, AND FRANCE 53Variation in Welfare and Taxation 53Sweden: A Mature Welfare State with Regressive Taxation 58The United Kingdom: The Ambiguous Impact of
Neoconservative Rule 77France: Resistance to Welfare State Backlash and
Regressive Taxation 94Conclusion 110
3 CONTRASTING PAIRED COMPARISONS IN OCEANIAAND NORTH AMERICA 113Divergence and Convergence in the United States
and Canada 113The End of Parallels? Comparing New Zealand
and Australia 133Conclusion 156
vii

P1: GCVCY231/Kato 0 521824524 June 28, 2003 1:39
Contents
4 ANOTHER PATTERN OF PATH DEPENDENCE: ACOMPARISON BETWEEN JAPAN AND THE NEWLYDEVELOPING ECONOMIES 160The Diffusion of the Value Added Tax into Newly Developing
Economies 160Japan: Strong Opposition to Revenue Raising in a Small
Welfare State 170South Korea: The Funding Capacity of a Strong State 186Conclusion 192
5 THE POLITICAL FOUNDATION OF FINANCINGTHE WELFARE STATE: A COMPARATIVE VIEW 194Hypotheses Examined: The Coexistence of Regressive
Taxation and the Welfare State 194An Alternative Way to Development: A Path Away
from the Divergence? 199
Appendix: List of Variables Used for Statistical Analyses 217
Bibliography 223
Index 245
viii

P1: GCVCY231/Kato 0 521824524 June 28, 2003 9:2
1
Argument
PATH DEPENDENCY AND THEDIFFUSION OF A REGRESSIVETAX
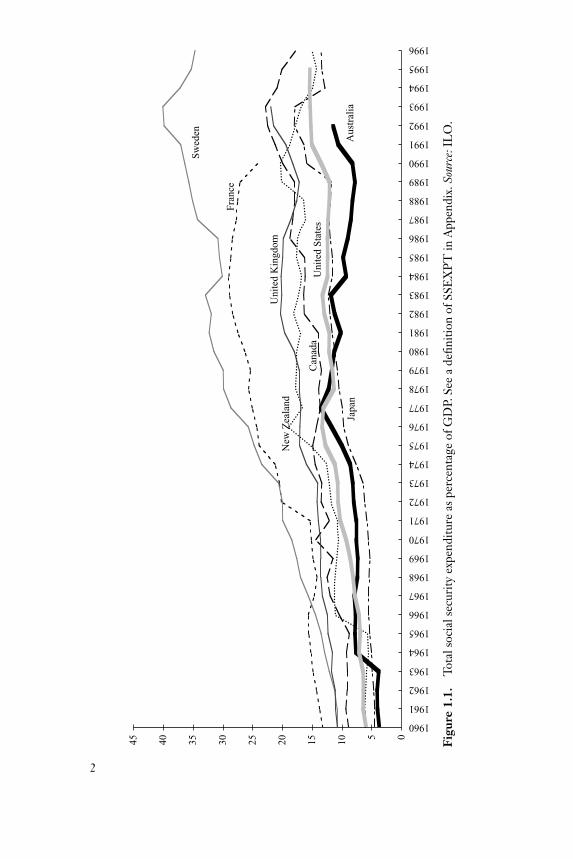
Economic stagnation and subsequent shortage of government revenuebrought the welfare state under intensive censure in the 1980s. The welfareexpenditures,1 which had expanded smoothly during the postwar high-growth period, became a primary target of retrenchment. Despite thisoverall trend, however, a cross-national comparison of the welfare statedefies a simplistic generalization. The golden-age expansion reinforceda demarcation between high-spending and low-spending countries, andmoreover, since the 1980s, high-spending countries have proved muchmore immune to welfare retrenchment than low-spending countries have.As a result, neither rapid expansion during the early postwar period norsubsequent chronic budget deficits have caused a convergence of spend-ing levels among welfare states (Figure 1.1). Tackling this puzzle headon, this study sheds new light on the funding base of the welfare state.Available financial sources serve to restore the public confidence in thewelfare state that was severely challenged in the 1980s, whereas financialscarcity makes welfare state backlash inevitable. The divergent fundingcapacity of the welfare state is path-dependent upon the institutionaliza-tion of regressive taxes. The institutionalization of revenue raising from
1 Generally, welfare spending or expenditure is used to mean a broader category than so-cial security spending or expenditure and, thus, often includes the cost of health andsometimes education. Social security expenditure is usually related directly to social secu-rity programs. Such a distinction is, however, conventional. One may calculate either socialsecurity or welfare expenditures based on certain criteria, but there is no uniform defini-tion of “expenditures” that are agreed upon and well applied across countries. Because therelative size of the welfare state across countries does not change significantly as a resultof the definitions of welfare or social security expenditure, here these terms are used in-terchangeably. The quantitative analysis presented later uses a specifically defined “socialsecurity expenditure.”
1
P1: GCVCY231/Kato 0 521824524 June 28, 2003 9:2
0510152025303540451960
1961
1962
1963
1964
1965
1966
1967
1968
1969
1970
1971
1972
1973
1974
1975
1976
1977
1978
1979
1980
1981
1982
1983
1984
1985
1986
1987
1988
1989
1990
1991
1992
1993
1994
1995
1996
Sw
eden
Fra
nce
Uni
ted
Sta
tes
Aus
tral
ia
Uni
ted
Kin
gdom
Japa
n
Can
ada
New
Zea
land
Figu
re1.
1.To
tals
ocia
lsec
urity
expe
nditu
reas
perc
enta
geof
GD
P.Se
ea
defin
ition
ofSS
EX
PT
inA
ppen
dix.
Sour
ce:I
LO
.
2
P1: GCVCY231/Kato 0 521824524 June 28, 2003 9:2
Funding Base
regressive taxes during a high-growth period has enabled the governmentto secure financial sources during times of low growth. In contrast, a gov-ernment’s attempt to institutionalize a regressive tax system during lowgrowth is thwarted by public suspicion that a new burden would be ex-hausted to solve deficits without any welfare compensation. Tax politicsultimately explains the diversification of high-spending and low-spendingcountries.
How a welfare state is financed has attracted little attention aside froma small number of works on public finance (Steinmo 1993; Peters 1991)and those on the history of taxation that consider this contemporary prob-lem (Webber and Wildavsky 1986; Levi 1988). A relative indifference tothe funding base and the exclusive concern with taxation as a means forredistribution is closely related. More specifically, if one regards taxation asanother measure for redistribution, one exclusive focus is a progressive in-come tax that applies discriminatory tax rates to redistribute income. Theimportance of the funding capacity of the welfare state is overshadowedby an overwhelming concern for redistribution through welfare programsand taxation. On the other hand, when one considers taxation importantfor financing the welfare state, the revenue-raising capacity of a regressivetax attracts new attention: a regressive tax, owing to its flat rate imposedon a uniform tax base, is more consistent with the financial needs of thegovernment.
The Funding Base of the Welfare State and a Progressive Tax:A Cross-National Variation
The two oil shocks in the 1970s triggered the end of high growth. Eco-nomic consideration has since worked as a restraint on the welfare state,and the funding capacity of a government has come to influence welfareretrenchment. Increasing the visibility of the tax burden and avoiding easyrevenue enhancements are more effective for welfare retrenchment in thelong run than cutting benefits and welfare expenditures under deficit-riddenfinance.2
2 This point parallels that of Pierson (1994), who conceptually distinguishes two forms ofwelfare retrenchment based on a comparison between the United States and the UnitedKingdom in the 1980s. The “systemic retrenchment” that alters “the context for futurespending decisions” is increasingly important for long-term change compared with “pro-grammatic retrenchment,” that is, cutting expenditures and lowering the level of provisionin welfare programs.
3

P1: GCVCY231/Kato 0 521824524 June 28, 2003 9:2
Path Dependency and Tax Diffusion
The funding base of the welfare state, however, is hard to explore becauseof the complicated financial relationship between general revenue and ex-penditure. For example, a part of the loss of tax revenue can be attributedto tax exemptions and special tax measures (tax expenditures) that are con-sidered another form of benefits if implemented for welfare purposes.3 Al-ternatively, a financial flow from the social security system into the generaltax revenue through taxes on social security benefits is now increasinglyimposed or planned to be introduced in more industrial democracies. Thesocial security budget surplus may also be used to contribute to decreasingthe apparent deficits in the public sector and thus lowering the pressure onthe government to increase taxes in general and/or cut public expenditures.4
Similar to the current financial intricacy, historically, several contingenciesand complicated interactions simultaneously caused the development of thewelfare state and the construction of the tax state.5
Welfare state development went hand in hand with the development ofthe tax state owing to the increasing financial needs of the government forredistribution. Despite a recurrent debate about which principle is supe-rior for redistribution,6 the welfare state with higher income equality hastended to adopt universalism instead of targeting. This increases the im-portance of the government’s funding capacity. Targeting, if it successfullyselects beneficiaries based on income level (i.e., means-testing), achievesequality with less expenditure, whereas a universal principle inevitablyrequires high tax revenue for financing universal provision to all, basedon criteria such as age, sickness, and disability regardless of income level(Table 1.1).7 There is a “paradox of redistribution”: “[t]he more we target
3 On this problem, see Howard (1997). I will discuss this problem thoroughly in Chapter 4in the section on the United States’ case.
4 A surplus within the social security system funded by contributions is included as a surplusin the government sector when the deficit is measured by the saving-investment gap of thegeneral government in national account statistics.
5 For example, during the interwar period of the Great Depression, policy makers recognizedthe failure of laissez-faire (Tanzi and Schuknecht 1995, 5), and big government was intro-duced at the same time as the surge of government-sponsored programs, including socialsecurity (Kelly and Ashford 1986). The postwar development of the welfare state was facil-itated by the legacy of the state’s capacity to raise revenue for urgent military expendituresduring the two world wars (Peacock, Wiseman, and Veverka 1967; Klausen 1998).
6 For example, see Skocpol (1991), Greenstein (1991), Rosenberry (1982), and Korpi (1980).Sen (1995) and Atkinson (1993) argue that, in reality, identifying beneficiaries and thenimplementing means-testing programs effectively are not easy.
7 Of course, the distinction between universalism and targeting in practice is not as simpleas discussed here. First, many countries combine the two different ideals in different ways
4
P1: GCVCY231/Kato 0 521824524 June 28, 2003 9:2
Funding Base
Table 1.1. Universalism and targeting compared
Principle Coverage Benefit
Universalism Universal Earnings-related or flat-rate
Targeting (means-tested) Earnings-related Flat-rate or earnings-related
benefits at the poor only and the more concerned we are with creatingequality via equal public transfers to all, the less likely we are to reducepoverty and inequality” (Korpi and Palme 1998, 26). Among eleven coun-tries compared by Korpi and Palme (1998), the Scandinavian countriesplus France and Germany have larger expenditures with less targeting, andtheir level of income equality is higher than in the United States, Canada,Australia, and Switzerland, which have smaller expenditures with more tar-geting. This tendency qualifies the emphasis on the “qualitative” aspectof welfare provision at the expense of “quantitative” analysis focused onexpenditures. As the critics of quantitative analysis argue, direct spend-ing is not an exclusive means for redistribution, and more spending isnot to be equated with more income equality in analyzing the effects ofwelfare programs. But, if more total spending tends to coexist with moreincome equality among the existing welfare states, one needs to examinehow it has been financed. This also redirects attention to the role of tax-ation as a financing, in addition to redistributive, measure for the welfarestate.
Progressive income taxation and a large social security program werean indisputable part of the welfare state in the 1950s and 1960s. Duringthis process, the conventional view emerged wherein the contemporarywelfare state was said to have expanded to raise revenue from progres-sive income taxation promoted by left-party governments. This viewhas implicitly and explicitly influenced the comparative perspective ofthe welfare state. For example, Esping-Andersen’s (1990) “three-world”
and to different degrees. Second, in some countries, such as Sweden, many social insuranceprograms are occupation-based and tied to employment. Thus, a universal welfare state isthe result of effective employment policy, that is, universal employment. Also, under theoccupation-based system, the extension of universal coverage accompanies a new entitlementfor those disadvantaged under the existing system that is more like targeting. Baldwin (1990,113) distinguishes this as “vertical” rather than “horizontal” universalism.
5
P1: GCVCY231/Kato 0 521824524 June 28, 2003 9:2
Path Dependency and Tax Diffusion
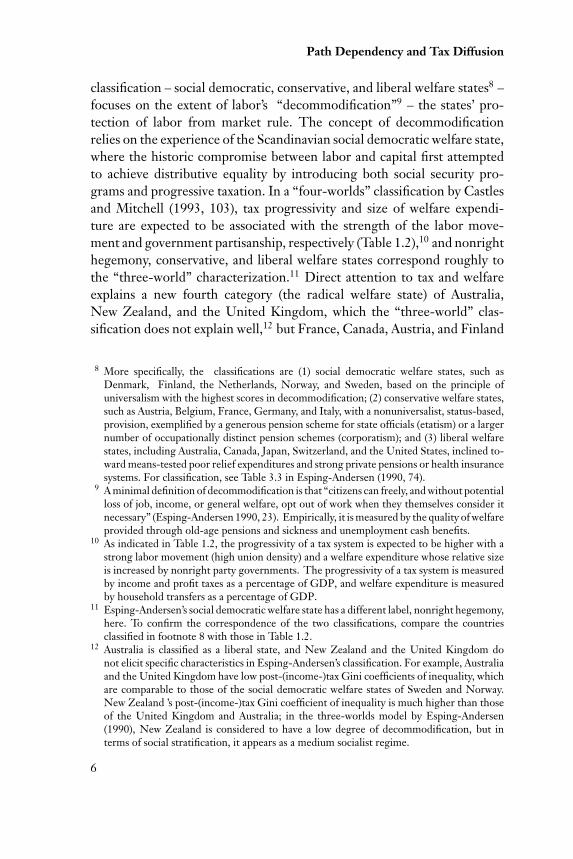
classification – social democratic, conservative, and liberal welfare states8 –focuses on the extent of labor’s “decommodification”9 – the states’ pro-tection of labor from market rule. The concept of decommodificationrelies on the experience of the Scandinavian social democratic welfare state,where the historic compromise between labor and capital first attemptedto achieve distributive equality by introducing both social security pro-grams and progressive taxation. In a “four-worlds” classification by Castlesand Mitchell (1993, 103), tax progressivity and size of welfare expendi-ture are expected to be associated with the strength of the labor move-ment and government partisanship, respectively (Table 1.2),10 and nonrighthegemony, conservative, and liberal welfare states correspond roughly tothe “three-world” characterization.11 Direct attention to tax and welfareexplains a new fourth category (the radical welfare state) of Australia,New Zealand, and the United Kingdom, which the “three-world” clas-sification does not explain well,12 but France, Canada, Austria, and Finland
8 More specifically, the classifications are (1) social democratic welfare states, such asDenmark, Finland, the Netherlands, Norway, and Sweden, based on the principle ofuniversalism with the highest scores in decommodification; (2) conservative welfare states,such as Austria, Belgium, France, Germany, and Italy, with a nonuniversalist, status-based,provision, exemplified by a generous pension scheme for state officials (etatism) or a largernumber of occupationally distinct pension schemes (corporatism); and (3) liberal welfarestates, including Australia, Canada, Japan, Switzerland, and the United States, inclined to-ward means-tested poor relief expenditures and strong private pensions or health insurancesystems. For classification, see Table 3.3 in Esping-Andersen (1990, 74).
9 A minimal definition of decommodification is that “citizens can freely, and without potentialloss of job, income, or general welfare, opt out of work when they themselves consider itnecessary” (Esping-Andersen 1990, 23). Empirically, it is measured by the quality of welfareprovided through old-age pensions and sickness and unemployment cash benefits.
10 As indicated in Table 1.2, the progressivity of a tax system is expected to be higher with astrong labor movement (high union density) and a welfare expenditure whose relative sizeis increased by nonright party governments. The progressivity of a tax system is measuredby income and profit taxes as a percentage of GDP, and welfare expenditure is measuredby household transfers as a percentage of GDP.
11 Esping-Andersen’s social democratic welfare state has a different label, nonright hegemony,here. To confirm the correspondence of the two classifications, compare the countriesclassified in footnote 8 with those in Table 1.2.
12 Australia is classified as a liberal state, and New Zealand and the United Kingdom donot elicit specific characteristics in Esping-Andersen’s classification. For example, Australiaand the United Kingdom have low post-(income-)tax Gini coefficients of inequality, whichare comparable to those of the social democratic welfare states of Sweden and Norway.New Zealand ’s post-(income-)tax Gini coefficient of inequality is much higher than thoseof the United Kingdom and Australia; in the three-worlds model by Esping-Andersen(1990), New Zealand is considered to have a low degree of decommodification, but interms of social stratification, it appears as a medium socialist regime.
6
P1: GCVCY231/Kato 0 521824524 June 28, 2003 9:2
Funding Base
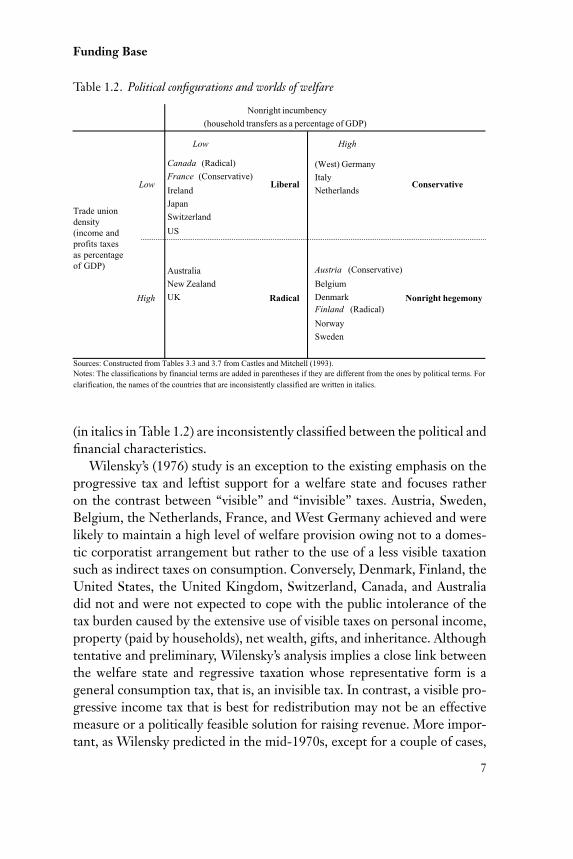
Table 1.2. Political configurations and worlds of welfare
Canada (Radical) (West) GermanyFrance (Conservative) Italy
Ireland Netherlands
Japan
Switzerland
US
Australia Austria (Conservative)
New Zealand Belgium
UK DenmarkFinland (Radical)
Norway
Sweden
Sources: Constructed from Tables 3.3 and 3.7 from Castles and Mitchell (1993).Notes: The classifications by financial terms are added in parentheses if they are different from the ones by political terms. For
clarification, the names of the countries that are inconsistently classified are written in italics.
Nonright hegemony
High
Nonright incumbency
(household transfers as a percentage of GDP)
Low
High
Low
Liberal Conservative
Radical
Trade uniondensity(income andprofits taxesas percentageof GDP)
(in italics in Table 1.2) are inconsistently classified between the political andfinancial characteristics.
Wilensky’s (1976) study is an exception to the existing emphasis on theprogressive tax and leftist support for a welfare state and focuses ratheron the contrast between “visible” and “invisible” taxes. Austria, Sweden,Belgium, the Netherlands, France, and West Germany achieved and werelikely to maintain a high level of welfare provision owing not to a domes-tic corporatist arrangement but rather to the use of a less visible taxationsuch as indirect taxes on consumption. Conversely, Denmark, Finland, theUnited States, the United Kingdom, Switzerland, Canada, and Australiadid not and were not expected to cope with the public intolerance of thetax burden caused by the extensive use of visible taxes on personal income,property (paid by households), net wealth, gifts, and inheritance. Althoughtentative and preliminary, Wilensky’s analysis implies a close link betweenthe welfare state and regressive taxation whose representative form is ageneral consumption tax, that is, an invisible tax. In contrast, a visible pro-gressive income tax that is best for redistribution may not be an effectivemeasure or a politically feasible solution for raising revenue. More impor-tant, as Wilensky predicted in the mid-1970s, except for a couple of cases,
7

P1: GCVCY231/Kato 0 521824524 June 28, 2003 9:2
Path Dependency and Tax Diffusion
such as Denmark and Finland, the countries with invisible taxes have hada higher tax level and more universal welfare provision than the countrieswith visible taxes. In politics, when the gap between expected expenditureand necessary revenue is common knowledge, the weak revenue-raisingpower of the government more effectively constrains welfare expenditures.For the last decades of low growth, the diffusion of regressive (invisible)taxes has thus consolidated this diversification.
Cross-National Variation in Tax Revenue Structures
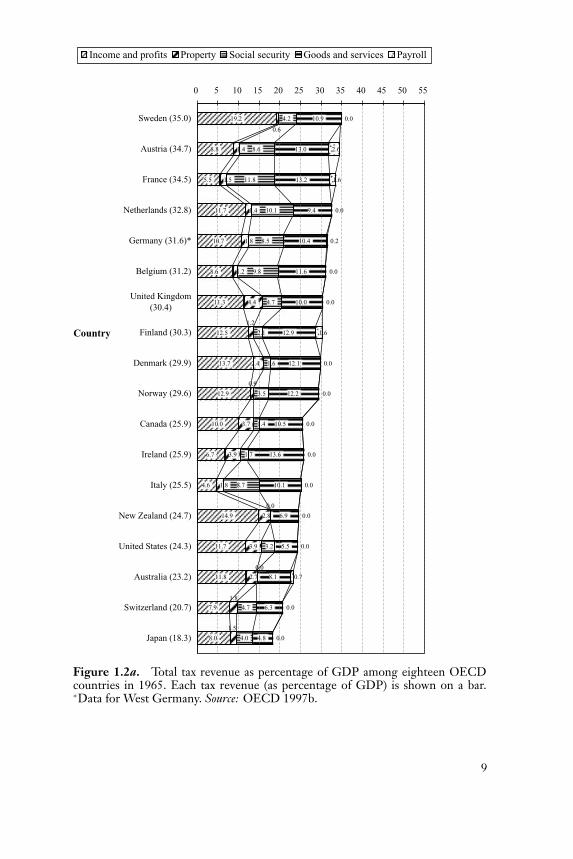
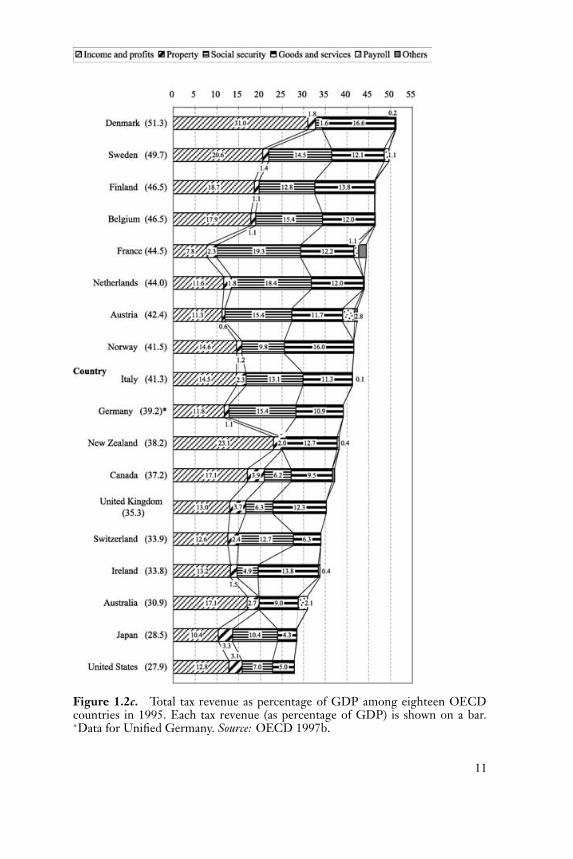
Between 1965 and 1980, the level of total tax revenue (as a percentage shareof gross domestic product, GDP) and the composition of the tax revenuestructure among eighteen Organisation for Economic Co-operation andDevelopment (OECD) countries were different, although all countries in-creased their tax levels (Figure 1.2a,b). There were shifts in degree in a fewcountries relative to other countries; that is, some Scandinavian countriesbecame higher-tax countries, and the United Kingdom reached a mediumlevel. Each country’s tax revenue structure and its relative size of total taxrevenue were preserved; thus, the overall tendency was maintained in 1995and 2000 (Figure 1.2c,d ): high-tax countries have continued to increasetheir level with no sign of convergence with low-tax countries. A differ-ence in relative composition of tax revenue that was already observed in the1980s has thus only become explicit among countries.
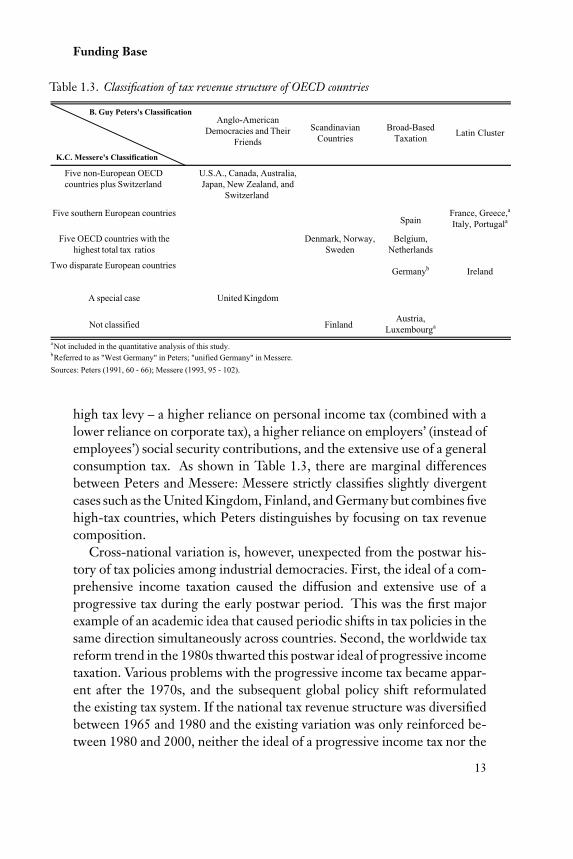
The cross-national variation that emerged is more clearly summarized inTable 1.3, which cross-tabulates four clusters by Peters (1991) and six casesby Messere (1993). Peters’s13 “Anglo-American cluster” countries with ahigher reliance on property, corporate, and personal income tax are in sharpcontrast to the “Latin cluster” countries that rely heavily on indirect taxationincluding employers’ social security contributions and general consumptiontaxes, such as the value-added tax, customs duties, and excises. “Broad-basedtaxation” is characterized by an almost equal use of all taxes that is closeto the OECD average level of taxation. The “Scandinavian cluster” has a
13 Peters (1991, 58–66) distinguishes four clusters by a cluster analysis explaining the variationsin taxation among the twenty-two OECD members countries. Three countries – Iceland,Turkey, and Yugoslavia – are excluded for lack of data. Thus, in addition to the eighteenOECD countries analyzed here, Peters’s analysis includes Greece, Luxembourg, Spain, andPortugal. He uses a composite measure of the percentage share in total revenue of elevendifferent taxes: personal income tax, corporate income tax, social security contributions,sales and value-added taxes, customs, excise and real estate taxes, and wealth, estate, andgift taxations.
8
P1: GCVCY231/Kato 0 521824524 June 28, 2003 9:2
19.2
8.8
5.5
11.7
10.7
8.6
11.3
12.5
13.7
12.9
10.0
6.7
4.6
14.9
11.7
11.8
7.9
8.0
1.4
1.5
1.4
1.8
1.2
4.4
3.7
3.9
1.8
2.8
3.9
2.7
4.2
8.6
11.8
10.1
8.5
9.8
4.7
2.1
1.6
3.5
1.4
1.7
8.7
3.2
4.7
4.0
10.9
13.0
13.2
9.4
10.4
11.6
10.0
12.9
12.1
12.2
10.5
13.6
10.1
6.9
5.5
8.1
6.3
4.8
0.0
2.6
1.6
0.0
0.2
0.0
0.0
1.6
0.0
0.0
0.0
0.0
0.0
0.0
0.0
0.7
0.0
0.0
1.5
1.8
0.9
2.4
1.2
0.6
0.0
0.0
0 5 10 15 20 25 30 35 40 45 50 55
Sweden (35.0)
Austria (34.7)
France (34.5)
Netherlands (32.8)
Germany (31.6)*
Belgium (31.2)
United Kingdom(30.4)
Finland (30.3)
Denmark (29.9)
Norway (29.6)
Canada (25.9)
Ireland (25.9)
Italy (25.5)
New Zealand (24.7)
United States (24.3)
Australia (23.2)
Switzerland (20.7)
Japan (18.3)
Country
Income and profits Property Social security Goods and services Payroll
Figure 1.2a. Total tax revenue as percentage of GDP among eighteen OECDcountries in 1965. Each tax revenue (as percentage of GDP) is shown on a bar.∗Data for West Germany. Source: OECD 1997b.
9

P1: GCVCY231/Kato 0 521824524 June 28, 2003 9:2
Figure 1.2b. Total tax revenue as percentage of GDP among eighteen OECDcountries in 1980. Each tax revenue (as percentage of GDP) is shown on a bar.∗Data for West Germany. Source: OECD 1997b.
10
P1: GCVCY231/Kato 0 521824524 June 28, 2003 9:2
Figure 1.2c. Total tax revenue as percentage of GDP among eighteen OECDcountries in 1995. Each tax revenue (as percentage of GDP) is shown on a bar.∗Data for Unified Germany. Source: OECD 1997b.
11

P1: GCVCY231/Kato 0 521824524 June 28, 2003 9:2
Figure 1.2d. Total tax revenue as percentage of GDP among eighteen OECDcountries in 2000. Each tax revenue (as percentage of GDP) is shown on a bar. Theyear in parentheses is the year when the VAT was introduced. ∗Data for UnifiedGermany. ∗∗Tax revenue in 1999. Source: OECD 2001a.
12
P1: GCVCY231/Kato 0 521824524 June 28, 2003 9:2
Funding Base
Table 1.3. Classification of tax revenue structure of OECD countries
Anglo-AmericanDemocracies and Their
Friends
ScandinavianCountries
Broad-BasedTaxation
Latin Cluster
Five non-European OECDcountries plus Switzerland
U.S.A., Canada, Australia,Japan, New Zealand, and
Switzerland
Five southern European countriesSpain
France, Greece,a
Italy, Portugala
Five OECD countries with thehighest total tax ratios
Denmark, Norway,Sweden
Belgium,Netherlands
Two disparate European countries Germanyb Ireland
A special case United Kingdom
Not classified FinlandAustria,
Luxembourga
a Not included in the quantitative analysis of this study.b Referred to as "West Germany" in Peters; "unified Germany" in Messere.
Sources: Peters (1991, 60 - 66); Messere (1993, 95 - 102).
B. Guy Peters's Classification
K.C. Messere's Classification
high tax levy – a higher reliance on personal income tax (combined with alower reliance on corporate tax), a higher reliance on employers’ (instead ofemployees’) social security contributions, and the extensive use of a generalconsumption tax. As shown in Table 1.3, there are marginal differencesbetween Peters and Messere: Messere strictly classifies slightly divergentcases such as the United Kingdom, Finland, and Germany but combines fivehigh-tax countries, which Peters distinguishes by focusing on tax revenuecomposition.
Cross-national variation is, however, unexpected from the postwar his-tory of tax policies among industrial democracies. First, the ideal of a com-prehensive income taxation caused the diffusion and extensive use of aprogressive tax during the early postwar period. This was the first majorexample of an academic idea that caused periodic shifts in tax policies in thesame direction simultaneously across countries. Second, the worldwide taxreform trend in the 1980s thwarted this postwar ideal of progressive incometaxation. Various problems with the progressive income tax became appar-ent after the 1970s, and the subsequent global policy shift reformulatedthe existing tax system. If the national tax revenue structure was diversifiedbetween 1965 and 1980 and the existing variation was only reinforced be-tween 1980 and 2000, neither the ideal of a progressive income tax nor the
13
P1: GCVCY231/Kato 0 521824524 June 28, 2003 9:2
Path Dependency and Tax Diffusion
reversal of that ideal in the 1980s led to the diffusion of similar tax revenuestructures across countries.
To tackle this puzzle, the background and consequences of the globalreform in the 1980s are clarified in terms of the reversal of the ideal ofprogressive income taxation.14
1. High inflation in the advanced democracies in the 1970s had pushedup nominal incomes, which had pushed many taxpayers (with sub-stantially lower incomes) into higher tax brackets in a progressivetax system not indexed for inflation. Implementing special tax treat-ments and exemptions eroded the tax base and complicated the sys-tem. In addition, the governments could not efficiently raise revenuefrom income taxation that was sensitive to the global depression andstagflation after the mid-1970s. To cope with the increasing complex-ities and inefficiencies, since the 1980s, personal income tax rates,especially the top rates, have been reduced along with a compressionof the number of brackets and a broadening of the base by repealingreliefs and exemptions in many countries (see Table 1.4).
2. A high corporate tax rate is likely to cause capital flight duringthe globalization of economic activities. This not only is harm-ful for a nation’s economic competitiveness but also obstructs agovernment’s attempt to secure revenue. Thus, a rate reductionand a broadening of the tax base were also advanced in corporatetaxes.
3. The shift of revenue reliance from income to consumption is thelast prominent feature of global reform because governments at-tempted to finance personal and corporate income tax cuts partlyor fully by increasing other taxes. Aside from the exception of the“revenue neutral” reform during the U.S. Reagan administration,other countries tended to finance income tax cuts by shifting rev-enue reliance to a tax on consumption, especially the value-added tax(VAT) (Sandford 1993a, 14). This resulted in increasing revenuereliance on regressive levies – a flat-rate tax on consumption andsocial security contributions. Social security contributions15 began
14 For more detailed changes in the 1980s, see Pechman (1988), Boskin and McLure (1990),and Sandford (1993a; 1993b).
15 Social security contributions earmarked for social security expenditures are technicallydistinguished from taxes but are classified as a part of the total tax revenue in statistics byOECD. This study follows the system of classification that is consistent with the argument
14

P1: GCVCY231/Kato 0 521824524 June 28, 2003 9:2
Funding Base
Table 1.4. Variations in rate schedules of central government income tax,1986 and 1990
Number of Bracketsa Top Rates First Positive Rates
1986 1990 1986 1990 1986 1990
Australia 5* 4* 57 47 24 21
Austria 10 5 62 50 21 10
Belgium 12* 7* 72 55 24 25
Canada 10 3 34 29 6 17
Denmark 3 3 45 40 20 22
Finland 11 6* 51 43 6 9
France 12* 12* 65 57 5 5
Germanyb 56 53 22 19
Ireland 3 3 58 53 35 30
Italy 9 7 62 50 12 10
Japan 15 5 70 50 10.5 10
Netherlands 9 3 72 60 16 13
New Zealand 6 2 57 33 17.5 24
Norway 8* 2* 40 20 3 10
Spain 34 16 66 56 8 25
Swedenc 10* 1* 50 20 4 20
Switzerland 6 6* 13 13 1 1
United Kingdom 6 2 60 40 29 25
United States 14 2 50 28 11 15
a Excluding zero rate as a bracket. Those with a zero-rate bracket marked with (*).b Number of brackets excluded because the tax schedule is based on a formula and does not have brackets.c Refers to 1991.
Source: OECD 1993.
Notes: Where countries have substantial state and local government income taxes, the central government rateschedules will not reflect the full range of rates of tax on income of these countries.
almost simultaneously with the increase in personal income taxationin the early decade and have continued to maintain their level untilrecently.
The shift summarized here is observed when revenue composition as aproportion of the total tax revenue is averaged across eighteen OECD countriesover the last three decades (Figure 1.3). The unweighted average of
here. The regressivity of social security contributions could be alleviated by allowingexemptions or reductions for low-income earners, but their levies by a flat rate is principallyregressive.
15

P1: GCVCY231/Kato 0 521824524 June 28, 2003 9:2
Figu
re1.
3.C
hang
esin
maj
orre
venu
eso
urce
sasp
erce
ntag
eof
tota
ltax
rece
ipts
aver
aged
acro
ssei
ghte
enO
EC
Dco
untr
ies.
Sour
ce:O
EC
D20
01a.
16