regular meeting of the 2401 colonial drive, 3 floor
TRANSCRIPT

The Board of Investments makes reasonable accommodations for any known disability that may interfere with a person’s ability to participate in public meetings. Persons needing an accommodation must notify the Board (call 444-0001 or write to P.O. Box 200126, Helena, Montana 59620) no later than three days prior to the meeting to allow adequate time to make needed arrangements.
REGULAR MEETING OF THE
MONTANA BOARD OF INVESTMENTS
2401 Colonial Drive, 3rd Floor, Helena, MT 59601
Zoom Available for Guests and Staff
June 1-2, 2021
COMMITTEE MEETINGS
A. Audit Committee – Maggie Peterson, Chair 9:30 AM
1. Public Comment – Public Comment on issues with Committee Jurisdiction
2. Approval of April 20, 2021 Committee Minutes
3. Executive Director Comments
4. Accounting Review
5. Charter Review – Decision
6. Audit Checklist
7. Governance Policy – Decisions
B. Loan Committee – Jack Prothero, Chair 10:15 AM
1. Public Comment – Public Comment on issues with Committee Jurisdiction
2. Approval of April 20, 2021 Committee Meeting Minutes
3. Executive Director Comments
4. Master Loan Agreement, MFFA – Adam Gill, Executive Director, MFFA – Decisions
5. INTERCAP Loan Requests – Decisions
6. Loan Policy Revisions – Decision
C. Human Resource Committee – Terry Cohea, Chair 10:45 AM
1. Public Comment – Public Comment on issues with Committee Jurisdiction
2. Executive Director Comments – CLOSED* -
3. Staffing Level Review – CLOSED* -
4. Exempt Staff Job Descriptions, Performance & Compensation Review – CLOSED* - Decisions
LUNCH SERVED 12:00 PM
Tab 1 CALL TO ORDER – Karl Englund, Chairman 1:00 PM
A. Notice of Video Recording of Meeting
B. Roll Call
C. Public Comment – Public Comment on issues with Board Jurisdiction
D. Approval of the April 20, 2021 Meeting Minutes
E. Administrative Business
1. Audit Committee Report – Decisions
2. Loan Committee Report - Decisions
3. Human Resource Committee Report - Decisions
F. Comments from TRS and PERS Board Members
G. Comments from Board Legislative Liaisons
Tab 2 EXECUTIVE DIRECTOR REPORTS – Dan Villa 1:15 PM
A. Member Requests from Prior Meeting
B. Monthly Snapshot
C. Monthly Website Traffic
D. Budget Status YTD
E. LPAC Cost Reports

The Board of Investments makes reasonable accommodations for any known disability that may interfere with a person’s ability to participate in public meetings. Persons needing an accommodation must notify the Board (call 444-0001 or write to P.O. Box 200126, Helena, Montana 59620) no later than three days prior to the meeting to allow adequate time to make needed arrangements.
Tab 3 MONTANA LOAN PROGRAM – Doug Hill 1:45 PM
A. Commercial and Residential Portfolios Report
Tab 4 BOND PROGRAM – Louise Welsh 2:00 PM
A. INTERCAP
1. Activity Summary
2. Staff Approved Loans Report
3. Overview and Program Highlights
Tab 5 INVESTMENTS – NEW COMMITMENTS 2:15 PM
A. Real Estate/Real Assets – Ethan Hurley, CAIA
B. Private Investments – Thomas Winkler, CAIA
BREAK 3:00 PM
Tab 6 WORK PLAN
A. Policy Statement Review – Decisions 3:15 PM
1. STIP IPS
2. Public Retirement Plans IPS
3. State Fund IPS
4. Permanent Coal Trust IPS
Tab 7 CORE FIXED INCOME ASSET CLASS REVIEW – John Romasko, CFA 3:45 PM
RECESS 5:00 PM
RECONVENE – DAY 2
CALL TO ORDER – Karl Englund, Chairman 9:30 AM
A. Notice of Video Recording of Meeting
B. Roll Call
C. Public Comment – Public Comment on issues with Board Jurisdiction
Tab 8 REAL ESTATE ASSET CLASS REVIEW – Ethan Hurley, CAIA 9:45 AM
BREAK 11:00 AM
Tab 9 RVK, Inc. 11:15 AM
LUNCH SERVED 12:15 PM
Tab 10 INVESTMENT UPDATE 1:15 PM
A. CIO Update – Jon Putnam, CFA, FRM, CAIA
B. Macro Attribution – Eron Krpan, CFA, CIPM
C. Private Investments – Michael Nguyen
D. Real Estate – Ethan Hurley, CAIA
E. Real Assets – Ethan Hurley, CAIA
F. Core Fixed Income – John Romasko, CFA
G. Non-Core Fixed Income – Jason Brent, CFA, CAIA
H. Domestic Equity – Rande Muffick, CFA
I. International Equity – Rande Muffick, CFA
J. STIP – Kirsten Haswell
K. State Fund – John Romasko, CFA
L. Trust Funds Investment Pool – John Romasko, CFA
RECAP OF STAFF TO DO LIST AND ADJOURNMENT – Karl Englund, Chairman 3:00 PM * Under Montana Law, meetings may be closed to discuss litigation strategy protected by the attorney-client privilege, as well as human resource
issues or investment strategy for the protection of confidential information and when the individual right to privacy exceeds the public’s right know. No
decisions are made in closed session and all motions will be and must be made and recorded during a public meeting.

The Board of Investments makes reasonable accommodations for any known disability that may interfere with a person’s ability to participate in public meetings. Persons needing an accommodation must notify the Board (call 444-0001 or write to P.O. Box 200126, Helena, Montana 59620) no later than three days prior to the meeting to allow adequate time to make needed arrangements.
REGULAR BOARD MEETING MINUTES
April 20, 2021
Call to Order
The Board of Investment’s meeting was called to order by Chairman Karl Englund at 11:15
a.m., on Tuesday, April 20, 2021.
Attendance
Board Members Present: Chairman Karl Englund, Jack Prothero, Jeff Greenfield, Bruce
Nelson, Diane Fladmo, Maggie Peterson, Mark Barry, Jeff Meredith
Board Members Absent: Terry Cohea
Legislative Liaisons Present: None
Board Staff Present: Dan Villa, Doug Hill, Sheli Jacoby, Lindsay Ford, Peggy MacEwen,
April Madden, Jon Putnam, Kirsten Haswell, Julie Feldman, Rande Muffick, John Romasko,
Savannah Morgan, Louise Welsh, Polly Boutin, Sam Holman, Thomas Winkler, Kelsey
Gauthier, Michael Nguyen, Jason Brent, Ethan Hurley, John Carpenter, Dan Zarling, Emily
Kovarik, Sue Tinsley, Tim House, Dan Whyte, Steve Strong, Eron Krpan, Teri Kolnik, Roberta
Diaz, Tammy Lindgren, Mark Lodman
Interested Parties Present: Mark Higgins, Becky Gratsinger, Jim Voytko – RVK; Joseph
Schulman – JP Morgan; Mc Cyril Espanol – Pageant Media
April 20, 2021
Tab 1 CALL TO ORDER (08:01:40)
A. Notice of Video Recording (08:01:55)
Chairman Englund advised of audio and video recording of the meeting.
B. Roll Call (08:02:05)
Roll was taken: eight Board members were present, forming a quorum.
C. Public Comment (08:02:45)
Chairman Englund asked for public comment. None was given.
D. Approval of Minutes (08:03:06)
February 23-24, 2021, Regular Board Meeting
Member Barry moved to approve. Member Fladmo seconded the motion
which passed unanimously.

The Board of Investments makes reasonable accommodations for any known disability that may interfere with a person’s ability to participate in public meetings. Persons needing an accommodation must notify the Board (call 444-0001 or write to P.O. Box 200126, Helena, Montana 59620) no later than three days prior to the meeting to allow adequate time to make needed arrangements.
March 23, 2021, Special Board Meeting
Member Barry noted section 5 of the minutes were approved “as presented
with changes”. Member Nelson moved to approve with Member Barry’s
suggested edits. Member Fladmo seconded the motion which passed
unanimously.
E. Administrative Business
1. Audit Committee Report (08:05:49)
Chair Peterson briefed the Board.
• Chair Peterson moved to approve the updated Continuation of
Operations Manual as amended for editorial corrections. Member
Prothero seconded the motion which passed unanimously.
• Chair Peterson moved to approve the updated Internal Control
Policy as amended for editorial corrections. Member Barry
seconded the motion which passed unanimously.
2. Loan Committee Report (08:09:31)
Chair Prothero briefed the Board.
3. HR Committee Report (08:10:50)
Acting Chair Fladmo briefed the Board.
F. Comments from TRS and PERS Board Members (08:11:57)
Member Greenfield and Member Peterson briefed the Board.
G. Comments from Board Legislative Liaisons (08:14:39)
None
Tab 2 EXECUTIVE DIRECTOR REPORTS (08:15:01)
A. Member Requests or Follow up from Prior Meeting
Executive Director Villa briefed the Board.
B. Monthly Snapshot
Executive Director Villa briefed the Board.
C. Monthly Web Traffic
Executive Director Villa briefed the Board.
D. Disaster Recovery and Emergency Preparedness
Executive Director Villa briefed the Board.
E. Legislative Update
Executive Director Villa briefed the Board.
F. Administrative Rule Review
Executive Director Villa and Dan Whyte briefed the Board and answered
questions.

The Board of Investments makes reasonable accommodations for any known disability that may interfere with a person’s ability to participate in public meetings. Persons needing an accommodation must notify the Board (call 444-0001 or write to P.O. Box 200126, Helena, Montana 59620) no later than three days prior to the meeting to allow adequate time to make needed arrangements.
Member Peterson moved to approve the Administrative Rules as presented.
Member Fladmo seconded the motion which passed unanimously.
Tab 5 INVESTMENT POLICY STATEMENTS (08:42:35)
A. Trust Funds Investment Policy
John Romasko and Jon Putnam briefed the Board and answered questions.
Member Prothero moved to approve the policy as presented. Member Fladmo
seconded the motion which passed unanimously.
B. Clark Fork River Reserve Investment Policy
John Romasko briefed the Board and answered questions.
Member Barry moved to approve the policy as presented. Member Peterson
seconded the motion which passed unanimously.
Tab 6 WORK PLAN (09:01:14)
Rande Muffick, Steve Strong, and Jason Brent briefed the Board and answered
questions.
Tab 7 CAPITAL MARKET/ASSET ALLOCATION,RVK, Inc. (10:36:13)
Jim Voytko, Mark Higgins, and Becky Gratsinger briefed the Board and answered
questions.
RECAP OF STAFF TO DO LIST AND ADJOURNMENT
Chairman Englund and Executive Director Villa listed items to recap.
Chairman Englund adjourned the meeting at 4:21 pm.
MONTANA BOARD OF INVESTMENTS
APPROVE: _______________________ _______
Karl J. Englund, Chairman
ATTEST: _________________________ _______
Dan Villa, Executive Director
DATE: April 20, 2021

2401 COLONIAL DRIVE, 3rd FLOOR, HELENA, MT 59602
P.O. BOX 200126, HELENA, MT 59620 - 0126
406-444-0001 | INVESTMENTMT.COM
MONTANA
TO: Members of the Board
FROM: Dan Villa, Executive Director
DATE: May 21, 2021
RE: June Executive Directors Report
A. Member Requests from Prior Meeting
a. Updated copy of COOP/IC Plan sent to members in early May
B. Monthly Snapshot – attached
C. Monthly Website Traffic
D. Budget Status YTD – attached
E. LPAC Cost Reports
Staff is required to report to the Board on the costs associated with Limited
Partner Advisory Committees (LPAC) attendance. Given the pandemic, no
costs were incurred in the prior fiscal year. I have attached some general
information regarding LPAC’s from the Institutional Limited Partners Association
for your information.

2401 COLONIAL DRIVE, HELENA, MT 59620
P.O. BOX 200126, HELENA, MT 59620
406-444-0001
INVESTMENTMT.COM

$23,745,755,350
Pensions NAV % TFIP NAV % State Fund NAV % Other Fixed Income & Pending (206,650,732)$
DOMESTIC EQUITY 4,510,856,278$ 31.8% Fixed Income 2,014,043,028$ 74.65% Fixed Income 1,202,668,679$ 75.16%
INTERNATIONAL EQUITY 2,614,906,692$ 18.5% Real Estate 433,936,624$ 16.08% Equity 215,114,912$ 13.44% STIP* NAV %
CORE FIXED INCOME 2,069,111,859$ 14.6% Non-Core Fixed Income 211,246,544$ 7.83% Real Estate 98,139,306$ 6.13% ASSET BACKED COMMERCIAL PAPER $2,149,955,417 39.18%
PRIVATE INVESTMENTS 1,939,411,513$ 13.7% STIP 38,814,392$ 1.44% STIP 44,499,903$ 2.78% CERTIFICATES OF DEPOSITS $1,442,064,709 26.28%
REAL ESTATE 1,297,701,824$ 9.2% (blank) 0.00% High Yield 39,771,349$ 2.49% CORPORATE COMMERCIAL PAPER $739,157,511 13.47%
NON-CORE FIXED INCOME 805,554,414$ 5.7% Total 2,698,040,588$ 100.00% State Fund Total 1,600,194,149$ 100.00% CORPORATE NOTES $666,802,251 12.15%
REAL ASSETS 589,214,956$ 4.2% FEDERAL AGENCIES $187,526,487 3.42%
CASH EQUIVALENTS 189,677,289$ 1.3% MONEY MARKET FUNDS $173,170,129 3.16%
SHORT TERM INVESTMENT POOL 149,962,889$ 1.1% TREASURIES $129,097,128 2.35%
Pensions Total 14,166,397,713$ 100.0% STIP Total $5,487,773,632 100.00%
Definition of NAV: Net Asset Value is the total value of the account including assets held, adjusted for payables, receivables and liabilities
(1) Other Holdings column on page two represents the value of securities, receivables, payables and liabilities that comprise the Net Asset Value for the asset owner.
*Difference of $227,488,080 is attributable the portion of STIP held within CAPP ($188,677,284) and and TFIP ($38,810,785) as a cash investment. Such value is represented in the NAV for the CAPP and STIP columns.
MBOI Snapshot
Asset Management View
4/30/2021 Unaudited
Assets Under Management
DOMESTIC EQUITY31.8%
INTERNATIONAL EQUITY14.6%
CORE FIXED INCOME18.5%
PRIVATE INVESTMENTS13.7%
REAL ESTATE9.2%
NON-CORE FIXED INCOME5.7%
REAL ASSETS4.2%
CASH EQUIVALENTS1.3%
SHORT TERM INVESTMENT POOL1.1%
Pensions Asset Allocation
Fixed Income 74.6%
Real Estate 16.1%
Non-Core Fixed Income
7.8%
STIP 1.4%
Trust Fund Investment PoolAsset Allocation
Fixed Income75.2%
Equity13.4%
Real Estate6.1%
High Yield2.5%
STIP2.8%
State Fund Insurance Asset Allocation
$1,530 $1,540 $1,550
$1,560 $1,570 $1,580
$1,590 $1,600 $1,610
State Fund Insurance NAV
(millions)
$2,580
$2,600
$2,620
$2,640
$2,660
$2,680
$2,700
$2,720
$2,740
Trust Fund Investment Pool NAV(millions)
$-
$2,000
$4,000
$6,000
$8,000
$10,000
$12,000
$14,000
$16,000
Pensions NAV(millions)
0.71%
0.54%0.42%
0.31% 0.28% 0.28% 0.26% 0.23% 0.19% 0.16% 0.13% 0.12%
0.0%
0.2%
0.4%
0.6%
0.8%
STIP Average Yield
$0$1,000$2,000$3,000$4,000$5,000$6,000
STIP NAV(millions)
ASSET BACKED COMMERCIAL PAPER
39.2%
CORPORATE COMMERCIAL PAPER13.5%
CORPORATE NOTES12.2%
CERTIFICATES OF DEPOSITS
26.3%
FEDERAL AGENCIES3.4%
MONEY MARKET FUNDS3.2%
TREASURIES2.4%
STIP Sectors
Active81.7%
Passive 18.3%
MBOI Active/Passive
Active70.6%
Passive29.4%
Pension Active/Passive
Internal46.0%
External54.0%
MBOI Internal/ExternalInternal 16.0%
External84.0%
Pension Internal/External

CAPP Holdings CAPP % STIP Holdings* STIP % TFIP Holdings TFIP % Other Holdings 1 Other %
Total Net
Asset Value
14,016,435$ 59.03% 5,260,286$ 22.15% 2,698,032$ 11.36% 1,771,003$ 7.46% 23,745,755$
Pensions CAPP % STIP % TFIP % Other % Total
FIREFIGHTER'S RETIREMENT 569,938$ 98.96% 5,983$ 1.04% -$ 0.00% -$ 0.00% 575,921$
GAME WARDEN'S RETIREMENT 261,278$ 98.86% 3,016$ 1.14% -$ 0.00% -$ 0.00% 264,293$
HIGHWAY PATROL RETIREMENT 178,825$ 98.90% 1,995$ 1.10% -$ 0.00% -$ 0.00% 180,820$
JUDGE'S RETIREMENT 127,939$ 98.92% 1,391$ 1.08% -$ 0.00% -$ 0.00% 129,330$
PUBLIC EMPLOYEES' RETIREMENT 6,936,857$ 98.93% 74,675$ 1.07% -$ 0.00% -$ 0.00% 7,011,532$
SHERRIF'S RETIREMENT 464,929$ 98.92% 5,070$ 1.08% -$ 0.00% -$ 0.00% 469,999$
POLICE RETIREMENT 531,673$ 98.96% 5,574$ 1.04% -$ 0.00% -$ 0.00% 537,247$
TEACHER'S RETIREMENT 4,899,361$ 98.95% 51,798$ 1.05% -$ 0.00% -$ 0.00% 4,951,159$
VOL. FIREMANS' RETIREMENT 45,636$ 99.00% 461$ 1.00% -$ 0.00% -$ 0.00% 46,097$
Total 14,016,435$ 98.94% 149,963$ 1.06% -$ 0.00% -$ 0.00% 14,166,398$
Trust Funds $(000) CAPP % STIP % TFIP % Other % Total
ABANDONED MINE TRUST -$ 0.00% 6,669$ 99.99% -$ 0.00% 1$ 0.01% 6,670$
BARKER HUGHESVILLE ST RESPONSE -$ 0.00% 600$ 6.56% 8,529$ 93.20% 22$ 0.24% 9,151$
BELT WATER TREATMENT PLANT -$ 0.00% 2,337$ 8.67% 24,569$ 91.10% 63$ 0.23% 26,969$
BPA MITIGATION TRUST FUND -$ 0.00% 3,410$ 30.31% 7,574$ 67.31% 268$ 2.38% 11,252$
BUTTE AREA ONE RESTORATION -$ 0.00% 1,325$ 18.47% 5,833$ 81.32% 15$ 0.21% 7,172$
BUTTE SILVER BOW -$ 0.00% 1,878$ 12.69% 12,881$ 87.08% 33$ 0.22% 14,792$
CLARK FORK RIVER RESTORATION -$ 0.00% 6,506$ 21.47% 23,738$ 78.33% 61$ 0.20% 30,305$
CLARK FORK SITE RAA -$ 0.00% 4,000$ 5.59% 67,321$ 94.16% 173$ 0.24% 71,494$
COAL TAX CULTURAL TRUST FUND -$ 0.00% 757$ 4.58% 15,727$ 95.17% 40$ 0.24% 16,525$
COAL TAX PARK ACQUISITION -$ 0.00% 2,327$ 7.54% 28,465$ 92.23% 73$ 0.24% 30,864$
E HELENA GREENWAY TRAIL MAINT -$ 0.00% 250$ 24.82% 755$ 74.98% 2$ 0.19% 1,007$
EAST HELENA COMPENSATION -$ 0.00% 4,016$ 81.75% 894$ 18.19% 3$ 0.05% 4,912$
ENDOWMENT FOR CHILDREN -$ 0.00% 50$ 3.51% 1,372$ 96.25% 4$ 0.25% 1,425$
FLYING J CECRA FACILITIES FUND -$ 0.00% 183$ 6.91% 2,466$ 92.85% 6$ 0.24% 2,655$
FWP REAL PROPERTY TRUST -$ 0.00% 575$ 7.65% 6,917$ 92.11% 18$ 0.24% 7,509$
HAROLD HAMM ENDOWMENT -$ 0.00% 5$ 9.32% 46$ 90.45% 0$ 0.23% 51$
INVASIVE SPECIES TRUST FUND -$ 0.00% 240$ 9.78% 2,207$ 89.99% 6$ 0.23% 2,453$
LIBBY ASBESTOS SITE STATE COST -$ 0.00% 500$ 10.00% 4,489$ 89.77% 12$ 0.23% 5,001$
LUTTRELL PIT - OPER & MAINT -$ 0.00% 163$ 6.94% 2,183$ 92.82% 6$ 0.24% 2,352$
MONTANA HISTORICAL SOCIETY -$ 0.00% 669$ 16.13% 3,473$ 83.66% 9$ 0.22% 4,151$
MONTANA POLE -$ 0.00% 7,690$ 26.63% 21,131$ 73.18% 55$ 0.19% 28,876$
OLDER MONTANANS TRUST -$ 0.00% 11$ 3.38% 312$ 96.38% 1$ 0.25% 324$
POTTER TRUST FUND -$ 0.00% 18$ 7.15% 232$ 92.61% 1$ 0.24% 250$
RESOURCE INDEMNITY TRUST -$ 0.00% 23$ 0.02% 116,497$ 99.72% 298$ 0.26% 116,819$
SMELTER HILL UP RESTORATIVE -$ 0.00% 1,445$ 15.29% 7,983$ 84.49% 21$ 0.22% 9,448$
STREAMSIDE TAILINGS OPERABLE UNIT -$ 0.00% 3,070$ 16.11% 15,944$ 83.67% 41$ 0.22% 19,055$
TOBACCO TRUST FUND -$ 0.00% 21,542$ 7.24% 275,228$ 92.52% 706$ 0.24% 297,476$
TRUST AND LEGACY ACCOUNT -$ 0.00% 2,600$ 0.31% 830,579$ 99.43% 2,127$ 0.25% 835,306$
UCFRB ASSESS/LITIG COST REC. -$ 0.00% 341$ 1.54% 21,663$ 98.20% 55$ 0.25% 22,059$
UCFRB RESTORATION FUND -$ 0.00% 4,126$ 5.30% 73,544$ 94.46% 189$ 0.24% 77,859$
UPPER BLACKFOOT RESPONSE -$ 0.00% 1,151$ 89.00% 142$ 10.96% 0$ 0.04% 1,294$
WEED CONTROL TRUST -$ 0.00% 0$ 0.00% 11,349$ 99.74% 29$ 0.26% 11,378$
WILDLIFE HABITAT TRUST -$ 0.00% 1,481$ 9.16% 14,653$ 90.61% 38$ 0.23% 16,172$
YELLOWSTONE PIPELINE CLEANUPFD -$ 0.00% 4,164$ 54.81% 3,425$ 45.07% 9$ 0.12% 7,598$
Z/L LT H2O TRUST FD -$ 0.00% 20,328$ 99.99% -$ 0.00% 2$ 0.01% 20,330$
ZORTMAN/LANDUSKY LT H2O -$ 0.00% 15,631$ 99.99% -$ 0.00% 2$ 0.01% 15,632$
Total -$ 0.00% 120,082$ 6.91% 1,612,118$ 92.83% 4,387$ 0.25% 1,736,586$
Coal Severence $(000) CAPP % STIP % TFIP % Other % Total
BIG SKY ECON DEV FD -$ 0.00% 1,977$ 1.54% 126,464$ 98.21% 324$ 0.25% 128,765$
PERMANENT COAL TRUST FUND -$ 0.00% 23,446$ 3.99% 370,173$ 63.03% 193,701$ 32.98% 587,320$
SCHOOL FACILITIES FUND -$ 0.00% 1,154$ 1.63% 69,342$ 98.12% 178$ 0.25% 70,674$
TREASURE ST. REG. WATER SYSTEM -$ 0.00% 1,192$ 1.15% 101,957$ 98.60% 261$ 0.25% 103,410$
TREASURE STATE ENDOWMENT -$ 0.00% 3,332$ 1.12% 294,333$ 98.60% 839$ 0.28% 298,503$
Total -$ 0.00% 31,101$ 2.62% 962,268$ 80.95% 195,303$ 16.43% 1,188,672$
Operating Funds $(000) CAPP % STIP % TFIP % Other % Total
FWP LICENSE ACCOUNT -$ 0.00% 35,949$ 54.98% 27,876$ 42.63% 1,565$ 2.39% 65,389$
LOCAL AGENCIES -$ 0.00% 1,632,628$ 99.99% -$ 0.00% 169$ 0.01% 1,632,798$
MONTANA STATE UNIVERSITY -$ 0.00% 209,990$ 92.18% 17,744$ 7.79% 67$ 0.03% 227,800$
MT TECH-UM AGENCY FUNDS -$ 0.00% 9,768$ 95.15% 495$ 4.82% 2$ 0.02% 10,266$
STATE AGENCIES -$ 0.00% 701,714$ 99.99% -$ 0.00% 69$ 0.01% 701,783$
TREASURER'S FUND -$ 0.00% 2,038,044$ 99.99% -$ 0.00% 190$ 0.01% 2,038,233$
UNIV OF MONTANA -$ 0.00% 67,152$ 67.68% 31,974$ 32.23% 89$ 0.09% 99,215$
Total -$ 0.00% 4,695,246$ 98.32% 78,089$ 1.64% 2,150$ 0.05% 4,775,484$
Insurance Reserves $(000) CAPP % STIP % TFIP % Other % Total
MUS WORKERS COMPENSATION -$ 0.00% 12,290$ 73.82% 4,347$ 26.11% 12$ 0.07% 16,649$
PERS DEFINED CONT DISABILITY -$ 0.00% 707$ 9.36% -$ 0.00% 6,849$ 90.64% 7,556$
STATE FUND INSURANCE -$ 0.00% 44,496$ 2.78% -$ 0.00% 1,555,698$ 97.22% 1,600,194$
SUBSEQUENT INJURY FUND -$ 0.00% 722$ 99.99% -$ 0.00% 0$ 0.01% 722$
GROUP BENEFITS -$ 0.00% 117,532$ 79.72% 27,331$ 18.54% 2,563$ 1.74% 147,426$
MUS GROUP INSURANCE -$ 0.00% 88,147$ 83.10% 13,880$ 13.09% 4,042$ 3.81% 106,068$
Total -$ 0.00% 263,894$ 14.05% 45,557$ 2.43% 1,569,164$ 83.53% 1,878,615$
Account # Accounts Total Market Value % Loans Outstanding 63,560,654$
Total State 357 3,855,145,177 70.2% Bonds Outstanding 90,600,000$
Total Local 181 1,632,628,455 29.8% Number of Borrowers 151
Total STIP 538 5,487,773,632$ 100.0% Loan Rate 1.65%
STIP Reserve 53,889,408$
Average March 2021 STIP Yield 0.1195%
Short Term Investment Pool Intercap Statistics
Total Fund $(000)
MBOI Snapshot
Asset Ownership View
4/30/2021 Unaudited

65010 Department of CommerceStandard Budget Summary By Org, AccountData Selected for Month/FY: 01 (Jul)/2021 through 11 (May)/2021Run 5/18/21
88% percent Through Year
Business Unit (All)Program Year (All)FY_BudPer (All)Month (All)Source of Auth (All)OBPP Program 75 BOARD OF INVESTMENTSFund Type (All)Account (All)Org (All)Account Type (All) Return to MenuProject (All)Ledger (All)
Subclass Fund Acct Lvl 1 Acct Lvl 2 Standard Budget Actuals Amt A Accrual Amt Balance765N1 INVESTMENTS DIVISION - HB576 7,616,457.00 6,096,268.66 (61,389.08) 1,581,577.42 80%
06014 BOI Municipal Finance Programs 655,560.00 521,893.96 (12,277.82) 145,943.86 80%61000 Personal Services 460,299.00 350,173.30 0.00 110,125.70
61100 Salaries 340,154.00 261,056.89 0.00 79,097.1161300 Other Compensation 2,060.00 1,460.00 0.00 600.0061400 Employee Benefits 126,736.00 87,656.41 0.00 39,079.5961600 Vacancy Savings (8,651.00) 0.00 0.00 (8,651.00)
62000 Operating Expenses 194,661.00 171,211.30 (12,277.82) 35,727.5262100 Other Services 111,456.00 26,305.74 0.00 85,150.2662200 Supplies & Materials 6,320.00 36,605.48 (12,277.82) (18,007.66)62300 Communications 2,521.00 6,882.00 0.00 (4,361.00)62400 Travel 4,280.00 795.98 0.00 3,484.0262500 Rent 14,983.00 49,116.32 0.00 (34,133.32)62700 Repair & Maintenance 75.00 247.00 0.00 (172.00)62800 Other Expenses 55,026.00 51,258.78 0.00 3,767.22
69000 Debt Service 600.00 509.36 0.00 90.6469300 Capital Leases 600.00 509.36 0.00 90.64
06527 Investment Division 6,960,897.00 5,574,374.70 (49,111.26) 1,435,633.56 80%61000 Personal Services 3,871,834.00 3,087,517.16 0.00 784,316.84
61100 Salaries 3,081,933.00 2,389,137.68 0.00 692,795.3261300 Other Compensation 7,960.00 5,840.00 0.00 2,120.0061400 Employee Benefits 858,892.00 692,539.48 0.00 166,352.5261600 Vacancy Savings (76,951.00) 0.00 0.00 (76,951.00)
62000 Operating Expenses 3,086,463.00 2,484,480.45 (49,111.26) 651,093.8162100 Other Services 1,966,125.00 1,612,008.10 0.00 354,116.9062200 Supplies & Materials 28,366.00 167,538.95 (49,111.26) (90,061.69)62300 Communications 34,963.00 28,230.73 0.00 6,732.2762400 Travel 241,328.00 14,141.47 0.00 227,186.5362500 Rent 205,838.00 174,435.12 0.00 31,402.8862700 Repair & Maintenance 1,068.00 1,114.00 0.00 (46.00)62800 Other Expenses 608,775.00 487,012.08 0.00 121,762.92
69000 Debt Service 2,600.00 2,377.09 0.00 222.9169300 Capital Leases 2,600.00 2,377.09 0.00 222.91
765N3 LEGISLATIVE AUDIT (RST/BIEN) 38,587.52 23,539.42 0.00 15,048.10 61%06014 BOI Municipal Finance Programs 7,717.90 4,707.89 0.00 3,010.01
62000 Operating Expenses 7,717.90 4,707.89 0.00 3,010.0162100 Other Services 7,717.90 4,707.89 0.00 3,010.01
06527 Investment Division 30,869.62 18,831.53 0.00 12,038.0962000 Operating Expenses 30,869.62 18,831.53 0.00 12,038.09
62100 Other Services 30,869.62 18,831.53 0.00 12,038.09
765S1 MEDB DEBT SERVICE - SA 3,235,394.00 1,114,429.05 0.00 2,120,964.9506014 BOI Municipal Finance Programs 3,235,394.00 1,114,429.05 0.00 2,120,964.95
62000 Operating Expenses 0.00 (4,254.14) 0.00 4,254.1462800 Other Expenses 0.00 (4,254.14) 0.00 4,254.14
69000 Debt Service 3,235,394.00 1,118,683.19 0.00 2,116,710.8169100 Bonds 3,235,394.00 1,118,683.19 0.00 2,116,710.81
Grand Total 10,890,438.52 7,235,058.43 (61,389.08) 3,716,769.17
SB by Org,Account 1 of 1

Presented by:
Doug Hill
Director of In-State Loan Programs
In-State Loan Program
Date: June 1, 2021

Topics for Today’s Discussion:o Coal Tax Trust Loan Programs
o Residential Mortgage Program
o Performance
o Summary
2
In-State Loan Program

• Participation
• Infrastructure
• Value Added
• Intermediary Relending Program (IRP)
• Veterans Home Loans (VHLP)
• Multifamily Home Loans (MCHP)
• Montana Facility Finance Authority (MFFA)
• Science and Technology (MSTA)
3
In-State Loan Program
Coal Tax Trust

4
In-State Loan Program –
Coal Tax Trust
Participation Loans
o Loans made in participation with lenders who service loans
o Board participation up to 80% of loan or 100% of the
government guaranteed amount
o Fixed-rate financing up to 25-years, 30-years if guaranteed
o Interest rates index is the Federal Home Loan Bank -
Des Moines long-term interest rates. Rates change weekly
o Job creation credits may reduce interest rates up to 2.5%
o 48 loans totaling $103.3 million principal outstanding as of
3-31-21. Yield is 2.47%

5
In-State Loan Program
Commercial Rates
Commercial interest rates
adjust weekly and are
indexed to the Federal
Home Loan Bank – Des
Moines long-term, fixed
interest rates plus a
spread ranging from
2.25% - 2.75% for non-
guaranteed monthly
participations.
Guaranteed loans are
priced 40 basis points
lower than non-
guaranteed rates.
Interest Rates 29-Apr-21 Through 05-May-21
Loan (5)
Term Monthly Annual Monthly Annual
5 Yrs. 2.530% 2.830% 2.930% 3.480%
10 Yrs. 3.220% 3.520% 3.620% 4.170%
15 Yrs. 3.620% 3.920% 4.020% 4.570%
20 Yrs. 4.160% 4.510% 4.560% 5.160%
25 Yrs. 4.605% 4.955% 5.005% 5.605%
30 Yrs. 5.100% 5.450%
Fed Guarantee (1)(2) Participation (1)(2)
RBS(4)/FSA/BIA/SBA(3) Infrastructure (1)
Commercial Loan Rate Sheet
COMMERCIAL, MULTI-FAMILY, AND AGRICULTURE RATES

6
In-State Loan Program –
Coal Tax TrustInfrastructure Loan Program
o Up to $80.0 million of the Trust is available
o Maximum loan size = $16,666 times jobs created
o Minimum loan size = $250,000
o Board lends directly to local government entities
o Business for which infrastructure is provided must:
o Create at least 15 full-time jobs
o Be a “basic sector” business
o Business pays local government a use fee to repay loan
o Use fee is pledged to the Board
o Use fee is credited against the Montana income taxes of the
business
o Job creation credits may reduce the interest rate up to 2.5%
o 9 loans totaling $15 million outstanding as of 3-31-21. Yield is 3.94%

3
In-State Loan Program –
Coal Tax TrustValue-Added Loan Program
o Up to $70.0 million of the Trust is available
o Minimum loan size = $250,000
o Maximum 15-year loan term
o Jobs must be created by “value-added” businesses
o Interest rate 1st 5 years is 2% if 15 jobs are created
o Interest rate 1st 5 years is 4% if 10 jobs are created
o Interest rate 2nd 5 years is 6%
o Standard posted rate for the last 5 years
o Board participates at 75% with lenders by law
o No dividends or bonuses to owners while loan is outstanding
o No loans as of 3-31-21

8
In-State Loan Program –
Coal Tax Trust
Intermediary Relending Loan Program
o Up to $10.0 million of the Trust is available
o Maximum loan size = $500,000
o No lenders involved – Board lends directly to Economic
Development Organizations (EDO)
o EDO must match loan with other government funds, typically
USDA, at 1 to 1 or greater.
o Interest capped at 2% for 30-year term
o Interest payments only for first 3 years
o Principal and interest next 27 years
o 34 loans totaling $4.47 million principal outstanding as of 3-31-
21. Yield is 2%

9
In-State Loan Program –
Coal Tax Trust
Veterans Home Loan Mortgage Program (VHLP)
o Up to $50.0 million of the Trust is available
o Montana Board of Housing administers program-servicing
fee of 0.50%.
o Loans are guaranteed by VA or FHA
o Available to qualified veterans residing in Montana
o Veteran contributes a minimum of $2,500
o Automated underwriting – approved eligible only
o 30-year term priced at 1% less than market rates, currently
1.41%
o 272 Loans totaling $47.5 million principal outstanding as of
4-31-21. Yield is 1.75%

10
In-State Loan Program –
Coal Tax Trust
Montana Multifamily Coal Trust Homes Program (MCHP)
o Up to $15.0 million of the Trust is available
o Montana Board of Housing administers program-servicing fee
of 0.25%
o The program provides loans for the development and
preservation of homes and apartments to assist low-income
applicants
o 30-year term priced at 0.5% less than the interest rate charged
for a loan funded by the housing Montana fund
o 4 loans totaling $5.2 million principal outstanding as of 4-31-21.
Yield is 2.65%

11
In-State Loan Program –
Coal Tax Trust
Montana Facility Finance Authority (MFFA)
o Up to $15.0 million of the Trust is available
o Loans cannot exceed $1.5 million
o MFFA administers program
o The program provides loans for capital projects to enhance
Montana healthcare and community capabilities
o 5 to 20-year term priced at monthly average of the FHLB
advance rate plus 0.55%. Floor rate range from 2.25% to 3.25%
o 11 Loans totaling $9.6 million principal outstanding as of 3-31-
21. Yield is 2.34%

12
In-State Loan Program-
Science and Technology
Science and Technology (MSTA)o MBOI becomes successor in interest in 1999
Loans Currently Outstanding (3-31-21)o Montana University System $7,588,760
o Mycotech Inc. $475,479
o McLaughlin Research Institute $74,059
Total MSTA: $8,138,298
o Yield is 2.79%

13
Residential Mortgage Program –
Pension Funds
Residential Loans
o Montana residential mortgages only
o Mortgages serviced by lender and/or Board of Housing
o Portfolio peaked in 2002 at $324.0 million
o Program scaled down due to low mortgage interest rates
o 70 loans totaling $2.45 million outstanding as of 4-31-21. Yield
is 6.25%

14
In-State Loan Program-
Residential Rates
Residential mortgages are
funded through retirement
funds which have an
actuarial of 7.50-7.625%,
which in today’s residential
interest rate environment
of 2.50% to 3.35%, makes
the use of our residential
program an impractical
consideration. As a result,
staff has not changed the posted residential interest
rates.
29-Apr-21 Through 05-May-21
15 Year 20 Year 30 Year
6.500% 7.250% 7.350%
6.550% 7.300% 7.400%
6.800% 7.550% 7.650%
6.950% 7.700% 7.800%
Residential Mortgage Rate Sheet
30 Days
60 Days
Primary Residence (1)
Mandatory Delivery - Potential Penalty for Non-Delivery
Interest Rates
240 Days (2)
Reservation Period
CONVENTIONAL MORTGAGE/FHA/VA RATES (3)
180 Days (2)

15
In-State Loan Program-
Portfolio Distribution
Participated loans
comprise $103.3M of the portfolio followed
by Infrastructure loans
at $15M, IRP at $4.7M,
VHLP at $47.5M,
MCHP at $5.2M, MFFA
at $9.6M, and Science
& Tech at $8.1M.
16
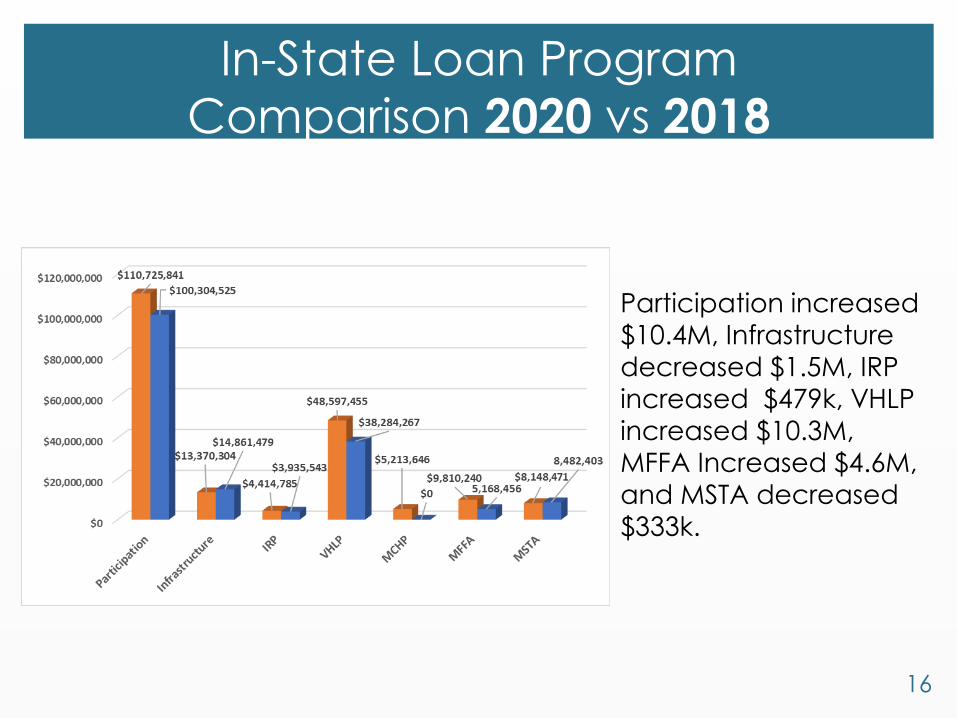
In-State Loan Program
Comparison 2020 vs 2018
Participation increased
$10.4M, Infrastructure decreased $1.5M, IRP
increased $479k, VHLP
increased $10.3M,
MFFA Increased $4.6M, and MSTA decreased
$333k.

17
Summary
▪ In-State Loan Programs created by the Legislature
o Currently 6 Active Coal Tax loan programs
▪ Size of Program portfolio determined by economy and lender
liquidity and willingness to use the programs
▪ Portfolio consists of high-quality credits
▪ Portfolio Yield is 2.41%
▪ Residential loan program is currently dormant due to very low
residential market interest rates
▪ VA mortgage loan program will have limited use since it is near its
maximum allocation
▪ Continue outreach with lenders, government agencies, andeconomic development

Total Bonds IssuedTotal Loan Commitments
Total Loans Funded
Total Bonds OutstandingTotal Loans Outstanding
Loan Commitments Pending
Month
July-20 2,354,235$ 2,892,577$ August 2,600,000 2,225,349 September 100,000 2,251,815 October 2,147,390 2,795,959 November 198,520 1,728,173 December 421,585 1,619,890 January 411,621 433,080 February 7,077,450 601,334 March 650,000 56,083 AprilMayJune-21
To Date 15,960,801$ 14,604,259$
Note: Commitments include withdrawn and expired loans.
February 16, 2014 - February 15, 2015
1.55%2.50%
*BOI decreased interest rates for INTERCAP loans to 1.00% until August 15, 2020 in response to the COVID-19 pandemic
Activity SummaryAs of March 31, 2021
FY2021
Since Inception 1987 - March 2021
168,000,000 653,907,100 624,563,890
90,600,000 63,360,654
29,343,210
Commitments FY17-FY21
Commitments Fundings
Variable Loan Rate History February 16, 2014 - February 15, 2022
Fundings FY17-FY21
1.00% February 16, 2018 - February 15, 2019 3.15%1.25%
February 16, 2016 - February 15, 2017February 16, 2015 - February 15, 2016 3.37%February 16, 2019 - February 15, 2020
February 16, 2010 - February 15, 2022 1.65%February 16, 2017 - February 15, 2018February 16, 2020 - February 15, 2021 2.50%*
05
10152025303540
Mill
ions
0 5
10 15 20 25 30 35 40 45 50
Mill
ions

2401 COLONIAL DRIVE, 3rd FLOOR, HELENA, MT 59601 P.O. BOX 200126, HELENA, MT 59620-0126
406-444-0001 | INVESTMENTMT.COM
TO: Members of the Board FROM: Louise Welsh, Senior Bond Program Officer DATE: June 1, 2021 RE: INTERCAP Staff Approved Loans Committed – Staff approved the
following loans between January 1, 2021 to March 31, 2021.
Borrower: City of Thompson Falls Purpose: Purchase police vehicle Staff Approval Date: January 15, 2021 Board Loan Amount: $51,621 Other Funding Sources: $ 0 Total Project Cost: $51,621 Term: 5 years
Borrower: Town of Belt Purpose: Purchase home for Resident Sheriff Deputy Program Staff Approval Date: January 15, 2021 Board Loan Amount: $160,000 Other Funding Sources: $ 5,000 Total Project Cost: $165,000 Term: 10 years

Borrower: Custer County Purpose: Purchase motor grader Staff Approval Date: January 19, 2021 Board Loan Amount: $200,000 Other Funding Sources: $118,000 Total Project Cost: $318,000 Term: 7 years
Borrower: City of Polson Purpose: Purchase new police vehicles Staff Approval Date: February 10, 2021 Board Loan Amount: $177,450 Other Funding Sources: $ 0 Total Project Cost: $177,450 Term: 3 years
Borrower: Lewis and Clark County Purpose: Law and Justice Center building capital improvements Staff Approval Date: March 11, 2021 Board Loan Amount: $650,000 Other Funding Sources: $ 0 Total Project Cost: $650,000 Term: 10 years

2401 COLONIAL DRIVE, 3rd FLOOR, HELENA, MT 59601 P.O. BOX 200126, HELENA, MT 59620-0126
406-444-0001 | INVESTMENTMT.COM
TO: Members of the Board FROM: Louise Welsh, Senior Bond Program Officer DATE: June 1, 2021 RE: Program Overview - What’s in the headlights? Overview Brief The Board administers several bond programs under the Montana Economic Development Bond and the Municipal Finance Consolidation Acts, created as part of the "Build Montana" program in 1984. The INTERCAP Program (the “Program”), created in 1987, is the most active of the Board’s bond programs and is used extensively by local government entities, the University System, and certain eligible state agencies. The Board issues tax-exempt bonds and lends the proceeds to eligible governmental entities for a variety of purposes. Although the bonds are issued as long-term, they are remarketed annually (investors are only required to hold the bonds for a one-year period). On average, over the past five fiscal years, the program committed to $32.3 million and funded $30.7 million in loans. In fiscal year 2020, the program committed to $27.5 million and funded $29.1 million in loans. The bonds are backed by the Board in two different ways:
• If for any reason investors do not purchase the bonds when they are remarketed annually, the Board is legally obligated to purchase them.
• The Board guarantees payment to the bond holders.
The Board charges a fee for backing the bonds and since the Program’s inception has never been required to purchase the bonds or make payments to the bondholders. The Program has never suffered a loss. When the bonds are remarketed annually, the bond interest rates are reset, and Board staff sets the borrower interest rates based on the reset bond interest rate plus up to 1.5 percent to cover administrative costs. The table to the right shows the Program’s activity from when it started to accelerate to 3rd quarter FY21.

There are various forms of debt obligations that make up the program’s loan asset portfolio. The current loan application covers most scenarios of all the borrower types and repayment sources that may apply. Staff goes through a thorough loan review process that involves all duties related to an in-depth financial credit analysis and statutory authority verification. The loans are structured according to the type of revenue designated as repayment. An attorney’s opinion with several representations is required and first position liens are placed on vehicles/equipment. Normally, there are several occasions for in-person Program outreach to the local government demographic by means of a vendor booth and/or presentations at the annual conferences and workshops throughout the year. Beginning in May, these conferences are cautiously returning from the pandemic closures in the form of Zoom conferencing. In 2022, INTERCAP will have been in service for 35 years thus its time look at a few areas wherein lies opportunity for a fresh new perspective. What’s in the Headlights? Board staff are looking at what programmatic adjustments may be made to better serve the customer, streamline processes, and potentially save on costs. Areas up for closer inspection are:
• Source of funds for the loans,
• Cash reinvestment process and costs,
• BOI’s annual credit enhancement fee,
• Prepayment and short-term borrowing,
• Loan application form, submission and review process,
• Vehicle/equipment security liens; and
• A new concept to the Program, rotating loans under one commitment to accommodate the vehicle/equipment replacement plans common to standard government operations.
Depending on the findings of the work outlined above, there may be a future request that requires Board action to implement a change, but no action is necessary at this time.

2401 COLONIAL DRIVE, HELENA, MT 59620
P.O. BOX 200126, HELENA, MT 59620
406-444-0001 | INVESTMENTMT.COM
MONTANA
TO: Members of the Board
FROM: Jon Putnam, Chief Investment Officer
John Romasko, Director of Fixed Income
DATE: June 1, 2021
RE: Proposed Change to STIP Investment Policy
Short-Term Investment Pool (STIP) Investment Policy
We are proposing to extend the allowable weighted average maturity (WAM) of the STIP
portfolio from 60 days to 120 days.
Staff is asking for additional flexibility to better manage the low interest rate environment.
Interest rates for Treasury and Agency securities are currently negative out to almost 60
days. In addition, flows into STIP have been significant due to Federal stimulus money. This
change will help us maintain a positive yield in the STIP portfolio.
A redline change of the STIP Investment Policy is included behind this memo.

SHORT-TERM INVESTMENT POOL (STIP) INVESTMENT POLICY
Approved February 11, 2020 August 19, 2020 Proposed August 19, 2020June 1, 2021

8 | P a g e
Appendix I: Investment Objectives and Guidelines
Schedule I-A: Investment Objectives and Guidelines
Short Term Investment Pool (STIP)
Effective Date of Schedule: June 1, 2021
This Schedule is effective upon adoption by the Board of Investments and supersedes all previous Investment Objectives and Guidelines for the STIP.
1. Statement of Purpose:
The purpose of these objectives and guidelines is to:
1. Establish the investment objectives and performance standards of the Pool; and2. Provide diversified exposure to Cash Equivalent and Short-Term Fixed Income Investments in
a prudent and cost-effective manner.
2. Investment Objective:
Strategic: The objective of the STIP is to attain the highest possible total return within the parameters of the Investment Guidelines set forth below.
Performance: Success in achieving this objective will be measured by comparing the risk and the net of expenses return of STIP to the Federal Reserve US Treasury Constant Maturity 1 Month Index (the “Benchmark”). Performance results will be monitored and evaluated quarterly. However, the success in achieving the objective will be measured on a three-year, five-year, and ten-year annualized basis.
3. Investment Guidelines:
The Montana Board Investment Staff will have full discretion to manage STIP consistent with the investment guidelines stated below. Compliance with the following guidelines for permitted investments and other restrictions is the sole responsibility of the Staff. Any exceptions or compliance violations are to be reported to the Board of Investments at the next scheduled quarterly Board meeting.
Permitted Investments: Purchases of securities other than U.S. government or U.S. Agency obligations are restricted to those which are pre-approved and part of an “Approved List.” STIP may invest only in the following securities and investment vehicles:
1. U.S. Treasury or U.S. dollar denominated securities fully guaranteed by the U.S. Government;2. U.S. Government Agency securities denominated in U.S. dollars;

9 | P a g e
3. Publicly traded U.S. dollar denominated corporate bonds, notes, and medium term notes (MTNs);
4. U.S. dollar denominated Commercial Paper (CP); 5. U.S. dollar denominated Bankers’ Acceptance (BA); 6. U.S. dollar denominated Certificates of Deposits (CD); 7. U.S. dollar denominated Asset-Backed Commercial Paper (ABCP); 8. Repurchase or Reverse Repurchase Agreements with an approved primary dealer or the
custodial bank, and under the terms of a written master repurchase agreement; 9. Investments required to implement the bond credit enhancement authorized by Resolution
219; 10. SEC registered 2a-7 Institutional Money Market Funds that are considered “U.S. Treasury” or
“U.S. Government” money market mutual funds according to the SEC regulations; 11. Short term investment vehicle available through the custodial bank; 12. Variable rate securities based on an index that is approved by the Chief Investment Officer and
purchased and monitored by Staff; and 13. FDIC insured deposit accounts.
Restrictions
Concentration restrictions (Concentration restrictions are at the time of purchase)
1. A maximum of 40% of the STIP Units Value shall be held ABCP ; 2. A maximum of 10% of the STIP Units Value shall be held in Repurchase Agreements; 3. A maximum of 15% of the STIP Units Value shall be held in permitted SEC registered 2a-7
Institutional Money Market Funds; 4. A maximum of 10% of the STIP Units Value shall be pledged to secure Reverse Repurchase
Agreements. Transactions will be used only to secure borrowings for temporary or emergency purposes;
5. A maximum of 25% of the STIP Units Value in the aggregate shall be held in all non- Government Variable Rate securities with maturities greater than 397 days;
Issuer Restrictions (Issuer restrictions are at the time of purchase)
6. A maximum of 30% of the STIP Units Value shall be held in any single issuer of U.S. Agency securities;
7. A maximum of 3% of the STIP Units Value shall be invested in any one issuer with the exception of U.S. Treasury and U.S. Agency securities as well as any Repurchase Agreements with a financial institution;
8. A maximum of 10% of the STIP Units Value in the aggregate shall be held in any one financial sponsor of ABCP as well as any direct obligations associated with the sponsor. Repurchase agreement obligations of a financial institution shall not be considered in this limit;
9. A maximum of 5% of the STIP Units Value shall be held in any single SEC registered 2a-7 Institutional Money Market Funds or as FDIC insured deposits;
10. A maximum of 5% of the STIP Units Value shall be held in Repurchase Agreements with any single primary dealer or financial institution;
Rating Restrictions
11. ABCP, CP, BA or CD shall not have a Tier 2 or lower rating at any Nationally Recognized

10 | P a g e
Statistical Rating Organization (NRSRO) at the time of purchase; 12. Corporate bonds, notes, or MTNs shall be rated a minimum of the sixth highest rating at any
Nationally Recognized Statistical Rating Organization (NRSRO) at the time of purchase; 13. All securities, with the exception of securities fully guaranteed by the U.S. Government and
approved Institutional Money Market Funds, must be rated by at least two Nationally Recognized Statistical Rating Organizations (NRSROs) at the time of purchase.
13. A maximum of 10% of the STIP Units Value shall be held in ABCP, CP, BA or CD rated with a Tier 2 or lower rating at any Nationally Recognized Statistical Rating Organization (NRSRO) at any time;
Liquidity Restrictions
14. A minimum of 10% of the STIP Units Value shall qualify as “daily liquid assets.” For this guideline is it assumed that “daily liquid assets” is defined as cash, direct obligations of the U.S. government, securities that will mature or are subject to a demand feature that is exercisable and payable within one business day, and a permitted SEC registered 2a-7 Institutional Money Market Fund;
15. A minimum of 15% of the STIP Units Value shall qualify as “weekly liquid assets.” For the purpose of this guideline, it is assumed that “weekly liquid assets” is defined as “daily liquid assets” (as defined above), government agency discount notes with remaining maturities of 60 days or less, securities that will mature or are subject to a demand feature that is exercisable and payable within five business days, and a permitted SEC registered 2a-7 Institutional Money Market Fund;
16. A maximum of 10% of the STIP Units Value shall be invested in Permitted Investments that are considered “illiquid.” For the purpose of this guideline, “illiquid” shall be defined as “a security that cannot be sold or disposed of in the ordinary course of business within seven calendar days at approximately the value ascribed to it by STIP.”
17. STIP shall maintain a dollar-weighted average portfolio maturity of 60120 days or less (for this purpose, the date to the next coupon reset date will be used for all floating or variable rate securities);
18. ABCP purchases shall be limited to maturities of 90 days or less; 19. The maximum term of any Repurchase Agreement will be 30 days; 20. The maximum term of any Reverse Repurchase Agreement will be 90 days and must be
matched to anticipated cash flows adequate to liquidate the transaction; 21. The maximum final maturity of any Permitted Investment shall not exceed 397 days (not
including securities used as collateral in Repurchase Agreements or Permitted Investments considered “Variable Rate” securities, which on any reset date can reasonably be expected to have a market value that approximates its amortized cost);
22. A Variable Rate security shall have a maximum maturity of 2 years;
Other Restrictions
23. Risk assets will may be purchased only when the estimated aggregate effect of a worst-case scenario spread widening event does not exceed the amount of the STIP Reserve. Risk assets are assets other than Treasuries, Agencies and Government money markets. The estimated worst-case scenario is a calculation equal to the days to maturity dividend by 365 multiplied by 2.0% for securities maturing in less than one year and 3.5% for securities maturing in greater than one year.
24. Acceptable forms of collateral under Repurchase Agreements will consist of U.S. Treasury

11 | P a g e
Securities which will be required to be maintained at a market value of 102% of the value of the Repurchase Agreement;
If at any time, due to market fluctuations or any other circumstances, any of the guidelines are not maintained, Staff will use its best efforts to conform to these limits in a timely manner, while taking into account current market conditions and the associated costs. At the Board’s next regularly scheduled quarterly meeting, the CIO or Staff shall inform the Board of any cases that the Pool allocations were outside of the limits and either inform the Board of the actions that were taken to return the Pool back within guidelines or a plan to do so.

2401 COLONIAL DRIVE, HELENA, MT 59620
P.O. BOX 200126, HELENA, MT 59620
406-444-0001 | INVESTMENTMT.COM
MONTANA
TO: Members of the Board
FROM: Jon Putnam, Chief Investment Officer
John Romasko, Director of Fixed Income
DATE: June 1, 2021
RE: Proposed Changes for the Pension, State Fund & Coal Severance
Tax Trust Investment Policy Statements
A summary of the proposed change(s) to each of the Investment Policy Statements is
below. Redline changes of the affected sections are included behind this memo.
Montana Public Retirement Plans
We are proposing to add two additional restrictions to the Non-Core Fixed Income
Asset Class. This will help ensure diversification within the Asset Class.
1. High Yield strategies will make up a minimum of 25% and a maximum of
75% of the Non-Core Fixed Income Asset Class.
2. No strategy other than High Yield will make up more than 50% of the Non-
Core Fixed Income Asset Class.
Montana State Fund Investment Pool
We are proposing to limit the maximum amount of Non-agency Residential Mortgage
Backed Securities (RMBS) to 10% in the Montana State Fund Investment Pool. Currently,
there is no limit aside from the 50% limit on mortgage backed securities. The 10% limit is
consistent with other investment policy statements.
Coal Severance Tax Trust Fund
We are proposing to change Funds titled Treasure State to Montana Coal. The change
reflects those made to MCA 17-5-703, by the 2021 Legislature through SB 258.

MONTANA PUBLIC RETIREMENT
PLANS INVESTMENT POLICY
Approved April 5, 2017
Last Revised November 19, 2020June 1, 2021

27 | P a g e
Schedule II-G:
Investment Objectives and Guidelines
Non-Core Fixed Income Asset Class
Approved Date of Schedule: June 9, 2020June 1,
2021
This Schedule is effective upon adoption by the Board and supersedes all previous Investment Objectives and Guidelines for Non-Core Fixed Income.
Statement of Purpose: The purpose of these objectives and guidelines is to:
1. Establish the investment objectives and performance standards of the Non-Core Fixed
Income Asset Class; and 2. Provide diversified exposure to the Non-Core Fixed Income markets in a prudent and cost-
effective manner.
Investment Objective:
Strategic: The objective of the Non-Core Fixed Income Asset Class is to attain the highest possible total return within the parameters of the Investment Guidelines set forth below.
Performance: Success in achieving this objective will be measured by comparing the risk and after-fee return of the Non-Core Fixed Income Asset Class to the Bloomberg Barclays US High Yield - 2% Issuer Cap Index (the “Benchmark”). Performance results will be monitored and evaluated quarterly. However, the success in achieving the objective will be measured on a three-year, five-year, and ten-year annualized basis.
Investment Guidelines:
Staff will have full discretion to manage the Non-Core Fixed Income Asset Class consistent with the investment guidelines stated below. Non-Core Fixed Income is defined as strategies primarily invested in High Yield Corporate Debt, Emerging Market Debt, Convertible Debt, and Preferred Securities. Compliance with the following guidelines for permitted investments and other restrictions is the sole responsibility of the Staff. Any exceptions or compliance violations are to be reported to the Board at the next scheduled quarterly Board meeting.

28 | P a g e
Permitted Investments:
The Non-Core Fixed Income Asset Class may invest only in the following:
1. Securities and derivatives held in separate accounts, commingled funds, limited partnerships, or limited liability companies managed by external investment managers and governed by their respective investment management contracts and investment guidelines;
2. Cash – either an investment in the Short-Term Investment Pool (STIP), a vehicle available through the Custodian, or an SEC registered money market fund that is considered a “US Treasury” or “US Government” money market fund per the SEC regulations.
Other Restrictions: 1. A maximum of 10% of the Net Asset Value of the Non-Core Fixed Income Asset Class shall be
held in Non-U.S. securities if they are denominated in a foreign currency; 2. The average duration of the Non-Core Fixed Income Asset Class will be maintained in a range
of + or – 25% of the index duration. 3. High Yield strategies will make up a minimum of 25% and a maximum of 75% of the Non-Core
Fixed Income Asset Class. 2.4. No strategy other than High Yield will make up more than 50% of the Non-Core Fixed
Income Asset Class. If at any time, due to market fluctuations or any other circumstances, any of the guidelines are not maintained, Staff will use its best efforts to conform to these limits in a timely manner, while considering current market conditions and the associated costs of rebalancing. At the Board’s next regularly scheduled quarterly meeting, the CIO shall inform the Board of any cases that the Non-Core Fixed Income Asset Class allocations were outside of the limits and either inform the Board of the actions that were taken to return the Non-Core Fixed Income Asset Class back within guidelines or a plan to do so.

MONTANA STATE FUND
INVESTMENT POOL
INVESTMENT POLICY
Approved April 14 June 9, 2020
Last Revised June 91, 2020 2021

16 | P a g e
Schedule II-D:
Investment Objectives and Guidelines
Investment Grade Fixed Income Asset
Class
Effective Date of Schedule: April 14, 2020
This Schedule is effective upon adoption by the Board and supersedes all previous Investment Objectives and Guidelines for Investment Grade Fixed Income Asset Class.
Statement of Purpose:
The purpose of these objectives and guidelines is to:
1. Establish the investment objectives and performance standards of the Investment Grade
Fixed Income Asset Class; and 2. Provide diversified exposure to the Investment Grade Fixed Income markets in a prudent and
cost-effective manner.
Investment Objective:
Strategic: The objective of the Investment Grade Fixed Income Asset Class is to attain the highest possible total return within the parameters of the Investment Guidelines set forth below.
Performance: Success in achieving this objective will be measured by comparing the risk and after-fee return of Investment Grade Fixed Income Asset Class to the Bloomberg Barclays Intermediate US Aggregate Bond Index (the “Benchmark”). Performance results will be monitored and evaluated quarterly. However, the success in achieving the objective will be measured on a three-year, five-year, and ten-year annualized basis.
Investment Guidelines:
Staff will have full discretion to manage the Investment Grade Fixed Income Asset Class consistent with the investment guidelines stated below. Compliance with the following guidelines for permitted investments and other restrictions is the sole responsibility of the Staff. Any exceptions or compliance violations are to be reported to the Board at the next scheduled quarterly Board meeting. State Fund will be notified of any exceptions or compliance violations within five days.
Permitted Investments:
The Investment Grade Fixed Income Asset Class may invest only in the following:
1. Debt obligations of the U.S. Government, including its agencies and instrumentalities; 2. Dollar denominated debt obligations of Quasi and Foreign Government entities; 3. Dollar denominated debt obligations of domestic and foreign corporations;

17 | P a g e
4. Dollar denominated securitized assets, including U.S. Agency mortgage backed securities (MBS), U.S. Agency collateralized mortgage obligations (CMOs), commercial mortgage backed securities (CMBS), and asset backed securities (ABS);
5. Cash – either an investment in the Short-Term Investment Pool (STIP), a vehicle available through the Custodian, or an SEC registered money market fund that is considered a “US Treasury” or “US Government” money market fund per the SEC regulations.
Other Restrictions: 1. A minimum of 20% of the market value must be held in U.S. Treasury/Agency securities; 2. A maximum of 10% of the market value may be held in dollar denominated quasi and foreign government
securities; a. Quasi and foreign government securities must be rated a minimum of the 7th highest rating by
any nationally recognized statistical rating organization (NRSRO) at the time of purchase; 3. A maximum of 50% of the market value may be held in corporate bonds; 4. A maximum of 50% of the market value may be held in U.S. Agency mortgage backed securities (MBS &
CMO); 5. A maximum of 5% of the market value may be held in asset backed securities (ABS); 6. A maximum of 10% of the market value may be held in commercial mortgage backed securities (CMBS); 7. The average duration will be maintained in a range of + or – 20% of the index duration;
7.8. A maximum of 10% of the Net Asset Value of any internally managed portfolio may be held in non-agency mortgage backed securities (RMBS);
8.9. The average life for individual fixed income securities will be less than 12 years; 9.10. A maximum of 3% of the market value may be held in a single parent company issuer,
foreign/quasi government issuer or ABS specific pool at the time of purchase; there is no limit on U.S. Government/Agency securities;
a. Exposure to a single parent company issuer, foreign/quasi government issuer or ABS specific pool will be limited to 4% of the market value regardless of when securities were purchased;
10.11. Securities must be rated investment grade by at least two nationally recognized statistical rating organizations (NRSRO), with the exception of securities issued or guaranteed by agencies or instrumentalities of the U.S. Government. In the case of split-rated securities, the lower rating is used;
11.12. Securities that drop below investment grade as defined above may be held to maturity. However, the Investment Grade Fixed Income Asset Class may not hold more than 5% below investment grade;
12.13. Fixed income securities rated lower than the 7th highest rating by any nationally recognized statistical rating organization (NRSRO) are limited to 30% of the market value of the Investment Grade Fixed Income Asset Class;
a. In the case of split rated securities, the lowest rating will apply; 13.14. Securitized assets must be rated a minimum of the 4th highest rating by any nationally recognized
statistical rating organization (NRSRO) at the time of purchase; a. Securities that drop below the 4th highest rating by any NRSRO may be held to maturity. However,
the Investment Grade Fixed Income Asset Class may not hold more than 4% in these securities; 14.15. A minimum of 1% of the Investment Grade Fixed Income Asset Class will be held in cash
investments; 15.16. The use of derivatives is prohibited; 16.17. The use of leverage is prohibited.
If at any time, due to market fluctuations or any other circumstances, any of the guidelines are not maintained, Staff will use its best efforts to conform to these limits in a timely manner, while considering current market conditions and the associated costs of rebalancing. At the Board’s next regularly scheduled quarterly meeting, the CIO shall inform the Board of any cases that the Investment Grade Fixed Income Asset Class allocations were outside of the limits and either inform

18 | P a g e
the Board of the actions that were taken to return the Investment Grade Fixed Income Asset Class back within guidelines or a plan to do so. State Fund will be notified of any exceptions or compliance violations within five days.

1
COAL SEVERANCE TAX TRUST FUND
INVESTMENT POLICY
Approved August 20, 2019
Last Revised June 1, 2021

11
Schedule II-B
Investment Objectives and Guidelines
Treasure StateMontana Coal Endowment Fund
Effective Date of Schedule: August 22, 2017June 1, 2021
This schedule is effective upon adoption by the Board of Investments and supersedes all previous Investment Objectives and Guidelines for this specific portfolio.
Introduction:
The purpose of the investment guidelines is to provide a framework for the Treasure StateMontana Coal Endowment Fund under the guidance of the board. The Treasure StateMontana Coal Endowment Fund was established under MCA: 17-5-703 as a sub-fund of the Permanent Coal Severance Tax Trust. Income from the Treasure StateMontana Coal Endowment Fund is appropriated to the Department of Revenue by the legislature for local government infrastructure projects. Funds for the Treasure StateMontana Coal Endowment Fund are held in MU65.
Statement of Purpose: The purpose of these objectives and guidelines is to: 1. Establish the investment objectives and performance standards of the Treasure StateMontana Coal
Endowment Fund; and 2. Provide diversified investment exposure within the guidelines in a prudent and cost effective manner.
Investment Objective:
Strategic: Attain above benchmark total return for all investments within the parameters of the Investment Guidelines set forth below with an emphasis on investment income and preservation of principal.
Performance: Success in achieving this objective will be measured by comparing the risk and return of the account to the Trust Funds Investment Pool benchmark and the Short-Term Investment Pool benchmark, each weighted proportionately to the portfolio’s holdings, over a five-year moving average.
Investment Guidelines: The Montana Board of Investments will have full discretion to manage the Treasure StateMontana Coal Endowment Fund consistent with the investment guidelines stated below. Compliance with the following guidelines for permitted investments and other restrictions is the sole responsibility of the Staff. Any exceptions or compliance violations are to be reported to the Board of Investments at the next scheduled quarterly Board meeting.
Permitted Investments: Treasure StateMontana Coal Endowment Fund may only invest in the following:
• Trust Fund Investment Pool (TFIP)
• Short-Term Investment Pool (STIP)

12
Other Restrictions: • A maximum of 99% of the market value of the portfolio will be held in the Trust Fund Investment Pool
(TFIP). If at any time, due to market fluctuations or any other circumstances, any of the guidelines are not maintained, Staff will use its best efforts to conform to these limits in a timely manner, while considering current market conditions and the associated costs of rebalancing. At the Board’s next regularly scheduled quarterly meeting, the CIO shall inform the Board of any cases that the allocations were outside the limits and either inform the Board of the actions that were taken to return the portfolio back within guidelines or a plan to do so.

13
Schedule II-C
Investment Objectives and Guidelines
Treasure StateMontana Coal Endowment Regional Water System Fund
Effective Date of Schedule: August 22, 2017June 1, 2021
This schedule is effective upon adoption by the Board of Investments and supersedes all previous Investment Objectives and Guidelines for this specific portfolio.
Introduction:
The purpose of the investment guidelines is to provide a framework for the Treasure StateMontana Coal Endowment Regional Water System Fund under the guidance of the board. The Treasure StateMontana Coal Endowment Regional Water System Fund was established under MCA: 17-5-703 as a sub-fund of the Permanent Coal Severance Tax Trust. Income from the Treasure StateMontana Coal Endowment Regional Water System Fund is appropriated to the Department of Revenue by the legislature to fund regional water system projects in northcentral and northeastern Montana. Funds for the Treasure StateMontana Coal Endowment Regional Water System Fund are held in MU64.
Statement of Purpose: The purpose of these objectives and guidelines is to:
1. Establish the investment objectives and performance standards of the Treasure StateMontana Coal Endowment Regional Water System Fund; and
2. Provide diversified investment exposure within the guidelines in a prudent and cost effective manner.
Investment Objective:
Strategic: Attain above benchmark total return for all investments within the parameters of the Investment Guidelines set forth below with an emphasis on investment income and preservation of principal.
Performance: Success in achieving this objective will be measured by comparing the risk and return of the account to the Trust Funds Investment Pool benchmark and the Short-Term Investment Pool benchmark, each weighted proportionately to the portfolio’s holdings, over a five-year moving average.
Investment Guidelines:
The Montana Board of Investments will have full discretion to manage the Treasure StateMontana Coal Endowment Regional Water System Fund consistent with the investment guidelines stated below. Compliance with the following guidelines for permitted investments and other restrictions is the sole responsibility of the Staff. Any exceptions or compliance violations are to be reported to the Board of Investments at the next scheduled quarterly Board meeting.
Permitted Investments: Treasure StateMontana Coal Endowment Regional Water System Fund may only invest in the following:
• Trust Fund Investment Pool (TFIP)
• Short-Term Investment Pool (STIP)

14
Other Restrictions: • A maximum of 99% of the market value of the portfolio will be held in the Trust Fund Investment Pool
(TFIP). If at any time, due to market fluctuations or any other circumstances, any of the guidelines are not maintained, Staff will use its best efforts to conform to these limits in a timely manner, while considering current market conditions and the associated costs of rebalancing. At the Board’s next regularly scheduled quarterly meeting, the CIO shall inform the Board of any cases that the allocations were outside the limits and either inform the Board of the actions that were taken to return the portfolio back within guidelines or a plan to do so.

Presented by: John Romasko, CFA, Kirsten Haswell, John Carpenter, CPA, and Kelsey Gauthier, CPA
Date: June 1, 2021
CORE FIXED INCOME
ASSET CLASS REVIEW

Fixed Income Basics
• What is “Fixed Income”?
• Terminology
• Objectives
• Risk Factors / Sensitivity
• Internal Portfolios
Non-Pension Clients
• Client Types
• Policy & Portfolio Construction
• Types of Investments
• Client Assets
• Trust Fund Investment Pool (TFIP)
• Short Term Investment Pool (STIP)
• State Fund Investment Portfolio
Fixed Income Management
• Investment Philosophy
• Fixed Income Resources
• Costs
• Competitive Advantage
• Demonstration
Table of Contents
2

Fixed Income Basics
What is “Fixed Income”?
• A contractual obligation to pay principal and interest over time.
• Bonds are issued by government or corporate entities.
• Obligations represent a claim on assets that is senior to equity.
• Coupons are contractually driven and may be fixed or floating rate.
• Maturities are predefined and generally range from 1 day to 30 years.
3
Fixed Income BasicsFixed Income Terminology
• Principal – The initial size of a bond or investment.
• Coupon – The interest rate paid on a bond. This can be either fixed rate or
floating rate. A floating interest rate is typically tied to a benchmark such as
U.S. T-Bills. Payments can be monthly, semi-annual, or annual.
• Maturity – The agreed date that the full amount of the bond or investment
must be paid back to the lender plus interest.
• Interest – The amount that must be paid to compensate the lender/investor
for the use of funds.
• Sector – An area of the economy in which businesses share the same or
related products or services, an economic sector. Alternatively, a group of
securities that exhibit similar characteristics, an asset type sector.
4

Fixed Income BasicsFixed Income Terminology
• Ratings – An assessment of the creditworthiness of a borrower. Bond ratings
from NRSROs between AAA and BBB- are investment grade. BB and below
are below investment grade/high yield.
• Average Credit Quality – The average credit rating for each bond in the
portfolio adjusted for its relative weight in the portfolio.
• Duration – A measure of a bond or portfolio’s sensitivity to changes in
interest rates. As duration increases, the bond or portfolio’s sensitivity to
interest rates increases.
• Weighted Average Maturity or Life – Measures of how quickly the
outstanding principal will be repaid. The higher the number the longer it is
expected to take for the debt to be paid.
5
Fixed Income BasicsFixed Income Terminology
• Yield to Maturity (YTM) – The total return anticipated on a bond or portfolio
if it is held until maturity and all coupon payments are reinvested at the
YTM.
• Yield Curve – A curve that plots the prevailing interest rate for bonds at
different maturities.
• Spread – A measurement of the difference in yield between a non-Treasury
bond and a U.S. Treasury bond. The U.S. Treasury is considered the risk-free
alternative. A higher spread represents greater uncertainty of repayment.
• Inflation – The rate at which the general level of prices for goods and
services is increasing. As inflation increases, the purchasing power of money
falls.
6

Fixed Income BasicsObjectives of Fixed Income
• Total Return = Income + Change in Market Value
o Income is primarily generated from coupon payments paid at regular
intervals
o Market value is driven by movements in yields (U.S. Treasury rates and
spreads)
• Diversification
o Fixed income provides a different risk profile to the portfolio than other
asset classes
o More likely to preserve principal in a stressed market environment
• Liquidity
o Ability to raise cash in times of extreme market stress
o Varying degrees of liquidity for different types of bonds
7

Primary Fixed Income Risk Factors
• Interest Rates are composed of the following:
o Real Risk-Free Rate – Compensation above inflation that a lender
demands of an investment with zero risk. Changes with the preference
to lend or spend.
o Inflation Risk – Inflation can erode the purchasing power of cash flows
received over the life of a bond.
o Maturity Risk – All else being equal, the longer the maturity the greater
the sensitivity to interest rate changes.
o Default Risk– Borrower may have less ability or willingness to meet their
contractual obligations and may default.
o Liquidity Risk – Most bonds are traded over the counter (OTC). May not
be a willing buyer/seller. Pricing may be opaque. In times of market
stress, liquidity may be reduced.
Fixed Income Basics
8

Fixed Income BasicsInterest Rate Sensitivity
• When interest rates rise: the value of
outstanding bonds falls because
the income they pay is less than
what investors could receive on a
new bond with similar
characteristics.
• When interest rates fall: the value of
outstanding bonds rises because
the income they pay is more than
what investors could receive on a
new bond with similar
characteristics.
9

Fixed Income BasicsCore Internal Fixed Income Portfolios
• $10.8 Billion as of 03/31/2021
STIP, $5,488
STIP Reserve, $54
TFIP Core, $1,992
CAPP Core , $1,903
State Fund Core, $1,216
Real Assets TIPS, $133
*in millions
Year Ended 03/31/21 Transactions
PORTFOLIO $ #
STIP 24,815,019,000$ 809
TREASURER'S FUND 6,015,000,000$ 155
STATE FUND 220,887,000$ 59
TFIP 199,737,596$ 56
STIP RESERVE 140,000,000$ 70
TIPS 39,000,000$ 14
TOTAL 31,429,643,596$ 1163
10

Non-Pension ClientsAssets Under Management 03/31/2021
Name AUM Millions Name AUM Millions
Trust Funds - Permanent Libby Asbestos Site State Cost 4.9$
Coal Severance Tax Trust Fund 1,180.4$ Luttrell Pit - Oper & Maint 2.3$
FWP Mitigation Trust Fund 11.2$ Montana Pole 28.7$
Coal Tax Cultural Trust Fund 16.4$ Smelter Hill Upland Restorative 9.4$
Coal Tax Park Acquisition 30.6$ Streamside Tailings Operable Unit 18.9$
Endowment For Children 1.4$ UCFRB Reserve 21.8$
FWP Real Property Trust 7.4$ UCFRB Restoration Fund 77.4$
Harold Hamm Endowment 0.1$ Upper Blackfoot Response 1.3$
Montana Historical Society 4.1$ Zortman Trust 20.3$
Older Montanans Trust 0.3$ Zortman Water 15.6$
Potter Trust Fund 0.2$ Operating Funds
Resource Indemnity Trust 116.0$ FWP License Account 85.1$
Tobacco Trust Fund 283.2$ Local Agencies 1,769.4$
School Trust 830.9$ Montana State University 235.1$
Weed Control Trust 11.3$ MT Tech-UM Agency Funds 11.3$
Wildlife Habitat Trust 16.0$ State Agencies 686.8$
Trust Funds - Expendable State Treasurer's Fund 1,787.2$
Abandoned Mine Trust 6.7$ University of Montana 100.4$
Barker Hughesville St Response 9.1$ Insurance Funds
Belt Water Treatment Plant 26.7$ MUS Workers' Compensation 16.6$
Butte Area One Restoration 7.1$ PERS Defined Cont Disability 7.3$
Butte Redevelopment Trust 14.7$ State Fund Insurance 1,583.3$
Clark Fork River Restoration 30.1$ Subsequent Injury Fund 0.5$
Clark Fork Site Response 70.9$ Group Benefits 147.1$
East Helena Compensation 4.9$ MUS Group Insurance 105.9$
Flying J Cecra Facilities Fund 2.6$ 11

Non-Pension ClientsPolicy and Portfolio Construction
• Develop portfolio objectives and constraints in consultation with clients and
investment staff
• Choose an appropriate benchmark and define the investment guidelines
• Construct portfolio based on guidelines
o Duration based on interest rate and economic outlook versus market
o Relative value between sectors / securities
• Monitor portfolio
o Regular review of portfolio characteristics relative to the benchmark
o Continual evaluation of current securities and potential opportunities
o Regular meetings to discuss news, market events, portfolio structure,
relative value, and market color
12

Non-Pension ClientsPolicy and Portfolio Construction
• All team members participate in portfolio management
• Continual search for efficiency improvements
o Electronic trading
o Systematic credit research process
o Bloomberg data
13

Non-Pension ClientsTypes of Investments and Why We Use Them
• Short Term Investment Pool (STIP)
o Similar to a short-term money market fund
o Provides liquidity
o Modest increase in yield
o Default fund to all investments not otherwise allocated
• Trust Funds Investment Pool (TFIP)
o Diversify investments
o Increase yield
o Enhance Total Return
• Individual Securities
o Special circumstances
14

Non-Pension ClientsTrust Funds Investment Pool Objectives
• Strategic Objective
o Provide a diversified investment vehicle for participants that offers a
return that assists in supporting client missions
• Investment Objectives
o Provide investment income by assuming a prudent amount of risk
o Preserve principal by diversifying the portfolio across risk factors
15

Non-Pension ClientsTrust Funds Investment Pool Characteristics 03/31/2021
• Total market value: $2.67B
Investment Grade Fixed Income
76%
Real Estate16%
High Yield8%
TFIP ASSET ALLOCATION
16

Non-Pension ClientsTrust Funds Bond Portfolio Characteristics 03/31/2021
• Total market value: $2.03B
• Portfolio Duration: 5.85 versus Bloomberg Barclays Aggregate duration: 6.27
• Portfolio Yield to Maturity: 1.63% versus Bloomberg Barclays Aggregate yield
to maturity: 1.58%
17
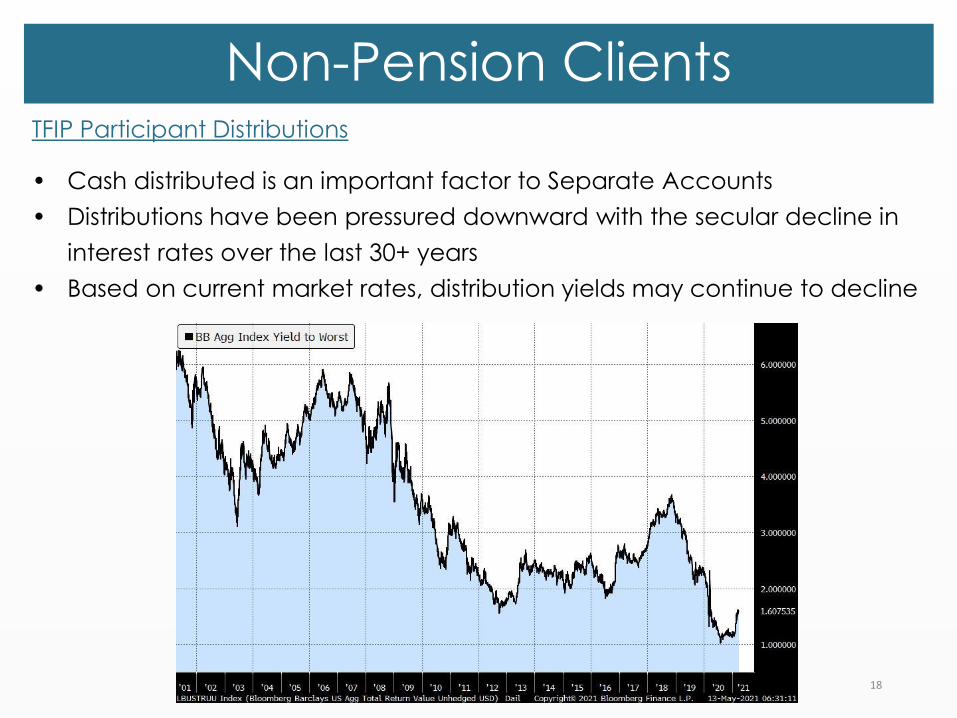
Non-Pension ClientsTFIP Participant Distributions
• Cash distributed is an important factor to Separate Accounts
• Distributions have been pressured downward with the secular decline in
interest rates over the last 30+ years
• Based on current market rates, distribution yields may continue to decline
18

Non-Pension ClientsShort Term Investment Pool Objectives
• STIP has three clearly defined objectives in order of importance:
o Preservation of principal
o Liquidity
o Return
19

Non-Pension ClientsShort Term Investment Pool Characteristics 03/31/2021
• All securities in STIP are highly rated
• STIP is diversified over asset classes
• Weighted Average Life 58 days, Duration 0.16 years
• 1 Day Liquidity 18.9%, over $1 billion
• 1 Week Liquidity 22.9%, over $1.2 billion
• Government/Agency allocation 28.9%, over $1.5 billion
• Yield 0.11%
20

Non-Pension ClientsShort Term Investment Pool Net Yield
• STIP yield has seen a sharp decrease as the Federal Reserve cut short-term
interest rates at the start of the pandemic.
• Based on current market expectations, STIP yield will remain low
21
0.0
0.5
1.0
1.5
2.0
2.5
3.0
3.5
4.0
4.5
5.0
2007 2008 2009 2010 2011 2012 2013 2014 2015 2016 2017 2018 2019 2020
Yiel
d P
erce
nt
STIP Net Yield

Non-Pension ClientsState Fund Investment Portfolio Objectives
• Strategic Objective
o Attain returns that assist MSF in meeting liabilities as well as maintaining
stable, cost effective rates for workers’ compensation insurance
• Primary Investment Objectives
o Provide investment income by assuming a prudent amount of risk
o Preserve principal by diversifying the portfolio across risk factors
• Secondary Investment Objectives
o Long-term capital appreciation in excess of inflation
22

Non-Pension ClientsState Fund Investment Portfolio Characteristics 03/31/2021
• Total market value: $1.58B
Investment Grade Fixed Income
78%
Domestic Equities10%
International Equities3%
Real Estate6%
Non-Core Fixed Income3%
STATE FUND ASSET ALLOCATION
23

Non-Pension ClientsState Fund Bond Portfolio Characteristics 03/31/2021
• Total market value: $1.24B
• Portfolio Duration: 4.07 versus Bloomberg Barclays Intermediate Aggregate
duration: 4.09
• Portfolio Yield to Maturity: 1.14% versus Bloomberg Barclays Intermediate
Aggregate yield to maturity: 1.26%
24

Fixed Income ManagementCosts
• Costs are low relative to other methods of gaining exposure
o Internal (Pension funds): 1.1 bps, average AUM of $2.43B
▪ Cost per the 2019 CEM Benchmark study
o iShares IG Corporate Bond ETF (LQD): 14 bps, AUM $41.1B
o SPDR BB/Barclays Aggregate ETF (SPAB): 4 bps, AUM $5.5B
o External Manager IG Core Fixed Income: Median of 25 bps
▪ Cost for $100M separately managed account according to
eVestment database per RVK
25

Fixed Income ManagementFixed Income Resources
• Fixed Income Team (John, Kirsten, John, Kelsey)
• Portfolio Analytics Systems
o Bloomberg PORT+
• External Managers – a sounding board
• Operations, Accounting, & Risk Management
26

Fixed Income ManagementFixed Income Resources
• Trading Capabilities
o Bloomberg AIM system
o Bloomberg E-Trading (Treasuries/Agencies)
o MarketAxess
• External Credit Research
o CreditSights
o Gimme Credit
o S&P Capital IQ / Ratings Direct
o Bloomberg
o Brokerage contacts
27

Fixed Income ManagementCompetitive Advantage
• Experience - Extensive history of internally managing IG bonds. Experienced
investment, operations, and accounting staff.
• Well-Defined Investment Process – Provides a stable, repeatable framework
that applies to all investment accounts.
• Low-cost structure – Large asset base creates economies of scale.
• Control – Ability to tailor the characteristics of portfolios to meet the specific
needs and risk tolerance of accounts.
• Solid long-term performance across portfolios vs. benchmarks.
• Internal Fixed Income Asset Management is a Core Competency of MBOI.
28

Bloomberg/MarketAxess/Internal Tools
• Macroeconomic information
o Yield Curve, Federal Reserve, Interest Rate Probability, Inflation,
Spreads, Market Volume
• Benchmark comparison and analysis
o Bloomberg Portfolio and Risk Analytics (PORT)
• Company financial analysis
o Internal credit matrix, Bloomberg Financial Analysis, CreditSights
• Individual bond analysis
o New Issue Monitor, Bond Description, Current and Historical Pricing,
Credit Curve
• Trading platforms
o Bloomberg AIM, Bloomberg E-trading, MarketAxess
• Demonstration of capabilities
Fixed Income Management
29

REAL ESTATE ASSET CLASS REVIEW
Presented by:Ethan Hurley
Director of Real Estate/Real Assets
Date: June 2, 2021

Table of Contents
Real Estate – Role, Allocation and Constraints
Opportunity Set and Investment Approach
Styles of Real Estate Investing
Types of Managers in the Real Estate Asset Class
Real Estate Returns – Sources and Drivers
Real Estate Benefits and Risks
Pacing
Investment Process
Strategy & Rationale
Property Views/Tour
Appendix
Performance and Composition
Top 10 Real Estate Investments by Net Asset Value
Real Estate Asset Class Schedule of Investments
2
3
4
5
6
7
8 - 9
10 - 11
12 - 19
20 - 21
22
23 – 35
24 - 30
31
32 -35

Real Estate Asset Class – Role, Allocation and Constraints
• Provide the Consolidated Asset Pension Plan (CAPP) with exposure to diversified real estate opportunities, while achieving the highest possible return.
• Diversify across types of real estate investment strategies, vintage years, real estate types, and geographies for long-term capital gains and current income.
• Inception – 6/1/2006
• Benchmark
• NCREIF Fund Index – Open-End Diversified Core Equity (Since 7/1/2020)
• Approved Allocation Range - 5% to 13% of CAPP
• Investment Policy Statement Constraints
• No more than 2% of CAPP in any single real estate investment
• No more than 30% of the asset class in international real estate
• No more than 10% of the asset class in direct co-investments
• Strategic Constraints
• Core – 20% - 50%
• Core-Plus/Non-Core – 25% - 65%
• Real Estate Debt – 10% - 40%
• Public Real Estate Securities – 0% - 40%
• Leverage limits -
• Individual fund basis up to 75%
• Total Real Estate Asset Class up to 60%
• Leverage policy range per strategy
• Core – 0% - 50%
• Core-Plus/Non-Core – 0% - 75%
• Real Estate Debt – 0% - 75% 3

Opportunity Set and Investment Approach
(A) Public Equity
• Separately managed account holds common stock of publicly traded Real Estate Investment Trusts (REITs) (active)
(B) Private Equity
• Limited Partnerships - Open or Closed-End Funds (active)
(C) Public Debt
• Mutual Fund (active)
(D) Private Debt
• Limited Partnerships - Open or Closed-End Funds (active)
4
EquityOwns a residual interest in the property
DebtLends funds to an owner of real estate or purchase of real estate-backed bonds
PublicPublicly listed and traded frequently
PrivatePrivately heldand infrequently traded

5
✓ Investors own equity or debt
✓ Highest occupancy✓ Least leveraged (0 – 35%)✓ Best locations (Main &
Main)✓ Good tenant credit✓ Most liquid✓ Numerous buyers and
sellers✓ Lowest expected return,
mostly from rental income
✓ Investors own equity or debt
✓ Mid-range occupancy✓ Higher leverage (65 – 75%)✓ Needs operating
improvements✓ Needs minor renovations✓ Expected return a
combination of appreciation, income and leverage
✓ Investors own equity or debt
✓ Generally lower occupancy
✓ Higher leverage (70 – 85%)✓ Needs major operating
improvements, i.e., change of use, rezoning, variances
✓ Needs major renovations✓ Investment return nearly all
from appreciation and leverage
CORENON-CORE:
VALUE-ADDED
Styles of Private Real Estate Equity/Debt Investing
NON-CORE:
OPPORTUNISTICCORE-PLUS
✓ Investors own equity or debt
✓ High occupancy✓ Generally higher leverage
than Core (35 – 65%)✓ Good tenant credit✓ Very liquid✓ Numerous buyers and
sellers✓ Higher expected return
than Core, but mostly from rental income, limited ground-up development

Types of Fund Managers in the Real Estate Asset Class
Private Equity Allocators (ex. Angelo Gordon)• Create joint venture partnerships with local real estate operators, who:
• Have local market expertise and networks, source new acquisitions
• Charged with day-to-day operations of fund properties
• Local operators typically invest equity alongside the fund manager and receive incentive compensation
Private Equity Operators (ex. Hammes Partners)• Vertically integrated across all real estate investment activities, including
acquisitions to dispositions, leasing, property and asset management, construction and development
Private Debt Managers (ex. Walton Street Capital)• Range from those that strictly originate and extend loans to buyers of
commercial real estate to those that do this in addition to buying real estate-backed bonds/loans
Public REIT Managers (ex. CenterSquare Investment Management)
• Manage separate accounts and buy and sell public equity securities in real estate investment trusts
Public Debt Managers (ex. Fidelity Real Estate High Income)
• Manages an Investment Act of 1940 registered mutual fund that buys and sells high-yield CMBS bonds
6

Real Estate Returns – Sources and Drivers
SourcesAppreciation/Depreciation
• Increases or decreases in the market value of an asset
Income• Rents received less capital
expenditures and operating expenses
• Ancillary income (ex. rooftop cell tower rent, parking income, etc.)
DriversLocation
Physical condition
Supply/demand
Credit quality of tenants
Cap rate compression/expansion
Employment
Amenities
Occupancy
Square footage of property
Rent roll – renewing rents at higher or lower rates
Capital expenditures
Market comparable sales
Capital markets liquidity
7

Real Estate - Benefits
✓Return enhancement
✓Diversification
✓Hard asset downside protection
✓Inflation hedge
✓Contractual income
✓Ability to influence performance
8

Real Estate - Risks
✓Business risk
✓Financial risk
✓Liquidity risk
✓Inflation risk
✓Operational risk
✓Legal risk
✓Counterparty risk9

PacingCommitment plan on when and how much to invest in real estate to
reach and/or maintain an allocation target within the approved ranges
Items to consider
• Current portfolio valuation
• Considers annualized growth rate of the total plan assets (CAPP)
• Provides flexibility to explore different scenarios
• Forecasted timing of when commitments are drawn down
• Forecasted timing of distributions received as funds mature
• How future commitments, capital calls and distributions contribute to maintaining the allocation within approved ranges through time
• This is an arcane, inexact exercise
• The only controllable input/metric is how much we commit, or don’t, in any given year
• RVK assists with periodic studies
10

Actual Pacing – Commitments Past 5 Years
11
MBOI Real Estate Investment Process
12

Investment Process
13
Deal Sourcing
Screening & Due
Diligence
Cabinet Meeting
Legal Review
Fund
Monitoring

Deal Sourcing
•Network of Contacts• Limited Partners
• Plan Sponsors
• General Partners
• Placement Agents
• Consultants
• Service Providers
•Periodicals
•Preqin (external online database provider)
14

Real Estate Deal Flow (2016 - YTD 2021)
15
FUNDS SOURCED AND REVIEWED
1243 (100%)
FUNDS KILLED DURING SCREENING
1213 (97.5%)
FUNDS ADVANCED TO INITIAL DUE DILIGENCE
65 (5.2%)
FUNDS ADVANCED TO FINAL
DUE DILIGENCE
42 (3.3%)
FUNDSCOMMITTED
30 (2.4%)
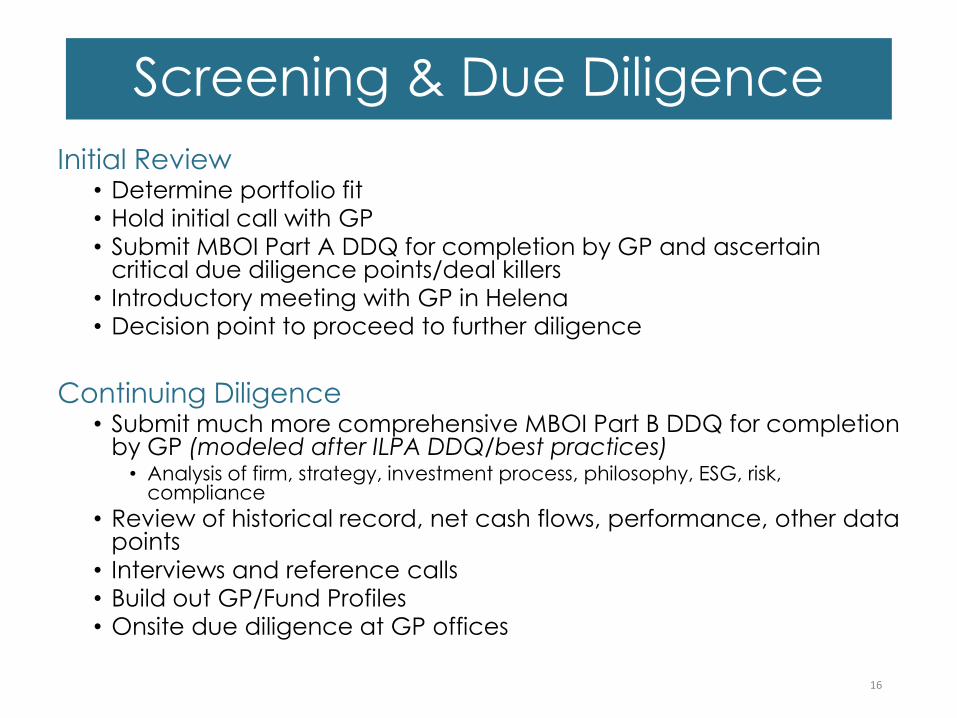
Initial Review• Determine portfolio fit • Hold initial call with GP• Submit MBOI Part A DDQ for completion by GP and ascertain
critical due diligence points/deal killers• Introductory meeting with GP in Helena• Decision point to proceed to further diligence
Continuing Diligence• Submit much more comprehensive MBOI Part B DDQ for completion
by GP (modeled after ILPA DDQ/best practices)• Analysis of firm, strategy, investment process, philosophy, ESG, risk,
compliance
• Review of historical record, net cash flows, performance, other data points
• Interviews and reference calls• Build out GP/Fund Profiles• Onsite due diligence at GP offices
16
Screening & Due Diligence

• Meeting with Cabinet – Executive Director, Chief Investment Officer, Investment Directors, Director of Operations, Director of Risk
• Final commitment decision• Yes/No• How much to commit, adherence to IPS, other risk
parameters• Chief Investment Officer in consultation with the Executive
Director gives final approval for all commitments
17
Cabinet Decision - Investment Commitment

• Staff conducts initial review of PPM/limited partnership agreement and communicates any pre-identified and pre-negotiated terms with GP to external counsel
• External counsel reviews legal documents and presents comments to staff for review
• Focuses on compliance with ILPA Principles/best practices
• Collaborative/iterative process with staff
• Comments/changes negotiated with GP
• Upon final negotiation/consensus and settlement on terms, legal counsel submits final copies of closing legal documents for execution by MBOI staff
• Legal counsel will later review any Most Favored Nations provisions MBOI is eligible to elect for approval
18
Legal Review

• Set up fund internally with MBOI accounting and externally with third-party administrator, State Street
• Review Quarterly/Annual Reports & Financials• Formal review of real estate managers done bi-annually
• Participate in quarterly calls with managers
• In-person fund update meetings, typically annually
• Attend Annual General Meetings (AGMs)
• Limited Partnership Advisory Committee membership participation as applicable
• Visit real estate GPs and fund properties as travel plans allow
19
Fund Monitoring

Real Estate Strategy & Rationale
20

What Why
• Focus on US, but consider all opportunities
• Preference for pure-play, vertically integrated real estate operators
• Continued focus on growing existing real estate debt exposure
• Reduce core real estate exposure
• Continued focus on existing high conviction GPs
• Separate Accounts
• Tactically add to existing public REIT exposure
• Well understood, deepest, most liquid, ample diversification, known “rules of the game”
• More nimble and responsive to shifts in the market, closer to the asset, own their data, removes extra layer of fees
• Diversify away from equity exposure, greater downside protection, current income
• Generate liquidity to fund other real estate strategies
• Good portfolio fit, known quantities, partnership orientation, more depth less breadth
• Long duration holds, income streams
• Diversification of current exposure beyond private real estate equity, higher long-term return profile relative to core real estate, lower cost, more liquid
21
Current Strategy and Rationale

Property Views on Google Earth
22
Property Type Manager/Asset Address/MSAStyle &
Strategy
MultifamilyBell Partners
Bell Capital Hill
1717 E Capitol St SE
Washington, DC
Non-
Core/Value
Add
Operator
Medical OfficeHammes Partners
HPIII Salt Lake City
1159 East 200 N
Salt Lake City, UT
Non-
Core/Value
Add
Operator
RetailSterling Organization
Langston Landing
210-406 Washington Ave S
Seattle, WA
Core-Plus
Operator

Appendix
23

Real Estate Asset Class –Performance and Composition
24

Performance and Net Asset Value
Time-Weighted Return (TWR) Performance as of 3/31/21, net of fees
• 1 year 5.68%
• 5 year 6.77%
• 10 year 9.24%
• Since inception 3.98%
Sizing as of 3/31/21 - $1.24B
• % of CAPP 9.13%
25

26Data reflects most recent GP reported holdings as of 12/31/20

27Data reflects most recent GP reported holdings as of 12/31/20

28Data reflects most recent GP reported holdings as of 12/31/20

29Data reflects most recent GP reported holdings as of 12/31/20

30Data reflects most recent GP reported holdings as of 12/31/20

Montana Board of Investments
Period Ended: March 31, 2021

We are deeply grateful for your continued confidence and support. From all of us here at RVK, thank you for the opportunity to serve you!
Coalition Greenwich recently announced that RVK is 1 of 3 firms among large US consultants to receive the 2020 Greenwich Quality Leader award.* RVK is proud to receive this recognition for the 4th consecutive year.
RVK ranked first (or tied for first) in 11 out of 14 key criteria:
*Between July and October 2020, Coalition Greenwich (formerly known as Greenwich Associates) conducted in-person and phone interviews and online surveys with 856 individuals at 704 of the largest tax-exempt funds in the US–including corporate and union funds, public funds, endowments and foundations, insurance general accounts, and healthcare organizations, with either pension or investment pool assets greater than $150 million. Study participants were asked to provide quantitative and qualitative evaluations of their asset managers and investment consultants, including qualitative assessments of those firms soliciting their business and detailed information on important market trends. RVK is one of three firms recognized in the large investment consultant category. The ratings may not be representative of any one client’s experience with RVK; rather they are representative of those clients that chose to participate in the survey. The results are not indicative of RVK’s future performance. To read the Greenwich press release, please refer to the following URL: https://www.greenwich.com/press-release/covid-19-crisis-put-investment-consultant-advisory-capabilities-test
• Sufficient Professional Resources to Meet Client Needs (#1)• Reasonable Fees Relative to Services Delivered (#1)• Timeliness in Providing Written Info/Reports (#1)• Advice on DC Plan Structure and Design (tied for #1)• Usefulness of Personal Meetings (tied for #1)
• Advice on Long-term Asset Allocation (#1)• Communication of Philosophy and Beliefs (#1)• Proactive Advice and Innovative Ideas (#1)• Usefulness of Written Investment Reviews (#1)• Client Satisfaction with Manager Recommendations (#1)• Responsiveness to Client Requests (#1)
2017 2018 2019 2020
2020 Greenwich Quality Leader Award

QTD/CYTD
FYTD1
Year3
Years5
Years7
Years10
Years20
Years2020 2019 2018 2017 2016
SinceIncep.
InceptionDate
Public Employees' Retirement - Net 3.98 19.85 31.08 9.75 10.00 8.40 8.84 6.89 11.94 16.77 -2.63 14.80 7.32 7.98 07/01/1994
Public Employees' Benchmark 4.19 22.94 42.24 10.23 10.21 8.68 9.29 N/A 11.58 20.45 -5.57 15.35 9.12 N/A
Difference -0.21 -3.09 -11.16 -0.48 -0.21 -0.28 -0.45 N/A 0.36 -3.68 2.94 -0.55 -1.80 N/A
Public Employees' Retirement - Gross 4.06 20.24 31.68 10.35 10.57 8.94 9.40 7.32 12.53 17.44 -2.03 15.34 7.78 8.30 07/01/1994
All Public Plans > $3B Total Fund Median 3.59 20.10 31.70 9.43 10.27 8.04 8.26 7.28 12.00 17.25 -2.79 16.11 8.01 8.29
Rank 32 49 51 30 35 15 10 47 40 44 42 67 59 49
Teachers' Retirement - Net 3.99 19.84 31.08 9.75 9.99 8.40 8.84 6.89 11.93 16.78 -2.64 14.76 7.33 7.99 07/01/1994
Teachers' Benchmark 4.19 22.91 42.19 10.21 10.19 8.67 9.28 N/A 11.55 20.42 -5.57 15.32 9.11 N/A
Difference -0.20 -3.07 -11.11 -0.46 -0.20 -0.27 -0.44 N/A 0.38 -3.64 2.93 -0.56 -1.78 N/A
Teachers' Retirement - Gross 4.06 20.23 31.67 10.35 10.56 8.94 9.40 7.32 12.52 17.45 -2.03 15.31 7.80 8.31 07/01/1994
All Public Plans > $3B Total Fund Median 3.59 20.10 31.70 9.43 10.27 8.04 8.26 7.28 12.00 17.25 -2.79 16.11 8.01 8.29
Rank 32 49 51 30 35 15 10 47 41 44 42 68 58 49
Police Retirement - Net 3.98 19.85 31.10 9.77 10.00 8.40 8.84 6.85 11.95 16.80 -2.63 14.79 7.32 7.85 07/01/1994
Police Benchmark 4.20 22.97 42.28 10.23 10.21 8.68 9.28 N/A 11.60 20.44 -5.57 15.33 9.11 N/A
Difference -0.22 -3.12 -11.18 -0.46 -0.21 -0.28 -0.44 N/A 0.35 -3.64 2.94 -0.54 -1.79 N/A
Police Retirement - Gross 4.06 20.24 31.69 10.36 10.57 8.95 9.39 7.27 12.54 17.47 -2.02 15.33 7.78 8.17 07/01/1994
All Public Plans > $3B Total Fund Median 3.59 20.10 31.70 9.43 10.27 8.04 8.26 7.28 12.00 17.25 -2.79 16.11 8.01 8.29
Rank 32 49 51 30 35 14 10 53 40 43 42 67 59 59
Montana Board of Investments
Retirement PlansComparative Performance
As of March 31, 2021
Net performance shown is net of all manager fees and expenses (Net-All). All Public Plans > $3B Total Fund Median is reported gross of fees.Benchmark returns reflect unmanaged indices which are not impacted by management fees. Fiscal year ends on 06/30. Since inception performance may vary from State Street reported performance due to calculation methodology differences. Retirement plan benchmarks' inception dates were updated to 1/1/2011.
Page 3

Montana Board of Investments
Retirement PlansComparative Performance
As of March 31, 2021
QTD/CYTD
FYTD1
Year3
Years5
Years7
Years10
Years20
Years2020 2019 2018 2017 2016
SinceIncep.
InceptionDate
Firefighters' Retirement - Net 3.98 19.85 31.10 9.77 10.00 8.40 8.84 6.86 11.95 16.79 -2.62 14.79 7.32 7.84 07/01/1994
Firefighters' Benchmark 4.19 22.96 42.27 10.23 10.21 8.68 9.28 N/A 11.59 20.44 -5.57 15.33 9.12 N/A
Difference -0.21 -3.11 -11.17 -0.46 -0.21 -0.28 -0.44 N/A 0.36 -3.65 2.95 -0.54 -1.80 N/A
Firefighters' Retirement - Gross 4.06 20.24 31.70 10.36 10.58 8.95 9.40 7.28 12.53 17.46 -2.01 15.34 7.78 8.16 07/01/1994
All Public Plans > $3B Total Fund Median 3.59 20.10 31.70 9.43 10.27 8.04 8.26 7.28 12.00 17.25 -2.79 16.11 8.01 8.29
Rank 32 49 51 30 35 14 10 51 40 43 42 67 59 59
Sheriffs' Retirement - Net 3.98 19.85 31.09 9.75 10.00 8.40 8.84 6.88 11.94 16.75 -2.62 14.80 7.33 7.88 07/01/1994
Sheriffs' Benchmark 4.19 22.93 42.22 10.22 10.21 8.68 9.28 N/A 11.58 20.43 -5.56 15.35 9.13 N/A
Difference -0.21 -3.08 -11.13 -0.47 -0.21 -0.28 -0.44 N/A 0.36 -3.68 2.94 -0.55 -1.80 N/A
Sheriffs' Retirement - Gross 4.06 20.24 31.68 10.35 10.57 8.94 9.39 7.30 12.53 17.42 -2.02 15.34 7.79 8.19 07/01/1994
All Public Plans > $3B Total Fund Median 3.59 20.10 31.70 9.43 10.27 8.04 8.26 7.28 12.00 17.25 -2.79 16.11 8.01 8.29
Rank 32 49 51 30 35 15 10 48 40 44 42 67 58 58
Highway Patrol Retirement - Net 3.99 19.85 31.08 9.76 10.00 8.40 8.85 6.88 11.94 16.78 -2.62 14.79 7.30 7.87 07/01/1994
Highway Patrol Benchmark 4.21 22.94 42.24 10.24 10.22 8.69 9.29 N/A 11.60 20.45 -5.56 15.34 9.11 N/A
Difference -0.22 -3.09 -11.16 -0.48 -0.22 -0.29 -0.44 N/A 0.34 -3.67 2.94 -0.55 -1.81 N/A
Highway Patrol Retirement - Gross 4.07 20.24 31.67 10.36 10.57 8.95 9.40 7.31 12.53 17.45 -2.01 15.33 7.77 8.19 07/01/1994
All Public Plans > $3B Total Fund Median 3.59 20.10 31.70 9.43 10.27 8.04 8.26 7.28 12.00 17.25 -2.79 16.11 8.01 8.29
Rank 32 49 51 30 35 14 10 48 40 44 41 67 59 58
Net performance shown is net of all manager fees and expenses (Net-All). All Public Plans > $3B Total Fund Median is reported gross of fees.Benchmark returns reflect unmanaged indices which are not impacted by management fees. Fiscal year ends on 06/30. Since inception performance may vary from State Street reported performance due to calculation methodology differences. Retirement plan benchmarks' inception dates were updated to 1/1/2011.
Page 4

Montana Board of Investments
Retirement PlansComparative Performance
As of March 31, 2021
QTD/CYTD
FYTD1
Year3
Years5
Years7
Years10
Years20
Years2020 2019 2018 2017 2016
SinceIncep.
InceptionDate
Game Wardens' Retirement - Net 3.99 19.83 31.07 9.74 10.00 8.40 8.83 6.85 11.91 16.77 -2.62 14.81 7.31 7.89 07/01/1994
Game Wardens' Benchmark 4.19 22.92 42.22 10.22 10.21 8.68 9.28 N/A 11.56 20.45 -5.56 15.36 9.14 N/A
Difference -0.20 -3.09 -11.15 -0.48 -0.21 -0.28 -0.45 N/A 0.35 -3.68 2.94 -0.55 -1.83 N/A
Game Wardens' Retirement - Gross 4.06 20.22 31.67 10.34 10.57 8.94 9.38 7.27 12.50 17.44 -2.01 15.35 7.78 8.21 07/01/1994
All Public Plans > $3B Total Fund Median 3.59 20.10 31.70 9.43 10.27 8.04 8.26 7.28 12.00 17.25 -2.79 16.11 8.01 8.29
Rank 32 49 51 30 35 15 10 52 42 44 42 66 59 57
Judges' Retirement - Net 3.99 19.85 31.11 9.75 10.00 8.40 8.84 6.89 11.94 16.78 -2.64 14.82 7.32 7.88 07/01/1994
Judges' Benchmark 4.19 22.95 42.27 10.24 10.22 8.69 9.29 N/A 11.59 20.47 -5.57 15.37 9.13 N/A
Difference -0.20 -3.10 -11.16 -0.49 -0.22 -0.29 -0.45 N/A 0.35 -3.69 2.93 -0.55 -1.81 N/A
Judges' Retirement - Gross 4.06 20.24 31.70 10.35 10.58 8.95 9.39 7.31 12.53 17.45 -2.03 15.36 7.79 8.20 07/01/1994
All Public Plans > $3B Total Fund Median 3.59 20.10 31.70 9.43 10.27 8.04 8.26 7.28 12.00 17.25 -2.79 16.11 8.01 8.29
Rank 32 49 51 30 35 14 10 47 40 44 42 66 59 57
Volunteer Firefighters' Retirement - Net 3.98 19.85 31.11 9.76 9.97 8.39 8.83 7.13 11.94 16.79 -2.64 14.79 7.16 7.69 07/01/1994
Volunteer Firefighters' Benchmark 4.20 22.97 42.31 10.23 10.21 8.68 9.29 N/A 11.59 20.47 -5.59 15.33 9.11 N/A
Difference -0.22 -3.12 -11.20 -0.47 -0.24 -0.29 -0.46 N/A 0.35 -3.68 2.95 -0.54 -1.95 N/A
Volunteer Firefighters' Retirement - Gross 4.06 20.24 31.70 10.35 10.54 8.93 9.38 7.55 12.53 17.46 -2.04 15.34 7.63 8.01 07/01/1994
All Public Plans > $3B Total Fund Median 3.59 20.10 31.70 9.43 10.27 8.04 8.26 7.28 12.00 17.25 -2.79 16.11 8.01 8.29
Rank 32 49 50 30 36 15 10 27 40 43 42 67 67 68
Net performance shown is net of all manager fees and expenses (Net-All). All Public Plans > $3B Total Fund Median is reported gross of fees.Benchmark returns reflect unmanaged indices which are not impacted by management fees. Fiscal year ends on 06/30. Since inception performance may vary from State Street reported performance due to calculation methodology differences. Retirement plan benchmarks' inception dates were updated to 1/1/2011.
Page 5

Montana Board of Investments
Asset Allocation by Segment
Retirement Plans
As of March 31, 2021
($) % ($) % ($)
Public Employees' Retirement 6,743,887,599 49.49 69,213,546 49.63 6,813,101,146
Teachers' Retirement 4,766,385,772 34.98 48,356,612 34.67 4,814,742,384
Firefighters' Retirement 553,706,927 4.06 5,796,799 4.16 559,503,726
Police Retirement 516,802,225 3.79 5,421,611 3.89 522,223,836
Sheriffs' Retirement 451,074,533 3.31 4,696,315 3.37 455,770,848
Game Wardens' Retirement 253,243,545 1.86 2,528,689 1.81 255,772,235
Highway Patrol Retirement 173,730,339 1.27 1,749,699 1.25 175,480,039
Judges' Retirement 124,153,562 0.91 1,247,869 0.89 125,401,431
Volunteer Firefighters' Retirement 44,488,790 0.33 447,086 0.32 44,935,877
Retirement Plans Total Fund Composite 13,627,473,294 98.99 139,458,227 1.01 13,766,931,520
SegmentsMarket Value
($)
n CAPP Ex Cash 13,414,882,293
n CAPP Cash Pension 203,250,493
n CAPP Asset Class Cash 9,340,507
n Short Term Investment Pool (STIP) 139,458,227
o Total Cash 352,049,227
0.33
100.00
March 31, 2021 : $13,766,931,520
Allocation
(%)
97.44
34.97
2.56
Consolidated Asset Pension Pool (CAPP) Short Term Investment Pool (STIP) Total Fund
%
49.49
1.01
3.79
4.06
3.31
1.27
1.86
0.91
1.48
0.07
Allocations shown may not sum up to 100% exactly due to rounding. Retirement Plan market values may differ from State Street due to uninvested amounts notincluded in segment totals.
Page 6

March 31, 2021 : $21,664,238,303 Market Value($)
Allocation(%)
Consolidated Asset Pension Pool (CAPP) 13,627,473,325 62.90
Short Term Investment Pool 5,371,517,239 24.79
Trust Funds Investment Pool 2,665,247,739 12.30
Montana Board of Investments
Investment PoolsAsset Allocation
As of March 31, 2021
Allocations shown may not sum up to 100% exactly due to rounding. Market values do not include pending transactions.
Page 7

QTD/CYTD
FYTD1
Year3
Years5
Years7
Years10
Years2020 2019 2018 2017 2016
SinceIncep.
InceptionDate
Consolidated Asset Pension Pool (CAPP) 4.03 20.09 31.50 9.89 N/A N/A N/A 12.10 17.12 -2.74 N/A N/A 10.07 04/01/2017
CAPP Custom Benchmark 4.24 23.22 42.81 10.37 N/A N/A N/A 11.73 20.88 -5.73 N/A N/A 10.11
Difference -0.21 -3.13 -11.31 -0.48 N/A N/A N/A 0.37 -3.76 2.99 N/A N/A -0.04
Trust Funds Investment Pool -2.24 -0.51 3.04 5.09 3.76 4.09 4.44 7.23 8.98 0.45 4.01 4.02 5.99 10/01/1995
Bloomberg US Agg Bond Index -3.38 -2.13 0.71 4.65 3.10 3.31 3.44 7.51 8.72 0.01 3.54 2.65 5.08
Difference 1.14 1.62 2.33 0.44 0.66 0.78 1.00 -0.28 0.26 0.44 0.47 1.37 0.91
Short Term Investment Pool 0.04 0.19 0.38 1.55 1.32 1.00 0.77 0.73 2.28 1.98 1.11 0.61 2.36 04/01/1997
Short Term Custom Index 0.01 0.06 0.09 1.34 1.20 0.92 0.71 0.36 2.14 1.95 1.15 0.52 2.27
Difference 0.03 0.13 0.29 0.21 0.12 0.08 0.06 0.37 0.14 0.03 -0.04 0.09 0.09
iMoneynet Money Fund (Gross) Median 0.05 0.16 0.42 1.65 1.41 1.08 0.83 0.73 2.45 2.15 1.21 0.61 2.35
Difference -0.01 0.03 -0.04 -0.10 -0.09 -0.08 -0.06 0.00 -0.17 -0.17 -0.10 0.00 0.01
Montana Board of Investments
Investment PoolsComparative Performance
As of March 31, 2021
Performance shown is net of all manager fees and expenses (Net-All). Benchmark returns reflect unmanaged indices which are not impacted by management fees. Fiscal year ends on 06/30. See the Addendum for custom index specification. Since inception performance may vary from State Street reported performance due to calculation methodology differences.
Page 8

March 31, 2021 : $13,627,473,425 Market Value($)
Allocation(%)
Domestic Equity 4,326,137,263 31.75
International Equity 2,538,817,396 18.63
Core Fixed Income 2,051,555,164 15.05
Private Investments 1,893,489,895 13.89
Real Estate 1,243,638,846 9.13
Non-Core Fixed Income 794,990,854 5.83
Real Assets* 575,593,514 4.22
Cash Pension 203,250,493 1.49
Montana Board of Investments
Consolidated Asset Pension Pool (CAPP)Asset Allocation
As of March 31, 2021
Allocations shown may not sum up to 100% due to rounding.*Formerly the Natural Resources pension asset class.
Page 9

QTD/CYTD
FYTD1
Year3
Years5
Years7
Years10
Years2020 2019 2018 2017 2016
SinceIncep.
InceptionDate
Domestic Equity 7.46 34.72 63.74 16.32 15.97 12.96 13.43 20.09 30.75 -7.09 20.79 11.46 10.33 05/01/2003
Domestic Equity Custom Index 6.29 33.16 62.82 17.20 16.60 13.69 13.96 21.10 31.14 -5.20 21.05 13.03 11.06
Difference 1.17 1.56 0.92 -0.88 -0.63 -0.73 -0.53 -1.01 -0.39 -1.89 -0.26 -1.57 -0.73
International Equity 3.59 30.66 54.12 7.23 10.39 6.05 5.48 13.35 22.86 -14.99 28.67 3.87 5.36 04/01/1997
International Equity Custom Index 3.77 29.91 51.94 6.51 9.84 5.45 5.09 11.12 21.63 -14.76 27.81 4.41 5.56
Difference -0.18 0.75 2.18 0.72 0.55 0.60 0.39 2.23 1.23 -0.23 0.86 -0.54 -0.20
Core Fixed Income -3.32 -1.94 1.50 4.43 2.91 3.30 3.70 8.23 6.90 0.95 2.29 3.19 5.86 04/01/1995
Core Fixed Income Custom Index -3.37 -2.12 0.71 3.96 2.60 2.95 3.19 7.51 6.39 0.68 2.57 2.65 5.20
Difference 0.05 0.18 0.79 0.47 0.31 0.35 0.51 0.72 0.51 0.27 -0.28 0.54 0.66
Non-Core Fixed Income -0.44 9.91 19.83 6.03 6.36 4.62 5.87 6.37 13.98 -2.27 5.99 12.47 7.95 06/01/2009
Bloomberg US HY 2% Issuer Cap Index 0.86 12.27 23.65 6.82 8.04 5.42 6.47 7.05 14.32 -2.08 7.50 17.13 9.06
Difference -1.30 -2.36 -3.82 -0.79 -1.68 -0.80 -0.60 -0.68 -0.34 -0.19 -1.51 -4.66 -1.11
Real Assets 6.03 9.87 9.71 -1.65 N/A N/A N/A -13.43 -2.18 5.55 N/A N/A 0.13 04/01/2017
Real Assets Custom Index 5.04 25.27 50.50 -1.84 4.99 -1.90 -2.82 -12.32 13.06 -11.75 13.70 32.44 1.50
Difference 0.99 -15.40 -40.79 0.19 N/A N/A N/A -1.11 -15.24 17.30 N/A N/A -1.37
Real Estate 3.22 5.35 5.68 5.59 6.77 8.56 9.24 -0.35 6.97 9.19 9.17 8.82 3.98 06/01/2006
Real Estate Custom Index 1.10 -0.41 11.25 2.00 1.81 4.81 7.07 -19.66 25.84 -4.57 5.99 9.08 4.34
Difference 2.12 5.76 -5.57 3.59 4.96 3.75 2.17 19.31 -18.87 13.76 3.18 -0.26 -0.36
Cash Pension 0.05 0.16 0.36 1.56 N/A N/A N/A 0.84 2.28 2.00 N/A N/A 1.49 05/01/2017
Short Term Custom Index 0.01 0.06 0.09 1.34 1.20 0.92 0.71 0.36 2.14 1.95 1.15 0.52 1.35
Difference 0.04 0.10 0.27 0.22 N/A N/A N/A 0.48 0.14 0.05 N/A N/A 0.14
Private Investments* 7.40 24.15 18.33 13.22 12.99 11.91 12.51 10.91 12.95 11.55 15.20 7.37 12.44 05/01/2002
Private Investments Custom Index 10.52 50.45 91.17 14.83 15.18 14.02 16.03 18.90 27.38 -9.99 20.59 20.11 12.14
Difference -3.12 -26.30 -72.84 -1.61 -2.19 -2.11 -3.52 -7.99 -14.43 21.54 -5.39 -12.74 0.30
For additional information on the Private Investments Custom Index, please see the Addendum.*Performance is based on the prior quarter's fair market value adjusted for cash flows during the most recent quarterly period.
Montana Board of Investments
Consolidated Asset Pension Pool (CAPP)Comparative Performance
As of March 31, 2021
Performance shown is net of all manager fees and expenses (Net-All). Benchmark returns reflect unmanaged indices which are not impacted by management fees. Fiscal year ends on 06/30. Please see Addendum for custom index specification. Since inception performance may vary from State Street reported performance due to calculation methodology differences.
Page 10

QTD/CYTD
FYTD1
Year3
Years5
Years7
Years10
Years2020 2019 2018 2017 2016
SinceIncep.
InceptionDate
Domestic Equity 7.52 34.96 64.11 16.65 16.30 13.28 13.77 20.37 31.13 -6.78 21.16 11.77 10.62 05/01/2003
All Public Plans-US Equity Segment Median 6.78 33.78 63.57 15.98 16.09 12.75 13.32 18.92 30.04 -5.83 20.31 12.78 11.02
Rank 30 40 44 36 41 27 28 32 28 74 31 74 71
Population 74 68 66 61 57 54 40 67 65 66 89 90 14
International Equity 3.67 30.96 54.59 7.58 10.74 6.39 5.83 13.71 23.28 -14.72 29.06 4.24 5.78 04/01/1997
All Public Plans-Intl. Equity Segment Median 4.23 31.61 54.76 8.18 10.96 6.72 6.62 12.76 23.71 -13.63 28.75 4.00 N/A
Rank 66 62 51 67 61 73 80 45 62 78 46 44 N/A
Population 70 66 66 62 61 56 40 68 65 68 84 88 N/A
Core Fixed Income -3.30 -1.89 1.56 4.48 2.95 3.34 3.74 8.29 6.94 1.00 2.34 3.21 5.99 04/01/1995
All Public Plans-US Fixed Income Segment Median -2.74 0.75 5.80 5.34 4.05 3.88 4.14 8.59 9.25 -0.25 4.59 4.61 N/A
Rank 73 86 81 85 95 85 77 58 86 12 90 73 N/A
Population 75 72 70 65 64 61 47 74 68 72 85 90 N/A
Trust Funds Investment Pool -2.22 -0.45 3.12 5.17 3.84 4.17 4.53 7.30 9.06 0.53 4.10 4.12 6.05 10/01/1995
All Public Plans-US Fixed Income Segment Median -2.74 0.75 5.80 5.34 4.05 3.88 4.14 8.59 9.25 -0.25 4.59 4.61 N/A
Rank 38 72 69 55 59 43 40 78 53 22 62 61 N/A
Population 75 72 70 65 64 61 47 74 68 72 85 90 N/A
Real Estate 3.38 5.96 6.79 7.13 8.42 10.11 10.83 1.11 8.65 11.12 10.91 10.26 5.42 06/01/2006
All Public Plans-Real Estate Segment Median 2.37 4.72 3.34 6.26 7.34 9.33 10.47 1.66 7.65 9.04 8.84 9.98 N/A
Rank 22 30 14 29 29 24 40 72 39 15 26 47 N/A
Population 46 40 39 30 25 18 14 38 35 27 32 28 N/A
Montana Board of Investments
Investment PoolsComparative Performance
As of March 31, 2021
Performance shown is gross of fees. Fiscal year ends on 06/30. Since inception performance may vary from State Street reported performance due to calculation methodology differences.
Page 11

QTD/CYTD
FYTD1
Year3
Years5
Years7
Years10
Years2020 2019 2018 2017 2016
SinceIncep.
InceptionDate
Domestic Large Cap Equity - Net 6.63 32.50 60.97 17.65 16.79 13.93 14.05 21.44 31.06 -4.71 21.66 11.30 9.82 12/01/2006
S&P 500 Index (Cap Wtd) 6.17 29.71 56.35 16.78 16.29 13.59 13.91 18.40 31.49 -4.38 21.83 11.96 9.80
Difference 0.46 2.79 4.62 0.87 0.50 0.34 0.14 3.04 -0.43 -0.33 -0.17 -0.66 0.02
Domestic Large Cap Equity - Gross 6.68 32.67 61.25 17.87 16.98 14.12 14.25 21.66 31.29 -4.52 21.82 11.45 10.04 12/01/2006
IM U.S. Large Cap Equity (SA+CF) Median 6.64 30.88 59.60 16.53 16.26 13.30 13.82 17.85 30.27 -5.01 21.73 11.07 10.03
Rank 50 41 41 34 38 35 38 34 41 45 49 47 49
Domestic Large Cap Active - Net 8.23 34.74 63.18 17.79 16.85 13.90 14.08 21.48 31.03 -5.88 21.85 9.63 9.52 07/01/2007
S&P 500 Index (Cap Wtd) 6.17 29.71 56.35 16.78 16.29 13.59 13.91 18.40 31.49 -4.38 21.83 11.96 9.59
Difference 2.06 5.03 6.83 1.01 0.56 0.31 0.17 3.08 -0.46 -1.50 0.02 -2.33 -0.07
Domestic Large Cap Active - Gross 8.37 35.32 64.13 18.50 17.48 14.50 14.66 22.24 31.82 -5.34 22.40 10.12 10.05 07/01/2007
IM U.S. Large Cap Equity (SA+CF) Median 6.64 30.88 59.60 16.56 16.26 13.31 13.84 17.90 30.27 -5.01 21.73 11.07 9.81
Rank 40 29 29 31 33 30 32 33 34 55 43 58 42
Domestic Mid Cap Equity - Net 13.54 47.84 83.41 13.84 14.25 10.24 11.70 13.53 28.03 -10.75 19.45 12.30 9.64 01/01/2005
Russell Mid Cap Index 8.14 39.35 73.64 14.73 14.67 11.65 12.47 17.10 30.54 -9.06 18.52 13.80 10.32
Difference 5.40 8.49 9.77 -0.89 -0.42 -1.41 -0.77 -3.57 -2.51 -1.69 0.93 -1.50 -0.68
Domestic Mid Cap Equity - Gross 13.54 47.84 83.41 14.00 14.62 10.69 12.19 13.53 28.11 -10.28 20.18 12.97 10.11 01/01/2005
IM U.S. Mid Cap Equity (SA+CF) Median 8.69 40.59 74.49 14.51 15.09 11.54 12.72 14.95 30.14 -9.08 19.52 12.76 10.92
Rank 27 25 26 55 54 68 61 58 65 58 48 49 82
Domestic Small Cap Equity - Net 14.74 54.45 88.04 13.52 15.19 10.91 11.81 13.07 25.76 -10.51 15.65 19.31 12.49 03/01/2003
Russell 2000 Index 12.70 55.36 94.85 14.76 16.35 11.05 11.68 19.96 25.53 -11.01 14.65 21.31 12.06
Difference 2.04 -0.91 -6.81 -1.24 -1.16 -0.14 0.13 -6.89 0.23 0.50 1.00 -2.00 0.43
Domestic Small Cap Equity - Gross 14.86 54.92 88.75 13.97 15.74 11.49 12.45 13.50 26.25 -10.09 16.27 19.97 13.04 03/01/2003
IM U.S. Small Cap Equity (SA+CF) Median 13.60 53.90 94.07 14.80 16.11 11.53 12.64 16.51 25.86 -10.62 15.16 20.87 13.40
Rank 43 48 63 55 54 51 54 57 48 48 44 57 59
Montana Board of Investments
Equity CompositesComparative Performance
As of March 31, 2021
Net performance shown is net of all manager fees and expenses (Net-All). Gross returns are compared to median performance of similar managers. A peer group of similar managers may not exist for all composites. Fiscal year ends on 06/30. Since inception performance may vary from State Street reported performance due to calculation methodology differences.
Page 12

Montana Board of Investments
Equity CompositesComparative Performance
As of March 31, 2021
QTD/CYTD
FYTD1
Year3
Years5
Years7
Years10
Years2020 2019 2018 2017 2016
SinceIncep.
InceptionDate
International Large Cap Passive - Net 3.59 28.71 49.65 6.62 10.00 5.64 5.18 10.81 21.59 -14.04 27.79 4.87 7.45 06/01/2009
MSCI ACW Ex US Index (USD) (Net) 3.49 28.67 49.41 6.51 9.76 5.26 4.93 10.65 21.51 -14.20 27.19 4.50 7.23
Difference 0.10 0.04 0.24 0.11 0.24 0.38 0.25 0.16 0.08 0.16 0.60 0.37 0.22
International Large Cap Passive - Gross 3.60 28.76 49.74 6.68 10.08 5.72 5.26 10.88 21.66 -13.98 27.88 4.96 7.53 06/01/2009
International Equity Active - Net 3.63 32.92 59.55 8.26 11.11 7.14 6.48 15.91 25.83 -16.18 30.82 2.63 4.44 04/01/1997
MSCI ACW Ex US Index (USD) (Net) 3.49 28.67 49.41 6.51 9.76 5.26 4.93 10.65 21.51 -14.20 27.19 4.50 5.62
Difference 0.14 4.25 10.14 1.75 1.35 1.88 1.55 5.26 4.32 -1.98 3.63 -1.87 -1.18
International Equity Active - Gross 3.76 33.42 60.34 8.81 11.69 7.69 7.00 16.50 26.48 -15.73 31.50 3.17 4.96 04/01/1997
IM International Large Cap Core Equity (SA+CF) Median 4.04 28.41 50.45 7.02 9.80 6.21 6.83 10.83 23.88 -14.34 26.34 1.60 7.03
Rank 55 18 14 29 25 19 46 28 29 68 12 31 100
International Value - Net 4.69 32.61 52.34 5.94 10.26 5.85 5.34 9.31 20.76 -13.97 30.72 5.59 3.30 11/01/2006
MSCI ACW Ex US Val Index (USD) (Net) 7.06 31.85 48.68 2.40 7.25 2.61 3.02 -0.77 15.72 -13.97 22.66 8.92 2.55
Difference -2.37 0.76 3.66 3.54 3.01 3.24 2.32 10.08 5.04 0.00 8.06 -3.33 0.75
International Value - Gross 4.82 33.11 53.09 6.48 10.83 6.40 5.90 9.87 21.37 -13.52 31.39 6.17 3.88 11/01/2006
IM International Large Cap Value Equity (SA+CF) Median 6.07 32.15 52.00 5.68 8.95 5.18 6.23 5.02 21.17 -14.58 26.02 4.29 4.89
Rank 68 44 46 40 26 23 60 33 47 39 12 31 69
International Growth - Net 1.99 31.15 59.38 11.90 11.92 8.16 6.89 23.08 31.39 -16.09 28.01 0.51 5.06 11/01/2006
MSCI ACW Ex US Grth Index (USD) (Net) -0.08 25.40 49.36 10.31 12.03 7.74 6.69 22.20 27.34 -14.43 32.01 0.12 5.54
Difference 2.07 5.75 10.02 1.59 -0.11 0.42 0.20 0.88 4.05 -1.66 -4.00 0.39 -0.48
International Growth - Gross 2.12 31.67 60.22 12.51 12.55 8.75 7.44 23.74 32.10 -15.61 28.74 1.12 5.61 11/01/2006
IM International Large Cap Growth Equity (SA+CF) Median 1.15 28.46 54.48 10.86 12.61 8.33 8.44 20.41 28.38 -13.91 31.26 -0.04 6.49
Rank 31 27 25 34 52 44 72 38 18 66 68 34 73
International Small Cap - Net 4.76 36.01 69.78 6.16 10.57 6.80 7.10 14.63 23.91 -18.90 33.61 1.84 5.73 09/01/2006
MSCI ACWI Ex US Sm Cap Index IMI (USD) (Net) 5.53 38.25 69.82 6.61 10.40 6.67 6.32 14.24 22.42 -18.20 31.65 3.91 6.25
Difference -0.77 -2.24 -0.04 -0.45 0.17 0.13 0.78 0.39 1.49 -0.70 1.96 -2.07 -0.52
Gross of fees performance is not available (N/A) for the International Small Cap composite which currently consists of DFA Intl Sm Co;I (DFISX), DFA Emg Mkts Sm Cap;I (DEMSX),BlackRock ACWI Ex-US Small Cap (CF), Templeton Investment Counsel (SA), and American Century Investment Mgmt (SA).
Net performance shown is net of all manager fees and expenses (Net-All). Gross returns are compared to median performance of similar managers. A peer group of similar managers may not exist for all composites. Fiscal year ends on 06/30. Since inception performance may vary from State Street reported performance due to calculation methodology differences.
Page 13

QTD/CYTD
FYTD1
Year3
Years5
Years7
Years10
Years2020 2019 2018 2017 2016
SinceIncep.
InceptionDate
Domestic Large Cap Passive - Net 5.49 30.78 59.09 17.47 16.65 13.76 14.04 21.33 30.99 -3.94 21.34 12.01 7.06 05/01/2000
S&P 500 Index (Cap Wtd) 6.17 29.71 56.35 16.78 16.29 13.59 13.91 18.40 31.49 -4.38 21.83 11.96 6.99
Difference -0.68 1.07 2.74 0.69 0.36 0.17 0.13 2.93 -0.50 0.44 -0.49 0.05 0.07
Domestic Large Cap Passive - Gross 5.50 30.79 59.11 17.48 16.66 13.77 14.05 21.35 31.00 -3.93 21.35 12.03 7.10 05/01/2000
IM U.S. Large Cap Index Equity (SA+CF) Median 6.18 31.76 59.50 17.07 16.58 13.59 13.90 19.39 31.42 -4.75 21.74 12.02 7.19
Rank 84 54 54 22 37 22 22 20 66 20 61 49 54
Domestic Large Cap Enhanced - Net 5.14 30.68 57.67 16.69 16.60 13.92 14.16 18.62 32.81 -4.20 24.21 9.73 9.97 06/01/2006
S&P 500 Index (Cap Wtd) 6.17 29.71 56.35 16.78 16.29 13.59 13.91 18.40 31.49 -4.38 21.83 11.96 10.25
Difference -1.03 0.97 1.32 -0.09 0.31 0.33 0.25 0.22 1.32 0.18 2.38 -2.23 -0.28
Domestic Large Cap Enhanced - Gross 5.21 30.96 58.11 17.01 16.91 14.25 14.49 18.97 33.17 -3.96 24.53 10.05 10.29 06/01/2006
IM U.S. Large Cap Core Equity (SA+CF) Median 6.74 30.56 57.18 16.15 16.14 13.25 13.77 17.19 30.06 -5.17 21.85 10.63 10.38
Rank 75 48 46 35 31 24 24 39 15 30 21 58 57
Domestic Large Cap 130/30 - Net 8.86 35.58 64.32 17.73 16.61 13.54 14.12 21.97 30.67 -7.10 20.28 9.54 11.28 03/01/2008
S&P 500 Index (Cap Wtd) 6.17 29.71 56.35 16.78 16.29 13.59 13.91 18.40 31.49 -4.38 21.83 11.96 11.02
Difference 2.69 5.87 7.97 0.95 0.32 -0.05 0.21 3.57 -0.82 -2.72 -1.55 -2.42 0.26
Domestic Large Cap 130/30 - Gross 9.02 36.22 65.36 18.57 17.42 14.31 14.89 22.79 31.57 -6.32 21.10 10.22 12.03 03/01/2008
IM U.S. Large Cap Core Equity (SA+CF) Median 6.74 30.56 57.18 16.15 16.14 13.25 13.77 17.13 30.06 -5.17 21.85 10.63 11.09
Rank 27 18 17 15 24 21 16 24 33 71 63 56 20
Montana Board of Investments
Equity Sub CompositesComparative Performance
As of March 31, 2021
Net performance shown is net of all manager fees and expenses (Net-All). Gross returns are compared to median performance of similar managers. A peer group of similar managers may not exist for all composites. Fiscal year ends on 06/30. Since inception performance may vary from State Street reported performance due to calculation methodology differences.
Page 14

QTD/CYTD
FYTD1
Year3
Years5
Years7
Years10
Years2020 2019 2018 2017 2016
SinceIncep.
InceptionDate
Domestic Large Cap Equity
BlackRock MSCI US Equity Index (SA) - Net 5.49 30.85 59.29 N/A N/A N/A N/A 21.33 N/A N/A N/A N/A 21.60 04/01/2019
MSCI US Index (USD) (Gross) 5.48 30.86 59.33 17.44 16.75 13.79 14.06 21.37 31.64 -4.50 21.90 11.61 21.64
Difference 0.01 -0.01 -0.04 N/A N/A N/A N/A -0.04 N/A N/A N/A N/A -0.04
BlackRock MSCI US Equity Index (SA) - Gross 5.49 30.86 59.31 N/A N/A N/A N/A 21.34 N/A N/A N/A N/A 21.61 04/01/2019
IM U.S. Large Cap Core Equity (SA+CF) Median 6.74 30.56 57.18 16.15 16.14 13.25 13.77 17.19 30.06 -5.17 21.85 10.63 20.27
Rank 72 49 41 N/A N/A N/A N/A 28 N/A N/A N/A N/A 31
SPDR S&P 500 ETF (SPY) - Net 6.28 29.87 56.12 17.56 N/A N/A N/A 19.28 31.49 -5.30 N/A N/A 16.26 07/01/2017
S&P 500 Index (Cap Wtd) 6.17 29.71 56.35 16.78 16.29 13.59 13.91 18.40 31.49 -4.38 21.83 11.96 16.29
Difference 0.11 0.16 -0.23 0.78 N/A N/A N/A 0.88 0.00 -0.92 N/A N/A -0.03
Northern Trust MSCI US Index (SA) - Net 5.49 30.84 59.30 N/A N/A N/A N/A 21.34 31.70 N/A N/A N/A 20.32 11/01/2018
MSCI US Index (USD) (Gross) 5.48 30.86 59.33 17.44 16.75 13.79 14.06 21.37 31.64 -4.50 21.90 11.61 20.31
Difference 0.01 -0.02 -0.03 N/A N/A N/A N/A -0.03 0.06 N/A N/A N/A 0.01
Northern Trust MSCI US Index (SA) - Gross 5.49 30.85 59.31 N/A N/A N/A N/A 21.36 31.71 N/A N/A N/A 20.33 11/01/2018
IM U.S. Large Cap Core Equity (SA+CF) Median 6.74 30.56 57.18 16.15 16.14 13.25 13.77 17.19 30.06 -5.17 21.85 10.63 18.93
Rank 72 49 41 N/A N/A N/A N/A 28 33 N/A N/A N/A 33
T. Rowe U.S. Structured Research (SA) - Net 5.55 31.18 58.28 16.84 16.85 14.05 14.25 18.62 32.81 -4.20 23.94 10.68 10.72 06/01/2006
S&P 500 Index (Cap Wtd) 6.17 29.71 56.35 16.78 16.29 13.59 13.91 18.40 31.49 -4.38 21.83 11.96 10.25
Difference -0.62 1.47 1.93 0.06 0.56 0.46 0.34 0.22 1.32 0.18 2.11 -1.28 0.47
T. Rowe U.S. Structured Research (SA) - Gross 5.62 31.46 58.72 17.16 17.16 14.36 14.58 18.97 33.17 -3.96 24.24 10.98 11.05 06/01/2006
IM U.S. Large Cap Core Equity (SA+CF) Median 6.74 30.56 57.18 16.15 16.14 13.25 13.77 17.13 30.06 -5.17 21.85 10.63 10.38
Rank 71 43 43 32 27 20 23 39 15 30 25 47 26
Jacobs Levy 130/30 (SA) - Net 11.13 37.83 64.38 16.67 N/A N/A N/A 17.03 31.63 N/A N/A N/A 16.67 04/01/2018
MSCI US Index (USD) (Gross) 5.48 30.86 59.33 17.44 16.75 13.79 14.06 21.37 31.64 -4.50 21.90 11.61 17.44
Difference 5.65 6.97 5.05 -0.77 N/A N/A N/A -4.34 -0.01 N/A N/A N/A -0.77
Jacobs Levy 130/30 (SA) - Gross 11.30 38.50 65.43 17.52 N/A N/A N/A 17.81 32.55 N/A N/A N/A 17.52 04/01/2018
IM U.S. Large Cap Core Equity (SA+CF) Median 6.74 30.56 57.18 16.15 16.14 13.25 13.77 17.19 30.06 -5.17 21.85 10.63 16.15
Rank 15 12 17 26 N/A N/A N/A 47 22 N/A N/A N/A 26
Montana Board of Investments
Domestic Equity ManagersComparative Performance
As of March 31, 2021
Net performance shown is net of all manager fees and expenses (Net-All). Gross returns are compared to median performance of similar managers. A peer group of similar managers may not exist for all funds. Fiscal year ends on 06/30. Since inception performance may vary from State Street reported performance due to calculation methodology differences.
Page 15

Montana Board of Investments
Domestic Equity ManagersComparative Performance
As of March 31, 2021
QTD/CYTD
FYTD1
Year3
Years5
Years7
Years10
Years2020 2019 2018 2017 2016
SinceIncep.
InceptionDate
J.P. Morgan 130/30 (SA) - Net 6.16 32.28 63.14 18.62 17.85 14.10 14.51 27.16 30.55 -6.93 22.86 10.30 12.28 03/01/2008
JPM US Equity Custom Benchmark 5.48 30.86 59.33 17.46 16.70 13.88 14.11 21.37 31.37 -4.38 21.83 11.96 11.17
Difference 0.68 1.42 3.81 1.16 1.15 0.22 0.40 5.79 -0.82 -2.55 1.03 -1.66 1.11
J.P. Morgan 130/30 (SA) - Gross 6.29 32.88 64.14 19.45 18.70 14.92 15.34 28.00 31.42 -6.13 23.79 11.09 13.09 03/01/2008
IM U.S. Large Cap Core Equity (SA+CF) Median 6.74 30.56 57.18 16.15 16.14 13.25 13.77 17.13 30.06 -5.17 21.85 10.63 11.09
Rank 61 32 20 7 11 11 7 5 36 67 28 46 3
Domestic Mid Cap Equity
iShares:Core S&P Md-Cp (IJH) - Net 13.54 47.84 83.41 13.20 N/A N/A N/A 13.53 26.24 -13.95 N/A N/A 12.14 07/01/2017
S&P Mid Cap 400 Index (Cap Wtd) 13.47 47.86 83.46 13.40 14.37 11.31 11.92 13.66 26.20 -11.08 16.24 20.74 13.11
Difference 0.07 -0.02 -0.05 -0.20 N/A N/A N/A -0.13 0.04 -2.87 N/A N/A -0.97
Net performance shown is net of all manager fees and expenses (Net-All). Gross returns are compared to median performance of similar managers. A peer group of similar managers may not exist for all funds. Fiscal year ends on 06/30. Since inception performance may vary from State Street reported performance due to calculation methodology differences.
Page 16

Montana Board of Investments
Domestic Equity ManagersComparative Performance
As of March 31, 2021
QTD/CYTD
FYTD1
Year3
Years5
Years7
Years10
Years2020 2019 2018 2017 2016
SinceIncep.
InceptionDate
Domestic Small Cap Equity
Vaughan Nelson Management (SA) - Net 12.65 50.88 75.58 10.88 11.44 9.12 10.29 9.83 25.34 -13.78 6.83 20.50 9.92 03/01/2007
Russell 2000 Val Index 21.17 65.72 97.05 11.57 13.56 8.93 10.06 4.63 22.39 -12.86 7.84 31.74 7.22
Difference -8.52 -14.84 -21.47 -0.69 -2.12 0.19 0.23 5.20 2.95 -0.92 -1.01 -11.24 2.70
Vaughan Nelson Management (SA) - Gross 12.85 51.68 76.82 11.69 12.28 9.96 11.17 10.64 26.25 -13.13 7.66 21.49 10.82 03/01/2007
IM U.S. Small Cap Value Equity (SA+CF) Median 18.86 59.27 92.55 11.17 13.22 9.42 11.11 5.19 25.07 -14.11 11.61 26.80 9.26
Rank 87 74 81 43 66 41 48 28 35 38 77 76 19
BlackRock MSCI US Sm Cap Equity Index (CF) - Net 12.83 53.58 95.13 15.61 N/A N/A N/A 18.93 27.30 -9.96 N/A N/A 15.24 07/01/2017
MSCI US Sm Cap Index (USD) (Net) 12.75 53.12 94.35 15.08 15.91 11.28 12.02 18.32 26.74 -10.40 16.75 19.15 14.70
Difference 0.08 0.46 0.78 0.53 N/A N/A N/A 0.61 0.56 0.44 N/A N/A 0.54
BlackRock MSCI US Sm Cap Equity Index (CF) - Gross 12.84 53.61 95.18 15.65 N/A N/A N/A 18.96 27.34 -9.93 N/A N/A 15.28 07/01/2017
DFA US Sm Cap Tr (CF) - Net 17.97 58.47 94.97 12.49 13.98 10.28 11.76 11.63 21.66 -12.27 11.86 24.42 12.57 03/01/2003
Russell 2000 Index 12.70 55.36 94.85 14.76 16.35 11.05 11.68 19.96 25.53 -11.01 14.65 21.31 12.06
Difference 5.27 3.11 0.12 -2.27 -2.37 -0.77 0.08 -8.33 -3.87 -1.26 -2.79 3.11 0.51
DFA US Sm Cap Tr (CF) - Gross 18.07 58.87 95.57 12.88 14.37 10.66 12.15 11.98 22.07 -11.95 12.25 24.85 12.90 03/01/2003
IM U.S. Small Cap Core Equity (SA+CF) Median 13.83 53.92 92.88 15.00 16.11 12.06 12.74 17.76 25.11 -10.69 15.13 20.77 13.41
Rank 23 29 40 68 78 75 66 73 73 64 72 21 61
iShares:Russ 2000 ETF (IWM) - Net 12.89 55.96 96.83 N/A N/A N/A N/A 20.90 25.52 N/A N/A N/A 15.20 05/01/2018
Russell 2000 Index 12.70 55.36 94.85 14.76 16.35 11.05 11.68 19.96 25.53 -11.01 14.65 21.31 14.87
Difference 0.19 0.60 1.98 N/A N/A N/A N/A 0.94 -0.01 N/A N/A N/A 0.33
Gross of fees performance is not available (N/A) for the following funds: SPDR S&P 500 ETF (SPY), iShares:Core S&P Md-Cp (IJH), and iShares:Russ 2000 ETF (IWM).
The current annual expense ratios for the SPDR S&P 500 ETF (SPY), iShares:Core S&P Md-Cp (IJH), and iShares:Russ 2000 ETF (IWM) are 0.09%, 0.05%, and 0.19%,respectively.
See the Addendum for custom index specification.
Net performance shown is net of all manager fees and expenses (Net-All). Gross returns are compared to median performance of similar managers. A peer group of similar managers may not exist for all funds. Fiscal year ends on 06/30. Since inception performance may vary from State Street reported performance due to calculation methodology differences.
Page 17

QTD/CYTD
FYTD1
Year3
Years5
Years7
Years10
Years2020 2019 2018 2017 2016
SinceIncep.
InceptionDate
International Developed Large Cap Equity
Acadian Asset Non-US Equity (SA) - Net 8.85 38.41 58.86 6.72 13.07 7.51 7.31 8.89 19.38 -13.44 34.76 12.40 4.45 11/01/2006
MSCI ACW Ex US Val Index (USD) (Net) 7.06 31.85 48.68 2.40 7.25 2.61 3.02 -0.77 15.72 -13.97 22.66 8.92 2.55
Difference 1.79 6.56 10.18 4.32 5.82 4.90 4.29 9.66 3.66 0.53 12.10 3.48 1.90
Acadian Asset Non-US Equity (SA) - Gross 8.99 38.93 59.65 7.27 13.65 8.07 7.88 9.45 19.98 -12.99 35.45 13.01 5.02 11/01/2006
IM ACWI Ex US Value (SA+CF) Median 6.26 34.87 57.35 7.01 10.67 5.68 6.13 6.65 21.34 -14.78 26.02 4.87 4.87
Rank 18 28 40 46 14 15 22 44 59 26 8 10 49
Lazard Asset Management (SA) - Net 1.93 28.79 48.03 5.40 7.98 N/A N/A 9.59 21.70 -14.32 27.00 0.22 5.28 06/01/2015
Lazard Custom Index 3.49 28.67 49.41 6.06 9.53 4.16 4.12 10.65 21.51 -15.55 22.66 8.92 5.08
Difference -1.56 0.12 -1.38 -0.66 -1.55 N/A N/A -1.06 0.19 1.23 4.34 -8.70 0.20
Lazard Asset Management (SA) - Gross 2.06 29.26 48.75 5.93 8.53 N/A N/A 10.14 22.31 -13.88 27.65 0.77 5.83 06/01/2015
IM ACWI Ex US Value (SA+CF) Median 6.26 34.87 57.35 7.01 10.67 5.68 6.13 6.65 21.34 -14.78 26.02 4.87 6.68
Rank 92 81 75 63 69 N/A N/A 42 43 35 38 86 67
BlackRock ACW Ex US SuperFund A (CF) - Net 3.56 28.76 49.66 6.78 10.00 5.48 5.14 10.81 21.77 -13.99 27.49 4.77 7.43 06/01/2009
MSCI ACW Ex US Index (USD) (Net) 3.49 28.67 49.41 6.51 9.76 5.26 4.93 10.65 21.51 -14.20 27.19 4.50 7.23
Difference 0.07 0.09 0.25 0.27 0.24 0.22 0.21 0.16 0.26 0.21 0.30 0.27 0.20
BlackRock ACW Ex US SuperFund A (CF) - Gross 3.58 28.83 49.77 6.85 10.08 5.56 5.22 10.89 21.85 -13.93 27.58 4.86 7.52 06/01/2009
IM All ACWI Ex US (SA+CF) Median 3.25 31.26 55.53 8.34 10.85 6.50 7.00 14.60 24.97 -14.64 28.74 2.12 9.20
Rank 45 66 73 64 63 70 91 60 66 43 62 25 86
iShares:MSCI EAFE ETF (EFA) - Net 3.99 25.82 45.38 5.97 N/A N/A N/A 7.71 22.03 -12.88 N/A N/A 7.21 07/01/2017
MSCI EAFE Index (USD) (Net) 3.48 25.84 44.57 6.02 8.85 4.80 5.52 7.82 22.01 -13.79 25.03 1.00 7.01
Difference 0.51 -0.02 0.81 -0.05 N/A N/A N/A -0.11 0.02 0.91 N/A N/A 0.20
Baillie Gifford (SA) - Net 0.88 34.25 69.11 14.87 14.72 N/A N/A 34.22 34.34 -17.35 31.99 0.73 11.18 06/01/2015
MSCI ACW Ex US Grth Index (USD) (Net) -0.08 25.40 49.36 10.31 12.03 7.74 6.69 22.20 27.34 -14.43 32.01 0.12 8.45
Difference 0.96 8.85 19.75 4.56 2.69 N/A N/A 12.02 7.00 -2.92 -0.02 0.61 2.73
Baillie Gifford (SA) - Gross 0.99 34.71 69.88 15.42 15.29 N/A N/A 34.86 34.99 -16.93 32.66 1.28 11.74 06/01/2015
IM ACWI Ex US Growth (SA+CF) Median 1.15 28.82 55.34 10.99 13.36 8.93 8.76 22.06 29.57 -13.78 32.56 -0.76 9.84
Rank 54 9 10 13 22 N/A N/A 12 9 85 49 33 22
Montana Board of Investments
International Equity ManagersComparative Performance
As of March 31, 2021
Net performance shown is net of all manager fees and expenses (Net-All). Gross returns are compared to median performance of similar managers. A peer group of similar managers may not exist for all funds. Fiscal year ends on 06/30. Since inception performance may vary from State Street reported performance due to calculation methodology differences. See the Addendum for custom index specification.
Page 18

Montana Board of Investments
International Equity ManagersComparative Performance
As of March 31, 2021
QTD/CYTD
FYTD1
Year3
Years5
Years7
Years10
Years2020 2019 2018 2017 2016
SinceIncep.
InceptionDate
Invesco (SA) - Net 2.95 28.64 51.98 9.61 9.73 N/A N/A 14.84 29.29 -15.17 24.92 0.32 7.05 06/01/2015
MSCI ACW Ex US Grth Index (USD) (Net) -0.08 25.40 49.36 10.31 12.03 7.74 6.69 22.20 27.34 -14.43 32.01 0.12 8.45
Difference 3.03 3.24 2.62 -0.70 -2.30 N/A N/A -7.36 1.95 -0.74 -7.09 0.20 -1.40
Invesco (SA) - Gross 3.09 29.19 52.84 10.26 10.40 N/A N/A 15.51 30.05 -14.64 25.70 1.01 7.72 06/01/2015
IM ACWI Ex US Growth (SA+CF) Median 1.15 28.82 55.34 10.99 13.36 8.93 8.76 22.06 29.57 -13.78 32.56 -0.76 9.84
Rank 14 49 68 63 79 N/A N/A 83 44 56 91 36 76
International Developed Small Cap Equity
American Century Investment Mgmt (SA) - Net 0.33 30.10 71.93 9.23 13.82 9.25 N/A 31.60 29.44 -20.76 43.80 -5.31 9.03 03/01/2014
MSCI ACW Ex US Sm Cap Grth Index (USD) (Net) 3.34 35.74 72.65 8.89 11.70 8.10 7.18 23.69 24.61 -18.27 33.64 -0.28 7.96
Difference -3.01 -5.64 -0.72 0.34 2.12 1.15 N/A 7.91 4.83 -2.49 10.16 -5.03 1.07
American Century Investment Mgmt (SA) - Gross 0.53 30.89 73.31 10.14 14.77 10.17 N/A 32.68 30.50 -20.09 44.99 -4.49 9.95 03/01/2014
IM ACWI Ex US Growth (SA+CF) Median 1.15 28.82 55.34 10.99 13.36 8.93 8.76 22.06 29.57 -13.78 32.56 -0.76 8.78
Rank 66 39 7 64 32 26 N/A 24 42 100 6 79 27
BlackRock MSCI ACW Ex US Sm Cap Index (CF) - Net 5.43 38.04 69.65 6.91 10.68 6.95 N/A 14.45 22.68 -17.85 31.96 4.26 8.78 02/01/2012
MSCI ACWI Ex US Sm Cap Index IMI (USD) (Net) 5.53 38.25 69.82 6.61 10.40 6.67 6.32 14.24 22.42 -18.20 31.65 3.91 8.55
Difference -0.10 -0.21 -0.17 0.30 0.28 0.28 N/A 0.21 0.26 0.35 0.31 0.35 0.23
BlackRock MSCI ACW Ex US Sm Cap Index (CF) - Gross 5.47 38.16 69.85 7.04 10.83 7.10 N/A 14.50 22.90 -17.74 32.15 4.44 8.94 02/01/2012
DFA Intl Sm Co;I (DFISX) - Net 5.82 36.90 65.64 5.12 9.68 6.14 6.88 9.24 24.21 -19.41 30.24 5.74 8.15 11/01/2004
MSCI Wrld Ex US Sm Cap Index (USD) (Net) 4.88 35.76 65.17 6.89 10.55 6.97 7.14 12.78 25.41 -18.07 31.04 4.32 7.94
Difference 0.94 1.14 0.47 -1.77 -0.87 -0.83 -0.26 -3.54 -1.20 -1.34 -0.80 1.42 0.21
Templeton Investment Counsel (SA) - Net 6.19 37.86 70.25 5.30 9.53 6.13 N/A 9.98 24.17 -18.48 33.07 -1.13 6.08 03/01/2014
Templeton Custom Index 5.53 38.25 69.82 6.36 10.36 6.09 6.05 14.24 22.42 -19.75 29.72 8.24 6.10
Difference 0.66 -0.39 0.43 -1.06 -0.83 0.04 N/A -4.26 1.75 1.27 3.35 -9.37 -0.02
Templeton Investment Counsel (SA) - Gross 6.41 38.71 71.63 6.18 10.47 7.05 N/A 10.91 25.20 -17.78 34.21 -0.23 7.00 03/01/2014
IM ACWI Ex US Value (SA+CF) Median 6.26 34.87 57.35 7.01 10.67 5.68 6.13 6.65 21.34 -14.78 26.02 4.87 5.75
Rank 49 28 13 62 54 26 N/A 36 26 84 8 89 25
Net performance shown is net of all manager fees and expenses (Net-All). Gross returns are compared to median performance of similar managers. A peer group of similar managers may not exist for all funds. Fiscal year ends on 06/30. Since inception performance may vary from State Street reported performance due to calculation methodology differences. See the Addendum for custom index specification.
Page 19
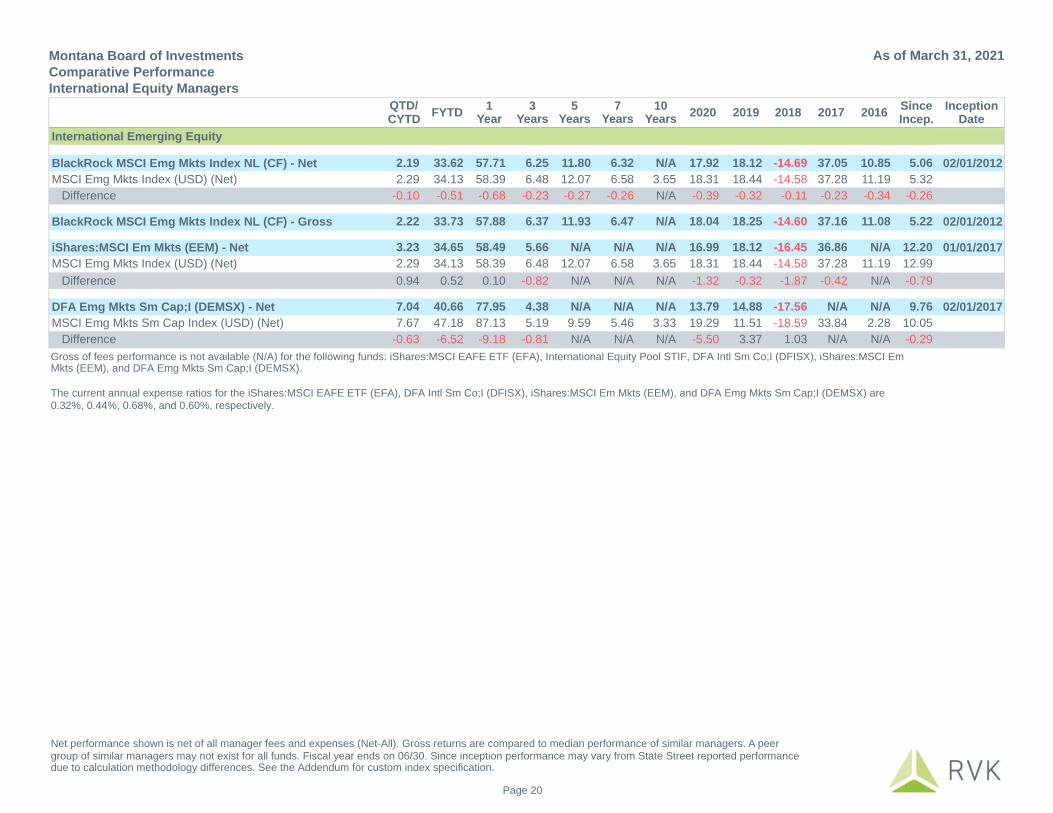
Montana Board of Investments
International Equity ManagersComparative Performance
As of March 31, 2021
QTD/CYTD
FYTD1
Year3
Years5
Years7
Years10
Years2020 2019 2018 2017 2016
SinceIncep.
InceptionDate
International Emerging Equity
BlackRock MSCI Emg Mkts Index NL (CF) - Net 2.19 33.62 57.71 6.25 11.80 6.32 N/A 17.92 18.12 -14.69 37.05 10.85 5.06 02/01/2012
MSCI Emg Mkts Index (USD) (Net) 2.29 34.13 58.39 6.48 12.07 6.58 3.65 18.31 18.44 -14.58 37.28 11.19 5.32
Difference -0.10 -0.51 -0.68 -0.23 -0.27 -0.26 N/A -0.39 -0.32 -0.11 -0.23 -0.34 -0.26
BlackRock MSCI Emg Mkts Index NL (CF) - Gross 2.22 33.73 57.88 6.37 11.93 6.47 N/A 18.04 18.25 -14.60 37.16 11.08 5.22 02/01/2012
iShares:MSCI Em Mkts (EEM) - Net 3.23 34.65 58.49 5.66 N/A N/A N/A 16.99 18.12 -16.45 36.86 N/A 12.20 01/01/2017
MSCI Emg Mkts Index (USD) (Net) 2.29 34.13 58.39 6.48 12.07 6.58 3.65 18.31 18.44 -14.58 37.28 11.19 12.99
Difference 0.94 0.52 0.10 -0.82 N/A N/A N/A -1.32 -0.32 -1.87 -0.42 N/A -0.79
DFA Emg Mkts Sm Cap;I (DEMSX) - Net 7.04 40.66 77.95 4.38 N/A N/A N/A 13.79 14.88 -17.56 N/A N/A 9.76 02/01/2017
MSCI Emg Mkts Sm Cap Index (USD) (Net) 7.67 47.18 87.13 5.19 9.59 5.46 3.33 19.29 11.51 -18.59 33.84 2.28 10.05
Difference -0.63 -6.52 -9.18 -0.81 N/A N/A N/A -5.50 3.37 1.03 N/A N/A -0.29
Gross of fees performance is not available (N/A) for the following funds: iShares:MSCI EAFE ETF (EFA), International Equity Pool STIF, DFA Intl Sm Co;I (DFISX), iShares:MSCI EmMkts (EEM), and DFA Emg Mkts Sm Cap;I (DEMSX).
The current annual expense ratios for the iShares:MSCI EAFE ETF (EFA), DFA Intl Sm Co;I (DFISX), iShares:MSCI Em Mkts (EEM), and DFA Emg Mkts Sm Cap;I (DEMSX) are0.32%, 0.44%, 0.68%, and 0.60%, respectively.
Net performance shown is net of all manager fees and expenses (Net-All). Gross returns are compared to median performance of similar managers. A peer group of similar managers may not exist for all funds. Fiscal year ends on 06/30. Since inception performance may vary from State Street reported performance due to calculation methodology differences. See the Addendum for custom index specification.
Page 20

QTD/CYTD
FYTD1
Year3
Years5
Years7
Years10
Years2020 2019 2018 2017 2016
SinceIncep.
InceptionDate
US Fixed Income Aggregate - Net -3.30 -2.32 0.76 N/A N/A N/A N/A 7.65 N/A N/A N/A N/A 3.01 12/01/2019
Bloomberg US Agg Bond Index -3.38 -2.13 0.71 4.65 3.10 3.31 3.44 7.51 8.72 0.01 3.54 2.65 2.84
Difference 0.08 -0.19 0.05 N/A N/A N/A N/A 0.14 N/A N/A N/A N/A 0.17
Reams Asset Core Plus (SA) - Net -3.39 0.30 8.45 7.78 5.09 4.61 4.82 17.14 8.08 1.31 3.21 4.18 5.99 10/01/2008
Reams Custom Index -3.05 -0.83 2.95 4.79 3.49 3.50 3.72 7.58 8.72 0.01 3.83 3.91 4.50
Difference -0.34 1.13 5.50 2.99 1.60 1.11 1.10 9.56 -0.64 1.30 -0.62 0.27 1.49
Reams Asset Core Plus (SA) - Gross -3.34 0.44 8.65 7.97 5.28 4.79 5.00 17.35 8.28 1.49 3.38 4.35 6.18 10/01/2008
IM U.S. Broad Market Core+ FI (SA+CF) Median -2.74 0.87 7.02 5.75 4.49 4.17 4.50 8.95 9.88 -0.25 4.79 4.68 5.73
Rank 88 62 32 2 21 17 26 1 93 4 95 58 31
Montana Board of Investments
Core Fixed Income ManagersComparative Performance
As of March 31, 2021
Net performance shown is net of all manager fees and expenses (Net-All). Gross returns are compared to median performance of similar managers. Fiscal year ends on 06/30. Since inception performance may vary from State Street reported performance due to calculation methodology differences.
Page 21

QTD/CYTD
FYTD1
Year3
Years5
Years7
Years10
Years2020 2019 2018 2017 2016
SinceIncep.
InceptionDate
Neuberger Berman High Yield (SA) - Net 0.64 11.64 21.82 6.42 6.93 4.68 5.83 6.30 13.75 -1.99 5.80 14.98 6.99 01/01/2010
Bloomberg US HY 2% Issuer Cap Index 0.86 12.27 23.65 6.82 8.04 5.42 6.47 7.05 14.32 -2.08 7.50 17.13 7.41
Difference -0.22 -0.63 -1.83 -0.40 -1.11 -0.74 -0.64 -0.75 -0.57 0.09 -1.70 -2.15 -0.42
Neuberger Berman High Yield (SA) - Gross 0.74 11.97 22.32 6.88 7.40 5.14 6.30 6.75 14.26 -1.56 6.27 15.50 7.47 01/01/2010
IM U.S. High Yield Bonds (SA+CF) Median 0.99 12.06 22.49 6.71 7.80 5.37 6.51 6.52 14.25 -1.64 7.49 14.07 7.49
Rank 69 51 52 41 61 64 61 43 50 49 79 33 52
Oaktree US High Yield (SA) (CAPP) - Net 0.44 11.34 21.72 6.48 N/A N/A N/A 6.56 15.44 -3.99 N/A N/A 5.40 01/01/2018
Bloomberg US HY 2% Issuer Cap Index 0.86 12.27 23.65 6.82 8.04 5.42 6.47 7.05 14.32 -2.08 7.50 17.13 6.00
Difference -0.42 -0.93 -1.93 -0.34 N/A N/A N/A -0.49 1.12 -1.91 N/A N/A -0.60
Oaktree US High Yield (SA) (CAPP) - Gross 0.56 11.75 22.29 7.00 N/A N/A N/A 7.07 16.02 -3.47 N/A N/A 5.92 01/01/2018
IM U.S. High Yield Bonds (SA+CF) Median 0.99 12.06 22.49 6.71 7.80 5.37 6.51 6.52 14.25 -1.66 7.49 14.07 5.93
Rank 74 53 53 35 N/A N/A N/A 39 16 92 N/A N/A 52
Shenkman High Yield Fixed Income (SA) (CAPP) - Net 0.37 10.24 19.84 6.28 N/A N/A N/A 6.32 13.65 -1.96 N/A N/A 5.21 12/01/2017
Bloomberg US HY 2% Issuer Cap Index 0.86 12.27 23.65 6.82 8.04 5.42 6.47 7.05 14.32 -2.08 7.50 17.13 5.94
Difference -0.49 -2.03 -3.81 -0.54 N/A N/A N/A -0.73 -0.67 0.12 N/A N/A -0.73
Shenkman High Yield Fixed Income (SA) (CAPP) - Gross 0.49 10.62 20.39 6.78 N/A N/A N/A 6.82 14.18 -1.46 N/A N/A 5.71 12/01/2017
IM U.S. High Yield Bonds (SA+CF) Median 0.99 12.06 22.49 6.71 7.80 5.37 6.51 6.52 14.25 -1.66 7.49 14.07 5.90
Rank 78 67 68 46 N/A N/A N/A 43 52 46 N/A N/A 60
Cohen & Steers Preferred Securities (SA) - Net -0.26 N/A N/A N/A N/A N/A N/A N/A N/A N/A N/A N/A 4.35 11/01/2020
Cohen & Steers Preferred Securities Custom Benchmark -0.52 N/A N/A N/A N/A N/A N/A N/A N/A N/A N/A N/A 3.54
Difference 0.26 N/A N/A N/A N/A N/A N/A N/A N/A N/A N/A N/A 0.81
Cohen & Steers Preferred Securities (SA) - Gross -0.17 N/A N/A N/A N/A N/A N/A N/A N/A N/A N/A N/A 4.51 11/01/2020
Payden & Rygel EMD (SA) - Net -5.27 N/A N/A N/A N/A N/A N/A N/A N/A N/A N/A N/A -5.27 01/01/2021
Payden & Rygel EMD Custom Benchmark -5.18 N/A N/A N/A N/A N/A N/A N/A N/A N/A N/A N/A -5.18
Difference -0.09 N/A N/A N/A N/A N/A N/A N/A N/A N/A N/A N/A -0.09
Payden & Rygel EMD (SA) - Gross -5.18 N/A N/A N/A N/A N/A N/A N/A N/A N/A N/A N/A -5.18 01/01/2021
IM Emerging Markets Debt (SA+CF) Median -4.55 5.62 19.05 3.52 5.56 4.60 5.17 6.71 14.24 -5.33 12.43 11.04 -4.55
Rank 67 N/A N/A N/A N/A N/A N/A N/A N/A N/A N/A N/A 67
Montana Board of Investments
Non-Core Fixed Income ManagersComparative Performance
As of March 31, 2021
Net performance shown is net of all manager fees and expenses (Net-All). Gross returns are compared to median performance of similar managers. Fiscal year ends on 06/30. Since inception performance may vary from State Street reported performance due to calculation methodology differences. No peer group is shown for Cohen & Steers Preferred Securities (SA) due to the lack of suitable Preferred Securities peer groups.
Page 22

QTD/CYTD
FYTD1
Year3
Years5
Years7
Years10
Years2020 2019 2018 2017 2016
SinceIncep.
InceptionDate
Trust Funds Investment Pool Fixed Income -2.91 -0.68 3.22 5.42 3.73 3.96 4.20 8.84 9.12 0.25 3.83 3.44 5.90 10/01/1995
Bloomberg US Agg Bond Index -3.38 -2.13 0.71 4.65 3.10 3.31 3.44 7.51 8.72 0.01 3.54 2.65 5.08
Difference 0.47 1.45 2.51 0.77 0.63 0.65 0.76 1.33 0.40 0.24 0.29 0.79 0.82
Trust Funds Investment Pool Fixed Income -2.91 -0.68 3.22 5.42 3.73 3.96 4.20 8.84 9.12 0.25 3.83 3.44 5.90 10/01/1995
IM U.S. Broad Market Core Fixed Income (SA+CF) Median -3.18 -0.97 3.43 5.27 3.76 3.82 3.98 8.54 9.19 0.07 4.03 3.10 5.47
Rank 30 40 52 39 53 40 33 37 55 32 62 42 11
Shenkman High Yield Fixed Income (SA) (TFIP) - Net 0.37 10.22 19.71 N/A N/A N/A N/A 6.05 N/A N/A N/A N/A 5.97 07/01/2019
Bloomberg US HY 2% Issuer Cap Index 0.86 12.27 23.65 6.82 8.04 5.42 6.47 7.05 14.32 -2.08 7.50 17.13 6.83
Difference -0.49 -2.05 -3.94 N/A N/A N/A N/A -1.00 N/A N/A N/A N/A -0.86
Shenkman High Yield Fixed Income (SA) (TFIP) - Gross 0.49 10.61 20.25 N/A N/A N/A N/A 6.54 N/A N/A N/A N/A 6.46 07/01/2019
IM U.S. High Yield Bonds (SA+CF) Median 0.99 12.06 22.49 6.71 7.80 5.37 6.51 6.52 14.25 -1.66 7.49 14.07 6.81
Rank 78 67 69 N/A N/A N/A N/A 49 N/A N/A N/A N/A 64
Oaktree US High Yield (SA) (TFIP) - Net 0.59 11.46 22.14 N/A N/A N/A N/A 6.72 N/A N/A N/A N/A 6.94 08/01/2019
Bloomberg US HY 2% Issuer Cap Index 0.86 12.27 23.65 6.82 8.04 5.42 6.47 7.05 14.32 -2.08 7.50 17.13 6.83
Difference -0.27 -0.81 -1.51 N/A N/A N/A N/A -0.33 N/A N/A N/A N/A 0.11
Oaktree US High Yield (SA) (TFIP) - Gross 0.71 11.87 22.72 N/A N/A N/A N/A 7.25 N/A N/A N/A N/A 7.46 08/01/2019
IM U.S. High Yield Bonds (SA+CF) Median 0.99 12.06 22.49 6.71 7.80 5.37 6.51 6.52 14.25 -1.66 7.49 14.07 6.83
Rank 69 52 47 N/A N/A N/A N/A 36 N/A N/A N/A N/A 33
Neuberger Berman High Yield (SA) (TFIP) - Net 0.58 11.77 20.67 N/A N/A N/A N/A N/A N/A N/A N/A N/A 20.67 04/01/2020
Bloomberg US HY 2% Issuer Cap Index 0.86 12.27 23.65 6.82 8.04 5.42 6.47 7.05 14.32 -2.08 7.50 17.13 23.65
Difference -0.28 -0.50 -2.98 N/A N/A N/A N/A N/A N/A N/A N/A N/A -2.98
Neuberger Berman High Yield (SA) (TFIP) - Gross 0.68 12.13 21.16 N/A N/A N/A N/A N/A N/A N/A N/A N/A 21.16 04/01/2020
IM U.S. High Yield Bonds (SA+CF) Median 0.99 12.06 22.49 6.71 7.80 5.37 6.51 6.52 14.25 -1.66 7.49 14.07 22.49
Rank 70 49 61 N/A N/A N/A N/A N/A N/A N/A N/A N/A 61
Montana Board of Investments
TFIP Fixed Income ManagersComparative Performance
As of March 31, 2021
Net performance shown is net of all manager fees and expenses (Net-All). Gross returns are compared to median performance of similar managers. Fiscal year ends on 06/30. Since inception performance may vary from State Street reported performance due to calculation methodology differences.
Page 23

QTD/CYTD
FYTD1
Year3
Years5
Years7
Years10
Years2020 2019 2018 2017 2016
SinceIncep.
InceptionDate
Abandoned Mine Trust 0.04 0.19 0.38 1.61 1.30 1.31 1.40 0.73 2.41 1.85 1.04 1.10 3.84 12/01/1993
Barker Hughesville St Response -2.11 -0.55 N/A N/A N/A N/A N/A N/A N/A N/A N/A N/A 0.28 05/01/2020
Belt Water Treatment Plant Fund -2.06 -0.44 2.90 4.97 N/A N/A N/A 6.80 8.56 N/A N/A N/A 4.90 03/01/2018
Big Sky Economic Development Fund -2.20 -0.50 2.99 4.97 3.69 4.01 4.34 7.12 8.67 0.48 3.97 3.98 4.87 07/01/2005
Butte Area One Restoration -1.81 -0.40 2.58 4.24 3.11 3.03 2.97 6.07 6.76 1.24 2.92 2.60 3.38 11/01/2008
Clark Fork River Restoration -1.76 -0.38 2.36 4.12 3.03 3.08 3.15 5.65 7.04 0.96 2.85 2.72 3.66 11/01/2008
Coal Tax Cultural Trust Fund -2.14 -0.46 2.98 4.94 3.67 3.99 4.33 6.99 8.64 0.47 3.96 3.95 5.95 12/01/1993
Coal Tax Park Acquisition -2.08 -0.44 2.93 4.92 3.65 3.96 4.30 6.86 8.63 0.48 3.96 3.90 5.92 12/01/1993
East Helena Compensation Fund -0.34 0.09 1.10 3.13 2.43 2.37 N/A 2.65 5.52 1.20 2.56 2.12 2.11 01/01/2013
East Helena Greenway Trail Maintenance N/A N/A N/A N/A N/A N/A N/A N/A N/A N/A N/A N/A 0.00 03/01/2021
Endowment for Children -2.17 -0.46 2.96 4.90 3.62 3.90 4.24 7.01 8.54 0.46 3.89 3.66 4.90 08/01/2007
Flying J CECRA Facilities Fund -2.10 -0.45 N/A N/A N/A N/A N/A N/A N/A N/A N/A N/A 0.35 05/01/2020
FWP License Account -1.05 -0.48 0.17 1.87 1.42 1.22 1.17 1.85 3.33 1.50 1.11 0.84 2.86 11/01/1997
FWP Mitigation Trust Fund -1.55 -0.50 1.22 3.09 1.99 1.78 1.73 3.84 5.46 1.14 1.15 0.67 3.83 12/01/1993
FWP Real Property Trust -2.08 -0.45 2.90 4.91 3.62 3.90 4.20 6.83 8.62 0.51 3.80 3.82 5.33 12/01/1993
Group Benefits -0.33 0.11 0.94 2.43 1.72 1.64 1.55 2.05 4.01 1.37 1.30 1.16 3.80 12/01/1993
Harold Hamm Endowment -2.04 -0.44 2.86 4.83 N/A N/A N/A 6.71 8.45 0.57 1.11 N/A 3.11 07/01/2016
Invasive Species Trust Fund -1.94 N/A N/A N/A N/A N/A N/A N/A N/A N/A N/A N/A -1.20 10/01/2020
Libby Asbestos Site State Cost -2.08 -0.46 N/A N/A N/A N/A N/A N/A N/A N/A N/A N/A 0.34 05/01/2020
Luttrell Pit - Operational & Maintenance -2.10 -0.58 N/A N/A N/A N/A N/A N/A N/A N/A N/A N/A 0.23 05/01/2020
Montana Pole -1.64 -0.32 2.32 4.29 3.21 3.41 3.64 5.61 7.48 0.74 3.38 3.23 5.05 09/01/1996
Montana State University -0.12 0.19 0.68 1.89 1.57 1.32 1.17 1.30 2.87 1.87 1.39 0.95 1.98 08/01/2004
Montana Tech-UM Agency Funds -0.06 0.16 0.50 1.70 1.42 1.12 0.92 1.01 2.56 1.91 1.22 0.72 1.77 03/01/2003
MT BOI - Clark Fork Site -2.10 -0.49 2.78 4.64 3.46 3.63 3.74 6.65 8.00 0.67 3.64 3.63 4.29 11/01/2008
MT BOI UOFM Other -0.65 0.46 1.85 3.00 2.34 2.31 2.10 3.47 4.54 1.42 2.15 2.34 2.95 08/01/2002
MUS Group Insurance -0.29 0.09 0.76 2.13 1.65 1.63 N/A 1.70 3.39 1.96 1.09 1.33 1.43 10/01/2011
MUS Workers Compensation -0.58 0.02 1.16 2.66 2.01 N/A N/A 2.55 4.43 1.62 1.80 N/A 2.01 04/01/2016
Montana Board of Investments
Trust AccountsComparative Performance
As of March 31, 2021
Performance shown is gross of fees. Fiscal year ends on 06/30. Since inception performance may vary from State Street reported performance due to calculation methodology differences.
Page 24

Montana Board of Investments
Trust AccountsComparative Performance
As of March 31, 2021
QTD/CYTD
FYTD1
Year3
Years5
Years7
Years10
Years2020 2019 2018 2017 2016
SinceIncep.
InceptionDate
Older Montanans Trust -2.18 -0.50 2.93 4.98 3.68 3.96 4.01 7.19 8.62 0.49 3.87 3.86 4.75 08/01/2007
Permanent Coal Trust Excl Crp -1.21 0.23 2.90 4.29 3.41 3.71 4.10 5.57 6.81 1.28 3.49 3.79 5.64 12/01/1993
PERS Defined Cont Disability 3.08 20.74 37.52 10.85 9.83 N/A N/A 14.06 20.77 -4.88 14.57 3.42 8.81 09/01/2015
Potter Trust Fund -2.09 -0.45 2.87 4.84 N/A N/A N/A 6.78 8.47 0.51 3.87 N/A 3.58 06/01/2016
Resource Indemnity Trust -2.24 -0.51 3.04 5.06 3.74 4.07 4.40 7.23 8.88 0.44 4.01 4.02 6.03 12/01/1993
School Facilities Fund -2.17 -0.49 2.92 4.51 N/A N/A N/A 6.97 7.88 -0.13 N/A N/A 3.76 01/01/2018
Smelter Hill Up Restorative -1.89 -0.45 2.30 3.65 2.63 2.43 2.27 5.62 5.64 1.57 1.85 1.79 2.38 11/01/2008
State Fund Insurance -0.54 3.49 9.04 5.93 4.62 4.45 4.69 7.62 9.65 0.38 5.05 3.50 5.62 12/01/1993
Streamside Tailings Operable Unit -1.88 -0.31 2.85 4.61 3.44 3.71 3.98 6.47 7.92 0.57 3.69 3.58 5.26 02/01/1999
Subsequent Injury Fund 0.04 0.19 0.38 1.55 1.32 1.00 0.78 0.73 2.28 1.98 1.11 0.61 2.96 12/01/1993
Tobacco Trust Fund -2.14 -0.43 3.06 4.98 3.68 4.02 4.36 7.10 8.67 0.46 3.96 3.99 5.54 01/01/2001
Treasurers 0.04 0.16 0.27 1.51 1.29 1.01 0.79 0.63 2.28 1.97 1.07 0.68 2.80 12/01/1993
Treasure State Endowment -2.22 -0.50 2.93 5.02 3.72 4.04 4.37 7.15 8.81 0.46 4.00 3.98 5.90 12/01/1993
Treasure State Reg. Water System -2.22 -0.50 3.01 5.02 3.72 4.03 4.36 7.15 8.80 0.45 4.00 3.96 5.69 06/01/2000
Trust and Legacy Account -2.23 -0.50 3.04 5.04 3.72 4.06 4.38 7.19 8.84 0.43 4.00 4.01 6.60 07/01/1991
UCFRB Assess/Litig Cost Rec -2.14 -0.55 2.72 4.79 3.55 3.83 4.07 6.68 8.50 0.49 3.77 3.84 5.60 07/01/1999
UCFRB Restoration Fund -2.15 -0.50 2.86 4.90 3.59 3.83 4.14 6.90 8.52 0.67 3.73 3.52 5.52 06/01/1999
Upper Blackfoot Response -0.20 0.11 0.62 2.39 1.90 1.81 1.69 1.55 4.24 1.49 1.90 1.74 1.62 09/01/2010
Weed Control Trust -2.24 -0.51 3.04 5.06 3.74 4.07 4.32 7.23 8.88 0.44 4.01 4.02 5.21 12/01/1993
Wildlife Habitat Trust -2.04 -0.42 2.89 4.87 3.59 3.87 4.18 6.75 8.54 0.51 3.78 3.79 5.33 12/01/1993
Zortman/Landusky LT H20 0.04 0.19 0.38 1.55 1.32 1.32 2.58 0.73 2.28 1.98 1.01 1.36 6.21 09/01/1999
Z/L Long Term H20 Trust Fund 0.04 0.19 0.38 1.55 1.33 1.41 2.47 0.73 2.28 1.98 1.08 1.39 4.09 09/01/2005
Performance shown is gross of fees. Fiscal year ends on 06/30. Since inception performance may vary from State Street reported performance due to calculation methodology differences.
Page 25

Performance NotesAll gross and net performance data is provided by State Street Analytics (SSA). Reported gross returns for the retirement plans prior to 07/01/2002 are net of all fees.Gross performance for the retirement plans is calculated with fee accruals provided by Montana's Accounting department.
Gross of fees performance is not available (N/A) for the following funds: SPDR S&P 500 ETF (SPY), Domestic Equity Pool STIF,iShares:Core S&P Md-Cp (IJH), iShares:Russ 2000 ETF (IWM), DFA Intl Sm Co;I (DFISX), iShares:MSCI EAFE ETF (EFA),International Equity Pool STIF, iShares:MSCI Em Mkts (EEM), and DFA Emg Mkts Sm Cap;I (DEMSX). The current annual expenseratios are as listed below.
Index Notes
Retirement plan custom benchmarks are provided by State Street Bank and are calculated daily using actual allocations.
The CAPP Custom Benchmark consists of the portfolio weighted average of the primary benchmark for each CAPP asset class.The Short Term Custom Benchmark consists of 100% ICE 1 Mo LIBOR Index (USD) through 4/30/2018, and 100% Federal ReserveUS Treasury 1 Mo Constant Maturity Index thereafter.The Domestic Equity Custom Index consists of 100% S&P 1500 Comp Index through 04/30/2017 and 100% MSCI USA IM Index(USD) (Gross) thereafter.The International Equity Custom Index consists of 100% MSCI EAFE Index (USD) (Net) through 10/31/2006, 100% MSCI ACW ExUS Index (USD) (Net) through 06/30/2007, 92.5% MSCI ACW Ex US Index (USD) (Net) and 7.5% MSCI ACW Ex US SC IM Index(USD) (Net) through 02/28/2014, and 100% MSCI ACW Ex-US IM Index thereafter.
The Real Estate Custom Index consists of 100% NCREIF ODCE Index (AWA) (Net) (1 Qtr Lag) through 03/31/2017, 100% MSCI USREIT Index (USD) (Gross) through 06/30/2020, and 100% NCREIF ODCE Value Weighted (1 Qtr Lag) Index thereafter.
The Private Investments Custom Index consists of 100% S&P 1500 Comp Index+4% (1 Qtr Lag) through 03/31/2017, 100% MSCIUS Small Cap Index (USD) (Gross) through 12/31/2020, and the portfolio weighted MSCI US SC / S&P LSTA US Leverage Loan100 Index for PE / PC thereafter.The Lazard Custom Index consists of 100% MSCI ACW Ex US Value Index (USD) (Net) through 6/30/2018 and 100% MSCI ACWEx US Index (USD) (Net) thereafter.
The Templeton Custom Index consists of 100% MSCI ACW Ex US Small Cap Value Index (USD) (Net) through 5/31/2018, and100% MSCI ACW Ex US Small Cap Index (USD) (Net) thereafter.
The Reams Custom Index consists of 100% Bloomberg US Unv Bond Index through 03/31/2017, 100% Bloomberg US Agg BondIndex through 12/31/2019, and 100% Bloomberg US Unv Bond Index thereafter.
The Cohen & Steers Custom Index consists of 60% ICE BofAML US IG Institutional Capital Securities Index, 20% ICE BofAML CoreFixed Rate Preferred Securities Index, and 20% Bloomberg Barclays Developed Market USD Contingent Capital Index.
The Payden & Rygel Custom Index consists of 70% JP Morgan EMBl Global Diversified Index, 30% JP Morgan GBl-EM GlobalDiversified Index.
The JPM US Equity Custom Benchmark consists of 100% S&P 500 Index (Cap Weighted) through 06/30/2019 and 100% MSCI USIndex (USD) (Gross) thereafter.
The Real Assets Custom Index consists of 100% MSCI All Country World Commodity Producers Index (USD) (Net) through12/31/2020 and 33.33% MSCI All Country World Commodity Producers Index (USD) (Net), 33.33% MSCI All Country WorldInfrastructure Index, 33.33% Bloomberg Barclays Global Inflation Linked US TIPS Index thereafter.
Trust Accounts CommentsBarker Hughesville St Response, Libby Asbestos Site State Cost, Flying J CECRA Facilities Fund, and Luttrell Pit - Operations andMaintenance were added in 05/2020.The Belt Water Treatment Plant Fund was added in 03/2018.
The School Facilities Fund was added in 01/2018.
The Potter Trust Fund and the Harold Hamm Endowment were added in 06/2016.
MUS Workers Compensation was added in 04/2016.The Invasive Species Trust Fund was added in 10/2020.
The East Helena Greenway Trail Maintenance Fund was added in 03/2021.
Manager Transition CommentsNeuberger Berman High Yield (SA) and TFIP Private Real Estate were funded in the Trust Fund Investment Pool during Q1 2020.
Post High Yield Plus (SA), GMO:Bchmk-Fr All;III (GBMFX), and PIMCO:All Asset;Inst (PAAIX) were liquidated during Q3 2019.
Oaktree US High Yield Fixed Income (SA) and Shenkman High Yield Fixed Income (SA) were funded in the Trust Fund InvestmentPool during Q3 2019.
Artisan Partners (SA), Iridian Asset Management (SA), Congress Mid Cap Growth (SA), TimeSquare Capital Management (SA), and Alliance Bernstein (SA) were liquidated in Q2 2019.
BlackRock MSCI US Equity Index (CF) was transitioned into a separately managed account during Q1 2019.
Northern Trust MSCI US Equity Index (SA), GMO:Bchmk-Fr All;III (GBMFX), and PIMCO:All Asset;Inst (PAAIX) were funded duringQ4 2018.
Voya Investment Management (SA) was liquidated in 07/2018.
iShares:Russ 2000 ETF (IWM) was funded in 04/2018.
Montana Board of InvestmentsAddendum
As of March 31, 2021
Page 26

Montana Board of InvestmentsAddendum
As of March 31, 2021
Jacobs Levy 130/30 Large Cap (SA) was funded in 03/2018.Congress Mid Cap Growth (SA) was funded in 02/2018.
Oaktree US High Yield (SA) and Shenkman High Yield Fixed Income (SA) were funded in 12/2017.
Analytic Investors 130/30 (SA) was liquidated in 09/2017.
BlackRock MSCI US Equity Index (CF), BlackRock MSCI US Sm Cap Equity Index (CF), and iShares:Core S&P Md-Cp (IJH) werefunded in 06/2017.
SPDR S&P 500 ETF (SPY) and iShares:MSCI EAFE ETF (EFA) were re-funded in 06/2017.INTECH Enhanced Plus was liquidated in 06/2017.
Residual assets from the liquidation of AllianceBernstein Int'l Value (SA), Martin Currie (SA), Hansberger Global Investors (SA), andAberdeen Total Return Bond Strategy (SA) were distributed in 06/2017.BlackRock Equity Index Fund A (CF) and BlackRock Mid Cap Equity Index A (CF) were liquidated in 05/2017.
Manager Transition Comments (cont.)
DFA Emg Mkts Sm Cap;I (DEMSX) was funded in 02/2017.SPDR S&P 500 ETF (SPY) was liquidated in 01/2017.
iShares:MSCI Em Mkts (EEM) was funded in 12/2016.
SPDR S&P 500 ETF (SPY) was initially funded in 09/2015, was then liquidated in 12/2015, and was re-funded in 10/2016.
Wells Capital Management (SA), Domestic Equity Pool SPIF, and International Equity Pool SPIF were liquidated in 10/2016. WellsCapital Management (SA) residual assets from liquidation were distributed in 03/2017.
Nicholas Investment Partners was liquidated in 07/2016. Residual assets from liquidation were distributed in 03/2017.Effective 07/2016, the Metropolitan West Capital Management legal entity merged into the Wells Capital Management Incorporatedlegal entity. The Metropolitan West Capital Mgmt (SA) has been updated to Wells Capital Management (SA) to reflect the change.iShares S&P SmallCap 600 Index ETF (IJR) was liquidated in 01/2016.
Effective 05/2014, ING rebranded to Voya. The ING Investment Management (SA) has been updated to Voya InvestmentManagement (SA) to reflect the change.Cohen & Steers Preferred Securities (SA) was funded in 10/2020.
Payden & Rygel EMD (SA) was funded in 12/2020.
Miscellaneous CommentsFiscal year ends on 06/30.
During Q4 2019 Diversifying Strategies investments were liquidated and Investment Grade Credit, US Treasury & Agency, and TIPSwere consolidated into the Core Fixed Income composite.
Non-Core Fixed Income currently consists of High Yield and EMD.Private Investments currently consist of Private Equity, Private Credit, Venture Capital, and Passive ETFs.
During Q1 2021 the Natural Resources PAC was renamed to the Real Assets PAC.
Page 27

Disclaimer of Warranties and Limitation of Liability - This document was prepared by RVK, Inc. (RVK) and may include information and data from some or all of the following sources: client staff; custodian banks; investment managers; specialty investment consultants; actuaries; plan administrators/record-keepers; index providers; as well as other third-party sources as directed by the client or as we believe necessary or appropriate. RVK has taken reasonable care to ensure the accuracy of the information or data, but makes no warranties and disclaims responsibility for the accuracy or completeness of information or data provided or methodologies employed by any external source. This document is provided for the client’s internal use only and does not constitute a recommendation by RVK or an offer of, or a solicitation for, any particular security and it is not intended to convey any guarantees as to the future performance of the investment products, asset classes, or capital markets.

Investment Update
Board Meeting: June 1-2, 2021
Information as of: March 31, 2021

THIS PAGE INTENTIONALLY LEFT BLANK

March 31, 2021 3
Table of Contents
CIO Update 4
Macro Attribution 16
Private Investments 19
Real Estate 22
Real Assets 25
Core Fixed Income 28
Non-Core Fixed Income 32
Domestic Equity 35
International Equity 41
STIP, State Fund & Trust FundSTIP 47State Fund 49Trust Funds Investment Pool 51
Appendix 54

CIO Update Retirement Plans Net Performance
• Dollar Value Added – The total dollar return of the portfolio including income and capital gains.
• Net Cash Need - The total dollar amount distributed from portfolio assets to meet the deficit of contributions minus distributions. • A red bar indicates an aggregate net outflow by all plans even though some plans
may have experienced net inflows.• Though aggregates are shown, each plan is independent and not able to rely on
other plans to meet their respective liabilities.
4March 31, 2021
* Dollar values are in $1,000,000

March 31, 2021
* Dollar values are in $1,000,000
3/31/2020 (NAV) 3/31/2021 (NAV) Dollar Change Net Cash Flow Dollar Value Add
Domestic Equity 3,126.7 4,326.1 1,199.4 (682.7) 1,882.1
International Equity 1,693.0 2,538.8 845.8 (62.1) 907.9
Private Investments 1,585.9 1,893.5 307.6 8.6 299.0
Real Assets 359.5 575.6 216.1 169.2 46.9
Real Estate 952.9 1,243.6 290.7 228.9 61.8
Core Fixed Income 2,407.5 2,051.6 (356.0) (401.1) 45.2
Non-Core Fixed Income 404.5 795.0 390.5 300.1 90.3
Cash Equivalents 204.0 203.3 (0.7) (1.4) 0.7
Pension STIP 105.3 139.5 34.2 33.5 0.6
Grand Total 10,839.3 13,766.9 2,927.6 (406.9) 3,334.5
(1,000) (500) - 500 1,000 1,500 2,000 2,500
Pension STIP
Cash Equivalents
Non-Core Fixed Income
Core Fixed Income
Real Estate
Natural Resources
Private Investments
International Equity
Domestic Equity
Dollar Value Add Net Cash Flow Dollar Change
CIO Update Retirement Plans Net Performance
5

March 31, 2021
* Dollar values are in $1,000,000
3/31/2020 (NAV) 3/31/2021 (NAV) Dollar Change Net Cash Flows Dollar Value Added
Public Employees Retirement 5,385.7 6,813.1 1,427.4 (224.3) 1,651.8
Teachers Retirement 3,813.6 4,814.7 1,001.1 (170.6) 1,171.8
Firefighters Retirement 423.3 559.5 136.2 3.6 132.7
Police Officers Retirement 400.4 522.2 121.8 (3.1) 124.9
Sheriffs Retirement 351.3 455.8 104.4 (4.6) 109.1
Game Wardens Retirement 193.9 255.8 61.8 1.3 60.5
Highway Patrol Retirement 139.1 175.5 36.4 (6.5) 42.8
Judges Retirement 97.0 125.4 28.4 (1.6) 30.0
Vol Firefighters Retirement 35.0 44.9 10.0 (1.0) 11.0
Grand Total 10,839.3 13,766.9 2,927.6 (406.9) 3,334.5
CIO Update Retirement Plans Net Performance
6
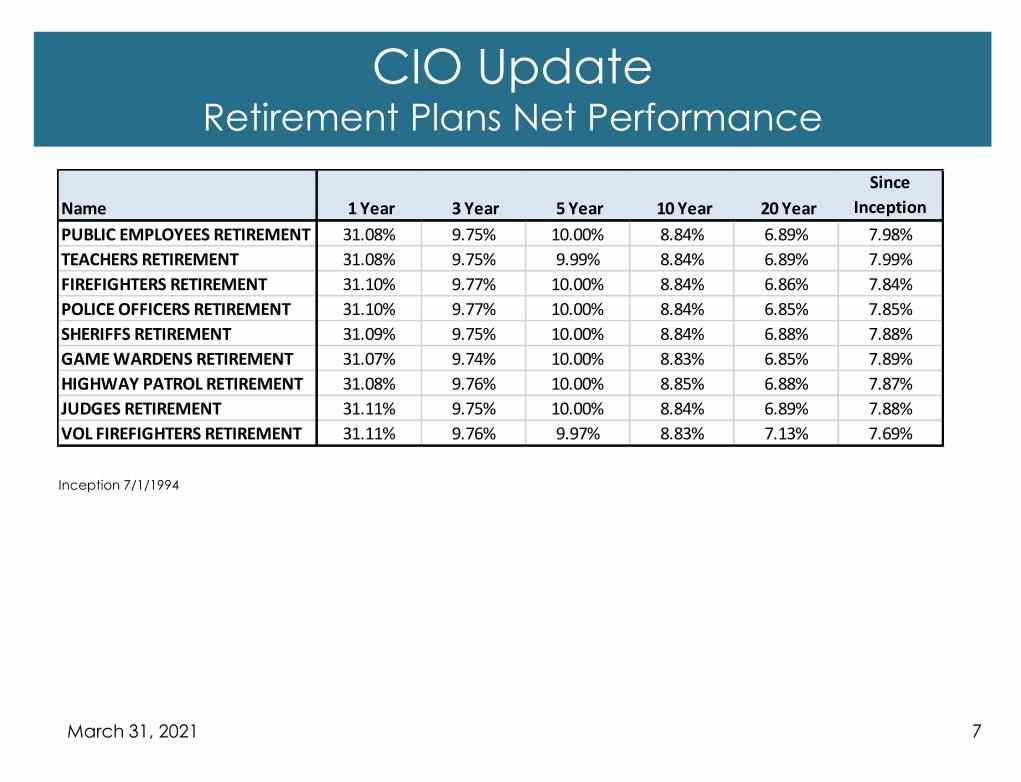
March 31, 2021
Inception 7/1/1994
Name 1 Year 3 Year 5 Year 10 Year 20 Year
Since
Inception
PUBLIC EMPLOYEES RETIREMENT 31.08% 9.75% 10.00% 8.84% 6.89% 7.98%
TEACHERS RETIREMENT 31.08% 9.75% 9.99% 8.84% 6.89% 7.99%
FIREFIGHTERS RETIREMENT 31.10% 9.77% 10.00% 8.84% 6.86% 7.84%
POLICE OFFICERS RETIREMENT 31.10% 9.77% 10.00% 8.84% 6.85% 7.85%
SHERIFFS RETIREMENT 31.09% 9.75% 10.00% 8.84% 6.88% 7.88%
GAME WARDENS RETIREMENT 31.07% 9.74% 10.00% 8.83% 6.85% 7.89%
HIGHWAY PATROL RETIREMENT 31.08% 9.76% 10.00% 8.85% 6.88% 7.87%
JUDGES RETIREMENT 31.11% 9.75% 10.00% 8.84% 6.89% 7.88%
VOL FIREFIGHTERS RETIREMENT 31.11% 9.76% 9.97% 8.83% 7.13% 7.69%
CIO Update Retirement Plans Net Performance
7

March 31, 2021
CIO Update Retirement Plans Asset Class Net Performance
8

March 31, 2021
3/31/2021 (NAV) % of Total Mid Point
Deviation from
Mid Point
Board
Approved
Ranges
Domestic Equity 4,326.1 31.4% 30.0% 1.4% 24% - 36%
International Equity 2,538.8 18.4% 17.0% 1.4% 12% - 22%
Private Investments 1,893.5 13.8% 15.0% -1.2% 11% - 19%
Real Assets 575.6 4.2% 5.0% -0.8% 2% - 8%
Real Estate 1,243.6 9.0% 9.0% 0.0% 5% - 13%
Core Fixed Income 2,051.6 14.9% 15.0% -0.1% 10% - 20%
Non-Core Fixed Income 795.0 5.8% 6.0% -0.2% 4% - 8%
Cash Equivalents + Pension STIP 342.7 2.5% 3.0% -0.5% 0% - 6%
13,766.9 100.0% 100.0%
CIO Update Retirement Plans Asset Class Allocation
9

March 31, 2021
• Strong GDP growth exiting the COVID recession
Source: Bloomberg, Median Survey of Economic Forecasts
CIO UpdateEconomic Environment
10

March 31, 2021
• U.S. unemployment and labor force participation improving but gap remains
CIO UpdateEconomic Environment
11
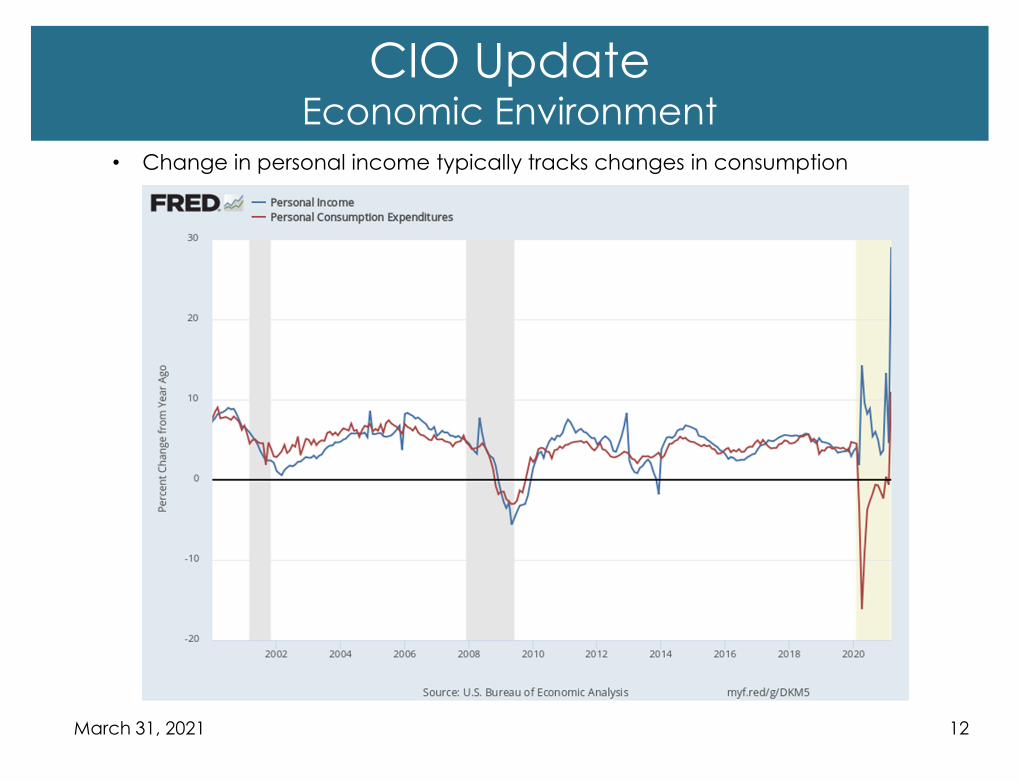
March 31, 2021
• Change in personal income typically tracks changes in consumption
CIO UpdateEconomic Environment
12

March 31, 2021
• All types of asset prices rising sharply driven by monetary and fiscal stimulus
CIO UpdateEconomic Environment
13

March 31, 2021
• Commodity prices increasing as economy reopens
CIO UpdateEconomic Environment
14

March 31, 2021
• Investment challenges in the current environment• Global monetary and fiscal policy
• Inflation expectations
• High valuations/low yields in most areas
• Transitioning back to the office / Manager due
diligence
• Continue to build our manager bench/relationships
and evaluate new opportunities
• Continued focus on manager fees
• Process improvement• Electronic trading of passive equity portfolios
• Manager contract updates
CIO Update
15

March 31, 2021
Macro AttributionKey Takeaways – 1 Year
16
Strategic Asset Allocation - What was the performance of our midpoint weighted benchmark portfolio?• Every benchmark added positive contributions to the pension policy-neutral 40.1% return.• The Domestic Equities asset class benchmark, the MSCI USA IMI, was the largest positive contributor.
Tactical Asset Allocation - Did the actual asset class weights add additional return over the midpoint weighted benchmark portfolio?• On average, we were slightly overweight Domestic Equities, International Equities, and Cash while being slightly underweight or at
the midpoint weight for the remaining asset classes.• About $338M of equity asset classes were sold and $68.9M of fixed income/cash asset classes were sold during the year to fund
the pension net cash need of $-406.9M• In aggregate, the overweighting/underweighting of the asset classes relative to their benchmarks increased the pension
portfolio’s return by 28bps. Most of the active weights were caused by market movements.
Style Selection - Did the portfolio benchmarks add additional return over their asset class benchmarks?• Exposure to Small Cap and Small Cap Value benchmarks were the reasons for Domestic style outperformance of 15 bps.• Positive contributions from Small Cap and Emerging Market indexes were offset by negative contributions from Large Cap.• As of 12/31/20 the Real Assets benchmark consists of 33% ACWI Commodity Producers Index, 33% ACWI Infrastructure, 33% BBG
BARC Global Inflation Linked US TIPS whereas the current exposure of Real Assets portfolios is about 55% to ACWI Commodity Producers Index. The strong outperformance of the Commodity Producers Index relative to Infrastructure and TIPS was the main contributor to the style outperformance of about 22 bps.
Manager Selection - Did the portfolio managers add additional returns over their portfolio benchmarks?• In Domestic Equity, the 130/30 managers were the primary contributors to manager selection outperformance. Their positive
contributions were dampened by a small cap value manager which led to a net 13 bps in manager selection outperformance. The remaining managers did not materially contribute to manager selection effects.
• In International Equity, there was a notable well performing growth manager and value manager with the remaining managers having returns similar to their benchmarks. In total, there was about 28 bps of manager selection outperformance.
• Our external Core Fixed Income manager was the primary contributor to CFI manager selection outperformance of 8 bps.• Our three High Yield managers were the main contributors to the Non-Core Fixed Income manager selection underperformance
of 10 bps.
• Private Investments was the primary contributor to manager selection underperformance in our non-publicly traded investments. The publicly traded benchmarks for these asset classes are an imperfect proxy for actual holdings. In addition, the pricing of private assets lags the publicly traded benchmarks. Thus, short term performance differentials may not reflect the actual value of assets at quarter end.

March 31, 2021
Strategic Asset Allocation (SAA) - The return that would have been achieved if we had invested in our asset class benchmarks at the midpoint weights
Tactical Asset Allocation (TAA) - The additional return earned by investing in the asset class benchmarks at our actual rather than midpoint weights.
Style Selection (SS) - The additional return earned by investing in the underlying manager benchmarks rather than the asset class benchmarks.
Manager Selection - The additional return earned by investing in the underlying managers rather than the underlying manager benchmarks.
* The valuation lag observed in Private Equity, Real Estate, and Natural Resources are likely to lead to large differences in returns between these asset classes
and their benchmarks in short-mid term time periods. The manager selection component is therefore likely to be large for these asset class in the short and
medium term.
Macro Attribution
17

March 31, 2021
Macro Attribution
18

• Private equity deal flow continues to rebound. 1,763 private equity-backed
buyout deals were completed in Q1 2021 with an aggregate deal value of
$200 billion, representing a 20% increase in volume from a rolling 20 quarter
average.
• Valuations for buyouts in the first quarter of 2021 seemed to cool off, coming
in at a purchase price multiple of 11.1x EV/EBITDA compared to 13.2x
EV/EBITDA for 2020. For comparison, 10-year average is 11.7x EV/EBITDA.
• Leverage or debt usage for buyouts came in at 6.0x EBITDA, slightly
compressed compared to the rolling 20 quarter average of 6.2x.
• The pace of fundraising in 2020 was tepid with the restrictions in travel. As
expected, US private equity fundraising rebounded in the first quarter of 2021.
While the headline fundraising numbers were strong, much of the capital
raised was from mega-buyout firms.
• Key takeaways – Private equity activity continues to further bifurcate into the
haves and the have nots. Valuations, debt usage, access to cheap credit
and dry powder all remain at elevated levels compared to longer term
historical levels.
March 31, 2021
Private InvestmentsEnvironment
19

March 31, 2021
Private Investments Pension Asset Class (PAC) Custom Blend:• From inception to 3/31/2017: S&P 1500 + 4% Qtr Lag• 4/1/2017 to 12/31/2020: MSCI USA Small Cap Index• 1/1/2021 to present: The portfolio weighted average of MSCI
USA Small Cap Index and S&P LSTA US Leveraged Loan 100 Index
• Inception – 5/1/2002
Private InvestmentsNet Performance
20

March 31, 2021
• Total Market Value of $1.89 billion as of 3/31/21
• North American-centric at ~75%, ~14% non-US developed, and ~11%
emerging markets
• Direct/primary fund exposure focus at ~81% vs. Fund-of-Funds at ~19%
• Primarily focused on existing buy-out and venture capital relationships
• Selectively increasing allocation to credit strategies and sector specialists
• Net Cash Flow Profile
• $21.36 million for quarter ending 3/31/21
• Two new commitments
• EQT Infrastructure V - $50 million (Real Assets Asset Class)
• CapitalSpring Investment Partners VI - $50 million
Private InvestmentsCharacteristics and Activity
21

• Mixed occupancy and rent trends seen across markets with considerable variation
across property types, geographies and quality
• Transaction volumes rebounded in 4Q20 after having plunged during the early months
of the pandemic, 1Q21 volume still down 30% relative to 1Q20
• Though lending standards have tightened over the last year, debt remains affordable
and accommodative for most sectors
• Commercial property prices have been surprisingly resilient, considering the declines in
demand and rents in 2020
• REITs have delivered strong gains YTD 2021
• CMBS loan delinquencies continued their steady drift lower through 1Q21
• Fundraising through April 2021 is down slightly relative to the same period in 2020
• Dry powder increased and remains elevated at approx. $372B through April 2021
• Rent collections across MBOI portfolio remain strong
• Summary points – Fundamentals vary, transactions rebounding, debt markets remain
cautious, values resilient, REITs fighting back, delinquencies dropping, fundraising is
strong, dry powder remains elevated
March 31, 2021
Real EstateEnvironment
22

Real Estate – Pension Asset Class (PAC) Custom Blend:• From inception to 3/31/2017: NCREIF ODCE 1 Qtr Lag
(Net)• 4/1/2017 to 6/30/2020: MSCI US REIT Index Gross• 7/1/2020 to present: NCREIF ODCE 1 Qtr Lag (Net)• Inception – 6/1/2006
March 31, 2021
Real EstateNet Performance
23
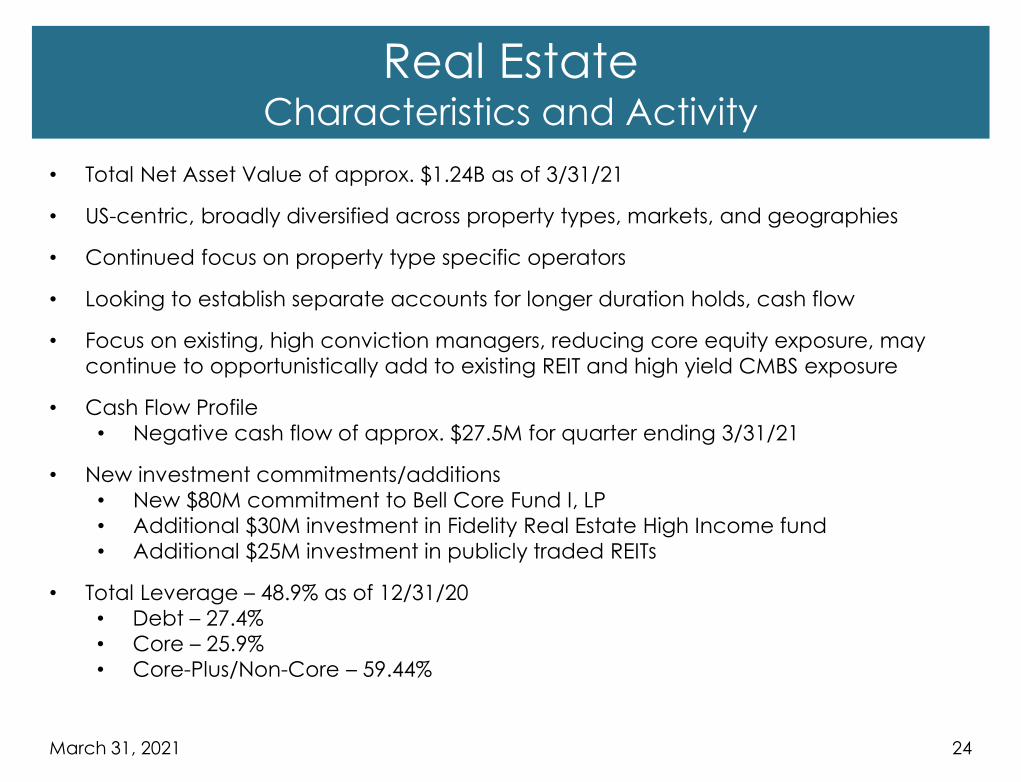
• Total Net Asset Value of approx. $1.24B as of 3/31/21
• US-centric, broadly diversified across property types, markets, and geographies
• Continued focus on property type specific operators
• Looking to establish separate accounts for longer duration holds, cash flow
• Focus on existing, high conviction managers, reducing core equity exposure, may
continue to opportunistically add to existing REIT and high yield CMBS exposure
• Cash Flow Profile
• Negative cash flow of approx. $27.5M for quarter ending 3/31/21
• New investment commitments/additions
• New $80M commitment to Bell Core Fund I, LP
• Additional $30M investment in Fidelity Real Estate High Income fund
• Additional $25M investment in publicly traded REITs
• Total Leverage – 48.9% as of 12/31/20
• Debt – 27.4%
• Core – 25.9%
• Core-Plus/Non-Core – 59.44%
24March 31, 2021
Real EstateCharacteristics and Activity

• Cautious production increases by OPEC+ and a business cycle upturn have
encouraged bullish sentiment about downward pressure on oil inventories and upward
pressure on prices in 2H21
• US production stable around 11M barrels per day through April 2021
• Operating rig counts continue their upward trajectory with sustained higher prices
• MLP prices up with refinery throughout rebounding, continue to be a strong current yield
play
• Aggregates prove resilient, volumes decreased only 1-3%, prices up 3-4% in 2020
• Demand and prices for sawlogs up across the US South and PNW relative to 4Q20
• Lumber and panel prices continue their record setting highs
• March housing starts were 1.7M, 22.4% above February and 37.0% above March 2020
• Real Assets dry powder stood at approx. $299B through April 2021
• Summary points – Positive outlook for oil, MLPs rebounding, aggregates remain resilient,
log demand and prices up, housing market robust, dry powder remains healthy
25March 31, 2021
Real AssetsEnvironment

26March 31, 2021
Real Assets – Pension Asset Class (PAC) Custom Blend:• From inception to 12/31/2020: MSCI ACWI Commodity Producers Index• 1/1/2021 to present: 33.33% MSCI ACWI Commodity Producers Index,
33.33% MSCI ACWI Infrastructure Index, 33.34% Bloomberg Barclays US TIPS Index
• Inception – 4/1/2017
Real AssetsNet Performance

• Total Net Asset Value of approx. $576M as of 3/31/21
• Commodities-Related Portfolio – approx. $320M as of 3/31/21
• Infrastructure-Related Portfolio – approx. $125M as of 3/31/21
• Inflation-linked Bonds (TIPs) Portfolio – approx. $131M as of 3/31/21
• Portfolios are primarily North American-centric, international exposure
continues to grow with recent infrastructure commitments
• Exploring other types of strategies to further diversify and gain new exposures
• Cash Flow Profile
• Negative cash flow of approx. $5M for quarter ending 3/31/21
• New investment commitments/additions
• New $50M commitment to EQT Infrastructure V, LP
• New €75M commitment to Copenhagen Infrastructure IV, SCSp
• Timber Portfolio Total Leverage – 6.1% as of 12/31/20
27March 31, 2021
Real AssetsCharacteristics and Activity

Core Fixed IncomeEnvironment
• The U.S. Treasury curve steepened over the last year. The yield on the
10-year Treasury increased 107bps year over year. There was little
change in yields for maturities less than 4 years.
• The Federal Reserve held short-term rates steady with the Effective
Rate in a tight range around 5 bps.
• Headline inflation posted a significant increase to 2.6% year over
year, at the end of the quarter with significant variability throughout
the year. Core inflation was 1.6% year over year.
• Money market yields continue to be very low. Commercial paper snapped in after the market volatility in April and remains near record
lows.
• Spreads on corporate bonds narrowed dramatically throughout the
year, finishing 191 bps tighter to a near record low of 87 bps.
28

Core Fixed IncomeEnvironment
• Spreads on mortgage-backed securities (MBS) ended the year at 11
bps again near record lows.
• The Barclays Aggregate returned .71% on the year, driven by risk
premiums, partially offset by higher interest rates.
• Bond market liquidity improved dramatically after April with very
strong Corporate new issuance. Bid/ask spreads improved
significantly as confidence returned to the bond market.
29

March 31, 2021
Core Fixed Income - Pension Asset Class (PAC) Custom Blend:• From Inception to 04/01/2017: Bloomberg Barclays U.S. Aggregate Bond Index• 4/1/2017 to 11/29/2019: Intermediate TIPS, Intermediate US Treasury & Agency,
Intermediate Investment Grade Credit, Mortgage Backed, and Diversified Strategies PACs.
• 11/29/2019 to present: Bloomberg Barclays U.S. Aggregate Bond Index• Inception – 4/1/1995
Core Fixed IncomeNet Performance
30

Core Fixed IncomePerformance, Characteristics, and Activity
• Positive total return of 1.48% on the year, led by Reams at 8.45% . The internal portfolio returned .76%.
• Reams outperformed on an overweight to credit. The internal portfolio
outperformed slightly on short duration offset by an underweight to
credit.
• Total market value of approx. $2.05 billion at quarter end.
• Duration was approx. 93% of the benchmark at year end. Significantly
underweight the long end of the curve.
• Portfolio was underweight Treasuries/Agencies and overweight spread
product at the end of the year.
31

• High yield spreads compressed further in the first quarter, dropping below
+300 bps over Treasuries and retreating to below pre-COVID levels.
• High yield investors continue to show an appetite for risk, with lower-quality
credits outperforming high-quality credits in the period.
• The portion of the high yield market trading at distressed levels (1000+ bps
over Treasuries) dropped to just over 2% after having reached 32% in April
2020.
• Default rate expectations continue to decline and are currently around 2%
for 2021, as access to capital markets has allowed companies to extend
maturities, and a rebounding economy and commodity prices have
provided a boost to companies’ prospects.
• Fundamentals remain strong in the financials-heavy preferred securities asset
class, with bank capital levels at historically high levels.
• Although rising Treasury yields and a stronger US Dollar have put pressure on
emerging market debt recently, a stronger global economy is expected to
provide solid footing for the asset class in 2021.
March 31, 2021
Non-Core Fixed IncomeEnvironment
32

33March 31, 2021
Non-Core Fixed Income - Pension Asset Class (PAC) Custom Blend:• From Inception to present Bloomberg Barclays US High Yield – 2%
Issuer Cap• High Yield Asset Class name changed to Non-Core Fixed Income
11/30/19• Inception Date: 6/1/2009
Non-Core Fixed IncomeNet Performance

34
• The high yield benchmark posted a +0.86% return in the quarter, but
the conservative bias of the high yield portfolios, combined with
negative absolute returns in emerging market debt and preferred
securities, led to the Non-Core Fixed Income asset class trailing the
asset class benchmark in the period.
• Although the preferred securities portfolio outperformed its
benchmark in the quarter and the emerging market debt portfolio
lagged only slightly, the negative absolute returns of both asset
classes weighed on the Non-Core Fixed Income returns vs. the asset
class benchmark.
• The asset class underperformed by -1.30% and -3.79% for the quarter
and for the trailing twelve months, respectively.
• $75 million was added to the asset class in the quarter: $50 million to
emerging market debt and $25 million to preferred securities.
March 31, 2021
Non-Core Fixed IncomePerformance, Characteristics, and Activity
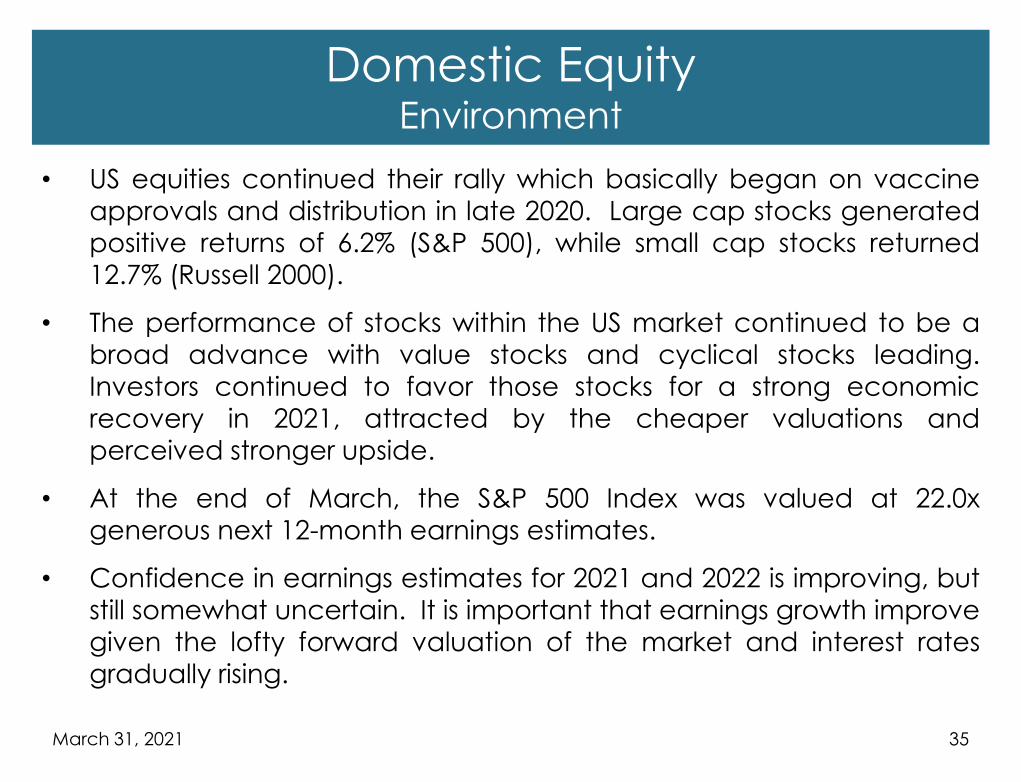
35
• US equities continued their rally which basically began on vaccine
approvals and distribution in late 2020. Large cap stocks generated
positive returns of 6.2% (S&P 500), while small cap stocks returned
12.7% (Russell 2000).
• The performance of stocks within the US market continued to be a
broad advance with value stocks and cyclical stocks leading.
Investors continued to favor those stocks for a strong economic
recovery in 2021, attracted by the cheaper valuations and
perceived stronger upside.
• At the end of March, the S&P 500 Index was valued at 22.0x
generous next 12-month earnings estimates.
• Confidence in earnings estimates for 2021 and 2022 is improving, but
still somewhat uncertain. It is important that earnings growth improve
given the lofty forward valuation of the market and interest ratesgradually rising.
March 31, 2021
Domestic EquityEnvironment

36
Domestic Equity - Pension Asset Class (PAC) Custom Blend:• From inception to 4/30/2017: S&P 1500 Super Composite• 5/1/2017 to present: MSCI USA IMI, Gross• Inception Date: 5/1/2003
March 31, 2021
Domestic EquityNet Performance

37
• The domestic equities asset class outperformed its benchmark during
the quarter by 117 basis points and outperformed for the last twelve
months by 92 basis points. This was continued evidence of a
broadening market. Value stocks outperformed growth stocks.
• Attribution for the quarter showed a benefit from the small capoverweight, value exposure, and from manager selection,
particularly from the Jacobs Levy and DFA portfolios.
• For the last twelve months, there was a benefit from the small cap
overweight, value exposure and from manager selection,particularly the Jacobs Levy and DFA portfolios.
• The asset class has outperformed its benchmark for the 1-year period
and has lagged slightly over the 5 year and 10-year periods ended
March 31.
March 31, 2021
Domestic EquityPerformance

38March 31, 2021
Domestic Equity – Active ManagersNet Performance
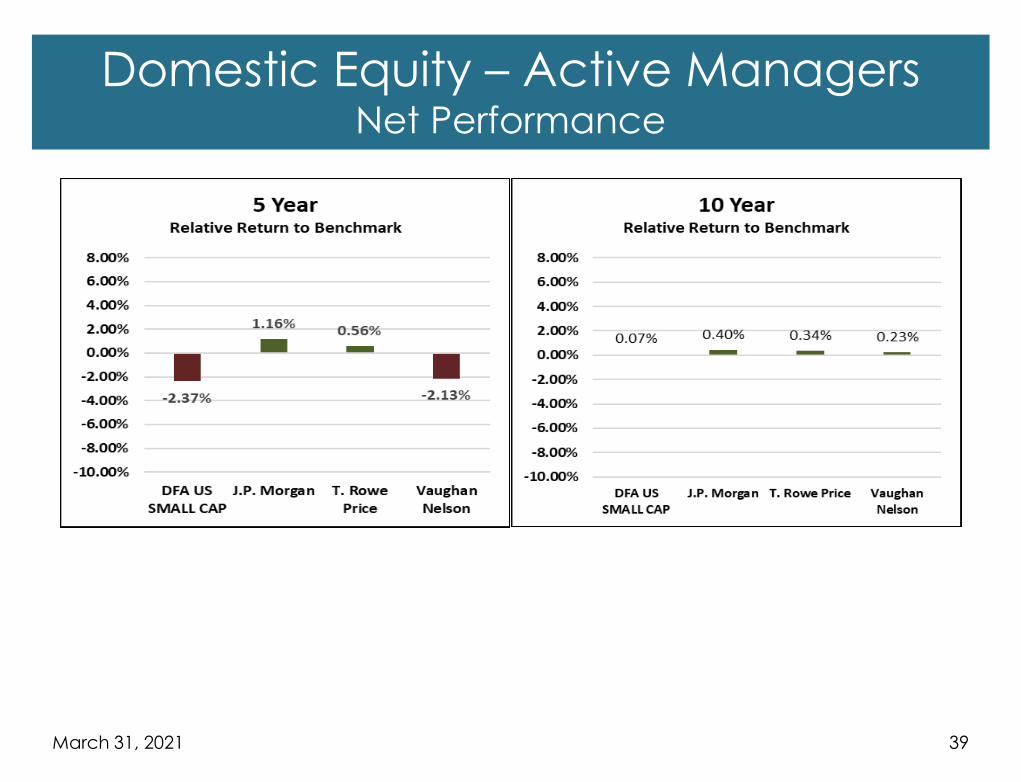
39March 31, 2021
Domestic Equity – Active ManagersNet Performance

40
• Index funds account for the majority of the allocation to large cap
stocks.
• Small cap stocks are slightly overweight to the benchmark weight at
13.6%.
• Cash at the asset class level is minimal per policy.
• There were no changes to the manager lineup during the quarter.
• There were $295 million in outflows for CAPP asset allocation
purposes - $70 million from the BlackRock portfolio, $100 million from
the Northern Trust portfolio, $50 million from the Jacobs Levy portfolio,
and $75 million from sales of the S&P 500 ETF (SPY).
• Staff invested an additional $40 million into the T Rowe portfolio inJanuary, using the BlackRock portfolio as a source of funds.
March 31, 2021
Domestic Equity Characteristics and Activity

41
• International stocks turned in another solid quarter. Developed market stocks
returned 4.0% (MSCI World ex-US) and emerging market stocks returned 2.3%
(MSCI EM). Small caps outperformed large caps within developed markets
by returning 4.9% (MSCI World ex-US SC).
• The broadening of markets continued with value stocks and cyclical stocks
leading, as investors continued to favor those stocks as part of the
reopening trade.
• The US dollar rose by over 3% in the quarter as a stronger economy and
higher interest rates strengthened its value compared to the major world
currencies. This reversed the trend of a weak dollar that was the result of
monetary and fiscal stimulus experienced in calendar year 2020.
• At quarter end, the MSCI World ex-US Index (developed markets) was
valued at 16.5x estimated next 12-month earnings, while the MSCI Emerging
Markets Index was valued at 13.9x estimated next 12-month earnings. Yet as
with the US valuations based upon estimates, the level of confidence in the
accuracy of these levels is relatively low.
March 31, 2021
International EquityEnvironment

42March 31, 2021
International Equity – Pension Asset Class (PAC) Custom Blend:• From inception to 10/31/2006: MSCI EAFE, Net• 11/1/2006 to 6/30/2007: MSCI ACWI ex-US, Net• 7/1/2007 to 2/28/2014: 92.5% ACWI ex-US + 7.5% ACWI ex-US
Small Cap• 3/1/2014 to present: MSCI ACWI ex-US IMI, Net• Inception Date: 4/1/1997
International EquityNet Performance

43
• The international equities asset class underperformed its benchmark
during the quarter by -18 basis points but outperformed for the last
twelve months by +218 basis points.
• For the quarter there was a benefit from manager selection,
particularly from the Acadian and Invesco portfolios. The slight
underweight in small caps and a slight growth tilt were detractors.
• For the last twelve months, there was a benefit from manager
selection, particularly from the Baillie Gifford and Acadian portfolios.
The slight underweight in small caps and a slight growth tilt were
detractors.
• The asset class has outperformed its benchmark for the 1 year, 5
year, and 10-year periods ended March 31.
March 31, 2021
International EquityPerformance

44March 31, 2021
International Equity – Active ManagersNet Performance

45March 31, 2021
International Equity – Active ManagersNet Performance

46
• The large cap allocation retains a significant weight to index funds.
• Small capitalization stocks are slightly underweight at 13.2%.
• There is a slight underweight to emerging markets of -0.8%.
• Cash at the asset class level is minimal per policy.
• There were no changes to the manager lineup during the quarter.
• There were $25 million in outflows for CAPP asset allocation purposes,
sourced from the BlackRock large cap portfolio.
March 31, 2021
International EquityCharacteristics and Activity

Short Term Investment PoolPerformance, Characteristics, and Activity
• The yield on STIP was 0.12% at the end of March.
• Outperformed the index by 29 bps over the year, net of fees.
• Good performance versus the index over 3, 5, & 10 years.
• Treasuries, Agencies, and Government money market funds made up
just over 30% of the Pool on 03/31/21, down slightly from 36% on
03/31/21.
• Local Government participants’ percentage was 32.9% on 03/31/21,
down slightly compared to the prior year.
• The STIP assets were $5.37 billion on 03/31/21, up over $1.10 billion
since 03/31/20.
• The STIP reserve was $53.72 million on 03/31/21.
47

March 31, 2021
Short Term Investment Pool (STIP) Custom Blend:• Inception to 4/30/2018 - LIBOR 1 Month• 5/1/2018 to present: Federal Reserve US Treasury 1M Constant Maturity Index• Inception – 4/1/1997
Short Term Investment PoolNet Performance
48

State Fund Investment PortfolioPerformance, Characteristics, and Activity
• Total portfolio return was 8.99% over the last year. Led by equities at
54.06%.
• Portfolio outperformed the benchmark by 168 bps over the year.
• The Investment Grade portfolio returned 3.43% on the year,
outperforming its index by 177 bps due to a credit overweight.
• Total market value of approx. $1.58B at quarter end.
• Duration was equal to the benchmark at quarter end.
• Continued overweight to spread product and underweight to
Treasuries. Adding to MBS over time.
• Sold $25 million in Domestic Equities.
49

50March 31, 2021
Montana State Fund Investment Pool (SFIP) Custom Blend:• Inception to 3/31/2020 - Bloomberg Barclays Intermediate Aggregate
Bond Index • 3/31/20 To present - State Fund Custom Benchmark: Proportionately
weighted Bloomberg Barclays Intermediate Aggregate Bond Index, S&P 500 Index, MSCI ACWI ex U.S. Index, NCREIF ODCCE Index
• Inception – 12/1/1993
State Fund Investment PoolNet Performance

Trust Funds Investment PortfolioPerformance
• The Pool outperformed the benchmark by 233 bps on the year. Led
by High Yield with a return of 26.10 %. The benchmark was changed
after quarter end.
• Real Estate had a return of 4.24% .
• The internal portfolio returned 1.52%, outperforming its benchmark by
81 bps due to short duration.
51

Trust Funds Investment PortfolioCharacteristics and Activity
• Total market value of approx. $2.70B at quarter end.
• TFBP duration was below the benchmark at quarter end on an
increase in cash. Significantly underweight the long end of the curve.
• TFBP maintained overweight to Corporates, CMBS and ABS, and
underweight to Treasuries and MBS.
• TFIP purchased $55.0 million of High Yield during the year. TFIP
purchased $215.0 million of Real Estate during the year.
• Staff continues to add to Real Estate in order to diversify and increase
the yield of TFIP consistent with last year’s change to the IPS.
52

53March 31, 2021
Trust Funds Investment Pool Custom Blend:• Since Inception to 6/30/21 - Bloomberg Barclays U.S. Aggregate
Bond Index• 6/30/21 to present - Proportionately weighted Bloomberg Barclays
US Aggregate Bond Index, Bloomberg Barclays US High Yield – 2% Issuer Cap Index and the NCREIF ODCE Index
• Inception - 10/1/1995
Trust Funds Investment PortfolioNet Performance

APPENDIX
54March 31, 2021

March 31, 2021 55
Retirement Plans Allocations by Pool

56March 31, 2021
Retirement PlansCharacteristics

57March 31, 2021
Risk ManagementBenchmark Valuation

58March 31, 2021
Risk ManagementBenchmark Valuation

59March 31, 2021
Risk ManagementPension Geographic

62March 31, 2021
Private InvestmentsCharacteristics

63Note: Data reflects most recent GP-reported holdings as of 12/31/20
March 31, 2021
Private InvestmentsCharacteristics

64
Note: Data reflects most recent GP-reported holdings as of 12/31/20
March 31, 2021
Private InvestmentsCharacteristics

65March 31, 2021
Real EstateCharacteristics

66Note: Data reflects most recent GP-reported holdings as of 12/31/20
March 31, 2021
Real EstateCharacteristics

67Note: Data reflects most recent GP-reported holdings as of 12/31/20
March 31, 2021
Real EstateCharacteristics

68Note: Data reflects most recent GP-reported holdings as of 12/31/20
March 31, 2021
Real EstateCharacteristics

69March 31, 2021
Real AssetsCharacteristics

70March 31, 2021
Real AssetsCharacteristics

71Note: Data reflects most recent GP-reported holdings as of 12/31/20
March 31, 2021
Real AssetsCharacteristics

72March 31, 2021
Note: Data reflects most recent GP-reported holdings as of 12/31/20
Real AssetsCharacteristics

73March 31, 2021
Upstream Exploration and production
Services Businesses that provide ancillary services and equipment required to explore for, produce and transport oil and gas
Power Generation plants that create power
Midstream Pipelines, terminals and storage of oil and gas and involves the transportation of oil and gas
Energy Finance Investments in a portfolio of liquid or yield-oriented securities
Note: Data reflects most recent GP-reported holdings as of 12/31/20
Real AssetsCharacteristics
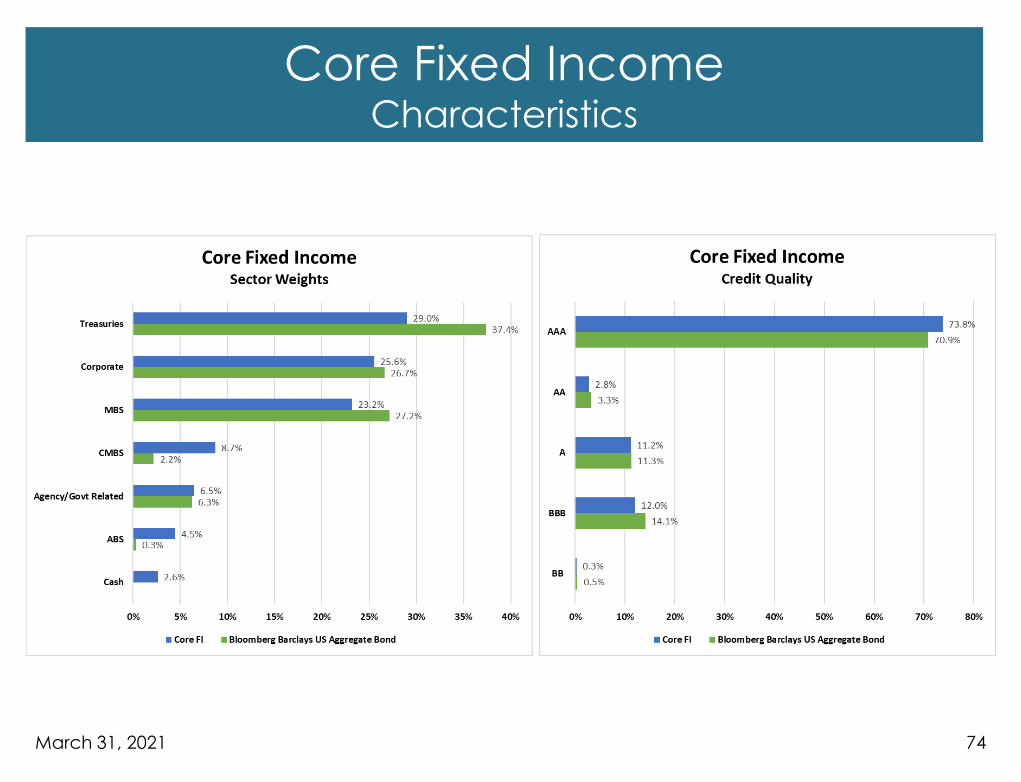
Core Fixed IncomeCharacteristics
74March 31, 2021

75March 31, 2021
0.0%
0.0%
0.0%
0.3%
0.7%
2.0%
1.4%
1.9%
2.2%
1.5%2.8%
2.3%
6.4%
5.7%
0.0%
9.0%
13.3%
20.7%
13.4%
16.5%
1.9%
0.5%
2.2%
1.1%
0.3%
1.8%
1.1%
1.9%
3.6%
9.1%
2.9%
1.5%
5.2%
4.8%
9.9%
6.4%
10.5%
14.5%
9.6%
11.5%
0% 5% 10% 15% 20% 25%
Cash
Other
Gov't Owned-No Guarantee
Brokerage Assetmanagers Exchanges
Other Financial
REITs
Other Industrial
Transportation
Insurance
Banking
Electric
Finance Companies
Technology
Basic Industry
Sovereign Bonds
Capital Goods
Consumer Non-Cyclical
Consumer Cyclical
Energy
Communications
Non-Core Fixed IncomeSector Weights
High Yield Bloomberg Barclays US High Yield - 2% Issuer Cap
2.2%
10.7%
30.7%
53.4%
3.0%
2.2%
10.1%
35.0%
36.0%
16.6%
0% 10% 20% 30% 40% 50% 60%
Not Rated/Not Classified
CCC or lower
B
BB
BBB or higher
Non-Core Fixed IncomeCredit Quality
High Yield Bloomberg Barclays US High Yield - 2% Issuer Cap
Non-Core Fixed IncomeCharacteristics

77
Benchmark: Domestic Equity – PAC Custom Blend
March 31, 2021
Domestic EquityPerformance

79
Benchmark: International Equity – PAC Custom Blend
March 31, 2021
International EquityPerformance
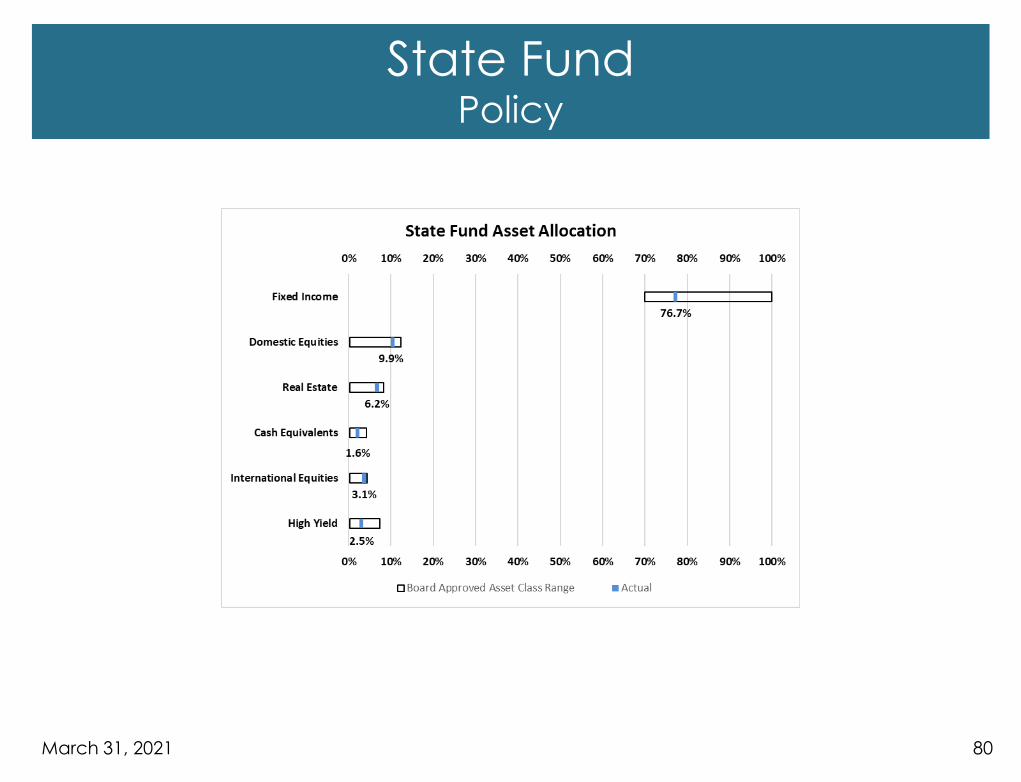
80March 31, 2021
State FundPolicy

81March 31, 2021
State FundPerformance

State Fund Investment PoolCharacteristics
82
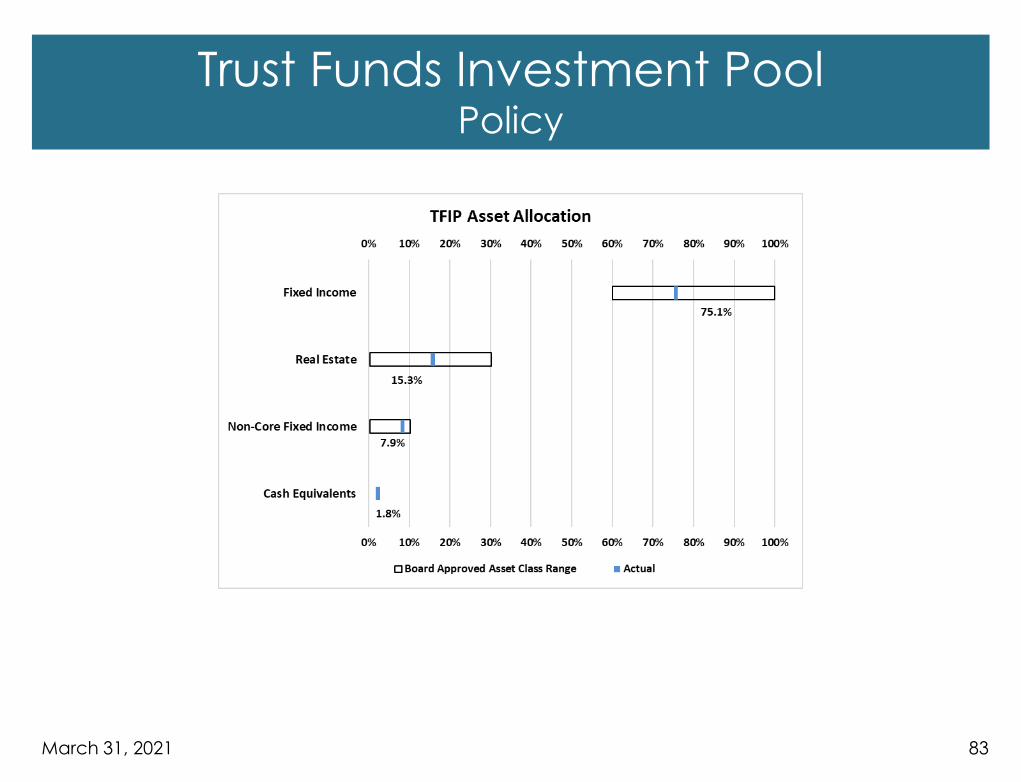
83March 31, 2021
Trust Funds Investment PoolPolicy

84March 31, 2021
Trust Funds Investment PoolPerformance

Trust Funds Investment PoolCharacteristics
85

Short Term Investment PoolCharacteristics
86