regulated nurses, 2015 - cihi · pdf fileabout this report regulated nurses, 2015 is...
TRANSCRIPT
Regulated Nurses, 2015
ReportMay 2016
Production of this document is made possible by financial contributions from Health Canada and provincial and territorial governments. The views expressed herein do not necessarily represent the views of Health Canada or any provincial or territorial government.
Unless otherwise indicated, this product uses data provided by Canada’s provinces and territories.
All rights reserved.
The contents of this publication may be reproduced unaltered, in whole or in part and by any means, solely for non-commercial purposes, provided that the Canadian Institute for Health Information is properly and fully acknowledged as the copyright owner. Any reproduction or use of this publication or its contents for any commercial purpose requires the prior written authorization of the Canadian Institute for Health Information. Reproduction or use that suggests endorsement by, or affiliation with, the Canadian Institute for Health Information is prohibited.
For permission or information, please contact CIHI:
Canadian Institute for Health Information495 Richmond Road, Suite 600Ottawa, Ontario K2A 4H6
Phone: 613-241-7860Fax: [email protected]
ISBN 978-1-77109-450-4 (PDF)
© 2016 Canadian Institute for Health Information
How to cite this document:Canadian Institute for Health Information. Regulated Nurses, 2015. Ottawa, ON: CIHI; 2016.
Cette publication est aussi disponible en français sous le titre Le personnel infirmier réglementé 2015.ISBN 978-1-77109-451-1 (PDF)

Table of contents Key findings ................................................................................................................................ 4
About this report .......................................................................................................................... 6
Regulated professions ................................................................................................................ 7
Notes to readers ......................................................................................................................... 8
Overview ..................................................................................................................................... 9
Nursing supply and workforce ................................................................................................... 10
Flow of regulated nurses ........................................................................................................... 12
Entry-to-practice nurse graduates ............................................................................................. 17
Age distribution of regulated nurses .......................................................................................... 20
Full-time employment ................................................................................................................ 22
Place of employment................................................................................................................. 24
Urban/rural ................................................................................................................................ 26
Conclusion ................................................................................................................................ 29
References ............................................................................................................................... 30

Regulated Nurses, 2015
4
Key findings Regulated Nurses, 2015 highlights current trends in nursing practice in Canada across a variety of supply, employment and demographic characteristics. This report looks at data for the 3 groups of regulated nursing professionals: registered nurses (RNs, including nurse practitioners, or NPs), licensed practical nurses (LPNs) and registered psychiatric nurses (RPNs).
Supply of regulated nurses grew after a year of decline; number employed continued to grow
Following a decline of 0.3% between 2013 and 2014, the supply of regulated nurses grew by 2.2% between 2014 and 2015. From 2006 to 2015, the supply of regulated nurses grew by 18.5%, from 351,048 to 415,864. Over this period, the supply of LPNs grew by more than 50% (from 74,968 to 113,367) while that of both RNs/NPs and RPNs grew by roughly 10.0% (from 270,845 to 296,731 and from 5,235 to 5,766, respectively).
In 2015, the regulated nursing workforce — those employed in their profession at the time of annual registration — reached 390,359, or 93.9% of the total supply of regulated nurses. The proportion of regulated nurses who were employed varied across the nursing professions: 95.6% of RNs (including NPs), 94.0% of NPs, 89.4% of LPNs and 94.8% of RPNs.
Number of regulated nurses entering profession exceeded number not renewing registration
In 2015, there was an inflow of 30,897 regulated nurses into the profession (those who registered in a province or territory where they had not registered the year before). This exceeded the outflow of 22,534 regulated nurses from the profession (those who failed to renew their registration in the same province/territory at the end of 2014). This resulted in a net gain of 8,363 regulated nurses.
This inflow of regulated nurses (30,897) was the largest cohort to enter a nursing profession since the Canadian Institute for Health Information (CIHI) began collecting data for all 3 regulated nursing professions in 2002.
The net gain of 8,363 regulated nurses followed a net loss of 2,360 regulated nurses in 2014. The gain may be partially attributed to growth in the number of graduates from entry-to-practice nursing programs in Canada in recent years.
Proportion of regulated nurses working in rural and remote areas of Canada declined faster than the population of these areas
In 2015 approximately 11.8% (45,926) of regulated nurses worked in rural or remote areas of Canada;i by contrast, 17.4% of the general population lived in a rural or remote area (Demography Division, Statistics Canada, unpublished data, February 2016).
i. For details regarding statistical area classifications, please refer to the Urban/rural statistics section of the Methodology Guide.

Regulated Nurses, 2015
5
More information The following companion products to the Regulated Nurses, 2015 summary report are available on CIHI’s website at www.cihi.ca/hhr:
• Regulated Nurses, 2015: Canada and Jurisdictional Highlights (.pdf)
• Regulated Nurses, 2015: Chartbook (.pptx)
• Regulated Nurses, 2015: RN/NP Data Tables (.xlsx)
• Regulated Nurses, 2015: LPN Data Tables (.xlsx)
• Regulated Nurses, 2015: RPN Data Tables (.xlsx)
• Regulated Nurses, 2015: Health Regions (.xlsx)
• Regulated Nurses, 2015: Methodology Guide (.pdf)
Information and analyses on 30 other health professions in Canada are also available at www.cihi.ca/hhr.
Feedback and questions are welcome at [email protected].

Regulated Nurses, 2015
6
About this report Regulated Nurses, 2015 is CIHI’s annual report on the supply, employment and demographic trends of Canada’s nursing workforce.
Changes to this report and its companion products have been made in response to feedback received from health human resources (HHR) stakeholders. Some of the improvements include
• Expanded data tables in Excel to enable readers to conduct their own analyses;
• Graphs available in PowerPoint so readers can “grab and go”;
• More contextual information to position nursing trends within the broader health care workforce; and
• More details concerning regulated nurses working in rural and remote Canada and on those who enter and exit the workforce.
To ensure that our work reflects priority needs, we invite our readers to join the discussion using CIHI’s Facebook page, CIHI’s Twitter account or email.
For more information, please contact
Program Lead, Health Workforce Database Canadian Institute for Health Information 495 Richmond Road, Suite 600 Ottawa, Ontario K2A 4H6 Phone: 613-241-7860 Email: [email protected]

Regulated Nurses, 2015
7
Regulated professions There are 3 regulated nursing professions in Canada. Each province and territory has its own legislation governing nursing practice, as well as its own body that regulates and licenses its members.
Below is a brief description of each type of regulated nursing provider.
Registered nurses (RNs, including NPs) are self-regulated health care professionals who work both autonomously and in collaboration with others to enable individuals, families, groups, communities and populations to achieve their optimal levels of health. At all stages of life, in situations of health, illness, injury and disability, RNs deliver direct health care services, coordinate care and support clients in managing their own health. RNs contribute to the health care system through their leadership across a wide range of settings in practice, education, administration, research and policy. RNs are currently regulated in all 13 provinces and territories.
Nurse practitioners (NPs) are RNs with additional educational preparation and experience who possess and demonstrate the competencies to autonomously diagnose, order and interpret diagnostic tests, prescribe pharmaceuticals and perform specific procedures within their legislated scope of practice. NPs are currently regulated in all 13 provinces and territories.
Licensed practical nurses (LPNs) work independently or in collaboration with other members of a health care team. LPNs assess clients and work in health promotion and illness prevention. They assess, plan, implement and evaluate care for clients. LPNs are currently regulated in all 13 provinces and territories.
Registered psychiatric nurses (RPNs) work both autonomously and in collaboration with clients and other health care team members to coordinate health care and provide client-centred services to individuals, families, groups and communities. RPNs focus on mental and developmental health, mental illness and addictions, while integrating physical health and utilizing bio-psycho-social and spiritual models for a holistic approach to care. RPNs are currently regulated in the 4 Western provinces (Manitoba, Saskatchewan, Alberta, British Columbia) and Yukon.

Regulated Nurses, 2015
8
Notes to readers Throughout this report,
• The term regulated nurses is used to describe the 3 groups of regulated nursing professionals as a whole: RNs (including NPs), LPNs and RPNs.
• The term nursing refers collectively to Canada’s 3 regulated nursing professions, unless otherwise specified.
• The term supply refers to all regulated nurses who are eligible to practise in the given year (including those employed and those not employed at the time of registration).
• The term workforce refers to only those regulated nurses who were employed at the time of annual registration.
• Unless otherwise noted and/or referenced, data and information are from the nursing component of CIHI’s Health Workforce Database. At present, this data set excludes RPNs in Yukon and LPNs in Nunavut. More information regarding the collection and reporting of this data is available in the companion document Regulated Nurses, 2015: Methodology Guide.

Regulated Nurses, 2015
9
Overview This report explores how the nursing workforce has evolved over the past decade (2006 to 2015) and considers some of the broader transformations that have occurred across the Canadian economic and health care landscape.
The workforce is the foundation of the health care system, and regulated nurses represent the single largest group of health care professionals in the Canadian health care landscape, accounting for almost halfii of the health workforce.1 Given the impact regulated nurses have on health care delivery, it is important to monitor and understand the factors that influence the overall nursing supply, including
• The accessibility of nursing education programs (including the number of seats and program locations);
• The flow of regulated nurses (from graduation to licensure, the outmigration of new graduates, the recruitment of internationally educated regulated nurses, the mobility of regulated nurses within and across Canadian jurisdictions, the migration of regulated nurses out of Canada); and
• The national and jurisdictional economies (which affect public spending on health care).
Regulated nurses play an important role in health care delivery across Canada. They work independently or in collaboration with other members of a health care team, providing services to individuals of all ages, their families and their communities. Understanding the trends in the supply of regulated nurses and the factors influencing the nursing labour market provides needed insight for effective planning and management of health care delivery across the country.
The analyses will highlight changes in the trends of Canada’s nursing supply and workforce over the last 10 years, including
• The growth in the supply of regulated nurses and the number of graduates from Canadian entry-to-practice nursing programs;
• The continued flattening of the age distribution curve among regulated nurses;
• The stable state of nursing employment over time;
• The evolving flow of regulated nurses in and out of nursing practice; and
• The employment characteristics of regulated nurses working in rural and remote Canada.
ii. The proportion of all nursing occupations (including nursing aides) among all health occupations is based on Statistics Canada’s Labour Force Survey. When only regulated nurses are analyzed, the proportion changes to 31.5%.

Regulated Nurses, 2015
10
Nursing supply and workforce In 2015, there were 415,864 regulated nurses eligible to practise in Canada: 296,731 RNs (including 4,353 NPs), 113,367 LPNs and 5,766 RPNs (Figure 1). The supply of regulated nurses grew by 2.2% between 2014 and 2015, following a decline of 0.3% between 2013 and 2014. This growth rate was slightly higher than the average annual growth observed from 2006 to 2014.
The supply of RNs/NPs grew at a rate of 1.2% in 2015, following a decline of 1.0% in 2014. This growth rate is comparable to that experienced over the previous 10 years. The supply of LPNs increased by 5% in 2015, compared with 1.4% in 2014. The supply of RPNs grew at a similar rate in 2015 (1.4%) as it had in the previous year.
Figure 1 Cumulative growth in the supply of regulated nurses, Canada, 2006 to 2015
Source Health Workforce Database, 2016, Canadian Institute for Health Information.

Regulated Nurses, 2015
11
The employment status of regulated nurses in 2006 and 2015 is highlighted in Table 1. The regulated nursing workforce grew at an average annual rate of 2.0% in the previous 10 years, similar to the trend seen in the growth in supply. The annual rate of growth in the nursing workforce varied across professions and data years.
Table 1 Proportion of regulated nurses by employment status, Canada, 2006 and 2015
Regulated nurses,
2006
Regulated nurses,
2015 RNs/NPs,
2006 RNs/NPs,
2015 LPNs, 2006
LPNs, 2015
RPNs, 2006
RPNs, 2015
Supply 351,048 415,864 270,845 296,731 74,968 113,367 5,235 5,766
Employed in nursing (workforce)
92.9% 93.9% 93.7% 95.6% 89.8% 89.4% 96.5% 94.8%
Employed in other than nursing
2.1% 0.8% 1.8% 0.5% 3.2% 1.3% 0.3% 1.9%
Not employed 3.3% 2.4% 3.2% 1.9% 4.1% 3.7% 0.7% 1.4%
Not stated 1.7% 3.0% 1.4% 2.0% 2.9% 5.6% 2.6% 1.9%
Source Health Workforce Database, 2016, Canadian Institute for Health Information.
While the proportion of regulated nurses employed in their profession has remained relatively stable since 2006, the proportion not employediii has declined.
iii. Not employed includes regulated nurses who were seeking and not seeking employment in nursing (from the data field not employed in nursing).
Regulated Nurses, 2015
12
Flow of regulated nurses Changes in the nursing supply reflect the number of registrants entering (inflows) and leaving (outflows) the profession. Analyzing inflows and outflows provides better information about how the nursing supply is changing over time.
Inflow occurs when a regulated nurse registers to practise in a jurisdiction in which she or he did not register the previous year. Inflow is calculated by dividing the number of new registrants — regulated nurses who were not registered to practise nursing in the same province or territory the year before — by the total number of registrants in the same year. Inflow can include new graduates, regulated nurses who migrate in from other Canadian jurisdictions or foreign countries and those who return to the workforce after extended leave (such as for family responsibilities or further education).
Outflow occurs when a regulated nurse fails to renew her or his registration in a jurisdiction the following year. Outflow is calculated by dividing the number of registrants who did not renew their licence to practise nursing in the same province or territory by the total number of registrants in the same year. Outflow is influenced by a number of factors,iv and these factors will change over time. For those regulated nurses age 60 and older, failing to renew their registration may be a signal that they have retired. For younger regulated nurses, particularly those early in their career, reasons for failing to renew registration could include a better or different job opportunity outside of their province or territory, leaving the profession, parental leave and family responsibilities, or a return to school for additional education.
Inflow/outflow for all regulated nurses Current and future supply of regulated nurses is related to the pattern and volume of inflows and outflows. In 2015, a total of 30,897 regulated nurses registered to practise in a province or territory in which they had not registered in the previous year.v This inflow represents 8.0% of the regulated nursing supply (termed “inflow” in Figure 2).
After the 2014 registration year, 22,534 regulated nurses failed to renew their registration in the same province or territory. This outflow represents 5.9% of the 2014 regulated nursing supply (termed “outflow” in Figure 2).
iv. Regulated nurses, like others in the labour force, consider many factors when choosing where to live and work. Factors might include social, political, economic, environmental and familial issues.
v. LPNs in Quebec are excluded from the inflow and outflow historical trending, as data was not available for all registration years.

Regulated Nurses, 2015
13
As a result, there was a net gain of 8,363 regulated nurses in 2015. This followed a net loss of 2,360 regulated nurses in 2014.
Figure 2 Inflow and outflow of regulated nurse supply, Canada, 2005 to 2015
Source Health Workforce Database, 2016, Canadian Institute for Health Information.
The rate of inflow for regulated nurses in 2015 (8.0%) was the largest inflow reported since CIHI began collecting data for all 3 regulated nursing professions in 2002. Of the regulated nurses contributing to the inflow in 2015, 73.4% had graduated in the last 5 years. With the exception of the outflow after the 2013 registration year, the rate in 2014 (5.9%) was the highest since 2002. While half (50.4%) of the outflow were regulated nurses age 55 and older, 26.9% were younger than 35. The findings reinforce recent literature identifying the mobility of new graduates and younger regulated nurses.3, 4
An unknown percentage of outflows each year are regulated nurses who migrate from one province or territory to another. For the most recent year, these individuals would be considered an outflow in the province or territory they left in 2014 and an inflow in the province or territory they relocated to in 2015.

Regulated Nurses, 2015
14
Inflow and outflow rates by nursing profession Across all nursing professions, the inflow of regulated nurses in the 2015 registration year exceeded the outflow of regulated nurses after the 2014 registration year.
Among RNs/NPs (Figure 3), the rates of inflow and outflow ran in parallel, growing closer together since 2012. After the 2013 registration year, the outflow (20,525) surpassed the inflow (17,701) in 2014 and resulted in a 1.0% decline in the supply of RNs/NPs. While the inflow (20,752) in 2015 was greater than the outflow (17,226) after 2014, the gap has shrunk. The inflow and outflow continued to draw closer together, suggesting that fewer RNs/NPs are available to fill future vacancies in health care systems.
Figure 3 Inflow and outflow of registered nurse supply, Canada, 2005 to 2015
Source Health Workforce Database, 2016, Canadian Institute for Health Information.
Regulated Nurses, 2015
15
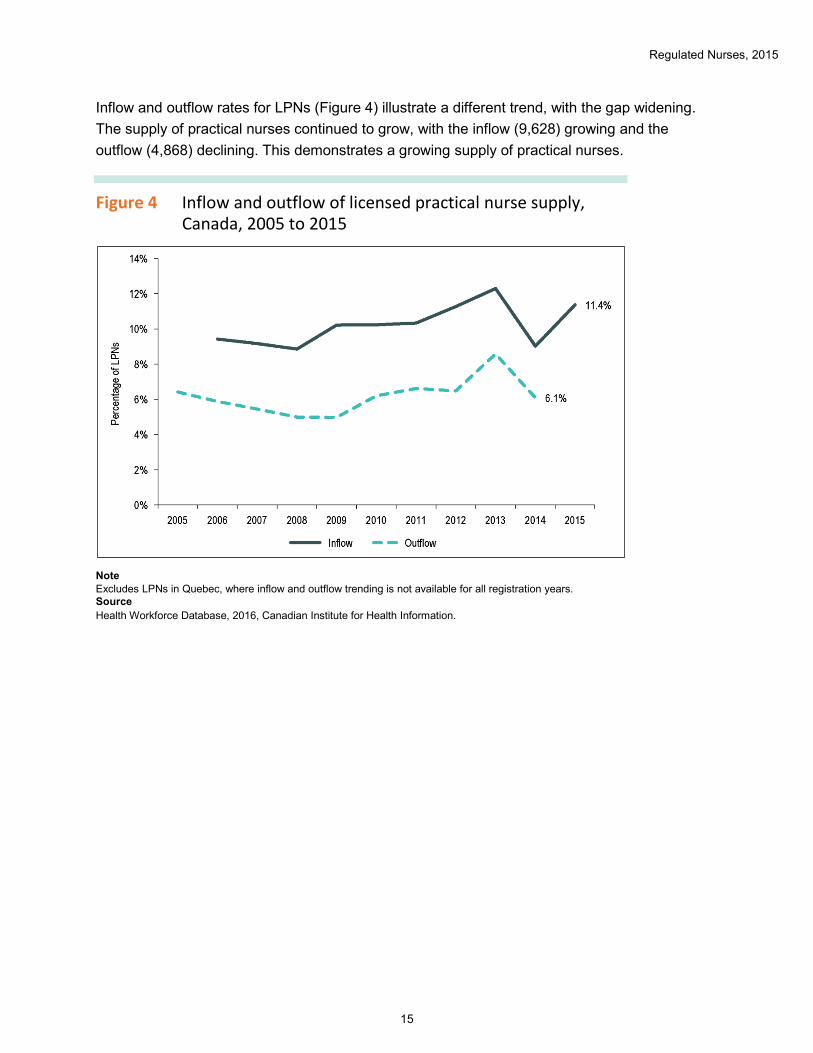
Inflow and outflow rates for LPNs (Figure 4) illustrate a different trend, with the gap widening. The supply of practical nurses continued to grow, with the inflow (9,628) growing and the outflow (4,868) declining. This demonstrates a growing supply of practical nurses.
Figure 4 Inflow and outflow of licensed practical nurse supply, Canada, 2005 to 2015
Note Excludes LPNs in Quebec, where inflow and outflow trending is not available for all registration years. Source Health Workforce Database, 2016, Canadian Institute for Health Information.
Regulated Nurses, 2015
16
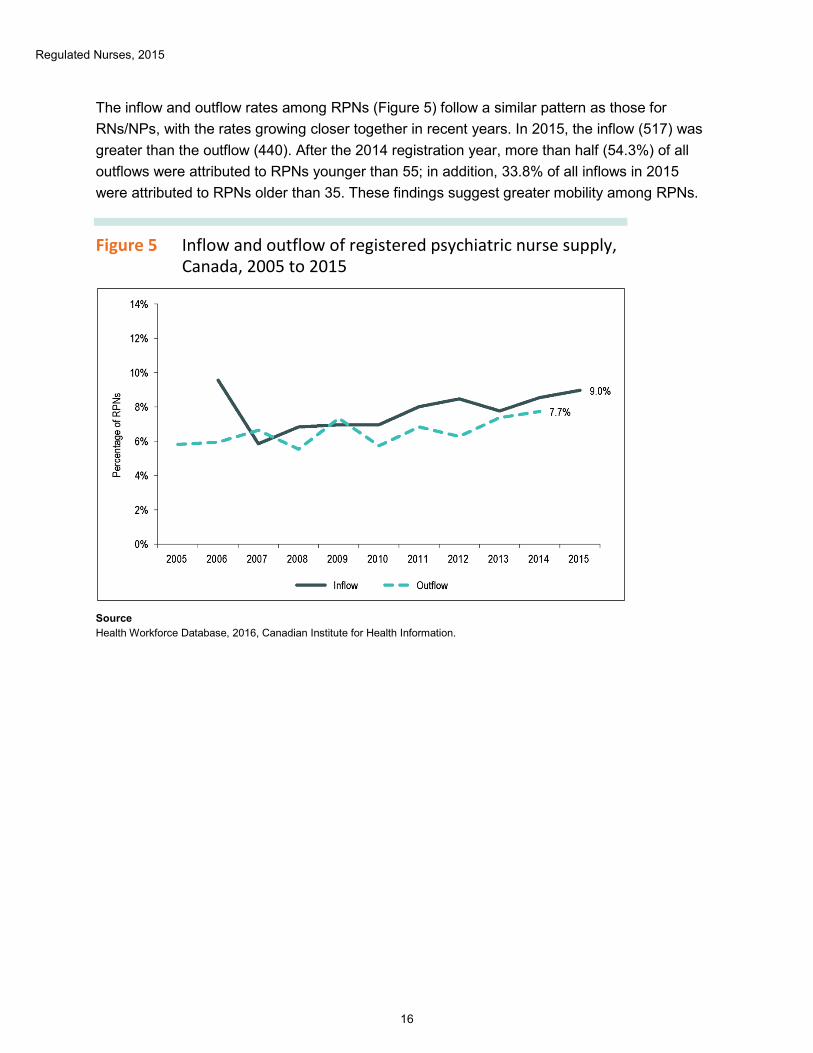
The inflow and outflow rates among RPNs (Figure 5) follow a similar pattern as those for RNs/NPs, with the rates growing closer together in recent years. In 2015, the inflow (517) was greater than the outflow (440). After the 2014 registration year, more than half (54.3%) of all outflows were attributed to RPNs younger than 55; in addition, 33.8% of all inflows in 2015 were attributed to RPNs older than 35. These findings suggest greater mobility among RPNs.
Figure 5 Inflow and outflow of registered psychiatric nurse supply, Canada, 2005 to 2015
Source Health Workforce Database, 2016, Canadian Institute for Health Information.
Regulated Nurses, 2015
17
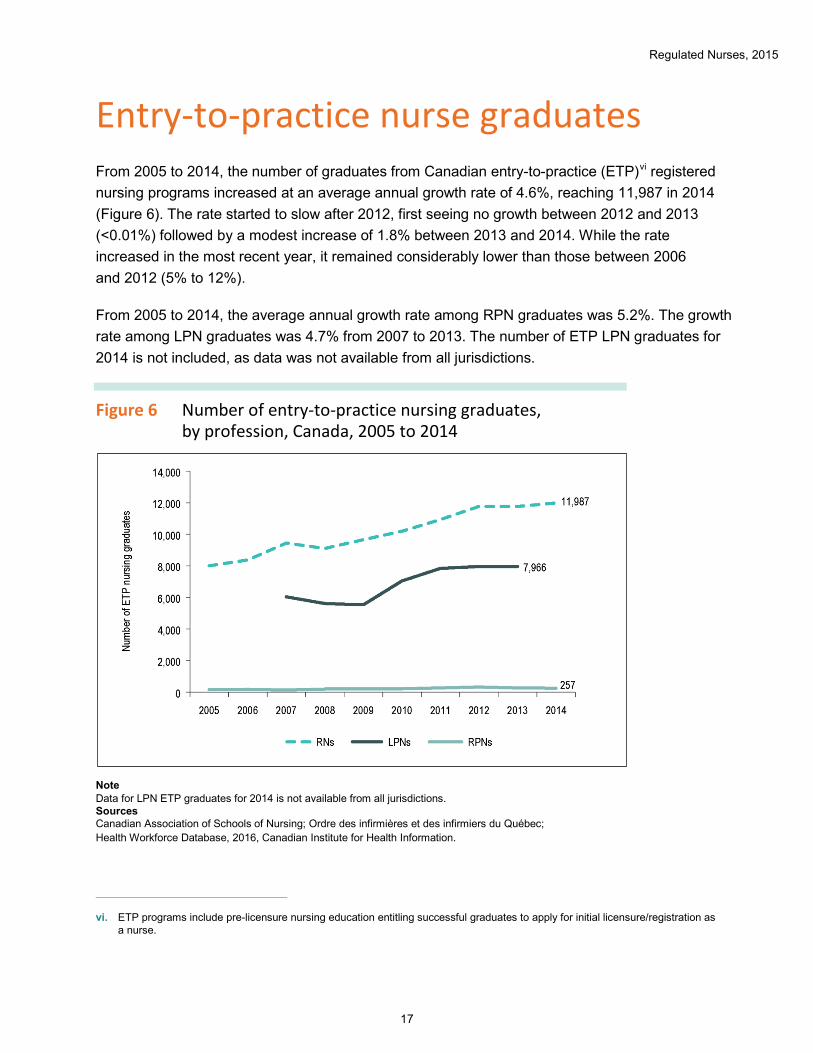
Entry-to-practice nurse graduates From 2005 to 2014, the number of graduates from Canadian entry-to-practice (ETP)vi registered nursing programs increased at an average annual growth rate of 4.6%, reaching 11,987 in 2014 (Figure 6). The rate started to slow after 2012, first seeing no growth between 2012 and 2013 (<0.01%) followed by a modest increase of 1.8% between 2013 and 2014. While the rate increased in the most recent year, it remained considerably lower than those between 2006 and 2012 (5% to 12%).
From 2005 to 2014, the average annual growth rate among RPN graduates was 5.2%. The growth rate among LPN graduates was 4.7% from 2007 to 2013. The number of ETP LPN graduates for 2014 is not included, as data was not available from all jurisdictions.
Figure 6 Number of entry-to-practice nursing graduates, by profession, Canada, 2005 to 2014
Note Data for LPN ETP graduates for 2014 is not available from all jurisdictions. Sources Canadian Association of Schools of Nursing; Ordre des infirmières et des infirmiers du Québec; Health Workforce Database, 2016, Canadian Institute for Health Information.
vi. ETP programs include pre-licensure nursing education entitling successful graduates to apply for initial licensure/registration as a nurse.
Regulated Nurses, 2015
18
RN graduate outmigration Regulated nurses seeking licensure to practise in Canada are required to register with a provincial or territorial regulatory body. By comparing the number of ETP nursing graduates from Canadian nursing programs with the number obtaining a nursing licence over time, we can better understand nursing graduate outmigration. Graduate outmigration5 is defined as the proportion of new graduates from Canadian nursing ETP programs who do not apply for registration with a Canadian nursing regulatory body.
When considering graduate outmigration, it is important to keep in mind that not all Canadian nursing graduates will choose to obtain a Canadian licence to practise nursing. Canadian nursing graduates may choose to pursue further education, leave Canada to practise nursing in another country or leave the profession altogether. Factors influencing a nurse’s decision on where to live and work are diverse and may include social, political, economic, environmental and/or familial issues.6
Figure 7 uses Canadian RN ETP graduate data from 2006 to 2014 and RN licensure data from 2007 to 2015 to demonstrate the rate at which Canadian RN ETP graduates obtained a nursing licence following graduation. Each year, between 87% and 96% of Canadian RN ETP graduates obtained a licence to practise nursing in Canada.
The data demonstrates that most Canadian RN ETP graduates were able to obtain a Canadian nursing licence within 3 years of graduation. Since 2007, more than 90% of Canadian RPN ETP graduates have obtained an RPN licence to practise in Canada within 4 years of graduation.
Analysis tracking Canadian LPN graduates obtaining licensure is not possible at this time, as the 2014 ETP graduate data for LPNs was not available from all jurisdictions.

Regulated Nurses, 2015
19
Figure 7 Percentage of Canadian RN entry-to-practice graduates holding a nursing licence, by year of graduation and year of registration, Canada, 2006 to 2015
Sources Canadian Association of Schools of Nursing; Ordre des infirmières et des infirmiers du Québec; Health Workforce Database, 2016, Canadian Institute for Health Information.

Regulated Nurses, 2015
20
Age distribution of regulated nurses Between 2006 and 2015, the age distribution among regulated nurses flattened (Figure 8) as the proportion of younger regulated nurses increased.
Figure 8 Regulated nurses by age groups, Canada, 2006 to 2015
Source Health Workforce Database, 2016, Canadian Institute for Health Information.
The proportion of regulated nurses age 35 to 54 declined by more than 10 percentage points between 2006 and 2015 and accounted for less than half (48.0%) of the supply of regulated nurses in Canada in 2015, from 204,404 (58.2%) to 199,508 (48.0%). The decline of regulated nurses age 35 to 54 is an important trend to watch because they are the foundation of the nursing workforce, often working autonomously while simultaneously supporting older regulated nurses and mentoring new regulated nurses in the workforce.7, 8
Over the same period, the proportion of regulated nurses younger than 35 increased, from 71,392 (20.3%) to 120,042 (28.9%). This may be partially attributed to recent growth among graduates from Canadian ETP regulated nursing programs. LPNs saw the largest growth, reaching 39,467 and accounting for 34.8% of the supply of LPNs. The supply of RNs/NPs and RPNs younger than 35 grew at a slower rate, accounting for about a quarter of regulated nurses in each profession in 2015 (26.7% and 23.0%, respectively).

Regulated Nurses, 2015
21
While the number of regulated nurses age 55 and older increased overall since 2006 (from 75,243 to 96,311 in 2015), the growth of this group of regulated nurses slowed in recent years. Between 2006 and 2010, the growth among regulated nurses age 55 and older ranged from 5.0% to 7.0%; between 2010 and 2011, the rate slowed to 2.5%. In the most recent year, between 2014 and 2015, the number of regulated nurses age 55 and older declined at a rate of -0.3%.
Looking at the age distribution of late-career regulated nurses (Figure 9) provides insight into demographic and labour market changes facing the regulated nursing workforce.
Figure 9 Proportion of regulated nursing supply age 55 and older, Canada, 2006 and 2015
Source Health Workforce Database, 2016, Canadian Institute for Health Information.
The proportion of regulated nurses age 55 and older increased from 21.4% to 23.2% between 2006 and 2015. While literature suggests that many Canadian professionals are choosing to delay retirement, the beginning of the decline in the number of regulated nurses occurred at roughly the same age in both 2006 and 2015.
Among the 3 groups of regulated nurses,
• The proportion of RNs/NPs and RPNs age 55 and older begins to decline after age 58; the shift occurs a year later among LPNs, at age 59.
• More than 25% of RPNs (28.3%) and RNs/NPs (25.4%) were age 55 and older in 2015; this compares with 26.9% of RPNs and 21.9% of RNs/NPs in 2006.

Regulated Nurses, 2015
22
Full-time employment CIHI’s definition of full-time employment is the regulated nurse’s official status with her or his primary employer, not a reflection of the number of hours worked (or number of positions held). It is quite likely that some regulated nurses work the equivalent of full-time hours through a combination of multiple positions with 1 or more employers. In the analysis, only those employed on a full-time basis with their primary employer are considered full time.
While rates of full-time employmentvii have changed very little over the past decade, there are noticeable variations across the nursing professions. In 2015, the full-time employment rates for RNs/NPs and RPNs were greater than 60% (60.8% and 61.7%, respectively), while less than half of LPNs (48.4%) were employed full time. NPs had the highest full-time employment rate (81.2%) among all regulated nurses (Figure 10).
Figure 10 Rates of full-time employment among regulated nurses, Canada, 2006 and 2015
Source Health Workforce Database, 2016, Canadian Institute for Health Information.
vii. The full-time employment analysis evaluates the primary employment status for all regulated nurses regardless of their position, place of work or area of responsibility. As such, regulated nurses working in direct care, education, research and/or administration are included in this analysis. The full-time employment rate is adjusted by excluding the records with unknown employment status.

Regulated Nurses, 2015
23
Full-time employment rates were lowest among regulated nurses younger than 35, with just more than half (51.3%) employed full time (Figure 11). LPNs younger than 35 had the lowest rates of full-time employment, at 37.0%, whereas 57.7% of RNs/NPs and 47.0% of RPNs were employed full time. Low rates of full-time employment among young regulated nurses is not new, and there are many factors that may contribute, including availability of full-time positions, increased work–life balance, flexibility to gain experience in multiple positions and/or work environments, continuing education, and other social, political, economic, environmental or familial issues.9, 10
Figure 11 Full-time employment rates of regulated nurses, by age group, Canada, 2015
Source Health Workforce Database, 2016, Canadian Institute for Health Information.

Regulated Nurses, 2015
24
Place of employment Regulated nurses are employed in a broad variety of practice settings.viii The distribution of regulated nurses by place of employment remained relatively unchanged over the previous 10 years. This was true for each of the nursing professions.
Hospitals remained the top employer across the nursing professions. Close to 60% (58.9%) of regulated nurses were employed in a hospital setting, 15.1% in community health, 15.2% in a nursing home or long-term care (LTC) setting and 10.8% in other places of work. In 2015, 63.3% of RNs/NPs, 47.2% of LPNs, 44.3% of RPNs and 38.8% of NPs were employed in a hospital setting.
Over the past 10 years, there has been an increased focus on delivering health care in the community. Regulated nurses employed in community settings may work in community health centres, home care agencies, nursing stations (outposts or clinics), public health departments/units and/or physicians’ offices or family practice units.
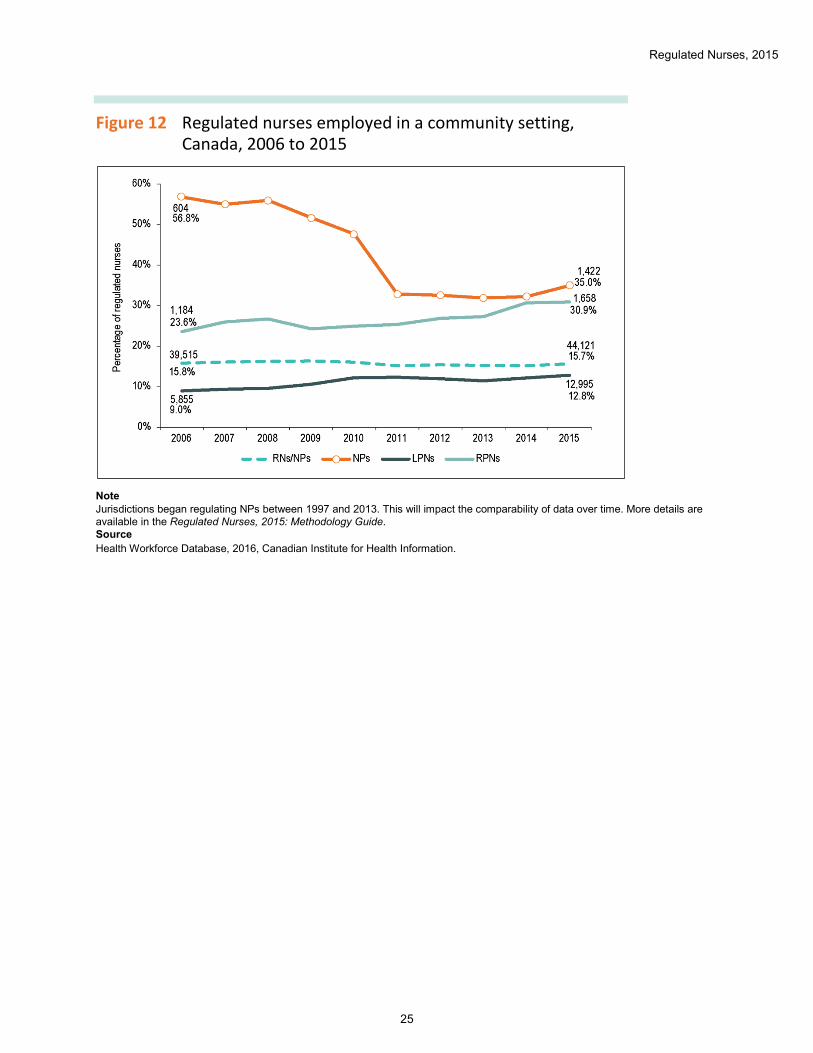
In 2015, there were 58,774 regulated nurses working in a community setting: 44,121 RNs/NPs, 1,422 NPs, 12,995 LPNs and 1,658 RPNs. Since 2006, the proportion of regulated nurses employed in a community setting has shifted, with the proportion of LPNs and RPNs increasing from 9.0% to 12.8% and from 23.6% to 30.9%, respectively (Figure 12).
The proportion of RNs/NPs working in a community setting has not changed since 2006 (15.7%); however, the proportion of NPs employed in a community setting has declined from 56.8% in 2006 to 35.0% in 2015. Over the same period, the proportion of NPs identifying other places of work has increased (from 10.4% to 23.4%), which may have contributed to a decline in NPs employed in the community setting.
viii. The data element Place of Work is reported using 4 categories: hospital, community health, nursing home/long-term care (LTC) facility and other place of work. Hospital includes data from hospitals (general, maternal, pediatric, psychiatric), mental health centres and rehabilitation/convalescent centres. Community health includes data from community health centres, home care agencies, nursing stations (outposts or clinics), public health departments/units and physicians’ offices/family practice units. Nursing home/LTC includes data from nursing homes/long-term care facilities. Other place of work includes data from business/industry/occupational health offices, private nursing agencies/private duty, self-employed, educational institutions, associations/governments and other places of work.
Regulated Nurses, 2015
25
Figure 12 Regulated nurses employed in a community setting, Canada, 2006 to 2015
Note Jurisdictions began regulating NPs between 1997 and 2013. This will impact the comparability of data over time. More details are available in the Regulated Nurses, 2015: Methodology Guide. Source Health Workforce Database, 2016, Canadian Institute for Health Information.
Regulated Nurses, 2015
26
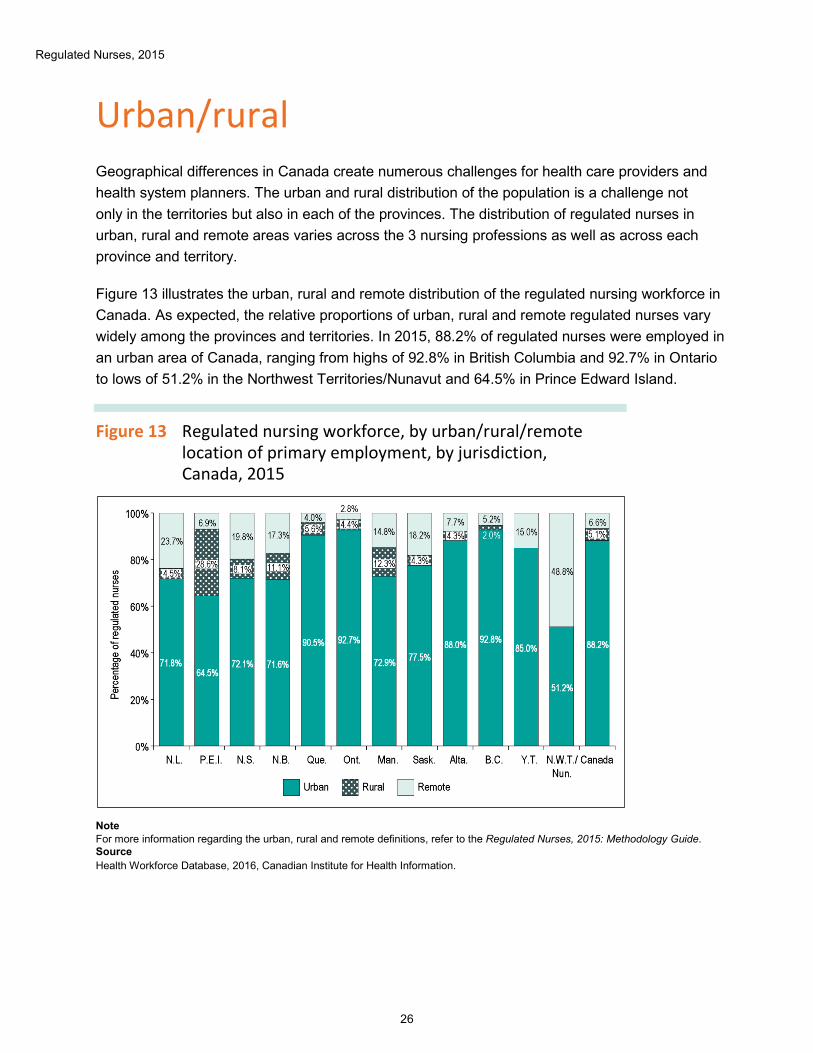
Urban/rural Geographical differences in Canada create numerous challenges for health care providers and health system planners. The urban and rural distribution of the population is a challenge not only in the territories but also in each of the provinces. The distribution of regulated nurses in urban, rural and remote areas varies across the 3 nursing professions as well as across each province and territory.
Figure 13 illustrates the urban, rural and remote distribution of the regulated nursing workforce in Canada. As expected, the relative proportions of urban, rural and remote regulated nurses vary widely among the provinces and territories. In 2015, 88.2% of regulated nurses were employed in an urban area of Canada, ranging from highs of 92.8% in British Columbia and 92.7% in Ontario to lows of 51.2% in the Northwest Territories/Nunavut and 64.5% in Prince Edward Island.
Figure 13 Regulated nursing workforce, by urban/rural/remote location of primary employment, by jurisdiction, Canada, 2015
Note For more information regarding the urban, rural and remote definitions, refer to the Regulated Nurses, 2015: Methodology Guide. Source Health Workforce Database, 2016, Canadian Institute for Health Information.

Regulated Nurses, 2015
27
The proportion of regulated nurses working in rural and remote areas declined in the provinces from 14.0% in 2006 to 11.7% in 2015, while it increased in the territories from 30.3% in 2006 to 38.3% in 2015. For the same period, the proportion of Canadians living in a rural or remote area of the provinces declined from 18.6% in 2006 to 17.3% in 2015. In the territories, the proportion of Canadians living in areas outside of Whitehorse, Yellowknife and Iqaluit declined slightly from 52.6% in 2006 to 51.8% in 2015 (Demography Division, Statistics Canada, unpublished data, February 2016).
Looking at the nursing professions, the following variations were identified:
• In the provinces, more than 10% of RNs/NPs, 18% of NPs and 14% of LPNs were employed in a rural or remote area in 2015. More than 15% of RPNs employed in Western Canada worked in an area classified as rural or remote.
• In the territories, close to 40% of RNs/NPs, 42% of NPs and more than 30% of LPNs were employed in areas outside of Whitehorse, Yellowknife and Iqaluit.
The relatively higher decline in the proportion of regulated nurses in rural/remote areas of the provinces has led to even larger discrepancies in the availability of regulated nurses between urban and rural areas of Canadian provinces.

Regulated Nurses, 2015
28
Nature of nursing practice in the North The nature and delivery of nursing services in the territories differ from those in the Canadian provinces. It is not uncommon for a nurse to travel north on a short-term work contract and return to her or his home province for the remainder of the year. Therefore, in addition to the regulated nurses who are registered and working only in the territories, regulated nurses simultaneously holding a registration in another Canadian jurisdiction are included in the northern nursing workforce. Some of these employment patterns also exist in Northern or rural areas of each Canadian province.
Figure 14 shows that the majority of regulated nurses working in the territories worked in hospitals (41.3%). However, a large proportion of regulated nurses (38.2%) in the territories were employed in a community setting. In contrast, close to 60% of regulated nurses in the provinces were employed in a hospital setting and 15% in a community setting.
Figure 14 Regulated nursing workforce, by place of work, by territories and provinces, 2015
Source Health Workforce Database, 2016, Canadian Institute for Health Information.

Regulated Nurses, 2015
29
Conclusion While the regulated nursing supply increased in 2015, the growth rate among Canadian ETP nursing graduates continued to slow. Analysis also shows a continued tightening of the labour market as the number of regulated nurses entering and leaving the profession each year grew closer together. By continuing to monitor the trends affecting the supply of regulated nurses in Canada, relationships between education, regulation and employment can be identified and inform policies shaping Canada’s largest health workforce.

Regulated Nurses, 2015
30
References 1. Statistics Canada. Table 282-0010 — Labour force survey estimates (LFS), by National
Occupational Classification for Statistics (NOC-S) and sex, annual (persons unless otherwise noted). CANSIM. Accessed March 12, 2015.
2. College of Nurses of Ontario. Membership Statistics Highlights 2014. Revised February 25, 2015. 2014.
3. McGillis Hall L, Peterson J, Price S, Andrews G, Lalonde M, Harris A, MacDonald-Rencz S. I was never recruited: challenges in cross-Canada nurse mobility. Nursing Leadership. April 2013.
4. Baumann A, Blythe J, Kolotylo C, Underwood J. Mobility of Nurses in Canada — Building the Future: An Integrated Strategy for Nursing Human Resources in Canada. November 2004.
5. Tomblin Murphy G, Birch S, Alder R, et al. Tested Solutions for Eliminating Canada’s Registered Nurse Shortage. 2009.
6. Clarke D, Plohman J, Cepanec D. Provincial Survey of New Manitoba Nursing Graduates. 2013.
7. Donner GJ, Wheeler MM. Discovery path: a retention strategy for mid-career nurses. Canadian Journal of Nursing Leadership. January–February 2001.
8. O’Brien-Pallas L, Murphy GT, Shamian J, Li X, Hayes LJ. Impact and determinants of nurse turnover: a pan-Canadian study. Journal of Nursing Management. November 2010.
9. Health Canada. Our Health, Our Future: Creating Quality Workplaces for Canadian Nurses. August 2002.
10. MacPhee M, Svendsen Borra L. Flexible Work Practices in Nursing. 2012.

12673-0416
Talk to us CIHI Ottawa495 Richmond Road
Suite 600
Ottawa, Ont.
K2A 4H6
613-241-7860
CIHI Toronto 4110 Yonge Street
Suite 300
Toronto, Ont.
M2P 2B7
416-481-2002
CIHI Victoria 880 Douglas Street
Suite 600
Victoria, B.C.
V8W 2B7
250-220-4100
CIHI Montréal 1010 Sherbrooke Street West
Suite 602
Montréal, Que.
H3A 2R7
514-842-2226
CIHI St. John’s 140 Water Street
Suite 701
St. John’s, N.L.
A1C 6H6
709-576-7006
www.cihi.ca [email protected]