regulation and the international competitiveness … · based businesses compared to the impacts of...
TRANSCRIPT

REGULATION AND THE INTERNATIONAL COMPETITIVENESS OF THE U.S. ECONOMY
Steven Globerman*
Western Washington University
College of Business and Economics
and
George Georgopoulos
York University
Department of Economics
June 2012
Final Draft
*The authors thank Rob Sarvis for very helpful research assistance. The helpful comments of several
anonymous reviewers are also gratefully acknowledged.
1
EXECUTIVE SUMMARY
An increasing number of observers have expressed concern that government regulation in the
United States is becoming increasingly burdensome, and that the growing burden is harming the
international competitiveness of the U.S. economy. Our report provides a preliminary assessment of this
concern. Specifically, it discusses alternative measures of international competiveness and government
regulation and positions the United States relative to other developed countries in terms of those
measures. Using evidence drawn primarily from surveys reported by organizations such as The World
Economic Forum, as well as data reported by the Organization for Economic Cooperation and
Development (OECD), we find that the regulatory environment in the United States has become less
favorable to private sector activity in recent years compared to other countries. Furthermore, a number
of measures of economic performance show a notable deterioration in the position of the United States
relative to other developed economies. While productivity measures of U.S. economic performance still
exceed those of other OECD countries, the outperformance has diminished recently, and further
deterioration of U.S. productivity growth relative to other countries is expected by many corporate
executives. A declining productivity performance is a plausible consequence of an increasingly complex
and uncertain U.S. regulatory environment.

2
1.0 INTRODUCTION
The prolonged recent recession in the United States and the relatively slow economic growth
rate characterizing the recovery from the depths of the recession has economists and policymakers
discussing policy initiatives that will restore the U.S. economy to a path of strong, long-run economic
growth. One phenomenon that has been highlighted by some economists and private sector managers
as a major barrier to the restoration of long-run economic growth is the increasing burden of
government regulation on the private sector1. Government regulation is seen as imposing costs and
uncertainties that discourage domestic private sector capital formation and employment growth. More
generally, an increasingly onerous regulatory environment is alleged to be an important handicap for
American companies competing at home and abroad with foreign companies that are less constrained
by their home governments in how they carry out their business activities2. Put more directly, there
appears to be a growing concern that an increasingly complex, uncertain and costly regulatory regime in
the United States is harming the international competiveness of American companies.
The primary focus of this report is to identify and evaluate available evidence bearing upon two
broad issues: 1. Has the international competitiveness of U.S.-based companies declined in recent
years? 2. For the same years, has government regulation in the U.S. become more onerous for U.S.-
based businesses compared to the impacts of government regulation on the private sectors of other
countries?
The evidence presented suggests that U.S. international competitiveness has deteriorated by
certain measures, and that future, and potentially more economically significant, declines may be
anticipated. Evidence also identifies a deterioration in the U.S. regulatory environment relative to other
developed economies. This fact pattern is consistent with concerns identified above that the changing
regulatory regime in the United States has harmed the performance of the U.S. private sector relative to
other countries.
It must be acknowledged that a more rigorous statistical analysis of the determinants of
international competitiveness, including measures of a country’s regulatory regime, should be
undertaken to confirm or deny any inferences drawn from simple comparisons of changes in measures
of U.S. international competitiveness and changes in measures of the U.S. regulatory regime. We plan to
carry out and report such an analysis in a later study. Our more modest goal for this report is to review
the available literature and data bearing upon the relationship between regulation and international
competitiveness in order to identify whether there is any apparent justification for focusing more
research and policy attention on the relationship, as well as to provide insight into what future research
initiatives might prove fruitful.
It should also be explicitly noted that we are adapting a “relative” focus. Specifically, we are
evaluating the regulatory environment of the United States against the background of the regulatory
1 See Cochrane (2011) and Feulner (2012).
2 Baily and Slaughter (2008), among others, highlight the role that regulation can play in undermining the economic
performance of U.S. companies.

3
environments of other countries, as well as the economic performance of the U.S. economy relative to
other countries. Hence, the report offers no direct guidance as to whether the U.S. economy would be
better off in an absolute sense if the burden of government regulation on the private sector was
reduced; however, to the extent that government regulation appears to be harming the ability of U.S.
firms to compete in international markets, it would impose an additional burden of proof on those who
argue against reducing the scope and complexity of government regulation in the United States.
Furthermore, if government regulation, on balance, harms private sector performance, a more onerous
regulatory regime in the United States is cause for concern, even if regulatory regimes elsewhere have
become more onerous relative to the U.S. regime.
The report proceeds as follows. Section 2 identifies and evaluates alternative measures of
international competitiveness at the national level. In fact, some measures are more relevant than
others from the perspective of overall economic welfare, and, therefore, deserve more weight in any
overall assessment of how the U.S. economy is performing relative to other national economies. Section
3 presents and assesses evidence from a variety of sources bearing upon the issue of whether the U.S.
has become less internationally competitive in recent years. The evidence, on balance, provides some
grounds for concern that there has been a loss of competitiveness and that manifestations of this loss
may become more pronounced in the foreseeable future.
Section 4 provides a conceptual discussion of alternative definitions of government regulation
and the challenges facing any attempts to compare the scope and quality of government regulation
across countries. The conclusion drawn is that in the absence of “bright line” definitions of either the
scope or nature of a country’s regulatory regime, it is prudent to consider a range of available measures
at both the economy-wide level, as well as for individual sectors of the economy, with a view towards
identifying any overall pattern over time in the chosen measures for the United States relative to other
countries. Section 5 subsequently reports and evaluates various measures of the scope and quality of
regulation in the United States and other developed countries over time. While the United States fares
better on some measures and worse on others, the overall picture is of a more onerous regulatory
environment in the United States in recent years, both absolutely and in relation to other countries.
The evidence presented and discussed in Sections 3 and 5 suggest a deterioration in the
international competitiveness of the U.S. economy in recent years, along with a regulatory regime that
has become more onerous for the private sector. As noted earlier, we do not undertake an econometric
analysis in this study to identify the statistical strength of the observed correspondence between
changes in international competitiveness and changes in regulatory regimes. Hence, it seems useful to
identify the conceptual linkages between the two phenomena, as well as review empirical evidence
drawn from available econometric studies on the consistency and magnitude of the overall relationship
between regulation and international competitiveness. Section 6 summarizes our review of the
theoretical and empirical literature on the linkages between the government’s regulatory regime and
the economic performance of domestic firms.

4
The final section summarizes the main findings and conclusions of the report. It also suggests
additional research that would help advance our understanding of how the regulatory regime in the
United States is affecting the attractiveness of that country as a location for private sector investment.
2.0 MEASURING INTERNATIONAL COMPETITIVENESS
The notion of competitiveness as applied to countries is widely discussed in the business media,
although the economic relevance of the application is contentious. The basic notion of competition
implies the existence of winners and losers. Conversely, the basic insight from economic theory is that
international trade and investment typically improve the economic welfare of participating countries in
the long-run. Hence, there is an argument for emphasizing measures of international economic
performance that are connected to a nation’s economic prosperity.
McFetridge (1995) and Swagel (2012) note that of the many indicators of international
competitiveness that have been suggested in the literature, relatively few are directly linked to
measures of economic prosperity. McFetridge (1995) further argues that national competitiveness is a
meaningful policy objective only if it is tied to the goal of maximizing the present value of the stream of
per capita consumption possibilities available to present and future generations. Nations with higher
rates of growth of real per capita income, in turn, are generally more successful than others in achieving
this goal, which makes productivity growth a key indicator of a nation’s economic performance, since
the growth of real per capita income will largely reflect a nation’s productivity growth.
2.1 Productivity Growth
Over the long-run, the key to per capita income growth for a nation is improved productivity
(Porter, 1990). The most comprehensive measure of productivity is total factor productivity (TFP)3.
Total factor productivity (TFP) is a conventional measure of how much physical (or real) output is
produced given the physical (or real) amounts of all conventional factor inputs used to produce output.
It is beyond the scope of this report to discuss TFP methodologies and the technical problems associated
with creating indices of real output and real inputs. Suffice to say that TFP indices typically combine
labor and capital into an aggregate index of real inputs. As a consequence, technological change and
other contributors to improved efficiency are the main drivers of increases in TFP.
A second widely used measure of productivity (labor productivity) is created by dividing physical
(real) output by an index of real labor input such as worker-hours4. Increases in labor productivity will
reflect both technological change and related sources of improved efficiency, as well as increases in the
physical quantities of conventional inputs, such as capital, that are used with labor to produce output. It
3 The concept is also sometimes identified as multi-factor productivity, and we use the terms total factor
productivity (TFP) and multi-factor productivity (MFP) as synonyms in this report. 4 Porter and Rivkin (2012a) argues that it is a nation’s ability to generate high output per employable person,
rather than per currently employed person, that reveals its true competitiveness; however, productivity estimates based on the potential rather than the actual labor force are unavailable.

5
is also beyond the scope of this report to discuss the advantages and disadvantages of TFP versus other
measures of productivity performance. Nor do we discuss potential biases to productivity indices
imparted by factors such as improvements in product quality and changes in business cycle conditions5.
Suffice to say that estimates of labor productivity are often more readily available than estimates of TFP,
particularly when comparing the productivity growth of countries. Hence, we make use of both
measures of productivity growth when identifying changes over time in the international
competitiveness of the United States.
In short, increases in TFP and labor productivity are the performance measures we believe are
particularly meaningful when assessing the international competitiveness of the U.S. economy. This
focus raises issues about whether it is preferable to focus on productivity measures for broad segments
of the economy or for specific industries. While we will discuss how government regulation can
influence economy-wide performance, it should be acknowledged that specific government regulations
are more relevant for some industries than for others. For example, regulations governing financial
transactions will ordinarily be of most direct relevance to firms in the financial and insurance sectors of
the economy. Given that the nature and extent of government regulation varies across industries, it is
useful to identify whether there are differences in the productivity performances of specific U.S.
industries compared to their counterpart industries in other countries, when possible. McFetridge
(1995) affirms the relevance of cross-country productivity comparisons at the industry level when
assessing the international competitiveness of specific industries in different countries. International
comparisons of costs are also potentially relevant. Thus, Markusen (1992, p.8) suggests the following
efficiency-based definitions of industry competitiveness: 1. An industry is competitive if it has a level of
total factor productivity equal to or higher than that of its foreign competitors; 2. An industry is
competitive if it has a level of unit (average) costs equal to or lower than its foreign competitors.
In fact, productivity performance is one of the country-level attributes included in the league-
table surveys of international competitiveness that we summarize and assess in Section 3. While
differences across countries in productivity levels at a point in time may not be very informative,
divergences in those levels over extended periods of time (reflecting differences in longer-run
productivity growth rates) can be viewed as economically meaningful indicators of changes in the ability
of the “average firm” located in a specific country to compete against firms located in other countries.
2.2 Indicators of Technical Change
Since technological change is an important contributor to productivity growth in the longer-run,
some league table comparisons of competitiveness across countries report forward-looking indicators of
technological change, such as research and development intensities, percentages of scientists and
engineers in the workforce, and so forth. Given that there is no well-defined production function for
technological change, such indicators are, at best, rough predictors of future rates of technological
change and, ultimately, future rates of productivity growth. Nevertheless, a nation’s capability to
innovate and to rapidly adopt new production and management practices developed in other countries
5 For a brief discussion of possible measurement problems in constructing productivity under, see Carlson and
Schweitzer (1998).

6
undoubtedly strongly influences its future productivity performance. Hence, indicators of what has been
described as a nation’s “innovation system” or its scientific and technological capabilities are potentially
informative competitiveness measures through their linkage to productivity performance.6 While direct
measures of technological capability are unavailable, proxy measures related to innovation activity are
often used to characterize a nation’s capacity to realize technological progress7. Hence, to the extent
that measures of national capabilities to introduce and adopt product and process innovations are
available, such measures are meaningful indicators of international competitiveness through their
linkage to future productivity performance.
2.3 Trade-Based Measures
Indicators of international trade performance are arguably the most frequently referenced
measures of international competitiveness reported by business journalists and other media sources.
However, as McFetridge (1995), Swagel (2012) and many others have noted, trade performance is not
linked in straightforward and reliable ways to a nation’s economic well-being. For example, observers
frequently link a nation’s competitiveness to its current account balance. Specifically, a declining surplus
or growing deficit in the current account is taken to be indicative of a country’s deteriorating
competitive position in the international market for goods and services, since the country is importing
more than it is exporting. One problem with this interpretation is that a country’s imports will increase
faster than its exports, all other things constant, if its real economic growth rate is higher than those of
its trading partners. In this context, a growing trade deficit would misleadingly signal declining rather
than increasing prosperity, if differential rates of real economic growth underlie differences in
international trade performance across countries8.
Trade-based measures of international competitiveness often rely upon international
comparisons of prices and costs. For example, the OECD measures competitiveness for a given
country’s manufactured exports as the differential between the country’s export price and that of its
competitors in their common markets. Among the chief measures of international competitiveness is a
country’s real exchange rate, typically calculated as the nominal exchange rate multiplied by a ratio of
consumer prices in the focal country and in one or more of its trading partners. A higher real exchange
rate for the U.S. dollar can be interpreted as a loss in U.S. competitiveness in that the price of an overall
basket of “U.S. goods” is increasing relative to the price of a theoretically similar basket of foreign goods
when measured in a common currency. As with other measures of international competitiveness, price
and/or cost-based measures must be cautiously interpreted. For example, the goods exported by U.S.-
based companies might increase in price relative to those of foreign competitors because the relative
quality of U.S.-made products is increasing. This is known as the Balassa-Samuelson effect which
explains why countries that are productive in their tradeables sectors have higher real exchange rates. In
this context, it would be misleading to interpret an increase in export prices (or the real exchange rate)
6 For a discussion of the components of geographical innovation systems, see Asheim and Gertler (2006).
7 Such proxy measures sometimes include patents, R&D expenditures, and scientists and engineers.
8 Technical problems and issues surrounding the use of international trade data to identify changes in national
competitiveness are discussed in Durand, Simon and Webb (1992).
7
as indicating a worsening economic “performance” of U.S.-based producers relative to foreign
competitors.
Some trade-based measures of international competitiveness distinguish among the mix of
goods that are traded. Specifically, they focus on a country’s international market share of higher value-
added goods or its share of “high-technology” products. The underlying notion here is that the
international demand for higher value-added or technology-intensive products is likely to grow faster
than for other products. Furthermore, entry into those product markets by new foreign-based
producers is more difficult than in the case of “conventional” products. Consequently, producers that
can successfully export high value-added and technology-intensive products can potentially earn
economic rents which translate into higher income levels for the home country (Rugman and D’Cruz,
1990). A problem with this argument is that there is no reliable evidence showing that changes in the
industrial mix of a country’s exports causes changes in that country’s real economic growth rate.
2.4 Investment-Based Measures
Counterparts to trade-based measures of international competitiveness are measures related to
capital flows. In particular, foreign direct investment (FDI) flows are potential indicators of the
attractiveness of individual locations to investors9. Hence, if specific countries attract a disproportionate
(relative to their overall size) amount of inward FDI, it might be indicative of private sector business
conditions being particularly favorable in those locations relative to other locations.
Since there is evidence that legal and regulatory regimes influence the location decisions of
foreign direct investors, measures of inward foreign direct investment intensity (e.g. inward FDI relative
to GDP) may be meaningful indicators of international competitiveness.10 Moreover, since inward FDI
has been generally found to contribute to improved productivity in the host economy, inward FDI
intensity is also consistent with welfare-based measures of economic performance such as real output
per capita. A relevant caveat, however, is that FDI inflows will reflect a variety of national characteristics
relative to other countries and not just differences in regulatory governance.
Increased outward FDI might be interpreted as an indicator of fundamental problems in a home
country economy that are motivating domestic firms to invest abroad. The problem with this
interpretation is that the capacity of home country firms to succeed in foreign markets might, itself,
reflect fundamental strengths in the home economy, including a regulatory environment that is
conducive to innovation and increased productivity. Indeed, it is widely acknowledged by international
business scholars that multinational companies (MNCs) must overcome what are called “liabilities of
foreignness” (LOFs) when competing in foreign markets. These LOFs oblige MNCs to cultivate firm-
specific competitive advantages that more than offset the relevant LOFs in order to compete
9 Kochan (2012) defines U.S. competitiveness as the capacity to be attractive to businesses and to simultaneously
create a more prosperous society, where prosperity is linked to productivity. 10
For some evidence on the linkages between legal and regulatory governance and inward FDI, see Globerman and Shapiro (1999, 2002).

8
successfully in foreign markets. Specific attributes of the home country, including the legal and
regulatory regimes, can influence how effectively domestic firms can cultivate firm-specific advantages.
The relationship between outward FDI and home country productivity growth is, however,
controversial. The controversy derives, in part, from the fact that MNCs often transfer production from
home country plants to plants operated by foreign affiliates. Critics claim that such off shoring leads to a
loss of economies of scale in the home country and, therefore, to reductions in productivity of home
country firms. On the other hand, empirical evidence suggests that off shoring leads to lower costs for
the MNC, as well as to growth in head office activities, such as research and development, that are likely
to promote improved productivity in the home country (Globerman, 2012).
On balance, empirical evidence is mixed regarding the impacts of outward FDI on the home
country’s productivity performance (Globerman and Chen, 2010). Hence, it seems prudent to focus on
inward FDI intensity as a measure of international competitiveness. At the same time, investors’
intentions to relocate existing capacity outside the United States, or to locate new capacity in the United
States, might be taken as relevant evidence of either a deteriorating or improving business climate in
the United States relative to other locations. In fact, there is some available evidence on corporate
relocation intentions and this evidence is discussed in Section 3 of the report.
2.5 Summary
Numerous indicators of the international competitiveness of countries have been discussed in
the media, as well as in the academic literature. Economists tend to conclude that any policy-relevant
measure of a country’s international competitiveness should be consistent with accepted measures of
overall economic welfare. With qualifications that need not concern us here, higher real per capita
incomes of the residents of a country are consistent with improved overall economic welfare. Since
productivity growth is the main source of higher real per capita incomes, a nation’s productivity
performance relative to other countries is an arguably meaningful measure of its international
competitiveness. Hence, evidence bearing upon the productivity performance of the U.S. relative to
other countries is presented and discussed in the next section of the report. Furthermore, since
technological change is a major determinant of productivity growth, we also report how indicators of
the “capability” of the U.S. “innovation system” have changed relative to other countries. Finally, inward
FDI flows, as well as expressed intentions of corporate managers to relocate investments from one
country to another, are economically relevant indicators of the attractiveness of the overall business
environments of countries. Hence, FDI data and relocation intentions are also reported in Section 3.
There is much more controversy surrounding the economic relevance of trade-related measures
of national economic performance. In particular, while current account deficits and related measures of
international trade performance are frequently cited indicators of competitiveness problems for the U.S.
economy, such measures are not necessarily signals of declining economic-welfare of Americans. Hence,
we do not consider trade-related data in our overall assessment of U.S. international competitiveness.

9
3.0 EVIDENCE ON U.S. COMPETITIVENESS
In this section, we report and assess data bearing upon various measures of international
competitiveness discussed in the preceding section. It should be explicitly acknowledged that no single
measure, or set of measures, is a definitive indicator of improving or deteriorating U.S. international
competitiveness. Even productivity-based measures must be viewed with caution, since productivity
measurements can be influenced by differences across countries in statistical methodologies, business
cycle conditions and industrial structures. Hence, what we are looking for is whether or not there is a
consistent pattern of improvement or deterioration in the position of the U.S. relative to other countries
across a range of indicators of international competitiveness.
3.1 Productivity Measures
The Organization for Economic Cooperation and Development (OECD) provides relatively
comparable productivity estimates across countries over virtually two decades. For the most part, the
OECD’s membership comprises developed countries which, in turn, makes a reasonable reference group
to compare to the U.S. in terms of productivity performance. While much attention has been paid
recently to the BRIC economies (Brazil, Russia, India and China), and while U.S. concerns about unfair
trade practices center largely on China, it does not make sense to compare the productivity
performance of a mature economy such as the United States to the performance of relatively low
income countries undergoing economic development.
Figure 1 reports estimates of the average annual growth rate of labor productivity averaged
across 16 OECD countries, and for the U.S. separately, for sub-periods covering the years 1990-201011. It
can be seen that the labor productivity performance of the U.S. improved relative to the OECD sample
from around 1996 through 2005. The U.S. labor productivity advantage decreased modestly over the
period 2006-2010 compared to 2001-200512. Hence, the estimates reported in Figure 1 suggest a
substantial improvement in U.S. international competitiveness over the period 1996-2005 followed by a
modest deterioration over the period 2006-2010.
11
The specific measure of labor productivity is real GDP per hours worked. The OECD countries include Australia, Belgium, Canada, Denmark, Finland, France, Germany, Italy, Japan, Korea, Netherlands, New Zealand, Norway, Spain, Sweden and the U.K. 12
OECD labor productivity growth was about 52% of U.S. labor productivity growth from 2001-2005. It was approximately 59% from 2006-2010.

10
Figure 1: Total Labor Productivity Annual Growth
Rate (%)
0
0.5
1
1.5
2
2.5
3
1990-95 1996-
2000
2001-
2005
2006-
2010
LPG
OECD
U.S.
Source: Authors’ calculations from OECD Stat Extracts.
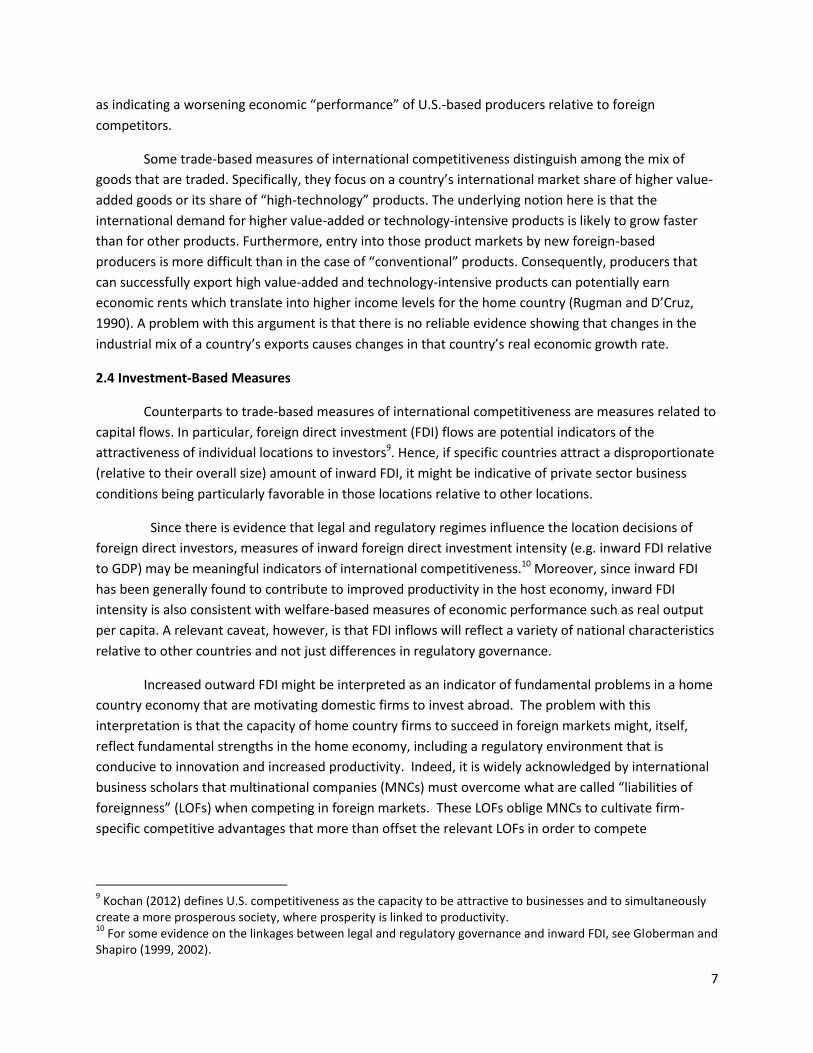
Figure 2 reports estimates of the annual growth rate of total factor productivity averaged across
13 OECD countries, and for the U.S. separately, for similar sub-periods reported in Figure 113. The
pattern for total factor productivity growth is similar to that for labor productivity growth. Namely, U.S.
productivity performance improves substantially relative to the performance of other OECD countries
over the period 1995-2005; however, unlike labor productivity, there is no evidence of a decline in the
U.S. total factor productivity growth advantage over the period 2005-201014.
13
Requisite data was unavailable for Belgium, Denmark, and Norway. 14
Average annual total factor productivity growth for the OECD was around 54% of U.S. productivity growth over the period 2000-2005 and around 45% over the period 2005-2010.
11
Figure 2: Total Multi-Factor Productivity Annual
Growth Rate (%)
0
0.5
1
1.5
2
1990-95 1995-
2000
2000-
2005
2005-
2010
MFP
OECD
U.S.
Source: Authors’ calculations from OECD Stat Extracts.
Company productivity performance for individual sectors of OECD economies provides some
perspective on whether the patterns observed at the economy-wide level are particularly influenced by
the performance of specific industries or sectors. Figure 3 provides estimates of the average annual
growth rate of labor productivity for the manufacturing sector for different sub-periods covering the
years 1996-2009. In this case, the average shown is for all OECD countries, including the United States.
The OECD reports an aggregate labor productivity growth rate series for manufacturing that includes the
United States, so it is convenient to use this aggregate measure as a comparison to the U.S. series;
however, the inclusion of the United States in the overall OECD average biases downward the reported
productivity growth rate advantage of the United States over the sample time period.

12
Figure 3: Labor Productivity Annual Growth Rate (%)
Manufacturing
0
2
4
6
8
1996-2000 2001-2005 2006-2009
LPG
OECD
U.S.
Source: Authors’ calculations from OECD Stat Extracts.
The information reported in Figure 3 shows that labor productivity for manufacturing grew
faster in the U.S. than in the aggregate of all OECD countries in each of the three time periods reported.
Furthermore, as is the case for the total economy estimates of labor productivity growth, the relative
outperformance of U.S. manufacturing productivity growth is smaller in the most recent years compared
to the 2000-2005 time period
Figure 4 reports the average annual growth rate of labor productivity for financial and business
services. Again, the reported OECD estimates are aggregations across all OECD countries, including the
United States. It should be noted that productivity estimates for service industries are especially difficult
to construct and interpret given the heterogeneity of service outputs. Notwithstanding this caveat, the
broad pattern of the data reported in Figure 4 is comparable to the previous productivity comparisons.
Specifically, the productivity growth rate for financial and business services in the U.S. exceeds the
comparable productivity growth rate aggregated across all OECD countries for each sub-period
examined commencing in the mid-1990s; however, unlike manufacturing, the U.S. outperformance in
productivity growth for services is modestly higher in the last sub-period compared to the middle sub-
period.

13
Figure 4: Labor Productivity Annual Growth Rate (%)
Financial and Business Services
0
0.5
1
1.5
2
2.5
1996-2000 2001-2005 2006-2009
LPG
OECD
U.S.
Source: Authors’ calculations from OECD stat extracts.
In summary, the productivity growth rate estimates reported in Figures 1-4 identify a consistent
pattern. Namely, U.S. productivity growth rates exceeded those of other OECD countries consistently
over the period 1996-2010, with the opposite being the case for the first half of the 1990s. At the overall
economy level and for manufacturing, the U.S. outperformance in labor productivity growth is slightly
smaller in the second half of the 2000-2010 period compared to the first half; however, this does not
appear to be the case for services. In short, productivity estimates do not show evidence of any marked
deterioration of U.S. international competitiveness, although they hint at some moderation of U.S.
outperformance in recent years.
In a later section of the report, we shall review studies that seek to explain the acceleration of
U.S. productivity growth relative to other developed countries that commenced around the mid-1990s
and continued through at least 2005. By way of preview, there is a strong argument that the
phenomenon is linked to the earlier and more comprehensive deregulation of the telecommunications
sector in the U.S. compared to other countries. This explanation highlights the potentially long-lag
between changes in regulatory policies and changes in productivity performance. It also underscores the
caveat that recent policies potentially harming relative U.S. productivity performance may not
materialize in published productivity data until future periods.

14
3.2 Other Measures
As noted earlier, innovation is linked to technological change which, in turn, is a major
contributor to productivity growth. Hence, any adverse changes in the U.S. innovation environment
relative to other countries might be an early signal of declining international competitiveness of the U.S.
economy that will ultimately be observable in a deteriorating relative U.S. productivity performance in
future time periods.
The World Economic Forum’s (WEF) Global Competitiveness Report provides league table
estimates of a wide range of factors the WEF believes underpins international competitiveness. One
broad factor is innovation which itself is a composite of specific country attributes including “capacity
for innovation”15. The league table estimates for many of the factors reported in the Global
Competitiveness Index are aggregations of subjective responses by corporate executives to surveys
carried out by The World Economic Forum. Since the responses to survey questions are scaled from one
to seven, the cardinal (absolute) values reported are less informative than the country rankings.
Table 1 reports the ranking of the U.S. relative to 17 other OECD countries with respect to the
climate for innovation16. It also reports the average value assigned by respondents to the U.S. innovation
environment on the seven-point scale used to create the league tables. As can be seen, the relative
position of the U.S. deteriorates modestly between 2008 and 2011. Specifically, while the U.S. enjoys
the highest ranking in 2005 and 2008, two countries receive a higher ranking in 2011, while one country
receives an identical ranking. The absolute value of the U.S. ranking also declines modestly in recent
years.
Table 1
Innovation
2005 2008 2011
Superior to U.S. 0 0 2
Equal to U.S. 0 0 1
Inferior to U.S. 17 17 14
U.S. Value 5.93 5.84 5.57
Source: WEF Global Competitiveness Index
15
For a description of the World Economic Forum’s Global Competitiveness Index, as well as a discussion of the methodology underlying the construction of the index, see World Economic Forum (2011). The Global Competitiveness Index is publicly available from 2005 onward. 16
These include the 16 OECD countries included in Figure One plus Austria.
15
IMD, a Switzerland-based business school produces an annual World Competitiveness Yearbook
(WCY) which also ranks the ability of nations to create and maintain an environment in which
enterprises can compete. Like the WEF, the IMD’s league tables encompass a wide range of factors
characterizing national economies, most of which do not satisfy the relatively specific economic criteria
for meaningfully measuring international competitiveness as discussed in Section 217. However, the IMD
does report survey information regarding relocation threats for manufacturing and R&D facilities.
Specifically, IMD asks respondent executives if relocation of production or R&D facilities is not a threat
to the future of their national economy. Responses are calibrated on a scale from 1 to 10 where 10
would indicate the highest “non-threat,” i.e. weakest possible threat that potential relocation poses to
an economy.
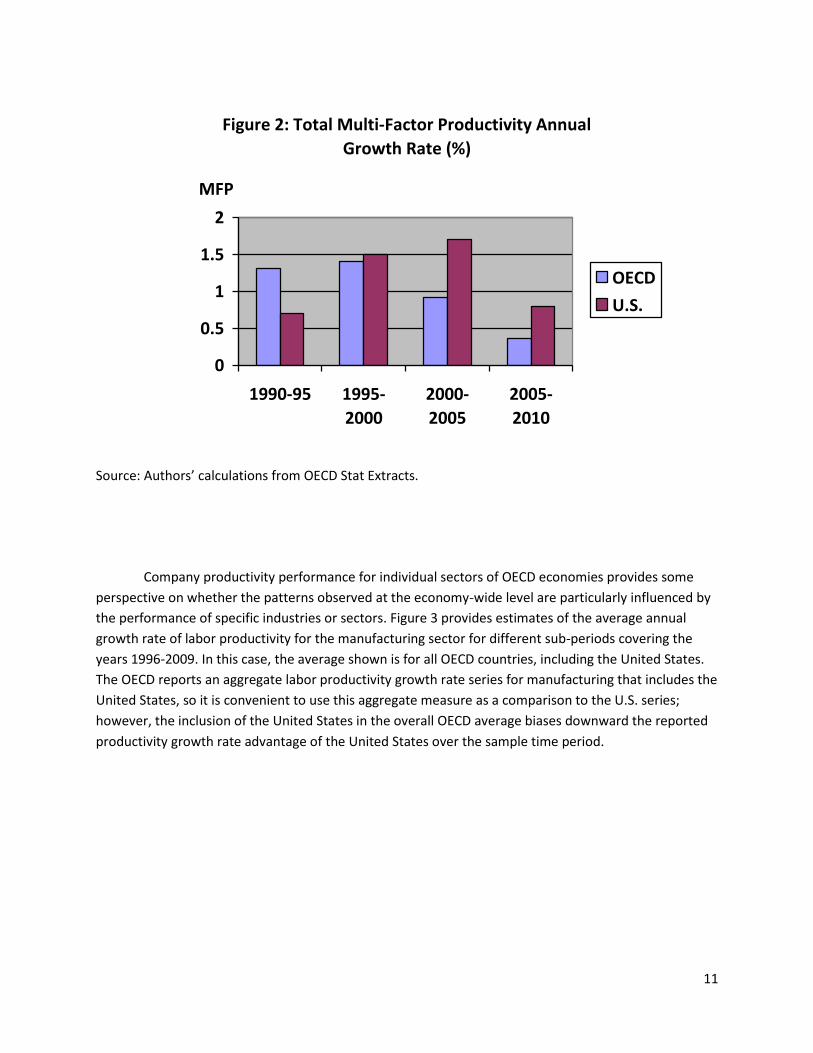
Table 2 reports IMD’s league table rankings with respect to the relocation threat of production
activities, while Table 3 reports its rankings with respect to the relocation threat for R&D activities.
Lower reported likelihoods of relocation (i.e. higher values for the responses) may be interpreted as
indicating a greater location advantage for a country. Again, since the absolute scalar value of the
responses is arbitrary, the main focus of Tables 2 and 3 should be on the U.S. ranking relative to other
countries; however, for interest, we also report the absolute values given by respondents for questions
pertaining to relocation threats facing the United States.
Table 2
Relocation Threat for Production
1995 2000 2005 2011
Superior to U.S. 2 0 5 9
Equal to U.S. 0 0 0 0
Inferior to U.S. 15 17 12 8
U.S. Value 6.18 6.21 4.37 4.08
Source: World Competitiveness Yearbook
17
The IMD league tables are based on analysis done by business scholars and on IMD’s own research. Data for some measures of competitiveness are available back to 1995. For a description of the IMD’s survey methodology, see http://www.imd.org/research/centers/wcc/research_methodology.cfm

16
Table 2 reports for selected years how the U.S. ranks relative to our 17 country OECD sample
with respect to the relocation threat for production activities. The number of countries receiving a
superior ranking to the U.S. increases from 2000 to 2011, which is consistent with a noticeable decrease
in the estimated absolute scalar value for the United States over the same period. Table 3 shows a sharp
relative increase in the relocation threat for R&D activities facing the United States commencing in 2000
and continuing through 2011. In particular, while only four countries enjoyed a lower relocation threat
rating in 2005, nine countries enjoyed a lower relocation threat rating than the United States in 2011.
Moreover, there was a marked decrease in the absolute scalar ranking for the U.S. over the period 2000-
2011, as was true for production activities.
Table 3
Relocation Threat for R&D
1995 2000 2005 2011
Superior to U.S. 2 0 4 9
Equal to U.S. 0 0 0 1
Inferior to U.S. 13 17 13 7
U.S. Value 6.18 6.21 4.37 4.08
Source: World Competitiveness Yearbook.
The information summarized in Tables 2 and 3 is reinforced by a recent Harvard Business School
survey. The survey involved nearly 10,000 Harvard Business School alumni who were asked to identify
the potential for future measures of U.S. international competitiveness to fare worse than recent
measures (Porter and Rivkin, 2012b). Specifically, survey respondents were asked whether they believed
U.S.-based firms will be more or less able to compete in the global economy in three years’ time.18
Almost three-quarters of the respondents expected U.S. competitiveness to deteriorate in the future,
although there are differences in responses across sectors. Respondents were also asked about the
likelihood of relocating business activities to other countries. Since the respondents are senior managers
located all over the world, their responses to questions about possible relocation permit a comparison
of the U.S. to other countries. A U.S.-based respondent was three times more likely to be considering
moving a business activity outside the home country compared to a non-U.S. respondent.
It is interesting to note in this regard that survey respondents considered the business
environment in the U.S. to be relatively strong as at the time of the survey; however, they expressed
18
The survey was undertaken in October 2011.

17
worry about the future of U.S. competitiveness. Hence, the Harvard Business School survey, along with
findings reported in Tables 2 and 3, provide support for a concern that the relatively favorable U.S.
productivity performance discussed above might be in jeopardy going forward. One of the factors
threatening the future performance of the U.S. economy mentioned by survey respondents is regulatory
burden and uncertainty. We shall have more to say about the linkage between the regulatory
environment and productivity performance in Section 6.
As discussed in the previous section, foreign direct investment (FDI) flows can also signal
location attractiveness. In particular, FDI inflows suggest that foreign investors view the recipient
country as a favorable site in which to carry out specific value chain activities. Since larger economies
will attract more foreign investment than smaller countries, other things constant, Table 4 reports ratios
of inward FDI flows to gross domestic product for all developed countries and for the United States
separately. The FDI data are taken from the United Nation’s World Investment Report Database19. It is
seen that for the sub-periods identified, the U.S. ratio is consistently higher than the ratio for all
developed economies. The U.S. “outperformance” is most pronounced in the 1996 to 2000 sub-period
and then converges more closely to the performance of other developed countries in the more recent
sub-periods.
Table 4
Inward Foreign Direct Investment Flow/GDP
1990-1995 1996-2000 2001-2005 2006-2011
All Developed Economies
9.3 17 24.9 29.7
U.S. 11.2 23.6 31.2 34
Source: United Nation’s World Investment Report database
19
See http://unctadstat.unctad.org/tableviewer/tableview.aspx?reportid=88.
18
3.3 Summary
The indicators of international competitiveness reviewed in this section of the report suggest
that the U.S. economy has outperformed other developed economies over the past 15 to 20 years;
however there are some suggestions that the U.S. competitive advantage has weakened in recent years,
and that managers of global companies are viewing future prospects for U.S. international
competitiveness less favorably than in the past.
4.0 COMPARING THE REGULATORY ENVIRONMENTS OF COUNTRIES
In order to evaluate evidence bearing upon the concern that government regulation in the
United States has become more burdensome to domestic businesses over time compared to other
countries, it is necessary to identify relevant measures of regulatory burden. In fact, there is no clear
consensus on how to define and quantify a country’s regulatory regime for purposes of policy analysis.
Indeed, the preferred measures will depend upon society’s priorities with respect to regulation (The
World Bank Group, 2010). For example, if a primary objective is to improve the accountability of
regulators, attributes such as the ability of regulators to be disciplined or removed from office should be
included in any description of a country’s regulatory regime. Furthermore, the relevant scope for
identifying the regulatory environment is also an unsettled issue. For example, some discussions of a
country’s regulatory environment encompass tariff and non-tariff barriers to trade, tax rates, anti-trust
legislation and the overall size of the government sector. Other discussions tend to focus more narrowly
on the activities of specific regulatory agencies such as the Environmental Protection Agency (EPA), the
Food and Drug Administration (FDA) and the Securities and Exchange Commission (SEC).
For pragmatic reasons primarily, we will limit the scope of our own comparison of national
regulatory environments to several relatively broad categories including product market regulations,
labor market regulations, and financial regulations. In fact, these tend to be the manifestations of
regulation for which league table international comparisons are most typically reported; however, in
reviewing the available literature on the productivity impacts of government regulation in Section 6, we
will also pay attention to environmental regulations, since there is some evidence on the impact of this
latter prominent manifestation of regulation.
4.1 Defining and Measuring Government Regulation
Government regulations in the United States are essentially rules issued by government
departments and agencies designed to carry out the intent of legislation enacted by Congress. The rules
guide the activities of organizations that are covered by the relevant legislation, and they reflect the
regulators’ interpretation of the relevant legislation. The normative rationale for providing regulators
with the scope to set and determine rules is that legislators cannot be expected to foresee all possible
situations to which legislation might apply. Hence, it is be impossible to write legislation that creates a
bright line separation of lawful from unlawful behavior that can be applied uniformly to all cases of
potential relevance. Obviously, the interpretive scope given to regulatory agencies invites the potential
19
for the rules they enact and implement to go beyond what might have been intended by the relevant
legislation. While regulators are accountable in principle for their rule making, there is much current
debate about whether there is sufficient accountability.
If government regulation is defined as the rules established and enforced by government
departments and agencies, it quickly becomes obvious that it is impossible, as a practical matter, to
compare government regulation in the United States to government regulation in other countries in any
comprehensive way. Government regulation is ubiquitous and profoundly complex. Furthermore, the
de facto impacts on business organizations will clearly depend upon who is actually doing the regulating.
The practical challenge to undertaking a comprehensive comparison of government regulation across
countries is underscored by the simple fact that there are dozens of federal government regulatory
departments and agencies in the United States alone that regulate the activities of organizations in
industries ranging from commodities futures trading to postal service. In addition, government
agencies charged with regulatory functions often carry out other activities that can influence the
macroeconomic performance of a country. For example, the Federal Reserve System has a mandate to
regulate banks. At the same time, it conducts monetary policy. In principle, the two responsibilities are
separable. In practice, banking regulations may affect the impact and effectiveness of monetary policy.
In short, any attempt to compare regulatory regimes across countries will inevitably involve
pragmatic compromises and will be susceptible to criticism that the measures chosen are either too
broad or too narrow. The league table sources discussed in this section report numerous potential
measures of government regulation. Most of the measures reported reflect the subjective assessments
of business people and others knowledgeable about business-government relations in a country, rather
than the actual costs incurred by companies in order to comply with regulations. Furthermore, some of
the measures reported, such as tariffs, are more meaningfully characterized as taxes rather than
regulation. Health and safety regulations, which are captured in some surveys as regulatory trade
barriers, clearly fit into the category of government regulation, although when categorized as import
barriers or regulatory trade barriers, they apply to foreign rather than domestic producers. Corruption
indices reported in some surveys might well encompass extra-legal actions by regulators, although they
arguably capture a range of behavior by politicians and bureaucrats that extends beyond traditional
regulatory activities.
The caveats mentioned above imply that one must be cautious in interpreting the information
about government regulation reported in the league table results reviewed in Section 5. The
information is largely subjective and less than comprehensive. Furthermore, the information reported
reflects our own subjective judgments about what should be considered manifestations of government
regulation, as opposed to broader measures of government policy, such as taxation, that also affect
business conditions in a country. Hence, no single reported measure of regulation should be seen as
particularly meaningful. Rather, one should assess whether the overall set of measures reported shows
any distinct trend over time for the United States relative to other countries.

20
4.2 The Potential Linkages between Regulation and International Competitiveness
As noted above, government regulations are often specific to particular industries or sectors of
an economy. Hence, it would seem that any assessment of the economic effects of government
regulation should have a narrower focus than the overall economy. To be sure, if relatively large sectors
of an economy, such as the financial sector, are impacted by regulation, the economic performance of
the national economy will also exhibit an impact reflecting a change in the performance of a relatively
large segment of that economy. Beyond this “averaging” impact, regulations specific to, or primarily
affecting, specific sectors or industries can have more widespread impacts through so-called knock-on
effects.20 For example, if the prices of key inputs to other industries are increased as a result of
regulation, it can result in a substitution away from those inputs towards less efficient input mixes on
the part of producers that use the input in question. In addition, to the extent that regulation restricts
competition in specific sectors of the economy, it can slow down innovation in those sectors, as well as
the adoption of innovations. Since there are ordinarily inter-industry technology spillovers, a slowdown
in the rate of technological change in a key sector, such as information and communications-related
industries, can have adverse impacts on the productivity growth rates of other domestic industries.
Finally, to the extent that government regulatory policy increases uncertainty broadly about future
macroeconomic conditions, it might adversely influence the investment decisions of producers who are
not directly facing a changing regulatory environment, as well as of producers directly affected by
regulatory changes.
The potential linkages discussed above ignore any potential benefits of regulation to a national
economy. In particular, they ignore broad societal impacts that may, in turn, affect a nation’s welfare.
One potential example in this regard is environmental regulation. Reductions in pollution and other
environmental amenities directly improve the quality of life of a country’s residents. Properly
accounted for, this improvement translates into increases in real income per capita equivalent to
productivity increases. Moreover, improvements in social amenities such as a clean and safe
environment can also have positive knock-on impacts for private sector productivity. For example,
environmental amenities can attract highly skilled workers whose participation in the workplace leads to
increased productivity of complementary factors of production.21 A higher quality of financial regulation
and supervision can promote the growth and efficiency of financial markets with attendant benefits for
other sectors of the economy (Levine, Loayza and Beck, 2000). Such benefits can be thought of as a
form of public good comparable to any positive direct effects of environmental regulation.
A somewhat different but related argument has been made that government regulation can
actually stimulate new and profitable domestic investment, primarily by “encouraging” regulated firms
to innovate and establish first-mover advantages in activities and industries that are likely to become
increasingly important segments of the world economy in the future. Indeed, one justification
20
For discussions of how government regulation can influence the economic performance of a country, see Crafts (2006) and Schiantarelli (2008). 21
In this regard, there has been substantial recent discussion in the business press about Chinese managers, engineers and other skilled and highly educated Chinese nationals relocating from China to the U.S., Canada and other developed countries in order to escape pollution, food and other product safety risks, and the like in China.

21
sometimes offered in support of stricter environmental regulations is that they will accelerate the
development of domestic Green Energy businesses that, in turn, will be able to compete and sell
products in global markets (Porter and Van Der Linde, 1995; Lanoie, Patry and Lajeunesse, 2001). This
position is articulated by the heads of the European Environmental Protection Agencies who conclude
from available evidence that good environmental management and regulation does not impede overall
competitiveness and economic development. On the contrary, regulation can be beneficial by creating
pressure that drives innovation and alerts business about resource inefficiencies and new opportunities
which can result in lower costs and more attractive products (Network of Heads of European
Environmental Protection Agencies, 2005, p.1)22.
Any overall evaluation of the impacts of regulation on the economic welfare of a nation would
need to consider both the social benefits and social costs of regulation. It should therefore be explicitly
noted that we do not undertake any such overall assessment in this report. Rather, we focus on the
potential linkages between regulation and measures of international competitiveness that essentially
reflect the performance of the private sector. Hence, we cannot and do not claim that evidence
identifying more onerous government regulation necessarily demonstrates that the net social costs of
government regulation are also increasing; however, such evidence would be consistent with a claim
that more onerous government regulation might be contributing to recent indications of declining U.S.
international competitiveness discussed in the previous section.
4.3 Summary
Regulation is a complex and multi-faceted phenomenon. Furthermore, there is no universally
accepted definition of regulatory quality, nor are the boundaries between regulation and other public
policies agreed upon. As such, the issue of whether government regulation in the U.S. has become more
onerous relative to government regulation elsewhere should be informed by an overall assessment of
different measures of the regulatory environment, rather than any specific measure or genre of
regulation, such as environmental regulation. Such an overall assessment is provided in the next section
of the report.
There is also theoretical controversy surrounding the impacts of regulation on the international
competitiveness of private sector businesses. Since the impact of government regulation on private
sector productivity and related performance measures is ultimately an empirical issue, we review some
empirical evidence in Section 6.
22
We review some of the available evidence on the linkage between environmental regulation and private sector productivity growth in Section 6.

22
5.0 EVIDENCE ON REGULATORY BURDEN
In this section, we identify and review evaluations of the burden of government regulation on
the U.S. private sector relative to the private sectors in other countries. For the most part, the
evaluations are subjective responses to surveys by executives and other informed people; however,
since the surveys are done by different organizations, our overall assessment of whether and how the
burden of regulation in the U.S. has changed relative to other countries reflects a broad range of expert
opinion.
5.1 Evidence from The World Economic Forum
Various measures of national regulatory environments are reported in the WEF’s Global
Competitiveness Report, which was referenced in an earlier section. Perhaps the most direct and
comprehensive measure is the survey response to a question about the overall burden of government
regulation. A summary of the survey response to this question is provided in Table 523. It can be seen
that the position of the U.S. relative to 17 other OECD countries declined modestly from 2005 to 2008
and then remained constant, which is consistent with the virtually unchanged absolute survey response
value for the United States over the sample period.
Table 5
Burden of Government Regulation
2005 2008 2011
Superior to U.S. 6 7 7
Equal to U.S. 0 0 0
Inferior to U.S. 11 10 10
U.S. Value 3.45 3.44 3.42
Source: WEF, Global Competitiveness Index
Since a source of concern about government regulation is the uncertainty it can potentially
create surrounding private sector property rights, Table 6 reports responses to a survey question about
the perceived strength of private property rights in a country. In this case, there is a substantial
deterioration in the U.S. regulatory environment. Specifically, only two OECD countries were identified
as having a superior property rights regime in 2005, whereas fourteen were superior to the U.S. in this
23
A higher reported value on the scale from one to seven identifies a less burdensome regulatory environment.

23
regard in 2011. The sharp decrease in the absolute rating given to the U.S. suggests that the
deteriorating relative U.S. performance is at least in part due to U.S.-specific developments.
Table 6
Property Rights
2005 2011
Superior to U.S. 2 14
Equal to U.S. 2 0
Inferior to U.S. 13 3
U.S. Value 6.39 5.06
Source: WEF, Global Competitiveness Index
Table 7 summarizes survey responses to a request to assess the regulation and supervision of
the securities exchanges of 17 OECD countries and the United States24. The results show a slight
deterioration in the relative U.S. performance from 2008-2011. Specifically, whereas U.S. regulation of
its security exchanges was deemed superior or equal to 8 other OECD countries in 2008, it was superior
or equal to only 5 other OECD countries in 2011. This deterioration coincides with a notable absolute
decline in the average rating for the U.S. over the same period of time which suggests that the
deteriorating relative U.S. performance is not solely the consequence of improving regulatory
effectiveness in other countries.
24
On a scale of one to seven, a higher valued response denotes more effective regulation.

24
Table 7
Regulation of Securities Exchanges
2005 2008 2011
Superior to U.S. 10 9 12
Equal to U.S. 2 3 1
Inferior to U.S. 5 5 4
U.S. Value 5.84 5.67 4.60
Source: WEF, Global Competitiveness Index
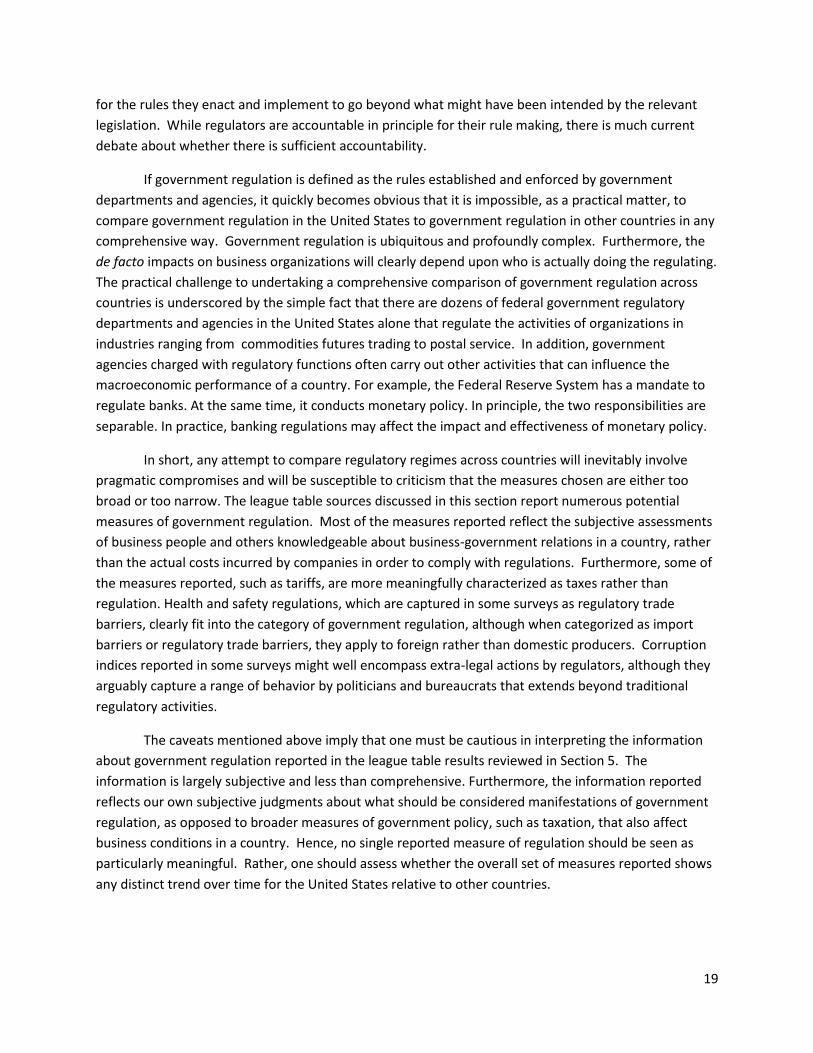
Tables 8 and 9 summarize responses to two frequently cited measures of a nation’s regulatory
environment: the estimated number of procedures to start a new business and the estimated number of
days to start a new business. While the relative position of the U.S. in terms of number of procedures to
start a new business is essentially unchanged over the period 2005-2011, there is some worsening of its
relative position with respect to the number of days to start a business.25
Table 8
Number of Procedures to Start a Business
2005 2008 2011
Superior to U.S. 9 8 9
Equal to U.S. 1 3 3
Inferior to U.S. 7 6 5
U.S. Value 6 6 6
Source: WEF, Global Competitiveness Index
25
As seen in Table 9, the U.S. value for the estimated number of days to start a business is constant over the full time period shown suggesting that improvements in this measure took place outside the U.S.
25
Table 9
Number of Days to Start a Business
2005 2008 2011
Superior to U.S. 2 3 4
Equal to U.S. 0 1 1
Inferior to U.S. 15 13 12
U.S. Value 6 6 6
Source: WEF, Global Competitiveness Index
5.2 Evidence from the Heritage Index of Economic Freedom
A broad perspective on the impacts of government regulation on the decision-making freedom
of private sector managers is provided by the Heritage Foundation’s Index of Economic Freedom.26
Tables 10-12 report assessments of business freedom, financial freedom and labor freedom,
respectively. Business freedom reflects the ability to start, operate and close a business. Higher valued
assessments reflect a lower burden of government through the regulatory process. Financial freedom is
a measure of banking efficiency, as well as independence from government control and interference in
the financial sector. Labor freedom is a composite measure of various aspects of the legal and regulatory
framework of a country’s labor market. As for business freedom, a higher reported index value reflects
greater private sector freedom in financial and labor markets, respectively.
The information reported in Tables 10-12 present a somewhat mixed picture. Specifically, while
business freedom in the U.S. increased absolutely between 2005 and 2011, the U.S. lost ground relative
to other OECD countries over that time period. Financial freedom declined absolutely in the U.S.
between 2005 and 2011, as well as relative to other OECD countries; however, labor freedom was
effectively unchanged both absolutely and relatively over the period 2005-2011.
26
For a discussion of The Heritage Index, see http://www.heritage.org/index/about.

26
Table 10
Business Freedom
1995 2000 2005 2011
Superior to U.S. 1 0 1 8
Equal to U.S. 8 5 5 0
Inferior to U.S. 8 12 12 9
U.S. Value 85 85 85 91
Source: Heritage Index of Economic Freedom
Table 11
Financial Freedom
1995 2000 2005 2011
Superior to U.S. 5 4 0 9
Equal to U.S. 7 7 6 4
Inferior to U.S. 5 6 11 4
U.S. Value 70 70 90 70
Source: Heritage Index of Economic Freedom

27
Table 12
Labor Freedom
2005 2008 2011
Superior to U.S. 1 2 0
Equal to U.S. 0 0 0
Inferior to U.S. 16 15 17
U.S. Value 95 95 96
Source: Heritage Index of Economic Freedom
5.3 Evidence from The World Competitiveness Yearbook
The previously discussed World Competitiveness Yearbook also provides assessments of the
regulatory environments of the U.S. and the counterpart sample of 17 OECD countries. Table 13
summarizes survey opinion responses to the statement: bureaucracy does not hinder business activity.
Tables 14 and 15 summarize responses to similar statements for labor market and environmental
regulations. Higher reported values denote less hindrance.
Table 13
Bureaucracy
1995 2000 2005 2010
Superior to U.S. 8 6 9 8
Equal to U.S. 0 1 1 0
Inferior to U.S. 9 10 7 9
U.S. Value 4.37 4.66 3.37 4.26
Source: World Competitiveness Yearbook

28
Table 14
Labor Regulations
1995 2000 2005 2011
Superior to U.S. 3 1 1 1
Equal to U.S. 0 0 0 0
Inferior to U.S. 14 16 16 16
U.S. Value 6.62 6.86 6.55 6.48
Source: World Competitiveness Yearbook
Table 15
Environmental Regulations
1995 2000 2005 2011
Superior to U.S. 16 13 7 9
Equal to U.S. 1 0 1 1
Inferior to U.S. 0 4 9 7
U.S. Value 5.02 5.83 5.98 6.42
Source: World Competitiveness Yearbook
For bureaucratic hindrance, both the absolute and relative measures of the metric for the
United States are essentially unchanged comparing 1995 to 2005. There is a slight improvement in both
absolute and relative measures when comparing 2005 to 2010. The labor market regulatory
environment improved modestly comparing 1995 to 2000, although it is essentially unchanged from
2005 to 2011. On the other hand, there is a notable improvement in the impact of environmental
regulation on the business sector comparing 1995 to 2005 with a slight worsening of the relative U.S.
ranking from 2005-2011.

29
Finally, Table 16 reports assessments of whether the legal and regulatory framework
encourages the competitiveness of enterprises on an overall basis. By this measure, the overall
regulatory environment improved substantially in the U.S. relative to other OECD countries from 2000-
2005; however, it deteriorated, if anything, in the post-2005 period, although the absolute U.S. value
increases somewhat post-2005.
Table 16
Legal/Regulatory Framework
2000 2005 2011
Superior to U.S. 14 5 6
Equal to U.S. 0 0 2
Inferior to U.S. 3 12 9
U.S. Value 5.62 5.54 6.02
Source: World Competitiveness Yearbook
5.4 Evidence from The World Bank
Table 17 reports a well-known index of overall regulatory quality created and maintained by The
World Bank27. The index is created from responses to surveys conducted by The World Bank covering a
wide range of experts knowledgeable about business conditions in specific countries. The index captures
an integrated perception of the ability of a national government to formulate and implement sound
policies and regulations that permit and promote private sector development. The responses
summarized in Table 17 provide perhaps the most dramatic indication of a deterioration of regulatory
quality in the United States from 2005 to 2010. Specifically, while only 4 OECD countries scored higher
on The World Bank Index in 2005, fully 10 scored higher in 2010.
27
For a discussion of the indicators reported by The World Bank, see Kaufmann, Kraay and Mastruzzi (2008).

30
Table 17
Regulatory Quality
1996 2000 2005 2010
Superior to U.S. 4 3 4 10
Equal to U.S. 1 2 3 0
Inferior to U.S. 12 12 10 7
U.S. Value 1.63 1.69 1.61 1.42
Source: World Bank
5.5 Impact of Regulation on Competition
As shall be discussed in Section 6, the adverse impacts of regulation on private sector
productivity are prominently linked to reductions in competition that are attributable to regulation.
Hence, evidence on whether and how government regulation is affecting the intensity of competition in
domestic markets is potentially quite relevant to an assessment of the burden of regulation on a
national economy.
In this regard, Table 18 reports evaluations by the WEF of the intensity of competition in
domestic markets for the U.S. and the 17 other OECD countries. Table 18 strongly suggests a
deterioration of the U.S. regulatory environment in recent years. Specifically, it shows a substantial
number of countries characterized by more competitive domestic environments than the U.S. in 2011,
whereas there were none with more competitive environments in 2005.

31
Table 18
Intensity of Competition
2005 2011
Superior to U.S. 0 9
Equal to U.S. 0 2
Inferior to U.S. 17 6
U.S. Value 6.28 5.61
Source: WEF, Global Competitiveness Index
5.6 Overall Summary
While it is not uniformly the case, the preponderance of evidence reviewed in this section
suggests that the burden of regulation on the private sector increased in the U.S. relative to other OECD
countries, at least since 2005.
6.0 THE EMPIRICAL RELATIONSHIP BETWEEN REGULATION AND PRODUCTIVITY
The issue addressed in this section of the report is whether an increasingly onerous burden of
regulation in the United States relative to other countries can be expected to reduce the international
competitiveness of the U.S. economy. As noted earlier, it is beyond the scope of our report to present
new statistical evidence on this issue; however, there is an extensive empirical literature examining the
relationship between government regulation and private sector productivity. This literature provides
substantial insight into the nature and strength of the impacts of government regulation on productivity.
In this section, we review and assess this evidence.
To anticipate our assessment, the available evidence links government regulation to worsening
productivity performance. Therefore, the deteriorating regulatory environment in the U.S. post-2005
that was identified in the preceding section should be a cause for concern to policy makers, since it may
well be a contributor to recent decreases in U.S. economic performance relative to other countries, as
well as a harbinger of future international competitiveness problems for U.S. businesses.
6.1 Overview of the Evidence from Other Studies
Several surveys of the literature provide an overall assessment of the impacts of government
regulation on national economic performance. These surveys tend to conclude that “over-regulation”
contributes to lower productivity growth. Moreover, specific manifestations of regulation have been

32
especially implicated, most particularly regulations that inhibit entry into product markets (Crafts, 2006).
Differences in the stringency of government regulations in product markets, particularly the tight
regulation of Information Communications Technology (ICT)-using service sectors, is a major explanation
of diverging productivity performances of OECD countries over the period covering the early 1990s
through at least the mid-2000s (Arnold, Nicoletti and Scarpetta, 2008). One of the key ways in which
inappropriate service sector regulations affected productivity growth was by hindering the movement of
resources towards the most dynamic and efficient firms that were more likely than other firms to be
adopters of new ICT technology.
Colecchia and Schreyer (2001) assert that widespread diffusion of ICT, as well as the
development of the ICT producing industry, are closely linked to a tradition of open and competitive
markets for telecommunications services, as well as to the liberalization of other product markets.
Specifically, Colecchia and Schreyer (2001) report the results of an analysis of 10 OECD countries which
shows that productivity growth differentials between the United States and European countries over the
sample time period are at least partly explained by a larger and more productive ICT-producing sector in
the United States. Since TFP grew relatively rapidly in sectors such as semi-conductors and computers,
the U.S. economy benefited disproportionately, since its semi-conductor and computer sectors account
for a relatively large share of the U.S. economy compared to other economies.28 While rapid productivity
growth in ICT-producing industries partly reflects underlying developments in science and technology,
Colecchia and Schreyer (2001) argue that the widespread diffusion of ICT, as well as the development of
ICT-producing sectors, are closely linked to a tradition of open and competitive markets for
telecommunications services in the U.S. Similarly, Arnold, Nicoletti and Scarpetta (2008) conclude that
tight regulation of services, especially in European Union countries, slowed down growth in ICT-using
sectors.
Tschoegl (1996) also argues that the legal and regulatory system primarily impacts the ability of
domestic firms to compete internationally by conditioning the ability of domestic firms to innovate. He
creates time series measures of competitiveness from rankings in Euromoney’s annual survey of foreign
exchange market competitiveness from 1976 through 1995. Tschoegl finds that U.S. and U.K. banks
achieved higher rankings than banks from Germany and Japan. He concludes that German and Japanese
banks existed in a highly regulated and less competitive environment which discouraged innovation and
market responsiveness.
Galindo, Schianterelli and Weiss (2002), like Tschoegl, conclude that financial liberalization
promotes the development of financial markets by promoting competition. Conversely, Delis, Molyneux
and Pasiouras (2009) argue that restrictions on banks’ activities related to their involvement in
securities, insurance, real estate and ownership of non-financial firms had a positive impact on the
productivity of banks in 22 countries over the period 1999-2006. Notwithstanding this latter study,
there is generally broad support for the conclusion that regulatory reforms that promote competition in
28
Jorgenson (2004) also discusses how ITC-producing industries were a major source of much of the acceleration in TFP growth in the U.S. after 1995.

33
product markets boost the productivity performance of countries.29 Several other statistical studies
supporting this conclusion are summarized in Figure 5. Specifically, for broad sectors of national
economies and for different measures of productivity performance, the studies find that government
regulation has a negative impact on productivity levels and growth rates.
Figure 5
Studies Examining the Link between Product Market Regulation and Productivity Performance
Author(s) Sector Country/Region Measure of Performance
Impact of Regulations
Koedijk & Kremers (1996)
Business EU Countries (1981-1993)
TFP growth Negative
Nicoletti & Scarpetta (2003)
Mfg & service OECD countries (19984-1998)
TFP growth Negative
Conway, de Rosa, Nicoletti & Steiner
(2006)
Economy & services
OECD countries (1978-2003)
Labor productivity Negative
The balance of evidence also suggests that labor market regulations discourage productivity
growth. Figure 6 summarizes the results of a number of econometric studies that examine the empirical
linkage between labor market regulation and productivity levels and growth across broad sectors of
national economies. Most report a negative relationship, although the findings are somewhat nuanced.
For example, Bassanini and Venn (2007) identify specific labor market regulations that have positive
impacts on industrial productivity, whereas others have negative impacts on productivity. Regulatory
restrictions on the employers’ freedom to lay off employees or terminate employment seem to have
particularly adverse consequences for productivity performance.
29
See Colecchia and Schreyer (2001) and Department for Business Enterprise and Regulatory Reform (2008) for reviews supporting this conclusion.

34
Figure 6
Studies Examining the Link between Labor Market Regulation and Productivity Performance
Author(s) Sector Country/Region Measure of
Performance Impact of
Regulations
Koedijk & Kremers (1996)
Business
EU (1981-1993)
TFP growth Negative
Gust and Marquez (2002)
Business sector Industrial
countries (1992-1999)
Labor productivity growth
Negative
Bassanini, Nunziata & Venn
(2008) All industries
OECD
(1982-2003) TFP Negative
Hall, Propper & Van Reenan
(2008) Hospitals
England
(1995/6-2002/3) Output/worker Negative
Autor, Kerr & Kugler (2007)
Mfg U.S. (1970-1999) TFP Negative
Storm & Naastepad (2009)
All
OECD
(1984-1994; 1994-2004)
Growth in output/hour
Positive
Bassanini & Venn (2007)
Various OECD
(1979-2003)
Growth & levels of TFP & labor productivity
Mixed
The evidence is more ambivalent with respect to the relationship between environmental
regulations and productivity performance. Echeverri-Carroll and Ayola (2008) interpret the available
evidence as offering little support for the hypothesis that environmental regulations have had a large
net adverse impact on competitiveness; however, they offer the caveat that this conclusion could well
change in the future if environmental regulations become even more stringent. While they
acknowledge that the cost for U.S. businesses to comply with federal government regulations is sizable
and has been growing rapidly, they assert that differences in environmental compliance costs have not
yet had a consistent and serious effect on industrial competitiveness. Their broad conclusion is
supported by several other surveys of empirical research on the impacts of environmental regulation
(Department for Business Enterprise and Regulatory Reform, 2008).

35
Figure 7 summarizes a number of econometric studies of the relationship between
environmental regulation and productivity for overall manufacturing, as well as for specific
manufacturing sectors. The summary affirms that the available evidence is mixed with respect to the
impact of environmental regulations on productivity performance. As with other forms of regulation,
the impact of environmental regulations on private sector productivity depends importantly on the
precise nature of the regulations. In particular, regulations that significantly restrict competition tend to
harm productivity performance.
Figure 7 Studies Examining the Link between
Environmental Regulation and Productivity Performance
Author(s) Sector Country/Region Measure of Productivity
Impact of Regulations
Lanoie, Patry & Lajeunesse
(2001) Mfg
Quebec
(1985-1994) TFP growth Mixed
Berman & Bui (2001)
Oil refining
Los Angeles
(1979-1992) TFP growth Positive
Greenstone, List & Syverson
(2011)
Mfg
U.S.
(1972-2000) TFP level Negative
Gray & Shadbegian
(1993)
Paper, oil & steel
(1979-85)
U.S.
(1979-1985)
TFP growth & levels
Negative (compliance
costs)
In summary, empirical studies tend to confirm that government regulations of product and labor
markets adversely affect both the level and growth rate of private sector productivity. Since
productivity is arguably the most meaningful indicator of international competitiveness, the available
evidence lends support for concerns that recent increasingly burdensome government regulation in the
United States will ultimately harm the international competitiveness of the U.S. economy. However,
this interpretation of the empirical literature must be tempered by several observations. One is that a
negative linkage between regulation and productivity performance is not consistently observed for all
forms of regulation. Indeed, some specific regulations have been found to contribute to improved
economic performance. For example, regulations that give creditors priority in receiving their claims on
corporations encourage publication of more comprehensive and accurate financial statements which, in

36
turn, contributes to better functioning financial systems (Levine, Loayza and Beck, 2000). A second
caveat is that productivity performance is influenced by myriad factors that are not typically identified
as government regulation. For example, marginal tax rates affect incentives to invest, and capital
investment is an important influence on labor productivity. Third, the manner in which regulations are
implemented and enforced can affect productivity performance, and this characteristic of regulation is
difficult to measure.
6.2 Some Additional Evidence
To the extent that the impacts of a more burdensome regulatory environment take time to
actually materialize in reduced international competiveness, more “forward-looking” measures of
competitiveness should be empirically linked to indicators of the regulatory environment. One potential
forward-looking measure is the threat of companies relocating value chain activities abroad. We
correlated various regulatory measures from The World Competitiveness Yearbook with the previously
discussed indices of threats to relocate production and R&D. Specifically, for overlapping or
approximately overlapping years, we correlated individual measures of U.S. regulatory quality with the
reported likelihood of relocating production, on the one hand, and R&D, on the other hand, outside the
United States. The relocation threat measures are the same as were reported in Tables 2 and 3 as “U.S.
values.” In the case of most of the regulatory measures specified, there was a positive and statistically
significant correlation between a more favorable regulatory environment and a reduced threat to
relocate production across a sample of OECD countries.30 The correlation coefficients between a more
favorable regulatory environment and a lower threat to relocate R&D were also generally positive and
statistically significant, although weaker than in the case of relocating production. In short, a less
favorable U.S. regulatory environment has been linked to increased relocation threats in the past.
Hence, the recent deterioration of the U.S. regulatory environment can be expected to motivate
companies to consider additional relocation of activities abroad in the future.
6.3 Summary
Since regulations vary in their scope and nature of enforcement, it is not surprising that
differences can be identified across studies regarding the impact of regulation on private sector
productivity. Nevertheless, the available statistical evidence, on balance, tends to show that regulations,
particularly in product and labor markets, harm productivity performance. This, in turn, heightens
concerns about the recent increasing burden of regulation on the U.S. private sector that was identified
in Section 5. Of particular concern are proliferating regulations that increase barriers to new firm entry.
Some evidence was discussed in Section 5 identifying a decrease in competition in domestic markets in
the United States. While the decrease cannot be directly linked to increased regulation, it is certainly
plausible that a link exists. Moreover, even if the identified decrease in competition reflects factors
other than more onerous regulation, a proliferation of additional regulations that attenuate competition
even further would be a very unwelcome development for the U.S. economy.
30
Details of the correlation analysis are available from the authors upon request.

37
The previously cited survey reported by Porter and Rivkin (2012b) identifies increasingly
inefficient regulation as an important factor encouraging companies to consider relocating outside the
United States. When respondents were asked the leading reasons for moving existing activities out of
the United States, almost one-quarter cited fewer or less expensive regulations in other countries. They
also identified regulatory uncertainty and regulatory burden as prominent barriers to investing and
creating jobs in the United States. Our own correlation analysis discussed above identifies an empirical
link between regulatory burden and threats to relocate value chain activities which supports the survey
findings reported by Porter and Rivkin (2012b).
In sum, while there are multiple factors that can potentially encourage an improved
performance of the U.S. economy, reducing the burdens and uncertainties of government regulation is
prominent on the list. The evidence suggests that government regulation has raised strong concerns
recently about the location attractiveness of the United States, and a failure to make regulation more
conducive to efficient private-sector production will arguably soon be manifested in deteriorating
“objective” measures of performance, including productivity.
7.0 SUMMARY, CONCLUSIONS AND FUTURE RESEARCH
This report summarizes and assesses evidence relating government regulation in the United
States to the international competitiveness of the U.S. economy. Specifically, it identifies economically
relevant measures of international competitiveness and then presents and assesses evidence on those
measures. Similarly, it discusses alternative measures of the burden of government regulation and
presents evidence on how government regulation in the United States has changed over time relative to
other OECD countries.
We find some indications of deteriorating relative U.S. economic performance. In particular, the
relative attractiveness of the United States as an investment location appears to be weakening. In a
similar manner, there are increasing threats of production being relocated outside the United States.
While the United States continues to enjoy a productivity advantage relative to other OECD countries,
the advantage seems to have weakened in recent years. In short, there are grounds for concern that the
international competitiveness of the U.S. economy is deteriorating.
The available evidence also indicates that government regulation in the United States has
become more onerous in recent years compared to other countries. A particular concern is that more
onerous government regulation is contributing to reduced competition in U.S. domestic markets
compared to competition in other countries. Our review of the literature identifies a strong positive
linkage between competition, innovation and productivity growth. This linkage supports a conclusion
that more onerous product and labor market regulations in the United States will adversely affect
productivity performance and other aspects of U.S. international competitiveness.
Future research might look more closely at the statistical relationship between different
manifestations of government regulation and specific measures of international competitiveness. The

38
literature suggests that alternative regulations may have different impacts on the private sector’s
economic performance. The various measures of government regulation reported by league table
sources constitute a source of data that might allow identification of the impacts of specific regulations
on the international competitiveness of countries. For example, models might be specified and
estimated across countries and over time in which the dependent variable is productivity growth or
some other measure of international competitiveness, and the independent variables include one or
another measure of government regulation. League tables provide policymakers with information on
the nature of government regulation in their country relative to other countries. It would presumably be
useful for policymakers to have some insight into which specific manifestations of government
regulation are particularly important contributors to future changes in international competitiveness.
The type of empirical model outlined here might help make the widely available league table
information concerning national regulatory regimes more useful to policymakers seeking to reduce the
adverse impacts of government regulation on the private sector.
39
References
Arnold, Jens, Guiseppe Nicoletti and Stefano Scarpetta (2008), “Regulation, Allocation Efficiency and
Productivity in OECD Countries”, OECD Department Working Papers, No. 616, http://www.oecd-
library.org/economics/regulation-allocative-efficiency-and-productivity-in-oecd-
countries_241447806226.
Asheim, B. and M. Gertler (2006), “The Geography of Innovation: Regional Innovation Systems” in Jan
Fagerberg, David Mowery and Richard Nelson, eds., The Oxford Handbook of Innovation, Oxford: Oxford
University Press, pp. 291-317.
Autor, David, W.R. Kerr and A.D. Kugler (2007), “Do Employment Protections Reduce Productivity?
Evidence from U.S. States,” NBER Working Papers, No. 14348,
http://www.nber.org/papers/w12860.pdf?new_window=1
Baily, Martin and Matthew Slaughter (2008), “Strengthening U.S. Competitiveness in the Global
Economy,” Washington, D.C.: Private Equity Council.
Bassanini, Andrea and Danielle Venn (2007), “Assessing the Impact of Labor Market Policies on
Productivity: A Difference-in-Differences Approach,” OECD Social, Employment and Migration Working
Papers 54, http://www.oecd.org/dataoecd/27/20/38797288.pdf
Bassanini, Andrea, Luca Nunziata and Danielle Venn (2008), “Job Protection Legislation and Productivity
Growth in OECD Countries”, IZA Discussion Paper No. 3555, http://ftp.iza.org/dp3555.pdf.
Berman, Eli and Linda Bui (2001), “Environmental Regulation and Productivity: Evidence from Oil
Refineries,” The Review of Economics and Statistics, 83(3), pp. 498-510.
Carlson, John and Mark Schweitzer (1998), “Productivity Measures and the New Economy,” Economic
Commentary, Federal Reserve Bank of Cleveland.
Cochrane, John (2011), “The Fed’s Mission Impossible”, The Wall Street Journal, December 29,
http://online.wsj.com/article/SB10001424052970203391104577120422546692282.html
Colecchia, Alessandra and Paul Schreyer (2001), “ICT Investment and Economic Growth in the 1990s: Is
the United States a Unique Case? A Comparative Study of Nine OECD Countries”, STI Working Paper
2001/7, Paris: OECD.
Conway, Paul, Donato De Rosa, Giuseppe Nicoletti and Faye Steiner (2006), “Regulation, Competition
and Productivity Convergence,” OECD Economics Working Papers, No. 509,
http://www.kdi.re.kr/upload/7669/Nicolett-0502.pdf
Crafts, Nicholas (2006), “Regulation and Productivity Performance”, Oxford Review of Economic Policy,
22 (2), pp. 186-202.

40
Delis, Manthos, Philip Molyneux and Fatios Pasiouras (2009), “Regulations and Productivity Growth in
Banking”, MPRA Paper, No. 13891, http://mpra.ub.uni-muenchen.de/13891/1/MPRA_paper_13891.pdf
Department for Business Enterprise and Regulatory Reform (2008), “Impact of Regulation on
Productivity”, BERR Occasional Paper No. 3.
Durand, Martine, Jacques Simon and Colin Webb (1992), “OECD’s Indicators of International Trade and
Competitiveness”, OECD Economics Department, Working Papers No. 120,
http://dx.doi.org/10.1787/708306180711.
Echeverri-Carroll and Sofia Ayola (2008), “Regulation and Competitiveness of U.S. Businesses”,
University of Texas at Austin, LBJ School of Public Affairs.
Feulner, Edwin (2012), “A Step Backward for Economic Freedom in 2012”, The Wall Street Journal,
January 12, A15,
http://online.wsj.com/article/SB10001424052970204257504577151241847335540.html
Galindo, A., F. Schianterelli and A. Weiss (2002), “Does Financial Liberalization Improve the Allocation of
Investment? Micro Evidence from Developing Countries,” Boston College Working Papers in Economics,
No. 503.
Globerman, S. (2012), “The Implications of Outward Direct Investment for the Canadian Economy”,
Ottawa: The Conference Board of Canada.
Globerman, S. and D. Shapiro (1999), “The Impact of Government Policies on Foreign Direct Investment:
The Canadian Experience”, Journal of International Business Studies, 30 (3), pp. 513-532.
Globerman, S. and D. Shapiro (2002), “Global Foreign Direct Investment Flows: The Role of Governance
Infrastructure”, World Development, 30 (11), pp. 1899-1919.
Globerman, S. and V. Chen (2010), “Best Policy Practices for Promoting Inward and Outward Foreign
Direct Investment,” Ottawa: The Conference Board of Canada.
Gray, Wayne and Ronald Shadbegian (1993), “Environmental Regulation and Manufacturing Productivity
at the Plant Level,” NBER Working Paper No. 4321,
http://www.nber.org/papers/w4321.pdf?new_window=1
Greenstone, Michael, John List and Chad Syverson (2011), “The Effects of Environmental Regulation on
the Competitiveness of U.S. Manufacturing,” U.S. Census Bureau Discussion Paper,
ftp://ftp2.census.gov/ces/wp/2011/CES-WP-11-03.pdf
Gust, Christopher and Jaime Marquez (2002), “International Comparisons of Productivity Growth: The
Role of Information Technology and Regulatory Practices,” Board of Governors of the Federal Reserve
System, International Finance Discussion Papers, No. 727,
http://www.federalreserve.gov/pubs/ifdp/2002/727/ifdp727.pdf

41
Hall, Emma, Carol Propper and John Van Reenen (2008), “Can Pay Regulation Kill? Panel Data Evidence
on the Effect of Labor Markets on Hospital Performance,” CEP Discussion Paper No. 843,
http://cep.lse.ac.uk/pubs/download/dp0843.pdf
Jorgenson, Dale (2004), “Introduction: Economic Growth in Canada and the United States in the
Information Age,” in D.W. Jorgenson, ed., Economic Growth in Canada and the United States in the
Information Age, Ottawa: Industry Canada, pp. 1-5.
Kaufmann, D., A. Kraay and M. Mastruzzi (2008), “Governance Matters: Governance Indicators for 1996-
2004,” World Bank Policy Research Working Paper, No. 3630.
Kochan, Thomas (2012), “A Jobs Compact for America’s Future,” Harvard Business Review,
http://hbr.org/2012/03/a-jobs-compact-for-americas-future/ar/1.
Koedijk, K. and J. Kremers (1996), “Market Opening, Regulation and Growth in Europe,” Economic Policy,
111(23), pp. 443-467.
Lanoie, Paul, Michel Patry and Richard Lajeunesse (2001), “Environmental Regulation and Productivity:
New Findings on the Porter Analysis,” CIRANO, http://www.cirano.qc.ca/pdf/publication/2001s-53.pdf
Levine, R., N. Loayza and T. Beck (2000), “Financial Intermediation and Growth: Causality and Causes,”
Journal of Monetary Economics, 46(1), pp. 31-77.
Markusen, James (1992), Productivity, Competitiveness, Trade Performance and Real Income: The Nexus
Among Four Concepts, Ottawa: Supply and Services Canada.
McFetridge, Donald (1995), “Competitiveness: Concepts and Measures”, Industry Canada, Occasional
Paper Number 5.
Network of Heads of European Environment Protection Agencies (2005), “The Contribution of Good
Environmental Regulation to Competitiveness”, Mimeo
Nicoletti, Giuseppe and Stefano Scarpetta (2003), “Regulation, Productivity and Growth: OECD
Evidence”, Paris: OECD Economics Department.
Porter, Michael (1990), The Competitive Advantage of Nations, New York: The Free Press.
Porter, Michael and Claas Van Der Linde (1995), “Toward a New Conception of the Environment-
Competitiveness Relationship,” The Journal of Economic Perspectives, 9(4), pp. 97-118.
Porter, Michael and Jan Rivkin (2012a), “The Looming Challenge to U.S. Competitiveness,” Harvard
Business Review, March, pp. 54-62.
Porter, Michael and Jan Rivkin (2012b), “Prosperity at Risk,” Harvard Business School, mimeo,
http://www.hbs.edu/competitiveness/pdf/hbscompsurvey.pdf

42
Rugman, Alan and Joseph D’Cruz (1990), “New Visions for Canadian Business: Strategies for Competing
in the Global Economy,” Toronto: Diane Publishing Company.
Schiantarelli, Fabio (2008), “Product Market Regulation and Macroeconomic Performance: A Review of
Cross-Country Evidence”, Boston College, mimeo, http://fmwww.bc.edu/ec-p/wp623.pdp
Storm, S. and C.W.M. Naastepad (2009), “Labor Market Regulation and Productivity Growth: Evidence
for Twenty OECD Countries (1984-2004),” Industrial Relations, 48(4), pp. 629-654.
Swagel, Phillip (2012), “International Competitiveness”, American Enterprise Institute and the University
of Maryland, mimeo.
Tschoegl, Adrian (1996), “Country and Firm Sources of International Competitiveness: The Case of the
Foreign Exchange Market”, Wharton Financial Institutions Center.
The World Bank Group (2010), “Better Regulation for Growth,” Washington, D.C.: The World Bank
Group.
World Economic Forum (2011), “The Global Competitiveness Report 2011-2012,” Geneva, Switzerland:
World Economic Forum.